 Andrew M. Brooks1
 V. S. Chandrasekhar Pammi2
 Charles Noussair3
 C. Monica Capra1 Jan B. Engelmann4
 Gregory S. Berns1*
- 1 Department of Economics, Emory University, Atlanta, GA, USA
- 2 Centre of Behavioral and Cognitive Sciences, University of Allahabad, Allahabad, India
- 3 Department of Economics, Tilburg University, Tilburg, Netherlands
- 4 Institute for Empirical Research in Economics, University of Zurich, Zurich, Switzerland
The majority of decision-related research has focused on how the brain computes decisions over outcomes that are positive in expectation. However, much less is known about how the brain integrates information when all possible outcomes in a decision are negative. To study decision-making over negative outcomes, we used fMRI along with a task in which participants had to accept or reject 50/50 lotteries that could result in more or fewer electric shocks compared to a reference amount. We hypothesized that behaviorally, participants would treat fewer shocks from the reference amount as a gain, and more shocks from the reference amount as a loss. Furthermore, we hypothesized that this would be reflected by a greater BOLD response to the prospect of fewer shocks in regions typically associated with gain, including the ventral striatum and orbitofrontal cortex. The behavioral data suggest that participants in our study viewed all outcomes as losses, despite our attempt to induce a status quo. We find that the ventral striatum showed an increase in BOLD response to better potential gambles (i.e., fewer expected shocks). This lends evidence to the idea that the ventral striatum is not solely responsible for reward processing but that it might also signal the relative value of an expected outcome or action, regardless of whether the outcome is entirely appetitive or aversive. We also find a greater response to worse gambles in regions previously associated with aversive valuation, suggesting an opposing but simultaneous valuation signal to that conveyed by the striatum.
Introduction
Many real world decisions involve the possibility of both good and bad outcomes, but sometimes the choices are between bad and worse. Consider, for example, an individual who purchases a cell phone plan only to realize that the reception with that carrier is terrible. The individual is then faced with the decision to either stay with the carrier and suffer bad reception, or pay an exorbitant cancellation fee. In either case, the outcome is bad. The recent advent of neuroeconomics has brought new methods of analysis to the study of human decision-making, but the vast majority of these studies have focused on decisions in which all possible outcomes are non-negative (Knutson et al., 2001; McClure et al., 2004; Padoa-Schioppa and Assad, 2006; Preuschoff et al., 2006; Tobler et al., 2007). But because relatively few studies have examined decisions made entirely in the domain of losses, it is not clear how the brain gages relative value when all of the outcomes are bad. One hypothesis regarding valuation in the brain suggests that the utility of positive outcomes is evaluated by a separate neural system from that of negative outcomes. In its simplest form, the dual-systems hypothesis associates the ventral striatum and the orbitofrontal cortex (OFC) exclusively to the evaluation of gains (Mirenowicz and Schultz, 1996), and the amygdala and insula exclusively to the evaluation of losses (Yacubian et al., 2006).
There is some evidence that the striatum and other orbitostriatal structures are involved in both gain and loss processing (Delgado et al., 2003; Seymour et al., 2007; Tom et al., 2007). However, most of these studies pitted a potential gain against a loss, used a medium that is generally rewarding (money), or focused solely on the anticipation of the gain or loss, and thus it is not clear that when all outcomes are negative, whether the striatal system would still be engaged or whether a separate system would perform the decision-making processing. Some research suggests that anticipation and experience of aversive stimuli activate the striatum (LaBar et al., 1998; Becerra et al., 2001; Jensen et al., 2003; Seymour et al., 2004). Indeed, there are populations of dopaminergic neurons that respond to aversive stimuli (Coizet et al., 2006; Matsumoto and Hikosaka, 2009). Thus, we hypothesized that the striatal system also processes the value of non-rewarding stimuli during the decision-making process itself, as opposed to solely the anticipation of the stimuli. For painful outcomes (electric shocks), we predicted that fewer electric shocks from a reference amount would be viewed as a “gain” and more electric shocks as a “loss.” Furthermore, we predicted that the ventral striatum would be involved in processing “gains” (fewer electric shocks) even though the overall outcome medium was always unpleasant.
To test these hypotheses, we used fMRI along with a gambling task involving electric shocks. In a manner similar to that in the task used by Tom et al. (2007), participants were asked to accept or reject a 50/50 gamble of “more” or “fewer” electric shocks compared to a reference amount that they received at the beginning of each trial. If participants rejected the gamble, they received the reference amount of shocks. If they accepted the gamble, they either received “more” or “fewer” shocks from the reference amount. Using this task, we tested whether participants’ choice behavior was consistent with an adaptation of their status quo to the reference level of shocks. Our analysis of the neuroimaging data focused on the period in which participants decided whether to accept or reject these lotteries. This allowed us to identify regions involved specifically in decision-making as opposed to the anticipation of the outcomes.
Materials and Methods
Participants
Thirty-six participants (18 female, 18 male; 18–45 years) were recruited from the Emory University campus. All participants were right-handed, reported no psychiatric or neurological disorders, or other characteristics that might preclude them from safely undergoing fMRI, and provided informed consent to experimental procedures approved by the Emory University Institutional Review Board. Participants received a base pay of $40.
Experimental Procedures
A Biopac STM100C stimulator module with a STMISOC isolation unit (Biopac Systems, Inc., CA, USA) was used to deliver electric shocks cutaneously to the dorsum of the left foot through shielded, gold electrodes placed 2–4 cm apart. The STMISOC unit controlled current output to the electrodes, with each pulse lasting 15 ms. The stimulator module was connected via a serial-interface to a laptop which controlled the timing and delivery of the shocks.
Prior to scanning, shock intensity was calibrated by finding each participant’s “maximum shock intensity”, Imax. Participants were told that their maximum shock intensity would be set to the highest intensity that they could bear. For the calibration procedure, each trial consisted of 18 shocks over 340 ms (the maximum number per trial in the subsequent experiment). The current was slowly increased until participants notified the experimenter that they couldn’t bear it anymore, and this current level was set as their Imax. The current level for all shocks throughout the experiment was set at 90% of Imax.
To gain familiarity with the different numbers of shock outcomes, participants were passively exposed to all possible outcomes. An attempt to induce a status quo of 10 shocks was made by subjecting participants to the 10 shocks at the beginning of each trial. On each outcome, the number of shocks (SN) was evenly spaced in time over 340 ms, yielding an inter-pulse interval of 340/(SN-1). This was done to avoid confounding the number of shocks with the total duration of shocks. The number of shocks, SN, within a trial was 2, 3, 4, 5, 6, 8, 10, 12, 15, or 18. These numbers were determined based on previous literature that suggests that the Weber fraction for many stimuli range from 0.01 to 0.10, meaning that a difference of at least 1–10% between stimuli is needed in order to be distinguishable from each other (Teghtsoonian, 1971; Lavoie and Grondin, 2004). To insure that participants could distinguish between different numbers of shocks, a difference in number of at least 25% between shocks was used. The status quo was set at 10 shocks, and so a relative gain was framed as “2, 4, 5, 6, 7, or 8 less” and a relative loss as “2, 5, or 8 more.”
Following the calibration phase of the experiment, participants entered the scanner to begin the experimental phase, which was modeled after a monetary gambling paradigm used by Tom et al. (2007). Each trial began with a status quo (10 shocks), which was indicated by the presentation of a circle with the text “Sure Thing” centered in the middle (see Figure 1). After 2 s, this circle turned yellow, indicating the impending onset of the shocks, which occurred after a further 2 s. Following an interstimulus interval (ISI) of 3 s, a 50/50 gamble appeared with the words “Accept” and “Reject” below it. This gamble consisted of two possible outcomes, indicated by separate, equally sized slices of the circle, where the left side was always more potential shocks and the right side always fewer potential shocks. The number of shocks more and less than the reference amount varied between trials, such that every possible combination of shocks was presented.
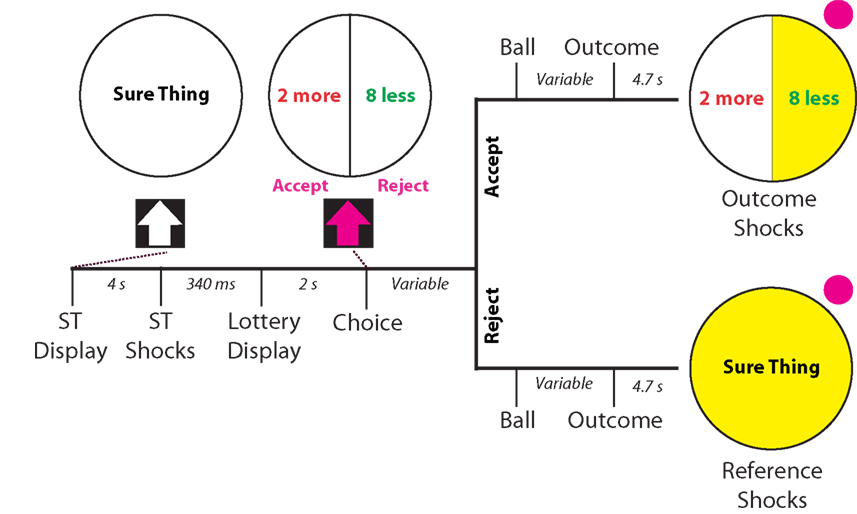
Figure 1. Schematic and timing of experimental task. Participants were given a status quo number of shocks (10 shocks) indicated by a circle with the text “Sure Thing”, followed by the presentation of a 50/50 gamble of more/ less electric shocks from a reference amount. After 2 s of presentation of the gamble, participants could accept or reject the gamble. If they accepted the gamble, a pink ball flipped between outcomes for a period varying between 3 and 6 s, and landed with a 50/50 probability on either outcome, which turned yellow upon selection. If they rejected the gamble, the same presentation appeared. However the outcome that appeared in that case was always the reference quantity of shocks. After 4.7 s (two scanner repetition times), the outcome shocks were administered followed by a further 3 s of the outcome display. The ITI remained constant throughout the experiment at 3 s.
Two seconds after presentation of the gamble, participants were allowed to “Accept” or “Reject” the gamble by using a button box in the scanner. If participants accepted the gamble, a pink ball flipped between options for a varying amount of time between 3 and 6 s, landing with a 50/50 chance on the more shocks or fewer shocks outcome. The side on which the ball landed turned yellow, indicating the outcome of the gamble and impending shocks, which occurred 4.7 s after the outcome was revealed. If participants rejected the gamble, an identical presentation including the ball-flip and outcome selection occurred. However, in this case the reference shocks were the only possible outcome. After the shocks were administered, the outcome remained on screen for 3 s, and was followed by an inter-trial interval (ITI) of 3 s. The experimental phase consisted of three runs with 18 trials per run (54 trials in total). Trials were randomly ordered for each run within-subjects, but remained the same between-subjects. COGENT 2000 (FIL, University College London) was used for stimulus presentation and response acquisition for this phase.
To confirm that participants could distinguish between the different numbers of shocks and that increasing shocks were increasingly averse, participants rated all possible sets of shocks relative to the reference shocks (after the above procedure but while still in the scanner). A visual analog scale (VAS) was presented on screen, with a white arrow in the center labeled as “reference shocks.” Participants were given the reference shocks, and then were given another set of shocks, blinded to the number. They were asked to rate “How much better or worse it is from your reference,” by moving the arrow on screen either left (“better”) or right (“worse”). All possible sets of shocks were given three times each for a total of 30 data points.
fMRI Measurements
Functional imaging was performed with a Siemens 3 T Trio whole-body scanner. T1-weighted images (TR = 2300 ms, TE = 3.04 ms, flip angle = 8,192 × 146 matrix, 176 sagittal slices, 1 mm cubic voxel size) were acquired for each subject prior to the three experimental runs. For each experimental run, T2*-weighted images using an echo-planar imaging sequence were acquired, which show blood oxygen level-dependent (BOLD) responses (echo-planar imaging, TR = 2350 ms, TE = 30 ms, flip angle = 90, FOV = 192 mm × 192 mm, 64 × 64 matrix, 35 3-mm thick axial slices, and 3 mm3 voxels).
fMRI Analysis
fMRI data were analyzed using SPM5 (Wellcome Department of Imaging Neuroscience, University College London) using a standard 2-stage random-effects regression model. Data were subjected to standard preprocessing, including motion correction, slice timing correction, normalization to an MNI template brain and smoothing using an isotropic Gaussian kernel (full-width half-maximum = 8 mm).
Four main regressors were included in the first-level models. (1) The status quo shock at the beginning of each trial was modeled as an impulse function. (2) The “decision” period, during which a decision to accept or reject the gamble was required, was modeled from the onset of gamble presentation until button press. The expected value of the gamble was also included as a parametric modulator for this period. (3) The “ball” period, in which the gamble outcome was resolved over a varying period of time between 3 and 6 s, was modeled as a variable duration function. (4) The “wait” period was modeled from the display of the gamble outcome to the receipt of the shocks. For this period, the number of shocks received was included as a parametric modulator. Subject motion parameters were also included as regressors. All regressors were convolved to the standard HRF function.
Because we were interested in investigating the neural basis of decision parameters that affect choice, the second-level analysis focused on the decision period (#2 above). To identify regions involved in valuation during choice, we first identified regions showing correlations with the expected value of the gamble. We assumed shocks are “bad” and have negative value; for example, the reference shocks would have an expected value (EV) of −10. We calculated the expected value of the gambles with the equation: EVgamble = −10 + (number of shocks less – number of shocks more)/2. EVgamble ranged from −7 for the best gamble, and −13 for the worst gamble. This parameter was expected to directly affect choice, because a less negative EVgamble would indicate a better gamble and a more negative EVgamble a worse gamble, assuming individuals find electric shocks unpleasant. To further analyze the interaction between potential outcomes with less or more shocks within identified regions, we performed an ROI analysis using beta estimates from a different first-level model in which the number of shocks less and the number of shocks more than the reference amount were modeled by separate parametric modulators. This allowed us to identify the extent to which better and worse potential outcomes separately contributed to EVgamble.
Finally, another first-level model was constructed in order to extract BOLD responses for each individual gamble type during the decision period. Instead of a single lottery period modulated by the number of shocks less and number of shocks more than the reference amount, this model included each lottery period associated with a different gamble as a separate regressor, such that there were 18 columns in the design matrix for the decision period, along with the remaining regressors that appeared in the primary first-level model described above. This allowed the average BOLD activity during the decision period for each separate gamble to be extracted. These values were then used to create “heat maps” of activation which give snapshots of how a particular region responds to all possible gambles.
Results
Behavioral
For monetary payments, if an individual prefers to receive a certain payment rather than a gamble with the same expected value, he is said to be risk averse. If he instead prefers the gamble, he is said to be risk seeking. Prior research with monetary payments shows that on average, individuals are risk-averse (risk-seeking) for positive (negative) payoffs. We consider whether the shock quantities in our experiment are treated in the same way. To consider the issue, participant behavior in symmetric lotteries was analyzed. Symmetric lotteries were lotteries with the same amount of shocks less and more than the reference amount, and therefore had the same expected value as the reference shocks. Averaged across all runs for all participants, the symmetric lotteries were chosen over the reference shocks 74% of the time, which suggests risk-seeking behavior. For the individual symmetric lotteries of 8/8, 5/5, and 2/2, participants chose the lottery 56%, 78%, and 89% of the time, respectively. Interestingly, this was significantly different between the three symmetric lottery types (F(2,105) = 10.21; p < 0.0001).
As another indicator of overall risk-preference, the average indifference point across participants was determined by graphing the probability of choosing the lottery as a function of the expected value of the gambles. A sigmoidal curve, shown in Figure 2, was fit to the data using a logistic function to determine the average indifference point. If participants on average were risk neutral, their indifference point would equal the expected value of the reference shocks (−10). If participants were risk-seeking, their indifference point would be less than −10. The average indifference point was −10.94 shocks (f(−10.94) = 0.500 ± 0.218), indicating risk-seeking behavior. The reference point of −10 did not lie within the 95% confidence interval of the logistic fit (f(−10) = 0.720 ± 0.214), and therefore it is likely that this observed indifference point was significantly different from risk-neutrality.
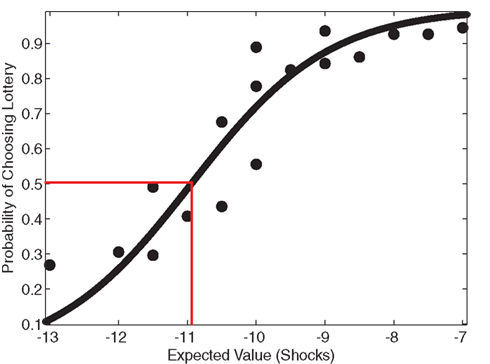
Figure 2. Risk-seeking behavior. To analyze risk attitude, a sigmoid curve was fit to the lottery choice data using a logistic function. An indifference point at the status quo characterizes risk-neutral behavior. Participants’ actual estimated indifference point was at a lower expected value than the status quo, indicated by the red correspondence, which demonstrates risk-seeking behavior, typical in the realm of losses (Kahneman and Tversky, 1979). The reference point of 10 shocks (−10) did not lie within the 95% confidence interval of the logistic fit (f(−10) = 0.720 ± 0.214), suggesting that this observed indifference point was significantly different from risk-neutrality.
To determine individual risk-preference, the curvature of the utility function, u(x) = xα was estimated for each participant using a non-linear least-squares regression. Participant values were not normally distributed nor were they lognormal, and therefore non-parametric statistics were used to test for significance. A Wilcoxon signed-rank test indicated that, on average, participant α values (median α = 0.934, SD = 0.309) were significantly different from one (p = 0.0381). Due to the method of estimation (where a larger expected value is a more unfavorable gamble), an α < 1 indicates convexity over losses and therefore a preference for risk-seeking behavior, whereas an α = 1 indicates a risk-neutral preference. In addition, average VAS ratings for each possible outcome in the study were computed and normalized to the reference shock ratings. When plotted, these ratings revealed a convex function resembling a value function over losses (see Figure 3). The slope of the VAS rating over more and less potential shocks were computed for each participant, using linear regression. A paired-samples t-test revealed that the slope for less potential shocks (M = 1.974, SD = 0.644) was significantly greater than the slope for more potential shocks (M = 0.920, SD = 0.548), p < 0.001, consistent with a convex value function.
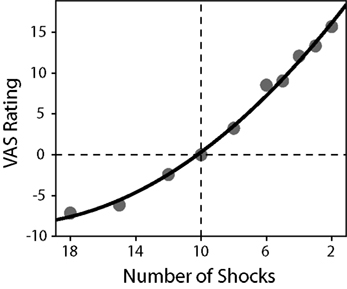
Figure 3. Average normalized VAS ratings as a function of the number of shocks received. A second-order polynomial function was fitted to the data in order to demonstrate the convexity of the observed ratings (R2 = 0.995). The reference shocks (10 shocks) are indicated by the lines at the origin. A paired-samples t-test revealed that the slope for less electric shocks (M = 1.974, SD = 0.644) was significantly greater than the slope for more electric shocks (M = 0.920, SD = 0.548), p < 0.001, consistent with a convex value function.
fMRI
The expected value of the gambles, EVgamble, was used to identify brain regions involved in the valuation of gambles during the decision period (see Figure 4). Used as a parametric modulator, this allowed for identification of regions of the brain whose BOLD signal correlated with the objective gamble value. Positive correlations between EVgamble and BOLD activity were found in the visual cortex, intraparietal sulcus, frontal eye fields, and the left ventral striatum, among other areas (see upper portion of Table 1). A less negative EVgamble indicated a better gamble, which demonstrates that these regions responded in a graded manner to comparatively better possible outcomes – even though all outcomes were still painful. Given that all outcomes were aversive, it is interesting that ventral striatum activity increased for relatively “less bad” outcomes. Regions with negative EVgamble correlations, or a greater response for worse outcomes (more expected shocks), included the posterior cingulate, anterior cingulate (ACC), inferior parietal lobule, insula, and the lateral OFC (lower portion of Table 1).
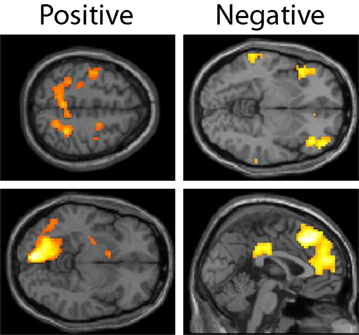
Figure 4. Lottery × EVgamble response. Regions whose BOLD activity responded in an increasing manner to less negative outcomes are shown in the left column, and regions whose BOLD activity responded increasingly to more negative outcomes are shown in the right column. Regions shown in the positive contrast include the frontal eye fields, intraparietal sulcus, left visual area, and ventral striatum. Regions shown in the negative contrast included the left OFC, DMPFC, genual ACC, and posterior cingulate cortex.
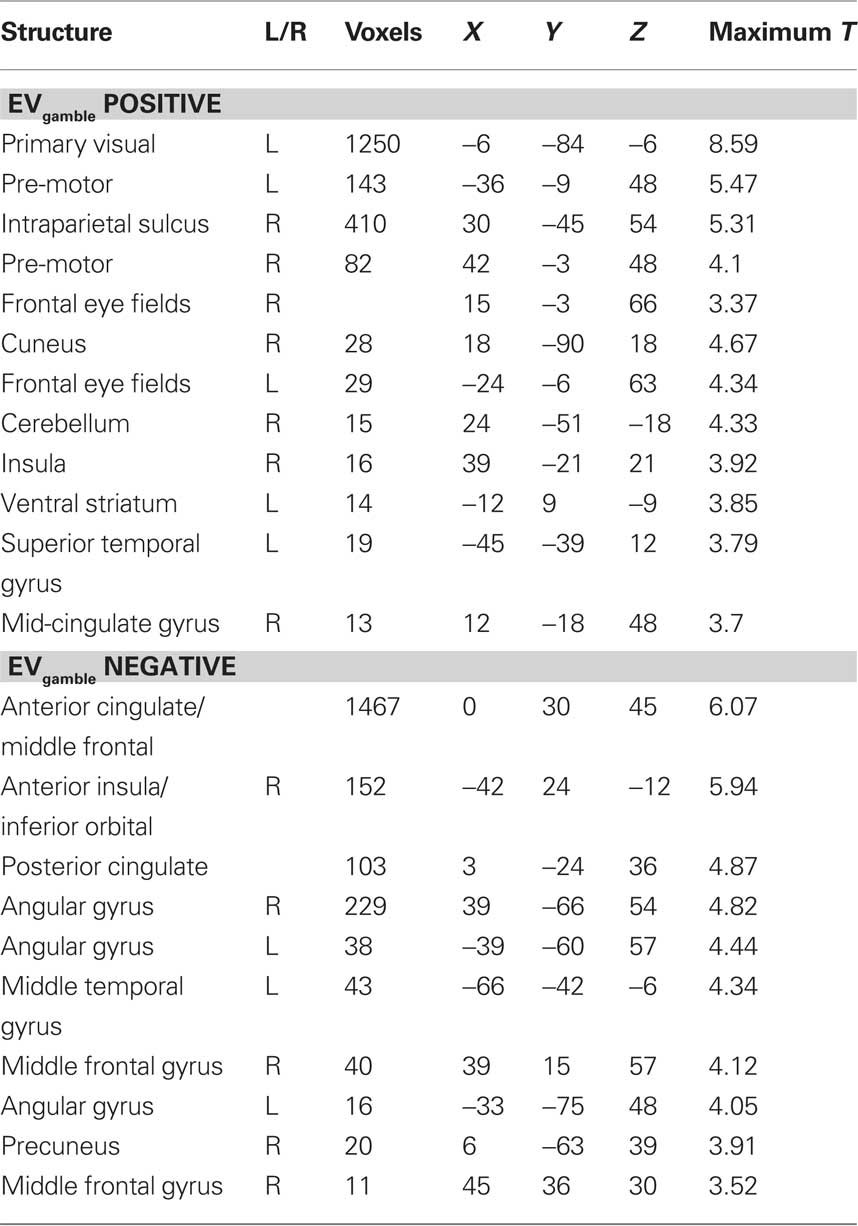
Table 1. Regions showing BOLD activity that correlates with the expected value of the gamble (EVgamble) during the lottery period.
To determine how these regions responded to the individual components of the gambles (less or more potential shocks), beta values for the lottery × number of shocks less and lottery × number of shocks more condition were extracted from regions identified in the lottery × EVgamble contrast mentioned above. The left ventral striatum showed significant positive and negative correlations with the number of potential shocks less (better) and number of potential shocks more (worse), respectively. Other areas identified in the positive EVgamble contrast revealed the same relationship: a significant positive correlation with the number of potential shocks less and negative correlation with the number of potential shocks more. The opposite trend was seen for several regions identified in the negative EVgamble contrast: significant positive correlations with the number of potential shocks more and negative correlations with the number of potential shocks less were observed in the insula, intraparietal sulcus, and dorsomedial prefrontal cortex (DMPFC). To visualize activity to each individual gamble type, we extracted beta values from ROIs in the lottery × EVgamble contrast for each gamble type. In the left ventral striatum, gambles with a higher EVgamble were associated with less deactivation, and gambles with a lower EVgamble were associated with more deactivation, as revealed in a heat map (see Figure 5). A heat map of beta values from the DMPFC for each gamble revealed less activation to gambles with a higher EVgamble, and more activation to gambles with a lower EVgamble (see Figure 5). In other words, more potential shocks elicited above-baseline BOLD activity in these regions. Similar activity was observed in the genual ACC (see Figure 5), with less deactivation for gambles with a lower EVgamble.

Figure 5. Ventral striatum, DMPFC, and genual ACC activity during the lottery period. The ventral striatum showed less deactivation to better gambles (less negative EVgamble), as seen in the whole-brain EVgamble analysis at p < 0.05, FDR, with a cluster threshold of 10 voxels (A). A heat map of ventral striatum activity for each gamble type was generated by taking the ventral striatum ROI (14 voxels) from A and extracting BOLD estimates for each gamble type (B). Activity in the ventral striatum showed a significant positive correlation with the number of shocks less than the reference amount and significant negative correlation with the number of shocks more than the reference amount (C). The DMPFC and genual ACC showed increasing activity to worse gambles (more negative EVgamble), as seen by the whole-brain EVgamble analysis at p < 0.05, FDR, with a cluster threshold of 10 voxels (D,G). A heat map for activity in the DMPFC and genual ACC is shown in (E) and (H). Activity in the DMPFC and genual ACC showed a significant positive correlation with the number of shocks more than the reference amount (F,I), and a significant negative correlation with the number of shocks less than the reference amount (F). Beta values for the DMPFC and genual ACC were extracted from an 8-mm sphere ROI centered on the peak voxel for that cluster (marked with a red cross).
Discussion
Contrary to the simplest form of the dual-systems view, which would predict no response from the ventral striatum to gambles consisting solely of losses, our results indicate that the ventral striatum encodes information regarding value irrespective of the type of outcome (e.g., “more” or “less” shocks) and whether the outcomes are globally “good” or “bad” (e.g., appetitive or aversive). In particular, the positive correlation of left ventral striatal activity with the expected value of the shock lotteries supports its role in valuation and extends this to include the relative valuations of “bads.” While previous neuroimaging studies have demonstrated the role of the striatum in integrating the value of rewards with a variety of costs (Tom et al., 2007; Croxson et al., 2009; Talmi et al., 2009), our results extend these findings to the domains of pain and loss even when there is no possibility of gain.
That these decisions were viewed as occurring in the loss domain is reinforced by the fact that, despite being exposed to the reference shocks for each trial, participants viewed every outcome as a “loss.” This was evidenced by consistent risk-seeking behavior over the full range of lotteries and a larger slope for less shocks than more shocks relative to the status quo for the VAS ratings. These results are consistent with past research showing risk-seeking behavior over hypothetically painful outcomes (Eraker and Sox, 1981). Interestingly, this risk-seeking behavior cannot explain the changes in striatal activation as others have suggested (Fiorillo et al., 2003; Preuschoff et al., 2006) because the variance of the best and worst lotteries is the same in our task. One possible reason for this lack of status quo inducement is the transient nature of the reference shocks. Although participants were presented with reference shocks between each trial, the majority of the time participants were not experiencing painful stimuli. It is possible that a constant painful stimulus, such as would arise with the use of capsaicin to induce a constant state of pain which can then be attenuated or exacerbated with temperature, might be more effective in inducing a status quo (Seymour et al., 2005).
It is important to distinguish between the loss of something desirable, which has been investigated in a considerable number of prior studies, and the receipt of something undesirable, which has received less attention. Previous neuroeconomic studies of loss aversion have shown that the ventral striatum deactivates to the prospect of monetary loss (Tom et al., 2007). Similarly, striatal deactivation has been observed with increased effort and pain to obtain a monetary gain (Croxson et al., 2009; Talmi et al., 2009). These results point to the integrative role of the striatum in determining net value for monetary rewards but do not directly address its role in the relative valuation of things that are universally bad. Evidence exists, however, that the striatum dynamically scales for relative coding of value (Seymour and McClure, 2008). In a similar manner, dopamine neurons have been observed to adaptively code reward value (Tobler et al., 2005), so it is plausible that the striatum could exhibit adaptive signaling even in the realm of painful outcomes – for which we find strong evidence here.
Beyond the striatum’s adaptive coding of value, its more general role in pain processing has been hotly debated (Leknes and Tracey, 2008). Some studies have shown ventral striatal activity during the anticipation of painful stimuli (Becerra et al., 2001; Jensen et al., 2003), a finding echoed by PET evidence of dopamine release to pain (Scott et al., 2006), while others have argued this activity merely reflects the anticipated relief (Baliki et al., 2010). Still others have suggested that the ventral striatum functions more generally in motivated behavior (Horvitz, 2000; Zink et al., 2003, 2004; Delgado et al., 2004; Nicola et al., 2004; Leknes and Tracey, 2008). Our results showed increased ventral striatal activity in anticipation of fewer shocks, which suggests that the striatum is not simply functioning to prime the system to avoid pain – i.e., an analgesic effect (Scott et al., 2006, 2007; Wood and Holman, 2009). If that were the case, we would expect to see increased striatal activity to more potential shocks. Instead, we observed the opposite trend, precluding an analgesic explanation.
Although the aforementioned discussion pertains to the role of the striatum in relative valuation, we also find evidence for such signals in cortical regions classically associated with pain and punishment evaluation (Bechara et al., 1998; O’Doherty et al., 2001; Koyama et al., 2005; Kringelbach, 2005; Raij et al., 2005; Seymour et al., 2005). These regions appear to signal valuation in an inverse manner from the striatum, with both systems operating in synchrony during the decision period. Indeed, evidence for the co-existence of both appetitive-valuation and aversive-valuation signals in the brain exists, with the aversive-valuation signals residing in some of the same regions that we observe, namely in the lateral OFC and genual ACC (O’Doherty et al., 2001; Small et al., 2001; Gottfried et al., 2002; Seymour et al., 2005; Nitschke et al., 2006). In our study, the lateral OFC and genual ACC convey this valuation information during decision-making itself over painful stimuli, as opposed to only during passive learning tasks, which build on prior evidence for these structures roles in signaling bad outcomes, perhaps to facilitate reversal-learning or changes in action, as has been suggested (Kringelbach and Rolls, 2003; Seymour et al., 2005). Furthermore, given past research showing lateral OFC and genual ACC activation to non-painful but aversive stimuli, such as monetary loss (O’Doherty et al., 2001; Liu et al., 2007) and unpleasant odors (Gottfried et al., 2002; Rolls et al., 2003), this information is likely coded in a “common currency”, as has been suggested of activity in the orbitofrontal-striatal system (Montague and Berns, 2002; Murray et al., 2007).
In addition to valuation, the increase in BOLD response to worse gambles that we observed could be related to attention or cognitive control in general, which refers to the process by which attention, memory, and other cognitive abilities are shifted to accomplish a variety of goals. In addition to the lateral OFC and ACC, we found that the DMPFC signaled worse gambles with above-baseline activation in a location that has been recently implicated in decision-related control (Venkatraman et al., 2009), and that has been shown to be more active for more difficult decisions and for decisions that run counter to overall behavioral strategy (Paulus et al., 2002; Zysset et al., 2006; Hampton and O’Doherty, 2007). Though our experimental design does not allow us to separate these functions from valuation or vice-versa, it is likely the case that there exists a complex interplay between regions signaling aversive valuation, such as the lateral OFC, and higher-level decision-control regions which integrate these signals, possibly the DMPFC. Much like the striatum, activity in the DMPFC has been demonstrated during decision-making over a variety of stimuli, suggesting that its role might be independent of the type of outcome that is being decided on (Rushworth et al., 2005; Pochon et al., 2008; Venkatraman et al., 2009).
The current body of research in decision-making points to the idea of a universal valuation system that signals how “good” or “bad” a potential outcome is, relative to some reference point. Structures that were originally thought to be involved solely in reward processing during decision-making are increasingly being shown to be involved in the processing of punishing stimuli as well. Similar activity in these orbitofrontal-striatal regions is observed between more abstract punishments (e.g., monetary losses) and painful stimuli as we have shown here, much like the similar activation patterns for a wide variety of rewarding stimulus modalities. Future research might focus on how a baseline is determined for this valuation activity and whether it is directly related to the status quo, and whether loss aversion can be observed for non-monetary outcomes once a status quo has been set.
Conflict of Interest Statement
The authors declare that the research was conducted in the absence of any commercial or financial relationships that could be construed as a potential conflict of interest.
Acknowledgments
Supported by grants from NIDA (R01 DA016434 and R01 DA025045).
References
Baliki, M. N., Geha, P. Y., Fields, H. L., and Apkarian, A. V. (2010). Predicting value of pain and analgesia: nucleus accumbens response to noxious stimuli changes in the presence of chronic pain. Neuron 66, 149–160.
Becerra, L., Breiter, H. C., Wise, R., Gonzalez, R. G., and Borsook, D. (2001). Reward circuitry activation by noxious thermal stimuli. Neuron 32, 927–946.
Bechara, A., Damasio, H., Tranel, D., and Anderson, S. W. (1998). Dissociation of working memory from decision making within the human prefrontal cortex. J. Neurosci. 18, 428–437.
Coizet, V., Dommett, E. J., Redgrave, P., and Overton, P. G. (2006). Nociceptive responses of midbrain dopaminergic neurones are modulated by the superior colliculus in the rat. Neuroscience 139, 1479–1493.
Croxson, P. L., Walton, M. E., O’Reilly, J. X., Behrens, T. E., and Rushworth, M. F. (2009). Effort-based cost-benefit valuation and the human brain. J. Neurosci. 29, 4531–4541.
Delgado, M. R., Locke, H. M., Stenger, V. A., and Fiez, J. A. (2003). Dorsal striatum responses to reward and punishment: effects of valence and magnitude manipulations. Cogn. Affect. Behav. Neurosci. 3, 27–38.
Delgado, M. R., Stenger, V. A., and Fiez, J. A. (2004). Motivation-dependent responses in the human caudate nucleus. Cereb. Cortex 14, 1022–1030.
Eraker, S. A., and Sox, H. C. (1981). Assessment of patients’ preferences for therapeutic outcomes. Med. Decis Making 1, 29–39.
Fiorillo, C. D., Tobler, P. N., and Schultz, W. (2003). Discrete coding of reward probability and uncertainty by dopamine neurons. Science 299, 1898–1902.
Gottfried, J. A., O’Doherty, J., and Dolan, R. J. (2002). Appetitive and aversive olfactory learning in humans studied using event-related functional magnetic resonance imaging. J. Neurosci. 22, 10829–10837.
Hampton, A. N., and O’Doherty, J. P. (2007). Decoding the neural substrates of reward-related decision making with functional MRI. Proc. Natl. Acad. Sci. U.S.A 104, 1377–1382.
Horvitz, J. C. (2000). Mesolimbocortical and nigrostriatal dopamine responses to salient non-reward events. Neuroscience 96, 651–656.
Jensen, J., McIntosh, A. R., Crawley, A. P., Mikulis, D. J., Remington, G., and Kapur, S. (2003). Direct activation of the ventral striatum in anticipation of aversive stimuli. Neuron 40, 1251–1257.
Kahneman, D., and Tversky, A. (1979). Prospect theory – analysis of decision under risk. Econometrica 47, 263–291.
Knutson, B., Fong, G. W., Adams, C. M., Varner, J. L., and Hommer, D. (2001). Dissociation of reward anticipation and outcome with event-related fMRI. Neuroreport 12, 3683–3687.
Koyama, T., McHaffie, J. G., Laurienti, P. J., and Coghill, R. C. (2005). The subjective experience of pain: where expectations become reality. Proc. Natl. Acad. Sci. U.S.A. 102, 12950–12955.
Kringelbach, M. L. (2005). The human orbitofrontal cortex: linking reward to hedonic experience. Nat. Rev. Neurosci. 6, 691–702.
Kringelbach, M. L., and Rolls, E. T. (2003). Neural correlates of rapid reversal learning in a simple model of human social interaction. Neuroimage 20, 1371–1383.
LaBar, K. S., Gatenby, J. C., Gore, J. C., LeDoux, J. E., and Phelps, E. A. (1998). Human amygdala activation during conditioned fear acquisition and extinction: a mixed-trial fMRI study. Neuron 20, 937–945.
Lavoie, P., and Grondin, S. (2004). Information processing limitations as revealed by temporal discrimination. Brain Cogn. 54, 198–200.
Leknes, S., and Tracey, I. (2008). A common neurobiology for pain and pleasure. Nat. Rev. Neurosci. 9, 314–320.
Liu, X., Powell, D. K., Wang, H., Gold, B. T., Corbly, C. R., and Joseph, J. E. (2007). Functional dissociation in frontal and striatal areas for processing of positive and negative reward information. J. Neurosci. 27, 4587–4597.
Matsumoto, M., and Hikosaka, O. (2009). Two types of dopamine neuron distinctly convey positive and negative motivational signals. Nature 459, 837–841.
McClure, S. M., Laibson, D. I., Loewenstein, G., and Cohen, J. D. (2004). Separate neural systems value immediate and delayed monetary rewards. Science 306, 503–507.
Mirenowicz, J., and Schultz, W. (1996). Preferential activation of midbrain dopamine neurons by appetitive rather than aversive stimuli. Nature 379, 449–451.
Montague, P. R., and Berns, G. S. (2002). Neural economics and the biological substrates of valuation. Neuron 36, 265–284.
Murray, E. A., O’Doherty, J. P., and Schoenbaum, G. (2007). What we know and do not know about the functions of the orbitofrontal cortex after 20 years of cross-species studies. J. Neurosci. 27, 8166–8169.
Nicola, S. M., Yun, I. A., Wakabayashi, K. T., and Fields, H. L. (2004). Cue-evoked firing of nucleus accumbens neurons encodes motivational significance during a discriminative stimulus task. J. Neurophysiol. 91, 1840–1865.
Nitschke, J. B., Sarinopoulos, I., Mackiewicz, K. L., Schaefer, H. S., and Davidson, R. J. (2006). Functional neuroanatomy of aversion and its anticipation. Neuroimage 29, 106–116.
O’Doherty, J., Kringelbach, M. L., Rolls, E. T., Hornak, J., and Andrews, C. (2001). Abstract reward and punishment representations in the human orbitofrontal cortex. Nat. Neurosci. 4, 95–102.
Padoa-Schioppa, C., and Assad, J. A. (2006). Neurons in the orbitofrontal cortex encode economic value. Nature 441, 223–226.
Paulus, M. P., Hozack, N., Frank, L., and Brown, G. G. (2002). Error rate and outcome predictability affect neural activation in prefrontal cortex and anterior cingulate during decision-making. Neuroimage 15, 836–846.
Pochon, J. B., Riis, J., Sanfey, A. G., Nystrom, L. E., and Cohen, J. D. (2008). Functional imaging of decision conflict. J. Neurosci. 28, 3468–3473.
Preuschoff, K., Bossaerts, P., and Quartz, S. R. (2006). Neural differentiation of expected reward and risk in human subcortical structures. Neuron 51, 381–390.
Raij, T. T., Numminen, J., Narvanen, S., Hiltunen, J., and Hari, R. (2005). Brain correlates of subjective reality of physically and psychologically induced pain. Proc. Natl. Acad. Sci. U.S.A. 102, 2147–2151.
Rolls, E. T., Kringelbach, M. L., and de Araujo, I. E. (2003). Different representations of pleasant and unpleasant odours in the human brain. Eur. J. Neurosci. 18, 695–703.
Rushworth, M. F., Kennerley, S. W., and Walton, M. E. (2005). Cognitive neuroscience: resolving conflict in and over the medial frontal cortex. Curr. Biol. 15, R54–R56.
Scott, D. J., Heitzeg, M. M., Koeppe, R. A., Stohler, C. S., and Zubieta, J. K. (2006). Variations in the human pain stress experience mediated by ventral and dorsal basal ganglia dopamine activity. J. Neurosci. 26, 10789–10795.
Scott, D. J., Stohler, C. S., Egnatuk, C. M., Wang, H., Koeppe, R. A., and Zubieta, J. K. (2007). Individual differences in reward responding explain placebo-induced expectations and effects. Neuron 55, 325–336.
Seymour, B., Daw, N., Dayan, P., Singer, T., and Dolan, R. (2007). Differential encoding of losses and gains in the human striatum. J. Neurosci. 27, 4826–4831.
Seymour, B., Dayan, P., Koltzenburg, M., Jones, A. K., Dolan, R. J., Friston, K. J., and Frackowiak, R. S. (2004). Temporal difference models describe higher-order learning in humans. Nature 429, 664–667.
Seymour, B., and McClure, S. M. (2008). Anchors, scales and the relative coding of value in the brain. Curr. Opin. Neurobiol. 18, 173–178.
Seymour, B., O’Doherty, J. P., Koltzenburg, M., Wiech, K., Frackowiak, R., Friston, K., and Dolan, R. (2005). Opponent appetitive-aversive neural processes underlie predictive learning of pain relief. Nat. Neurosci. 8, 1234–1240.
Small, D. M., Zatorre, R. J., Dagher, A., Evans, A. C., and Jones-Gotman, M. (2001). Changes in brain activity related to eating chocolate: from pleasure to aversion. Brain 124, 1720–1733.
Talmi, D., Dayan, P., Kiebel, S. J., Frith, C. D., and Dolan, R. J. (2009). How humans integrate the prospects of pain and reward during choice. J. Neurosci. 29, 14617–14626.
Teghtsoonian, R. (1971). On the exponents in Stevens’ law and the constant in Ekman’s law. Psychol. Rev. 78, 71–80.
Tobler, P. N., Fiorillo, C. D., and Schultz, W. (2005). Adaptive coding of reward value by dopamine neurons. Science 307, 1642–1645.
Tobler, P. N., O’Doherty, J. P., Dolan, R. J., and Schultz, W. (2007). Reward value coding distinct from risk attitude-related uncertainty coding in human reward systems. J. Neurophysiol. 97, 1621–1632.
Tom, S. M., Fox, C. R., Trepel, C., and Poldrack, R. A. (2007). The neural basis of loss aversion in decision-making under risk. Science 315, 515–518.
Venkatraman, V., Rosati, A. G., Taren, A. A., and Huettel, S. A. (2009). Resolving response, decision, and strategic control: evidence for a functional topography in dorsomedial prefrontal cortex. J. Neurosci. 29, 13158–13164.
Wood, P. B., and Holman, A. J. (2009). An elephant among us: the role of dopamine in the pathophysiology of fibromyalgia. J. Rheumatol. 36, 221–224.
Yacubian, J., Glascher, J., Schroeder, K., Sommer, T., Braus, D. F., and Buchel, C. (2006). Dissociable systems for gain- and loss-related value predictions and errors of prediction in the human brain. J. Neurosci. 26, 9530–9537.
Zink, C. F., Pagnoni, G., Martin, M. E., Dhamala, M., and Berns, G. S. (2003). Human striatal response to salient nonrewarding stimuli. J. Neurosci. 23, 8092–8097.
Zink, C. F., Pagnoni, G., Martin-Skurski, M. E., Chappelow, J. C., and Berns, G. S. (2004). Human striatal responses to monetary reward depend on saliency. Neuron 42, 509–517.
Keywords: striatum, decision, pain, valuation, fMRI, neuroeconomics
Citation: Brooks AM, Pammi VSC, Noussair C, Capra CM, Engelmann JB and Berns GS (2010) From bad to worse: striatal coding of the relative value of painful decisions. Front. Neurosci. 4:176. doi: 10.3389/fnins.2010.00176
Received: 28 July 2010;
Accepted: 19 September 2010;
Published online: 26 October 2010.
Edited by:
Scott A. Huettel, Duke University, USACopyright: © 2010 Brooks, Pammi, Noussair, Capra, Engelmann and Berns. This is an open-access article subject to an exclusive license agreement between the authors and the Frontiers Research Foundation, which permits unrestricted use, distribution, and reproduction in any medium, provided the original authors and source are credited.
*Correspondence: Gregory S. Berns, Department of Economics, 1602 Fishburne Drive, Atlanta, GA 30322, USA. e-mail:Z2Jlcm5zQGVtb3J5LmVkdQ==