 Yuta Yoshino
 Jun-ichi Iga
 Shu-ichi Ueno
- Department of Neuropsychiatry, Molecules and Function, Ehime University Graduate School of Medicine, Toon, Japan
A hypothesis for schizophrenia (SCZ) called the “microglia hypothesis” has been suggested. In SCZ, expression of triggering receptor expressed on myeloid cell 2 (TREM2) mRNA is higher in leukocytes than in healthy individuals. Here, the methylation rates of four CpG sites in TREM2 intron 1 that may bind important transcription factors and the correlation between the methylation rate and mRNA expression were determined. We compared the methylation rates in SCZ patients and age-matched controls (n = 50 each). SCZ patients had significantly lower methylation rates of CpG 2 (17.0 ± 6.7 vs. 20.2 ± 5.0; p = 0.02) and CpG 3 (23.8 ± 8.2 vs. 28.1 ± 6.2; p = 0.01). The average methylation rate (15.3 ± 5.2 vs. 17.6 ± 3.9; p = 0.009) was also lower. A significant negative correlation was found between TREM2 mRNA expression and the methylation rate of CpG 2 (r = −0.252, p = 0.012). SCZ susceptibility markers may include low methylation at TREM2 intron 1 and increased TREM2 mRNA levels. Our pilot study requires validation with higher numbers of participants and with other myeloid cell types.
Introduction
The dopamine hypothesis (Seeman and Lee, 1975) and the glutamate hypothesis (Hu et al., 2015) were proposed many years ago to explain the etiology of schizophrenia (SCZ). Elevated microglial activity in the brains of SCZ patients was seen with electron microscopy (Uranova et al., 2011) and positron emission tomography (Doorduin et al., 2009). Changes in microglial markers are present in the brains of SCZ patients after death (Trépanier et al., 2016). Thus, a new hypothesis known as the microglia hypothesis was suggested (Monji et al., 2009).
Microglia express high levels of a protein called triggering receptor expressed on myeloid cell 2 (TREM2) (Hickman and El Khoury, 2014). TREM2 modulates phagocytosis, decreases microglial inflammation (Walter, 2016), and plays a role in neurodegenerative diseases. A functional TREM2 single nucleotide polymorphism is important in the etiology of Alzheimer's disease (AD) (Guerreiro et al., 2013) and frontotemporal dementia (Giraldo et al., 2013), and TREM2 mRNA is increased in monocytes in AD (Hu et al., 2014).
Takahashi et al. (2016) and Müller et al. (2015) recently proposed a role for microglia in SCZ. SCZ brains show high microglial activity (Bloomfield et al., 2015; Trépanier et al., 2016). TREM2, which is expressed at high levels in microglia (Owens et al., 2017), plays a role in neurodegenerative diseases (Ransohoff, 2016). Progressive degenerative changes are present in gray and white matter areas in SCZ (Andreasen et al., 2011). Our previous study showed that TREM2 mRNA is higher in leukocytes from SCZ patients compared to healthy controls (Mori et al., 2015; Yoshino et al., 2016a). However, the mechanism of increased expression of TREM2 mRNA in SCZ is not understood.
One type of epigenetic modification known as DNA methylation is important for the regulation of neurodevelopment and is involved the etiology of neurological diseases (Abdolmaleky et al., 2004). Various chemicals and maternal behaviors modulate DNA methylation in animal models of SCZ (Fish et al., 2004; Ehrlich et al., 2012). Case-control studies have shown changes in DNA methylation in autopsy brain specimens from SCZ patients (Hannon et al., 2016; Montano et al., 2016).
The mechanism of epigenetic modification of TREM2 has been explored in the brain of AD patients. Cells in the superior temporal gyrus in AD show increased levels of methylation in the region of TREM2 (Smith et al., 2016). TREM2 mRNA expression and 5-hydroxymethycytosine are significantly correlated in the hippocampus of AD (Celarain et al., 2016). TREM2 expression in AD and SCZ may involve similar changes in microglia. However, the exact mechanism of increased TREM2 mRNA expression in leukocytes in SCZ remains unclear.
In this study, the methylation rates of CpG sites in TREM2 intron 1 and the relationship between these rates and TREM2 mRNA expression in leukocytes from SCZ patients were determined.
Materials and Methods
Participants
We enrolled patients with SCZ (n = 50; 24 males, 26 females; age ± S.D. = 62.1 ± 13.3 years) who were treated at Ehime University Hospitals in Japan. Extensive clinical interviews, a review of medical records, and Diagnostic and Statistical Manual of Mental Disorders-5 criteria were used by at least two expert psychiatrists to determine SCZ diagnosis. Hospital staff and company employees (n = 50; 25 males, 25 females; age = 61.8 ± 13.3 years; unrelated to SCZ patients) without psychiatric problems, a history of mental illness, or use of medications were selected as healthy controls. These are the same SCZ patients and controls that we previously examined (Yoshino et al., 2016a). SCZ patients and controls did not differ significantly in age (p = 0.992) or sex (p = 1.0). The 18-item Brief Psychiatric Rating Scale (BPRS) (each item is scored on a scale of 1–7) (Rhoades and Overall, 1988) and the Drug-Induced Extrapyramidal Symptoms Scale (DIEPSS) were used to assess SCZ symptoms and antipsychotic-induced extrapyramidal symptoms (Inada, 2009), respectively. The institutional ethics committees of Ehime University Graduate School of Medicine approved the study. Trained psychiatrists determined which patients were able to understand the goals and risks of the study, and patients with severe cognitive impairment were excluded. Written informed consent was obtained from each participant.
Blood Sample Analysis
Venous blood samples were collected in potassium EDTA tubes, and genomic DNA was extracted from frozen white blood cells (leukocytes) using the QIAcube blood mini kit (Qiagen, Tokyo, Japan) and stored at 4°C until analyses. Although a functional, AD-associated single nucleotide polymorphism is present in TREM2 (rs75932628 > T, p.R47H) (Guerreiro et al., 2013), the minor allele frequency is too low (<0.01) for analysis in our current study.
mRNA Analysis
Here, we used the same TREM2 mRNA expression data that we previously reported (Yoshino et al., 2016a).
Sodium Bisulfite Conversion of DNA
We used the EpiTect Bisulfite Kit (Qiagen) for bisulfite conversion of DNA (1 μg per sample) and subsequent purification according to the manufacturer's instructions.
PCR Amplification
JASPAR (http://jaspar.binf.ku.dk/) was used to identify four CpG sites that are predicted to bind major transcription factors. The number of possible sites of transcription factor binding in the promotor (from exon 1 to −200 bp) and introns 1–3 of TREM2 was determined. The four CpG sites in intron 1 harbored the highest number of transcription factors with a high score that predicted binding (predictive value >8). These four CpG sites were adjacent to the CpG sites of the hypomethylated region of TREM2 intron 1 (https://genome.ucsc.edu/). Pyromark Assay Design software, version 2.0 (Qiagen) was used to design primers. Figure 1 shows the CpG sites in intron 1 and the associated transcription factors. The primer sequences were: Forward 5′-AAGGGGAATAAAGTTATAGAAATAGGG-3GGGGAATA-3′ and reverse 5′-CCTCCAATTCTATTCTACACATCT-3TCCAATTCTATTCTACACATAGGGAAGCTGGAAG-3′. Bisulfite-treated DNA (107 ng; 1.5 μl) was used as a template for PCR that included 0.2 mM dNTP (Applied Biosystems, Foster City, CA), 10 × PCR buffer (Applied Biosystems), 0.5 U AmpliTaq gold (Applied Biosystems), and 0.2 μM forward and reverse primers (final volume 18.8 μl). PCR was performed with an initial denaturation for 10 min at 95°C; 45 cycles of denaturation for 30 s at 95°C, annealing for 30 s at 58°C, and elongation for 1 min at 72°C; followed by a final extension at 72°C for 10 min.
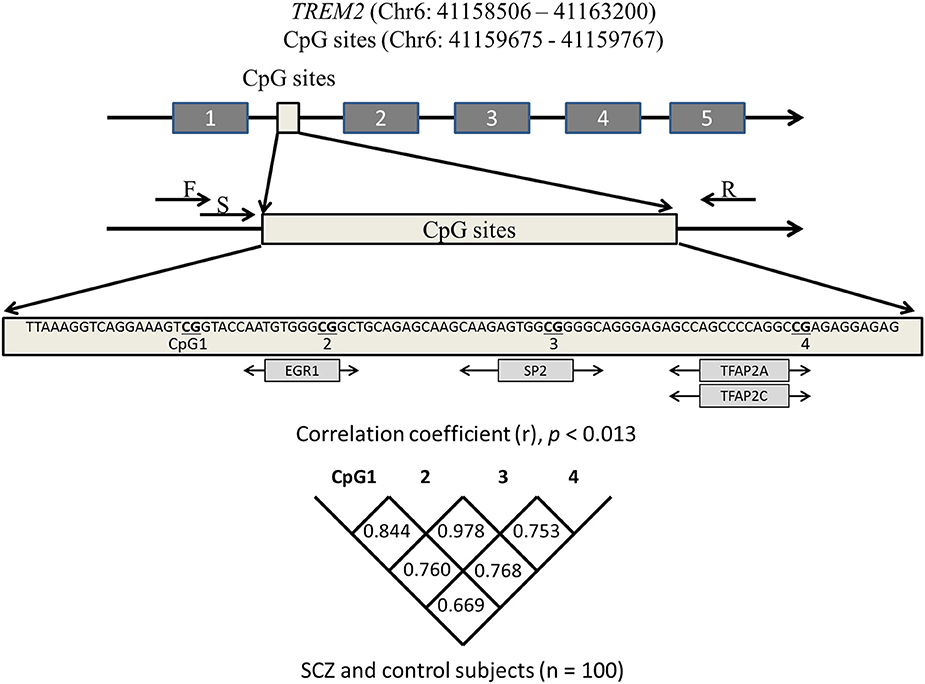
Figure 1. Schematic diagram showing the location of the TREM2 region we analyzed. CpG sites predicted to bind transcription factors (light gray boxes) are depicted under the sequence. Correlations among four CpGs were analyzed with the Spearman's rank correlation coefficient. Statistical significance was defined at p = 0.0125 using Bonferroni correction. SCZ, schizophrenia subjects; F, forward primer; R, reverse primer; S, sequencing primer.
Determination of Methylation Rates
Each sample was analyzed in duplicate. PyroMark Q24 was used to determine the methylation rate at each CpG site, and then methylation rates were accurately analyzed with PyroMark Q24 Advanced software, version 3.0.0 (Qiagen).
Statistical Analysis
SPSS 22.0 software (IBM Japan, Tokyo, Japan) was used for statistical testing. The Shapiro-Wilk test was used to determine normality. The Student's t-test or Mann-Whitney U-test with post-hoc Bonferroni correction was used to compare age and the methylation rate of each CpG site between SCZ patients and controls. The Fisher's exact test was used to assess gender differences. Correlations between individual clinical factors and the methylation rate were analyzed with the Pearson correlation coefficient or Spearman's rank correlation coefficient. Discriminant analysis was performed with the methylation rates of the four CpG sites to assess the diagnostic utility. The 95% level (p = 0.05) was considered statistically significant.
Results
Methylation Rates in Medicated SCZ and Controls
The methylation rate of each CpG site was lower in SCZ patients than controls (Figure 2). The methylation rates of CpG 2 (average ± S.D. = 17.0 ± 6.7 vs. 20.2 ± 5.0, p = 0.004), CpG 3 (23.8 ± 8.2 vs. 28.1 ± 6.2, p = 0.002), and the overall average methylation rate (15.3 ± 5.2 vs. 17.6 ± 3.9, p = 0.009) were significantly lower in SCZ patients compared to healthy controls, respectively, after Bonferroni correction (p < 0.0125). The methylation rates of CpG 1 (10.7 ± 3.8 vs. 11.6 ± 3.1, p = 0.180) and CpG 4 (9.8 ± 3.1 vs. 10.7 ± 2.6, p = 0.091) tended to be lower in SCZ, but the difference was not significant.
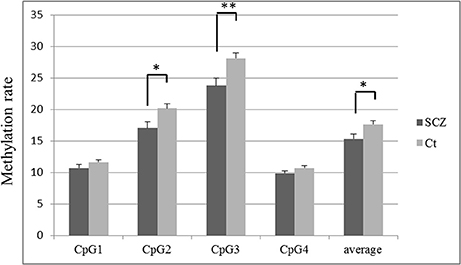
Figure 2. TREM2 methylation rate in SCZ and control subjects at each CpG site. The values are the mean methylation rates + SEM. Statistical significance was defined at *p < 0.0125, **p < 0.0025, using Bonferroni correction. SCZ, schizophrenia subjects; Ct, control subjects.
Correlation between TREM2 mRNA Expression and Methylation Rates
TREM2 mRNA expression was negatively correlated with the methylation rates of CpG 1 (r = −0.242, p = 0.016), CpG 2 (r = −0.252, p = 0.012), CpG 3 (r = −0.218, p = 0.031), CpG 4 (r = −0.243, p = 0.193), and the average methylation rate (r = −0.243, p = 0.016, Figure 3). TREM2 mRNA expression was significantly correlated with the methylation rate of CpG 2 (r = −0.252, p = 0.012) after Bonferroni correction (p < 0.0125).
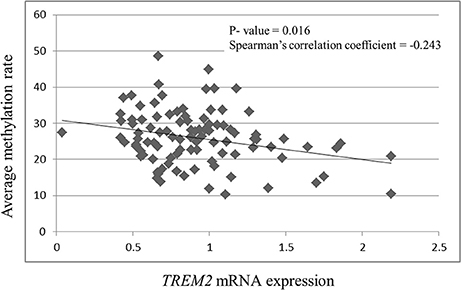
Figure 3. Correlation between TREM2 mRNA expression and the average of the four CpG methylation rates. SCZ, schizophrenia subjects.
Correlation between Methylation Rates and Clinical Factors in Medicated SCZ Patients
Age was significantly correlated with the CpG 4 methylation rate (r = −0.305, p = 0.033; Table 1). We also observed a trend for a negative correlation between age and the methylation rate of CpG 2, CpG 3, and the average rate. No correlations were seen between the methylation rate of individual CpG sites and the age at onset, duration of illness, chlorpromazine equivalent, BPRS, or DIEPSS.
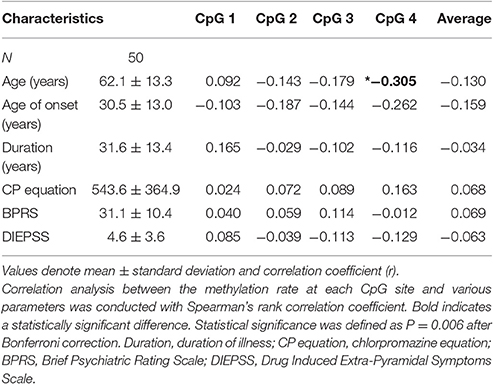
Table 1. Demographic data of medicated schizophrenia subjects.
Discriminant Analysis
We performed discriminant analysis using the variables included in the model to compare SCZ with healthy controls (Wilks lambda = 0.894, p = 0.03). We used the following equation to calculate a discrimination score for each SCZ patient:
The sensitivity and specificity of the discriminant analysis were 71.4 and 64.0%, respectively. Receiver operating characteristic curve analysis is shown in Figure 4. The area under the curve was 0.694 (confidence interval, 0.591–0.798, p = 0.001).
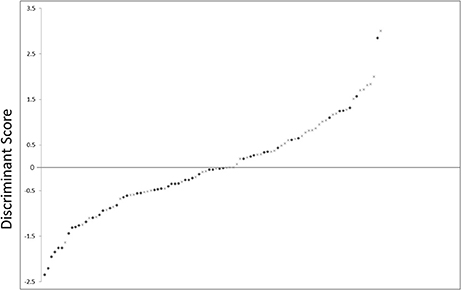
Figure 4. Scatter plot showing the distribution of D-scores for schizophrenia and control subjects. •, schizophrenia subjects; ×, control subjects.
Discussion
Two important results emerged from this study. First, some methylation rates of TREM2 intron 1 were significantly lower in SCZ patients than in healthy controls. Second, methylation rates and TREM2 mRNA expression were significantly correlated.
The greatest number of transcription factors were predicted to bind at four CpG sites within intron 1 with high predictive values (predictive value >8, JASPAR), and thus, we focused on this region. The methylation rates of CpG 2 (p = 0.004), CpG 3 (p = 0.002), and the overall average methylation rate of these four sites (p = 0.009) were significantly lower in SCZ patients than in controls following Bonferroni correction. We previously showed that TREM2 mRNA in leukocytes from SCZ patients was higher than that in healthy controls (Mori et al., 2015; Yoshino et al., 2016a). This increase in TREM2 mRNA in SCZ may be due to in part to DNA methylation of TREM2 intron 1. Other groups have provided data suggesting that methylation of intron 1 various genes including1 of various genes including Synuclein Alpha (Funahashi et al., 2016; Yoshino et al., 2016b), Steroidogenic factor 1 (Xue et al., 2014), and Peroxisomal Membrane Protein 4 (Zhang et al., 2010) regulates mRNA expression.
We also observed that TREM2 mRNA expression and methylation rates of intron 1 were negatively correlated. Altered TREM2 DNA methylation in the region upstream of exon 1 has been reported in brains from AD patients (Celarain et al., 2016; Smith et al., 2016). However, these data were derived from genome-wide methylation arrays, and the correlation between mRNA expression and the methylation rate was not determined. Bell et al. (2011) and Pai et al. (2011) have reported a general association between mRNA expression the methylation rate. Heavily methylated areas of the genome are usually transcriptionally silent, whereas less heavily methylated regions are more transcriptionally active (Labbé et al., 2016). TREM2 mRNA levels and the CpG 2 methylation rate at intron 1 were negatively correlated. Thus, both the promoter and intragenic regions are involved in regulation of gene expression (Shenker and Flanagan, 2012; Ehrlich and Lacey, 2013).
Age was significantly correlated with the methylation rates in medicated SCZ patients (CpG 4, r = −0.305, p = 0.033). Age and the CpG 2, CpG 3, and average methylation rates showed a trend for a negative correlation. Aging is associated with hyper- or hypomethylation of particular genes in various tissues including leukocytes (Bollati et al., 2009; Christensen et al., 2009; Horvath et al., 2012). Thus, a future study should be performed to compare these methylation rates between patients and age-matched healthy controls. Tan et al. (2016) showed that DNA methylation rates are useful biomarkers. We performed discriminant analysis using four CpG sites and showed sensitivity of 71.4% and specificity of 64.0%. These values are somewhat low, but could be increased if combined with other biomarkers, resulting in a biomarker for SCZ. SCZ has generally been considered to not be a neurodegenerative disorder, but recent studies suggest otherwise (Anderson et al., 2014, 2015). C-reactive protein and interleukin-6 are increased in SCZ patients without obvious inflammation (Zakharyan and Boyajyan, 2014). Increased levels of TREM2 mRNA in leukocytes from patients with SCZ may be associated with inflammation in the periphery or microglial involvement (Mori et al., 2015; Yoshino et al., 2016a). Neuronal changes in SCZ may result from glial cell inflammation (Takahashi and Sakurai, 2013), and thus, TREM2 expression and methylation should be examined in SCZ brain specimens in the future.
Several limitations of our study should be considered. First, we used a somewhat small sample size. Second, whether the correlation between TREM2 mRNA and intron 1 methylation rates is also present in brain is not known, although the methylation rates in leukocytes are correlated with rates in the brain (Davies et al., 2012; Wockner et al., 2014). Future studies should address these points. Finally, DNA was obtained from leukocytes that were not separated according to cell type. We observed that CpG rates of this target region were not significantly different among various leukocyte subsets including neutrophils, B cells, and CD4+ T cells, according to a publicly available dataset (UCSC Genome Browser; https://genome.ucsc.edu/). Thus, our result may be the same regardless of the subset of leukocytes examined.
In summary, increased TREM2 mRNA expression was observed in leukocytes from SCZ patients. Intron 1 of TREM2 showed a lower methylation rate, and we observed negative correlations between TREM2 mRNA expression and methylation rates in leukocytes from patients with SCZ. These observations may be related to schizophrenic processing and could be candidate markers for determining the probability of SCZ.
Author Contributions
YY, JI, and SU designed the study and wrote the protocol. YY, YO, KY, TS, and YM managed the literature searches and analyses. SO managed the literature searches. YY undertook the statistical analysis, and wrote the first draft of the manuscript. All authors contributed to and have approved the final manuscript.
Conflict of Interest Statement
The authors declare that the research was conducted in the absence of any commercial or financial relationships that could be construed as a potential conflict of interest.
The reviewer JLDA and handling Editor declared their shared affiliation, and the handling Editor states that the process nevertheless met the standards of a fair and objective review.
Acknowledgments
We wish to thank Ms. Chiemi Onishi for technical assistance. This work was partially supported by a Health and Labor Science Research Grant from the Japanese Ministry of Health, Labor and Welfare and a Grant-in-Aid for Scientific Research from the Japanese Ministry of Education, Culture, Sports, Science and Technology, JSPS KAKENHI Grant Numbers 15K09808 and 16K21207.
References
Abdolmaleky, H. M., Smith, C. L., Faraone, S. V., Shafa, R., Stone, W., Glatt, S. J., et al. (2004). Methylomics in psychiatry: modulation of gene-environment interactions may be through DNA methylation. Am. J. Med. Genet. B Neuropsychiatr. Genet. 127B, 51–59. doi: 10.1002/ajmg.b.20142
Anderson, K. K., Rodrigues, M., Mann, K., Voineskos, A., Mulsant, B. H., and George, T. P. (2015). Minimal evidence that untreated psychosis damages brain structures: a systematic review. Schizophr. Res. 162, 222–233. doi: 10.1016/j.schres.2015.01.021
Anderson, K. K., Voineskos, A., Mulsant, B. H., George, T. P., and Mckenzie, K. J. (2014). The role of untreated psychosis in neurodegeneration: a review of hypothesized mechanisms of neurotoxicity in first-episode psychosis. Can. J. Psychiatry 59, 513–517. doi: 10.1177/070674371405901003
Andreasen, N. C., Nopoulos, P., Magnotta, V., Pierson, R., Ziebell, S., and Ho, B. C. (2011). Progressive brain change in schizophrenia: a prospective longitudinal study of first-episode schizophrenia. Biol. Psychiatry 70, 672–679. doi: 10.1016/j.biopsych.2011.05.017
Bell, J. T., Pai, A. A., Pickrell, J. K., Gaffney, D. J., Pique-Regi, R., Degner, J. F., et al. (2011). DNA methylation patterns associate with genetic and gene expression variation in HapMap cell lines. Genome Biol. 12:R10. doi: 10.1186/gb-2011-12-6-405
Bloomfield, P. S., Selvaraj, S., Veronese, M., Rizzo, G., Bertoldo, A., Owen, D. R., et al. (2015). Microglial Activity in People at Ultra High Risk of Psychosis and in Schizophrenia: an [11C]PBR28 PET Brain Imaging Study. Am. J. Psychiatry 173, 44–52. doi: 10.1176/appi.ajp.2015.14101358
Bollati, V., Schwartz, J., Wright, R., Litonjua, A., Tarantini, L., Suh, H., et al. (2009). Decline in genomic DNA methylation through aging in a cohort of elderly subjects. Mech. Ageing Dev. 130, 234–239. doi: 10.1016/j.mad.2008.12.003
Celarain, N., Sánchez-Ruiz de Gordoa, J., Zelaya, M. V., Roldán, M., Larumbe, R., Pulido, L., et al. (2016). TREM2 upregulation correlates with 5-hydroxymethycytosine enrichment in Alzheimer's disease hippocampus. Clin. Epigenetics 8, 37. doi: 10.1186/s13148-016-0202-9
Christensen, B. C., Houseman, E. A., Marsit, C. J., Zheng, S., Wrensch, M. R., Wiemels, J. L., et al. (2009). Aging and environmental exposures alter tissue-specific DNA methylation dependent upon CpG island context. PLoS Genet. 5:e1000602. doi: 10.1371/journal.pgen.1000602
Davies, M. N., Volta, M., Pidsley, R., Lunnon, K., Dixit, A., Lovestone, S., et al. (2012). Functional annotation of the human brain methylome identifies tissue-specific epigenetic variation across brain and blood. Genome Biol. 13:R43. doi: 10.1186/gb-2012-13-6-r43
Doorduin, J., de Vries, E. F., Willemsen, A. T., de Groot, J. C., Dierckx, R. A., and Klein, H. C. (2009). Neuroinflammation in schizophrenia-related psychosis: a PET study. J. Nucl. Med. 50, 1801–1807. doi: 10.2967/jnumed.109.066647
Ehrlich, M., and Lacey, M. (2013). DNA methylation and differentiation: silencing, upregulation and modulation of gene expression. Epigenomics 5, 553–68. doi: 10.2217/epi.13.43
Ehrlich, S., Walton, E., Roffman, J. L., Weiss, D., Puls, I., Doehler, N., et al. (2012). Smoking, but not malnutrition, influences promoter-specific DNA methylation of the proopiomelanocortin gene in patients with and without anorexia nervosa. Can. J. Psychiatry 57, 168–176. doi: 10.1177/070674371205700306
Fish, E. W., Shahrokh, D., Bagot, R., Caldji, C., Bredy, T., Szyf, M., et al. (2004). Epigenetic programming of stress responses through variations in maternal care. Ann. N.Y. Acad. Sci. 1036, 167–180. doi: 10.1196/annals.1330.011
Funahashi, Y., Yoshino, Y., Yamazaki, K., Mori, Y., Mori, T., Ozaki, Y., et al. (2016). DNA methylation changes at SNCA intron 1 in patients with dementia with Lewy bodies. Psychiatry Clin. Neurosci. 71, 28–35. doi: 10.1111/pcn.12462
Giraldo, M., Lopera, F., Siniard, A. L., Corneveaux, J. J., Schrauwen, I., Carvajal, J., et al. (2013). Variants in triggering receptor expressed on myeloid cells 2 are associated with both behavioral variant frontotemporal lobar degeneration and Alzheimer's disease. Neurobiol. Aging 34, 2077.e11–2077.e18. doi: 10.1016/j.neurobiolaging.2013.02.016
Guerreiro, R., Wojtas, A., Bras, J., Carrasquillo, M., Rogaeva, E., Majounie, E., et al. (2013). TREM2 variants in Alzheimer's disease. N. Engl. J. Med. 368, 117–127. doi: 10.1056/NEJMoa1211851
Hannon, E., Dempster, E., Viana, J., Burrage, J., Smith, A. R., Macdonald, R., et al. (2016). An integrated genetic-epigenetic analysis of schizophrenia: evidence for co-localization of genetic associations and differential DNA methylation. Genome Biol. 17, 176. doi: 10.1186/s13059-016-1041-x
Hickman, S. E., and El Khoury, J. (2014). TREM2 and the neuroimmunology of Alzheimer's disease. Biochem. Pharmacol. 88, 495–498. doi: 10.1016/j.bcp.2013.11.021
Horvath, S., Zhang, Y., Langfelder, P., Kahn, R. S., Boks, M. P., van Eijk, K., et al. (2012). Aging effects on DNA methylation modules in human brain and blood tissue. Genome Biol. 13:R97. doi: 10.1186/gb-2012-13-10-r97
Hu, N., Tan, M. S., Yu, J. T., Sun, L., Tan, L., Wang, Y. L., et al. (2014). Increased expression of TREM2 in peripheral blood of Alzheimer's disease patients. J. Alzheimers. Dis. 38, 497–501. doi: 10.3233/JAD-130854
Hu, W., MacDonald, M. L., Elswick, D. E., and Sweet, R. A. (2015). The glutamate hypothesis of schizophrenia: evidence from human brain tissue studies. Ann. N.Y. Acad. Sci. 1338, 38–57. doi: 10.1111/nyas.12547
Inada, T. (2009). DIEPSS: A Second-Generation Rating Scale for Antipsychotic-Induced Extrapyramidal Symptoms: Drug-Induced Extrapyramidal Symptoms Scale. Tokyo: Seiwa Shoten.
Labbé, C., Lorenzo-Betancor, O., and Ross, O. A. (2016). Epigenetic regulation in Parkinson's disease. Acta Neuropathol. 132, 515–530. doi: 10.1007/s00401-016-1590-9
Monji, A., Kato, T., and Kanba, S. (2009). Cytokines and schizophrenia: Microglia hypothesis of schizophrenia. Psychiatry Clin. Neurosci. 63, 257–265. doi: 10.1111/j.1440-1819.2009.01945.x
Montano, C., Taub, M. A., Jaffe, A., Briem, E., Feinberg, J. I., Trygvadottir, R., et al. (2016). Association of DNA methylation differences with schizophrenia in an epigenome-wide association study. JAMA Psychiatry 73, 506–514. doi: 10.1001/jamapsychiatry.2016.0144
Mori, Y., Yoshino, Y., Ochi, S., Yamazaki, K., Kawabe, K., Abe, M., et al. (2015). TREM2 mRNA expression in leukocytes is increased in Alzheimer's Disease and Schizophrenia. PLoS ONE 10:e0136835. doi: 10.1371/journal.pone.0136835
Müller, N., Weidinger, E., Leitner, B., and Schwarz, M. J. (2015). The role of inflammation in schizophrenia. Front. Neurosci. 9:372. doi: 10.3389/fnins.2015.00372
Owens, R., Grabert, K., Davies, C. L., Alfieri, A., Antel, J. P., Healy, L. M., et al. (2017). Divergent Neuroinflammatory Regulation of Microglial TREM Expression and Involvement of NF-κB. Front. Cell. Neurosci. 11:56. doi: 10.3389/fncel.2017.00056
Pai, A. A., Bell, J. T., Marioni, J. C., Pritchard, J. K., and Gilad, Y. (2011). A genome-wide study of DNA methylation patterns and gene expression levels in multiple human and chimpanzee tissues. PLoS Genet. 7:e1001316. doi: 10.1371/journal.pgen.1001316
Ransohoff, R. M. (2016). How neuroinflammation contributes to neurodegeneration. Science 353, 777–783. doi: 10.1126/science.aag2590
Rhoades, H. M., and Overall, J. E. (1988). The semistructured BPRS interview and rating guide. Psychopharmacol. Bull. 24, 101–104.
Seeman, P., and Lee, T. (1975). Antipsychotic drugs: direct correlation between clinical potency and presynaptic action on dopamine neurons. Science 188, 1217–1219. doi: 10.1126/science.1145194
Shenker, N., and Flanagan, J. M. (2012). Intragenic DNA methylation: implications of this epigenetic mechanism for cancer research. Br. J. Cancer 106, 248–253. doi: 10.1038/bjc.2011.550
Smith, A. R., Smith, R. G., Condliffe, D., Hannon, E., Schalkwyk, L., Mill, J., et al. (2016). Increased DNA methylation near TREM2 is consistently seen in the superior temporal gyrus in Alzheimer's disease brain. Neurobiol. Aging 47, 35–40. doi: 10.1016/j.neurobiolaging.2016.07.008
Takahashi, N., and Sakurai, T. (2013). Roles of glial cells in schizophrenia: possible targets for therapeutic approaches. Neurobiol. Dis. 53, 49–60. doi: 10.1016/j.nbd.2012.11.001
Takahashi, Y., Yu, Z., Sakai, M., and Tomita, H. (2016). Linking Activation of Microglia and Peripheral Monocytic Cells to the Pathophysiology of Psychiatric Disorders. Front. Cell. Neurosci. 10:144. doi: 10.3389/fncel.2016.00144
Tan, Q., Heijmans, B. T., Hjelmborg, J. V., Soerensen, M., Christensen, K., and Christiansen, L. (2016). Epigenetic drift in the aging genome: a ten-year follow-up in an elderly twin cohort. Int. J. Epidemiol. 45, 1146–1158. doi: 10.1093/ije/dyw132
Trépanier, M. O., Hopperton, K. E., Mizrahi, R., Mechawar, N., and Bazinet, R. P. (2016). Postmortem evidence of cerebral inflammation in schizophrenia: a systematic review. Mol. Psychiatry 21, 1009–1026. doi: 10.1038/mp.2016.90
Uranova, N. A., Vikhreva, O. V., Rachmanova, V. I., and Orlovskaya, D. D. (2011). Ultrastructural alterations of myelinated fibers and oligodendrocytes in the prefrontal cortex in schizophrenia: a postmortem morphometric study. Schizophr. Res. Treatment 2011:325789. doi: 10.1155/2011/325789
Walter, J. (2016). The triggering receptor expressed on Myeloid Cells 2: a molecular link of neuroinflammation and neurodegenerative diseases. J. Biol. Chem. 291, 4334–4341. doi: 10.1074/jbc.R115.704981
Wockner, L. F., Noble, E. P., Lawford, B. R., Young, R. M., Morris, C. P., Whitehall, V. L., et al. (2014). Genome-wide DNA methylation analysis of human brain tissue from schizophrenia patients. Transl. Psychiatry 4:e339. doi: 10.1038/tp.2013.111
Xue, Q., Xu, Y., Yang, H., Zhang, L., Shang, J., Zeng, C., et al. (2014). Methylation of a novel CpG island of intron 1 is associated with steroidogenic factor 1 expression in endometriotic stromal cells. Reprod. Sci. 21, 395–400. doi: 10.1177/1933719113497283
Yoshino, Y., Kawabe, K., Yamazaki, K., Watanabe, S., Numata, S., Mori, Y., et al. (2016a). Elevated TREM2 mRNA expression in leukocytes in schizophrenia but not major depressive disorder. J. Neural Transm. (Vienna) 123, 637–641. doi: 10.1007/s00702-016-1560-3
Yoshino, Y., Mori, T., Yoshida, T., Yamazaki, K., Ozaki, Y., Sao, T., et al. (2016b). Elevated mRNA Expression and Low Methylation of SNCA in Japanese Alzheimer's Disease Subjects. J. Alzheimers Dis. 54, 1349–1357. doi: 10.3233/JAD-160430
Zakharyan, R., and Boyajyan, A. (2014). Inflammatory cytokine network in schizophrenia. World J. Biol. Psychiatry 15, 174–187. doi: 10.3109/15622975.2013.830774
Keywords: schizophrenia, triggering receptor expressed on myeloid cell 2, TREM2, methylation rate, mRNA expression, pyrosequencing, susceptibility marker
Citation: Yoshino Y, Ozaki Y, Yamazaki K, Sao T, Mori Y, Ochi S, Iga J-i and Ueno S-i (2017) DNA Methylation Changes in Intron 1 of Triggering Receptor Expressed on Myeloid Cell 2 in Japanese Schizophrenia Subjects. Front. Neurosci. 11:275. doi: 10.3389/fnins.2017.00275
Received: 02 March 2017; Accepted: 28 April 2017;
Published: 23 May 2017.
Edited by:
Carlos Cruchaga, Washington University in St. Louis, United StatesReviewed by:
Manav Kapoor, Icahn School of Medicine at Mount Sinai, United StatesJorge L. Del-Aguila, Washington University in St. Louis, United States
Copyright © 2017 Yoshino, Ozaki, Yamazaki, Sao, Mori, Ochi, Iga and Ueno. This is an open-access article distributed under the terms of the Creative Commons Attribution License (CC BY). The use, distribution or reproduction in other forums is permitted, provided the original author(s) or licensor are credited and that the original publication in this journal is cited, in accordance with accepted academic practice. No use, distribution or reproduction is permitted which does not comply with these terms.
*Correspondence: Jun-ichi Iga, aWdhanVuaWNoaUBob3RtYWlsLmNvbQ==