 Muhammad E. Haque1*
 Refaat E. Gabr2
 Sarah D. George1Xiurong Zhao1
 Seth B. Boren1Xu Zhang3Shun-Ming Ting1Gunghua Sun1
 Khader M. Hasan2
 Sean Savitz1
 Jaroslaw Aronowski1
- 1Institute for Stroke and Cerebrovascular Diseases, McGovern Medical School, The University of Texas Health Science Center at Houston, Houston, TX, United States
- 2Diagnostic and Interventional Imaging, McGovern Medical School, The University of Texas Health Science Center at Houston, Houston, TX, United States
- 3Biostatistics, Epidemiology, and Research Design Component, Center for Clinical and Translational Sciences, McGovern Medical School, The University of Texas Health Science Center at Houston, Houston, TX, United States
Purpose: Perihematomal edema (PHE) occurs in patients with intracerebral hemorrhage (ICH) and is often used as surrogate of secondary brain injury. PHE resolves over time, but little is known about the functional integrity of the tissues that recover from edema. In a pig ICH model, we aimed to assess metabolic integrity of perihematoma tissues by using non-invasive magnetic resonance spectroscopy (MRS).
Materials and Methods: Fourteen male Yorkshire pigs with an average age of 8 weeks were intracerebrally injected with autologous blood to produce ICH. Proton MRS data were obtained at 1, 7, and 14 days after ICH using a whole-body 3.0T MRI system. Point-resolved spectroscopy (PRESS)-localized 2D chemical shift imaging (CSI) was acquired. The concentration of N-Acetylaspartate (NAA), Choline (Cho), and Creatine (Cr) were measured within the area of PHE, tissues adjacent to the injury with no or negligible edema (ATNE), and contralesional brain tissue. A linear mixed model was used to analyze the evolution of metabolites in perihematomal tissues, with p-value < 0.05 indicating statistical significance.
Results: The perihematoma volume gradually decreased from 2.38 ± 1.23 ml to 0.41 ± 0.780 ml (p < 0.001) over 2 weeks. Significant (p < 0.001) reductions in NAA, Cr, and Cho concentrations were found in the PHE and ATNE regions compared to the contralesional hemisphere at day 1 and 7 after ICH. All three metabolites were significantly (p < 0.001) restored in the PHE tissue on day 14, but remained persistently low in the ATNE area, and unaltered in the contralesional voxel.
Conclusion This study highlights the potential of MRS to probe salvageable tissues within the perihematoma in the sub-acute phase of ICH. Altered metabolites within the PHE and ATNE regions in addition to edema and hematoma volumes were explored as possible markers for tissue recovery. Perihematomal tissue with PHE demonstrated a more reversible injury compared to the tissue adjacent to the injury without edema, suggesting a potentially beneficial role of edema.
Introduction
Intracerebral hemorrhage (ICH) often results in hemiparesis or hemiplegia. ICH accounts for about 10–15% of all strokes, and is associated with a high mortality and long-term disability rate (Feigin et al., 2009). ICH-induced deaths may occur within hours to days of the ictus (Feigin et al., 2009; Hemphill et al., 2015). The sequelae of ICH pathogenesis consist of primary injury with the rupture of blood vessels, physical compression, and disruption of brain tissues by the expanding blood mass. The secondary injury is associated with hematoma toxicity, oxidative stress, neuroinflammation, blood-brain barrier disruption, and consequent robust edema Perihematomal edema (PHE) (Wagner et al., 2003; Cherubini et al., 2005; Babu et al., 2012; Selim and Sheth, 2015; Lim-Hing and Rincon, 2017; Bernstein et al., 2018).
Initial cytotoxic edema progresses into mainly vasogenic edema, which is coupled with extravasation of blood fluid that contains plasma proteins, and has been proposed to contribute to additional injury (Xi et al., 2001; Keep et al., 2012a; Selim and Norton, 2018). One study reported a significant proportion of swollen cells in the inner and outer rims of the perihematoma with a small proportion of shrunken dark cells within 24 h after onset (Qureshi et al., 2001). ICH-induced neuroinflammation has been characterized by the presence of neutrophils, microglia, and macrophage/monocyte around the hemorrhagic foci (Castejon et al., 2005; Bakhshayesh et al., 2014; Zhao et al., 2007, 2017; Zhang et al., 2017). The location, expansion and retraction of hematoma and PHE volumes are used as a prognostic tool in humans and rodents (Aronowski and Hall, 2005; Falcone et al., 2013; Grunwald et al., 2017; Al-Shahi Salman et al., 2018; Klahr et al., 2018; Volbers et al., 2018). Because of the clinical importance of PHE, there is great interest to understand the pathophysiology and develop therapeutic agents targeting PHE. Serial and cross-sectional neuroimaging studies have reported a reduction of edema over time (Murthy et al., 2016; Ozdinc et al., 2016; Rodriguez-Luna et al., 2016; Liu et al., 2019), however, there is little known about the functional and structural restoration of those tissues after edema resolution.
N-acetylaspartate (NAA), choline (Cho), and creatine (Cr) are three major brain metabolites, seen on proton magnetic resonance spectroscopy (MRS) (1H-MRS), which are often used as surrogate markers of neuronal health, cell proliferation, and cellular energy, respectively (Prado et al., 2002; Madhavarao and Namboodiri, 2006; Rigotti et al., 2007; Rackayova et al., 2017). Alterations in these metabolites were documented in patients with ischemic stroke, providing useful markers of tissue health (Fenstermacher and Narayana, 1990; Felber et al., 1992; Kang et al., 2000; Bivard et al., 2014). However, only a limited number of reports characterized these changes in patients with ICH (Kobayashi et al., 2001). Wagner reported a significant reduction in NAA in patients with a subarachnoid hemorrhage and Kobayashi reported a reduction in the ipsilesional NAA/Cr ratio in the motor cortex in patients with poor outcomes (Kobayashi et al., 2001; Wagner et al., 2013). Another study also demonstrated a significant reduction in NAA/Cr ratio in the primary motor cortices remote from the locus of injury (Yang et al., 2017). However, only few neuroimaging studies investigated metabolic changes in the PHE. Two studies by Carhuapoma et al. (2000, 2005) reported the presence of lactate and increased apparent diffusion coefficient in the PHE regions in ICH patients. In an animal study, Yin et al. (2006) showed significant apoptosis and reduction in NAA/Cr ratio in the PHE within 24 h of ICH onset. However, to the best of our knowledge, no study used spectroscopy to probe metabolic activities of the perihematoma region during post-ICH recovery, especially to understand the fate of peri-hematomal tissue regarding its functional recovery vs. irreversible damage.
The primary objective of this study was to assess the metabolic integrity of the perihematoma region over 2 weeks after injury using the ICH pig model. We used non-invasive MRS to probe neuronal viability/functionality in the perihematoma and the tissue adjacent to the injury with no apparent edema.
Materials and Methods
Animal studies were approved by our institution’s Animal Welfare Committee. The studies followed the guidelines outlined in the Guide for the Care and Use of Laboratory Animals from the National Institutes of Health.
Induction of ICH
Fourteen male Yorkshire pigs were studied with average age/weight of 8 ± 2 weeks/13.4 ± 2.4 kg. Procedural details were described elsewhere (Haque et al., 2018). Briefly, animals were sedated with ketamine (25 mg/kg, IM) and maintained under isoflurane throughout surgery. During the surgery, animals were wrapped in a blanket (to maintain body temperature), intubated, and catheterized to monitor physiological variables. To produce lobar ICH, a cranial burr hole was drilled 11 mm to the right of the sagittal and 11 mm anterior to the coronal suture. Hemorrhage was induced by pressure controlled infusion of autologous blood into the right frontal hemisphere, first 1.0 mL infused over 10 min followed by additional 1.5 ml after a 5 min interval.
Image Acquisition
Pigs were serially imaged on 1, 7, and 14 days after the surgery. During imaging, animals were ventilated with an average of 18 breaths-per-minute with maximum airway pressure of 20 cm-H2O, oxygen saturation level (SpO2) of 97%, typical end-tidal CO2 of 47 mmHg, heart rate 120 beats-per-minute, and body temperature 98.6°C. Anesthesia was maintained with 2% isoflurane mixed with oxygen.
Animals were positioned prone in 3.0 Tesla Philips Ingenia MRI system (Philips, Best, Netherlands) and imaged using an eight-channel head coil. Anatomical imaging included: 3D T1-weighted (TR/TE = 10/4.8 ms), 3D coronal T2-weighted (TR/TE = 3500/267 ms), and 3D fluid attenuated inversion recovery (FLAIR, TR/TI/TE = 4800/1650/129 ms) with a field-of-view of 200 × 200 × 86 mm3. Multivoxel spectral data were obtained using point resolved spectroscopy (PRESS)-localized two-dimensional chemical shift imaging (CSI) with TR/TE = 2000/144 ms, matrix size = 9 × 9, bandwidth = 2000 Hz, and voxel size = 15 × 15 × 15 mm3.
Spectral Analysis and Metabolite Quantification
All spectral integration and phase correction were performed manually using in-house software in Matlab (The Mathworks, Natick, MA, United States). The metabolite peaks at 2.01, 3.03, 3.19 ppm were referenced to NAA, Cr, and Cho, respectively, with respect to the unsuppressed water signal at 4.7 ppm. The absolute concentration of the metabolites was quantified using the unsuppressed water peak as an internal reference (Ernst et al., 1993; Kreis et al., 1993) with T1 and T2 correction for metabolite and water using the following equation:
where Cm is metabolite concentration, Am (Aw) is the area under the metabolite (water) peak, T1m (T1w) is the longitudinal relaxation time of metabolite (water), T2m (T2w) is the transverse relaxation time of metabolite (water), Nm (Nw) is the number of hydrogen atoms in the metabolite (water) molecule, TR is the repetition time, TE is echo time, and Cw is the reference water concentration in tissue. Previously reported T1m, T1w, T2m, T2w, and Cw at 3T systems were used in the calculation (Reyngoudt et al., 2010). Concentration is reported in milli-mole (mM) units.
To characterize biochemical events in brain tissue directly affected by ICH, we identified one voxel within the PHE, ATNE, and contralesional hemisphere and measured its absolute metabolite concentrations.
Lesion Volume Measurements
A semi-automated seed growing algorithm in Analyze 12.0 (Analyze Direct, Inc., KS, United States) was used to measure edema and hematoma volume on FLAIR images by a single rater. The rater selected two seed points within the hyperintense edema and hypointense hematoma and a region-growing algorithm automatically expanded the seed points within the 3D space of the image. Manual editing of the lesion volume was done when necessary.
Statistical Analysis
Cerebral metabolite concentrations were analyzed by the mixed model (Littell et al., 1998). The fixed effects in the model included brain regions (PHE, PHNE and contralesional), polychotomous time (1, 7, and 14 days), and interaction between hemisphere and polychotomous time. The random effects in the model included animal and interaction between animal and brain regions. These random effects led to a nested covariance matrix accounting for correlation of measurements due to the same animal and a different level of correlation for measurements due to the same hemisphere of the brain. The edema and hematoma volume were analyzed by the mixed models including polychotomous time as a fixed effect and animal as a random effect. Two-sided p-values of less than 0.05 were considered statistically significant. All statistical analyses were performed using the SAS software (version 9.4, the SAS Institute, Cary, NC, United States).
Results
Twelve pigs completed all three imaging time points. One pig died during imaging on day 1 and was excluded from the analysis. Another pig died one day prior to the last imaging on day 14.
Representative MRI images demonstrating changes in the PHE region and hematoma volumes at three time points in a representative pig are shown in Figure 1. The computer calculated region of interest (ROIs) showing the boundaries were used to calculate the intracranial (ICV), hematoma, and edema volumes. There was no statistically significant change in ICV between day 1 (70.3 ± 6.5 ml), day 7 (72.9 ± 7.6 ml), and day 14 (74.2 ± 7.6 ml). ICH resulted in a 2.38 ± 1.23 ml PHE on day 1 that progressively resolved over the course of 2 weeks, reducing by 23.1% on day 7 and by 82.7% on day 14 (p < 0.001) (Figure 1D). Our model of ICH generated a hematoma volume of 1.00 ± 0.79 ml on day 1 after the surgery. The hematoma underwent progressive clearance and was reduced by 15.7% on day 7 and by 38.3% on day 14 (p < 0.001), as compared to day 1 (Figure 1E), indicating effective hematoma clearance.
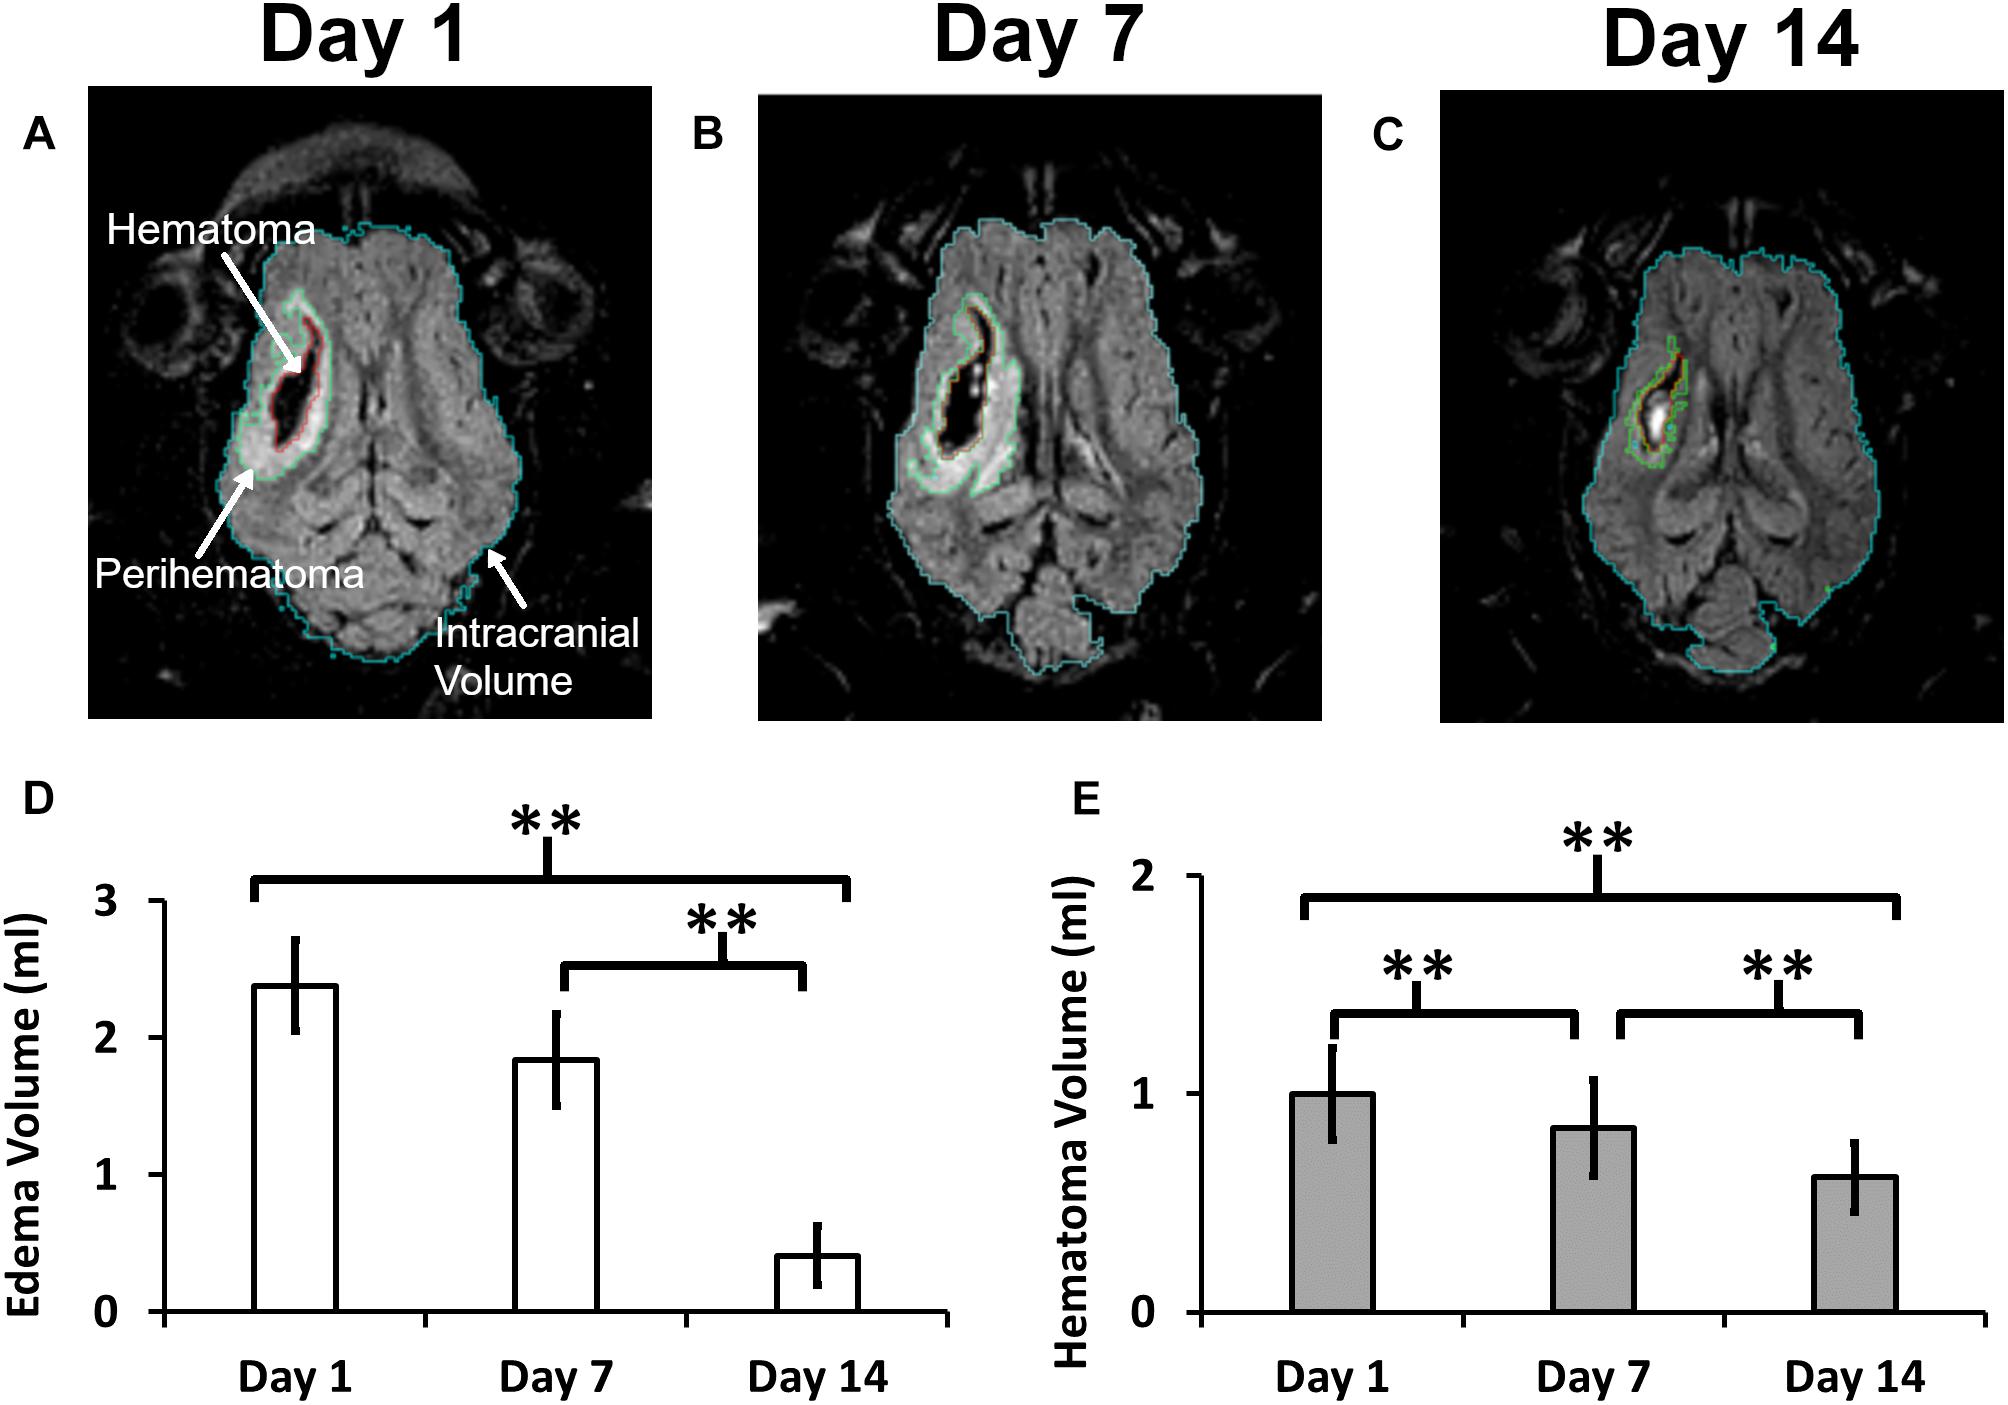
Figure 1. A quantitative summary of the change in hematoma and edema volume in a post-ICH pig brain. Panels (A–C) illustrate a representative MRI image showing outlined boundaries of intracranial volume, perihematoma, and hematoma at days 1, 7, and 14, respectively. Panels (D,E) show Perihematoma edema (D) and hematoma (E) volumes. A double asterisk (∗∗) denotes the significant temporal ipsilesional difference between the time point (p < 0.05). The error bars represent standard error in the mean.
Representative anatomical locations of MRS data collection are illustrated in Figures 2A–C. The locations were similarly applied across all 13 analyzed pigs and were selected on day 1 to signify presence of PHE, adjacent non-edematous tissues (ATNE), and the contralesional brain tissue. Our analyses demonstrate a clear pattern of metabolite loss around the hematoma at day 1 after ICH with strong restoration of NAA and Cho concentrations in the PHE, and unexpectedly poor restoration of all the metabolites in ATNE tissue, as assessed on day 7 and day 14 (Figures 2D–L). Specifically, the NAA concentration in both PHE and ATNE regions was reduced (p < 0.001) in response to ICH, as compared to contralesional tissue on day 1 and day 7 (Figure 3A), suggesting that ICH imposes dysfunction that affects neurons in the perilesional brain. The loss in NAA was transient in the PHE regions, as NAA was largely restored by day 14. Unexpectedly, NAA in the ATNE was still reduced 2 weeks after ICH, suggesting the more permanent nature of injury/dysfunction in the region containing no edema than in the regions spared by edema. The NAA concentration in PHE recovered from 9.70 ± 2.7 mM at day 1 to 14.79 ± 2.5 mM (p < 0.001) at day 14, values equivalent to NAA levels in the contralesional region. However, there was virtually no recovery in NAA content in the ATNE between day 1 and 14 (9.45 ± 3.1 vs. 9.99 ± 2.1 mM, p = 0.51). There was no change in NAA content in contralesional regions (13.7 ± 2.1 vs. 14.5 ± 2.0, p = 0.36) between the first and last time points.
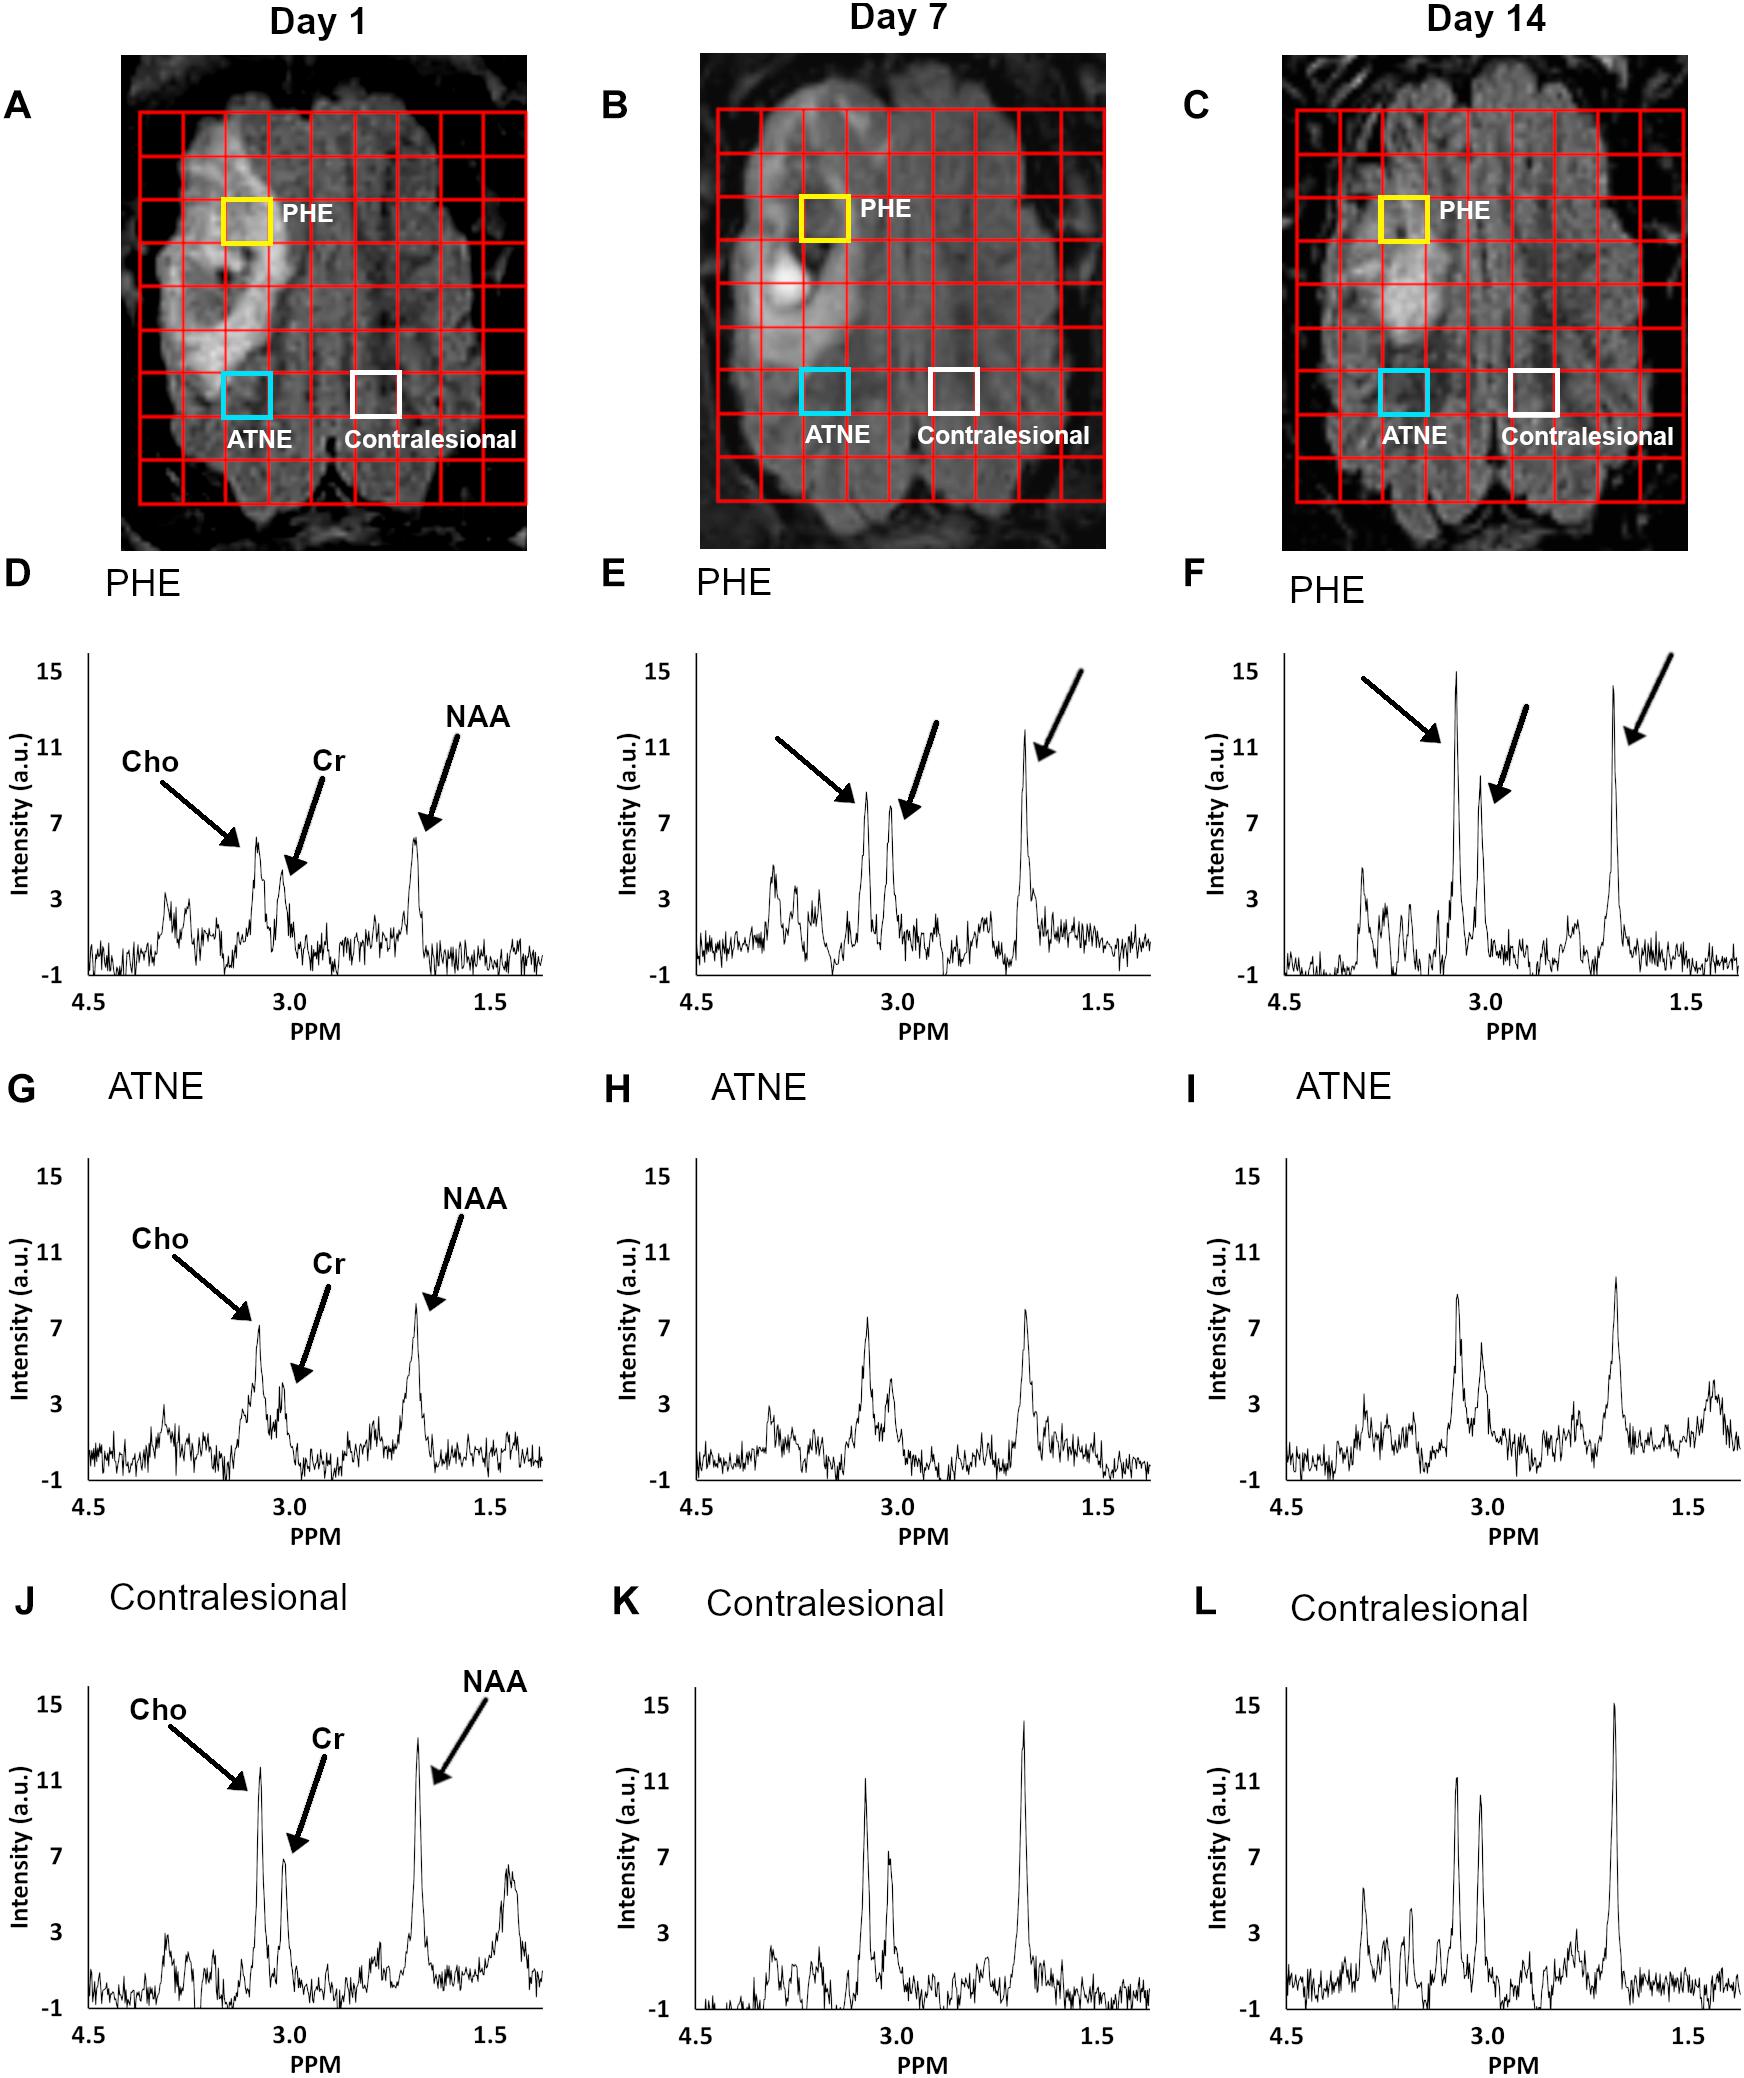
Figure 2. Serial FLAIR MRI images overlaid with a multi-voxel grid of corresponding temporal spectra with highlighted voxels of interest (A–C). Panels (A–C) show the PHE, ATNE, and contralesional voxel location at day 1, 7, and 14, respectively, from which the metabolite spectra were measured. MR spectroscopy graphs at days 1, 7, and 14 (columns) are shown for voxels from the PHE (D–F), ATNE (G–I), and the contralesional regions (J–L).
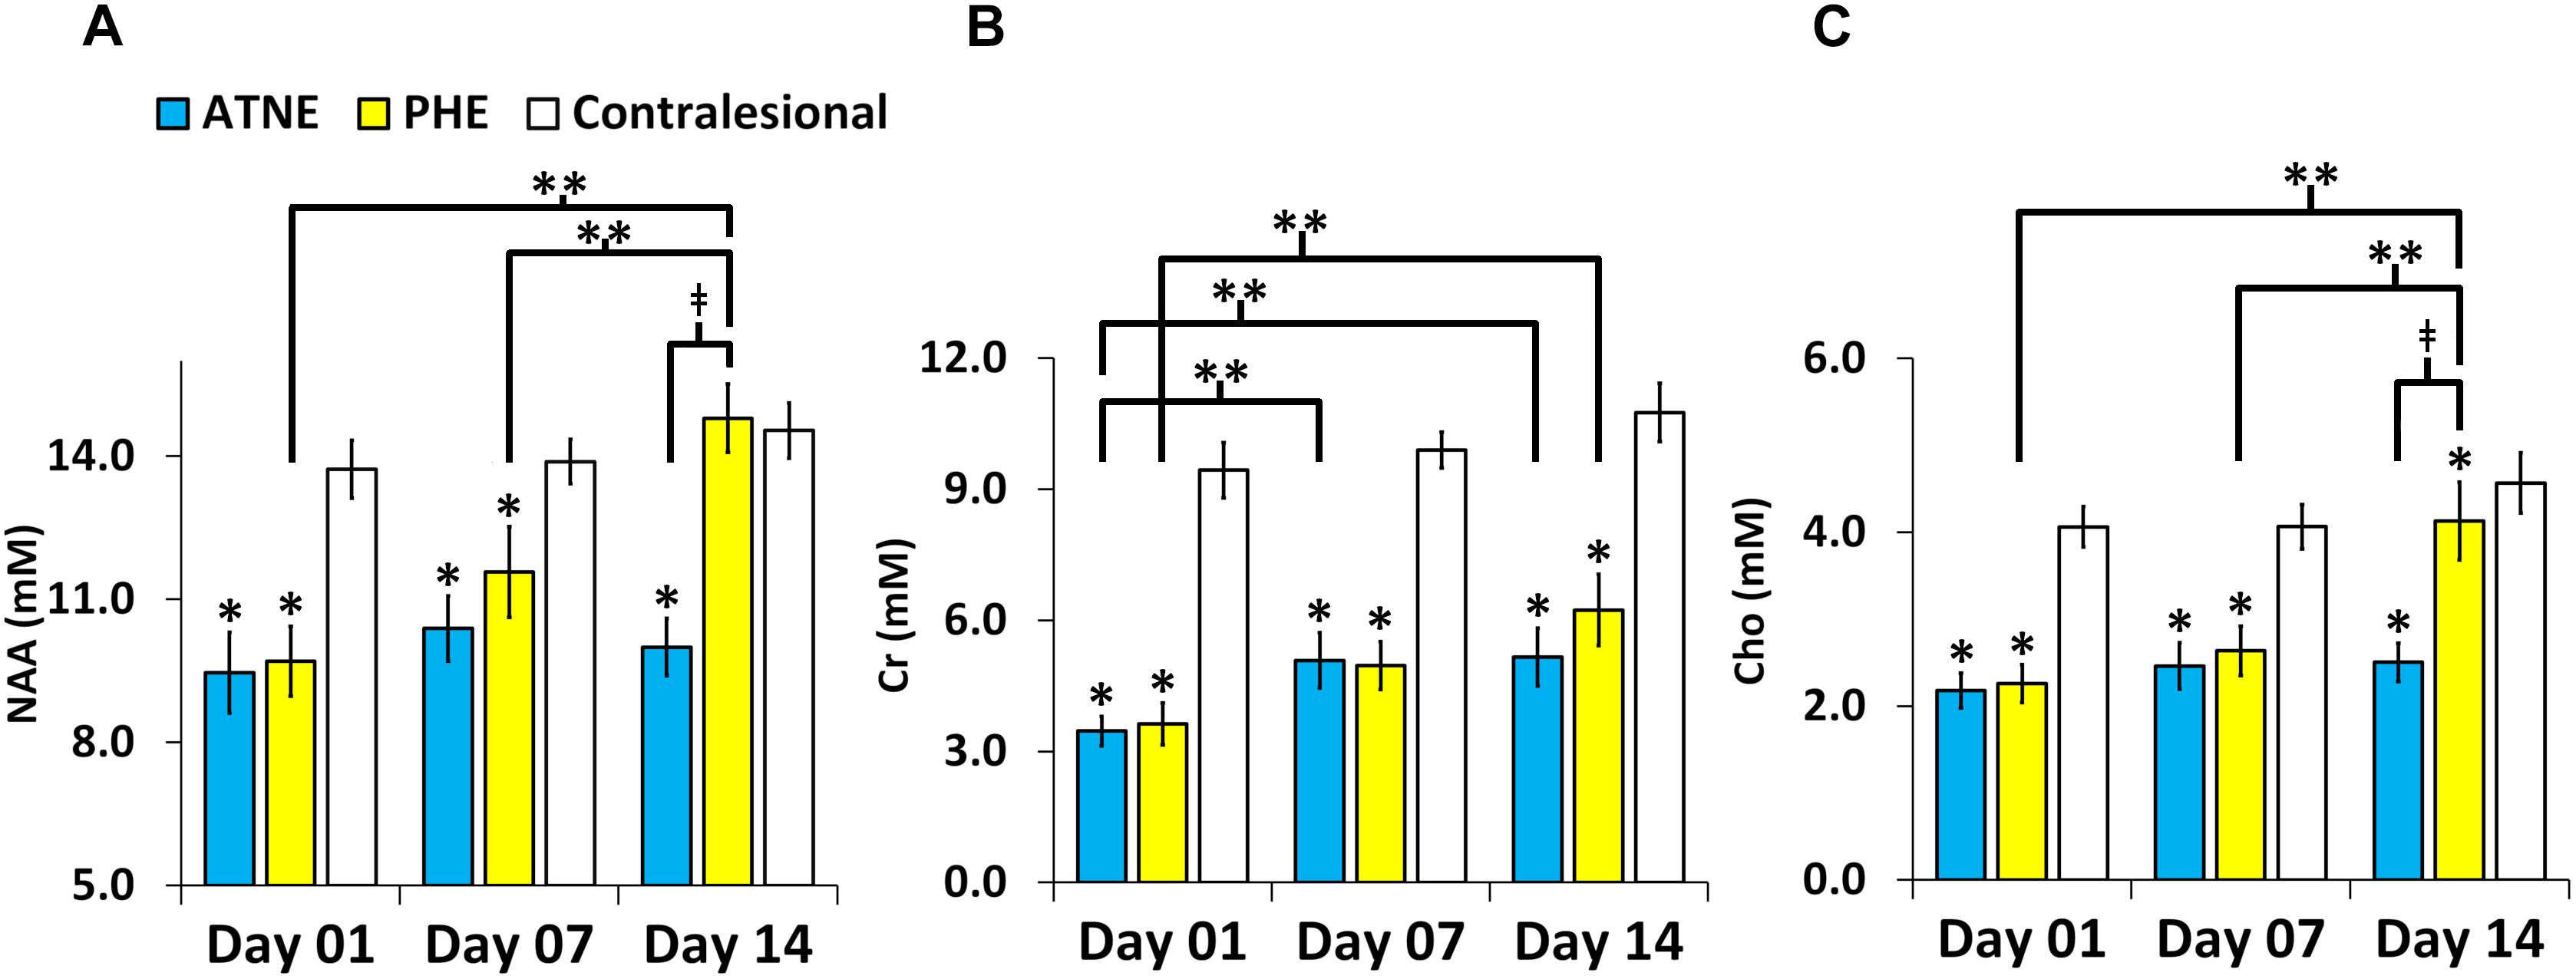
Figure 3. Metabolite concentration in the perihematomal edema (PHE), adjacent tissues with no edema (ATNE), and contralesional voxels over two week follow-up post ICH. (A–C) Represent serial NAA, Cr, and Cho concentrations, respectively. The asterisk (∗) denotes significant (p < 0.001) hemispheric differences, the double asterisk (∗∗) denotes significant (p < 0.001) temporal difference and (‡) denotes significant (p < 0.001) change between PHE and ATNE. The error bars represent standard error in the mean.
As compared to the contralesional tissue, the Cr concentration in response to ICH was reduced (p < 0.001) within both the PHE and ATNE regions and remained reduced for 14 days, through the end of the experiment (Figure 3B). Unlike in the case of NAA, which was fully restored, Cr levels both in PHE and ATNE were only partially restored (3.62 ± 1.7 mM to 6.23 ± 2.9 mM; p = 0.001 for PHE and 3.46 ± 1.2 vs. 5.15 ± 2.4 mM, p = 0.023 for ATNE) 14 days after ICH as compared to contralesional tissue that was not affected by ICH (9.43 ± 2.2 mM vs. 10.7 ± 2.3 mM, p = 0.08).
Cho concentrations in the PHE and ATNE were also sharply reduced as determined on day 1 and 7 after ICH (p < 0.001), compared to the contralesional side (Figure 3C). The Cho levels were restored by day 14 in the PHE, but no signs of recovery were seen at this time point in ATNE. Cho concentration was unchanging in the contralesional side throughout the experiment.
There was no significant correlation between hematoma and edema volume with NAA, Cr, and Cho in all three spectroscopic voxel locations. No change was seen in the ratio of water signals between PHE, ATNE, and the contralesional side over time (P = NS), suggesting that the observed patterns of metabolic alterations are not due to changes in the reference tissue water content.
Discussion
It is generally accepted that autologous blood infusion animal models provide a strong translational platform for studying the pathogenesis of ICH and testing therapeutic approaches (Wagner et al., 1999; Andaluz et al., 2002; Gu et al., 2009). The present study evaluated temporal metabolic changes in the perihematoma region using MRS in a piglet model of ICH. As compared to the rodent models of ICH, the larger brain size of piglets and thus ability to generate larger hematoma aids in the more qualitative and quantitative analyses of the changes in the perihematomal regions. Our present study compared metabolic heterogeneity in the perihematomal/ICH-adjacent tissue, sampled to capture metabolites within the edema-affected tissue (PHE) and the location devoid of edema (ATNE). We found that the concentrations of three measured metabolites (NAA, Cho and Cr) were reduced as early as day 1 after ICH in both PHE and ATNE regions. However, over the course of 14 days these metabolites were largely restored in the PHE, but not in the ATNE. These data suggest the potential of MR spectroscopy to identify salvageable tissue around the hematoma. Since perihematomal tissue demonstrating edema recovered more effectively from metabolic disturbances, our data may suggest that edema could play a homeostatic role regarding integrity of perihematomal tissue.
NAA and N-Acetylaspartylglutamate (NAAG) are both synthetized by neurons in the brain and upon secretion are internalized and metabolized by glial cells (Baslow, 2010). Both NAA and NAAG produce overlapping magnetic resonance spectral peaks at 2.01 ppm, not permitting differentiation between the individual metabolites. The consensus is that NAA concentration is a total (NAA ++ NAAG) concentration. Reduction of NAA concentration typically reflects some types of neuronal dysfunction or direct neuronal loss. Since ICH is known to produce extensive brain damage either through mass effect-mediated injury or through biochemical-mediated injury via toxic products of blood, blood-brain-barrier disruption, and brain edema (Aronowski and Zhao, 2011; Keep et al., 2012b; Bobinger et al., 2018), neurons surrounding the hematoma are adversely affected by ICH. Thus, it is not surprising that NAA levels in tissue close to the hematoma both in areas with and without edema show significant reduction at day 1 after ICH. However, the essential question is whether this early neuronal injury is transient and associated with reversible damage. Our results indicate that NAA gradually recovered in the PHE but not in the ATNE. Ultimately, these results suggest that neural tissue integrity, at least in the PHE region, is retained after ICH. The irreversible decline of NAA in the ATNE suggests more permanent metabolic dysfunction or neuronal loss. Our data also raise the possibility that the presence of edema could provide a protective cushioning from irreversible damage.
Creatine is a key molecule in the regulation of energy metabolism in the brain and is responsible for re-synthesis of ATP in glial cells (Rackayova et al., 2017). Here we found a significant loss of Cr levels in both the PHE and ATNE regions, suggesting either higher cellular energy demand-mediated depletion of (increased catabolism) Cr and/or its reduced synthesis. In contrast to the transient nature of NAA reduction in the PHE region, the Cr level decline was more sustained and still significantly reduced in both the PHE and ATNE regions at 14 days after ICH. However, over time a weak increasing trend of Cr concentration in both the PHE and ATNE regions suggests regional variance in metabolic dysfunction around the injury. Often, Cr levels are presumed to be constant and have been utilized as a normalizing factor in reporting metabolite concentrations. While this assumption is valid for a healthy brain, under certain pathological conditions Cr levels are altered (Burklen et al., 2006; Andres et al., 2008), including in our study. Thus, appropriate caution must be taken using Cr as a constant value under pathological conditions and reporting metabolite concentrations relative to Cr.
Unlike other pathologies where an elevated concentration of choline has been recognized as a marker of progressive pathologies (Fayed et al., 2008; Karaszewski et al., 2010), here we are reporting a significant reduction in choline in both the PHE and ATNE during the first 7 days after ICH onset. By day 14, choline is restored in the PHE but not in the ATNE region, suggesting transient and sustainable metabolic dysfunction, respectively. Choline, which is localized in all types of cells, serves as a marker for overall membrane integrity, and as such in reference to our study, suggests that the integrity of cell membranes varies around brain tissue surrounding the hematoma. Previously in ischemic stroke animal studies an inverse relation between regional cerebral blood flow (CBF) and choline concentration had been documented (Scremin and Jenden, 1991). The relation between regional metabolic variation and CBF in the ICH model will be further investigated in the future. In addition, the changes in all three metabolite concentrations over time in the PHE, as compared to the absence of changes in the contralesional hemisphere, not only validate the methodology but also suggests a hemispheric rather than global compromise in response to ICH in this model.
In our piglet ICH model, we attempted to generate a modest size hematoma that results in a modest level of edema, which did not result in midline shift or cause too severe mass effect that inflicts irreversible injury and morbidity, as it happens in many humans with large bleeds. This approach allowed for more “uncontaminated” probing of the metabolic characteristics in the perihematomal zone, specifically edema-affected brain tissue vs. perihematomal non-edematous brain tissue. Here, we unexpectedly found the more effective reversal of metabolite levels in the PHE regions as compared to the non-edematous tissue. We certainly predict that the mild edema is beneficial and not detrimental compared to larger degrees of peri-hematoma edema, which leads to compression of local microvasculature resulting in hypoperfusion and compression of white matter tract resulting in anomalous nerve conduction. Collectively, this data may suggest potential beneficial function for mild edema in re-establishing homeostasis in peri-hematoma tissue after ICH.
Our study is limited by a small sample size and will need to be reproduced in larger studies. Another limitation is the variation in edema volume among animals induces partial volume effects in the PHE voxels with normal appearing tissues. In addition, the evolution of hematoma over time also complicates voxel placement and induces partial volume effects. Validation of our findings will require additional studies including PHE tissue histology and in vitro metabolite concentration measurements using mass spectrometry or High Performance Liquid Chromatography (HPLC).
In conclusion, this study demonstrated the possible application of MR spectroscopy in monitoring the sub-acute phase of ICH to identify salvageable tissue in the perihematoma region. Also, reversible metabolic recovery in the PHE as compared to the tissue adjacent to the injury without edema, suggesting the potentially beneficial role of edema.
Data Availability
The datasets generated for this study are available on request to the corresponding author.
Ethics Statement
Animal studies were approved by our institution’s Animal Welfare Committee. The studies followed the guidelines outlined in the Guide for the Care and Use of Laboratory Animals from the National Institutes of Health.
Author Contributions
MH designed the study, carried out MRI quantitative analysis, and drafted the manuscript. RG wrote Matlab code for spectral integration and assisted in optimizing MRI acquisition. XiZ induced hematoma and supervised the surgery. SG and SB performed regions of interest analysis and generated final plots and figures. KH provided qualitative and quantitative quality assurance of data analysis. XuZ performed statistical analysis. S-MT and GS performed animal surgery. SS supervised the study, edited manuscript, and provided necessary resources. JA is the PI of the study.
Funding
This work was supported by National Institute of Health/National Institute of Neurological Disorders and Stroke 5R42NS090650-03.
Conflict of Interest Statement
The authors declare that the research was conducted in the absence of any commercial or financial relationships that could be construed as a potential conflict of interest.
Acknowledgments
The authors thank Dr. Christopher Smith and veterinarian team for surgical and technical assistance and Mr. Vipulkumar Patel for help with MRI experiments.
References
Al-Shahi Salman, R., Frantzias, J., Lee, R. J., Lyden, P. D., Battey, T. W. K., Ayres, A. M., et al. (2018). Absolute risk and predictors of the growth of acute spontaneous intracerebral haemorrhage: a systematic review and meta-analysis of individual patient data. Lancet Neurol. 17, 885–894. doi: 10.1016/S1474-4422(18)30253-9
Andaluz, N., Zuccarello, M., and Wagner, K. R. (2002). Experimental animal models of intracerebral hemorrhage. Neurosurg. Clin. N Am. 13, 385–393. doi: 10.1016/s1042-3680(02)00006-2
Andres, R. H., Ducray, A. D., Schlattner, U., Wallimann, T., and Widmer, H. R. (2008). Functions and effects of creatine in the central nervous system. Brain Res. Bull. 76, 329–343. doi: 10.1016/j.brainresbull.2008.02.035
Aronowski, J., and Hall, C. E. (2005). New horizons for primary intracerebral hemorrhage treatment: experience from preclinical studies. Neurol. Res. 27, 268–279. doi: 10.1179/016164105x25225
Aronowski, J., and Zhao, X. (2011). Molecular pathophysiology of cerebral hemorrhage: secondary brain injury. Stroke 42, 1781–1786. doi: 10.1161/STROKEAHA.110.596718
Babu, R., Bagley, J. H., Di, C., Friedman, A. H., and Adamson, C. (2012). Thrombin and hemin as central factors in the mechanisms of intracerebral hemorrhage-induced secondary brain injury and as potential targets for intervention. Neurosurg. Focus 32:E8. doi: 10.3171/2012.1.FOCUS11366
Bakhshayesh, B., Hosseininezhad, M., Saadat, S. N., Ansar, M. M., Ramezani, H., and Saadat, S. M. (2014). Iron overload is associated with perihematoma edema growth following intracerebral hemorrhage that may contribute to in-hospital mortality and long-term functional outcome. Curr. Neurovasc. Res. 11, 248–253. doi: 10.2174/1567202611666140530124855
Baslow, M. H. (2010). Evidence that the tri-cellular metabolism of N-acetylaspartate functions as the brain’s “operating system”: how NAA metabolism supports meaningful intercellular frequency-encoded communications. Amino Acids 39, 1139–1145. doi: 10.1007/s00726-010-0656-6
Bernstein, J. E., Savla, P., Dong, F., Zampella, B., Wiginton, J. G. T., Miulli, D. E., et al. (2018). Inflammatory markers and severity of intracerebral hemorrhage. Cureus 10:e3529. doi: 10.7759/cureus.3529
Bivard, A., Krishnamurthy, V., Stanwell, P., Yassi, N., Spratt, N. J., Nilsson, M., et al. (2014). Spectroscopy of reperfused tissue after stroke reveals heightened metabolism in patients with good clinical outcomes. J. Cereb. Blood Flow Metab. 34, 1944–1950. doi: 10.1038/jcbfm.2014.166
Bobinger, T., Burkardt, P., Huttner, B. H., and Manaenko, A. (2018). Programmed cell death after intracerebral hemorrhage. Curr. Neuropharmacol. 16, 1267–1281. doi: 10.2174/1570159X15666170602112851
Burklen, T. S., Schlattner, U., Homayouni, R., Gough, K., Rak, M., Szeghalmi, A., et al. (2006). The creatine kinase/creatine connection to Alzheimer’s disease: CK-inactivation. APP-CK complexes and focal creatine deposits. J. Biomed Biotechnol. 2006:35936. doi: 10.1155/JBB/2006/35936
Carhuapoma, J. R., Wang, P., Beauchamp, N. J., Hanley, D. F., and Barker, P. B. (2005). Diffusion-perfusion MR evaluation and spectroscopy before and after surgical therapy for intracerebral hemorrhage. Neurocrit. Care 2, 23–27. doi: 10.1385/NCC:2:1:023
Carhuapoma, J. R., Wang, P. Y., Beauchamp, N. J., Keyl, P. M., Hanley, D. F., and Barker, P. B. (2000). Diffusion-weighted MRI and proton MR spectroscopic imaging in the study of secondary neuronal injury after intracerebral hemorrhage. Stroke 31, 726–732. doi: 10.1161/01.str.31.3.726
Castejon, O. J., Castellano, A., Arismendi, G. J., and Medina, Z. (2005). The inflammatory reaction in human traumatic oedematous cerebral cortex. J. Submicrosc. Cytol. Pathol. 37, 43–52.
Cherubini, A., Ruggiero, C., Polidori, M. C., and Mecocci, P. (2005). Potential markers of oxidative stress in stroke. Free Radic. Biol. Med. 39, 841–852. doi: 10.1016/j.freeradbiomed.2005.06.025
Ernst, T., Lee, J. H., and Ross, B. D. (1993). Direct 31P imaging in human limb and brain. J. Comput. Assist. Tomogr. 17, 673–680. doi: 10.1097/00004728-199309000-00001
Falcone, G. J., Biffi, A., Brouwers, H. B., Anderson, C. D., Battey, T. W., Ayres, A. M., et al. (2013). Predictors of hematoma volume in deep and lobar supratentorial intracerebral hemorrhage. JAMA Neurol. 70, 988–994. doi: 10.1001/jamaneurol.2013.98
Fayed, N., Davila, J., Medrano, J., and Olmos, S. (2008). Malignancy assessment of brain tumours with magnetic resonance spectroscopy and dynamic susceptibility contrast MRI. Eur. J. Radiol. 67, 427–433. doi: 10.1016/j.ejrad.2008.02.039
Feigin, V. L., Lawes, C. M., Bennett, D. A., Barker-Collo, S. L., and Parag, V. (2009). Worldwide stroke incidence and early case fatality reported in 56 population-based studies: a systematic review. Lancet Neurol. 8, 355–369. doi: 10.1016/S1474-4422(09)70025-0
Felber, S. R., Luef, G. J., Birbamer, G. G., Aichner, F. T., and Gerstenbrand, F. (1992). Magnetic resonance studies in stroke. Lancet 339, 879–880. doi: 10.1016/0140-6736(92)90328-z
Fenstermacher, M. J., and Narayana, P. A. (1990). Serial proton magnetic resonance spectroscopy of ischemic brain injury in humans. Invest. Radiol. 25, 1034–1039. doi: 10.1097/00004424-199009000-00016
Grunwald, Z., Beslow, L. A., Urday, S., Vashkevich, A., Ayres, A., Greenberg, S. M., et al. (2017). Perihematomal edema expansion rates and patient outcomes in deep and lobar intracerebral hemorrhage. Neurocrit. Care 26, 205–212. doi: 10.1007/s12028-016-0321-3
Gu, Y., Hua, Y., Keep, R. F., Morgenstern, L. B., and Xi, G. (2009). Deferoxamine reduces intracerebral hematoma-induced iron accumulation and neuronal death in piglets. Stroke 40, 2241–2243. doi: 10.1161/STROKEAHA.108.539536
Haque, M. E., Gabr, R. E., Zhao, X., Hasan, K. M., Valenzuela, A., Narayana, P. A., et al. (2018). Serial quantitative neuroimaging of iron in the intracerebral hemorrhage pig model. J. Cereb. Blood Flow Metab. 38, 375–381. doi: 10.1177/0271678X17751548
Hemphill, J. C., Greenberg, S. M., Anderson, C. S., Becker, K., Bendok, B. R., Cushman, M., et al. (2015). Guidelines for the management of spontaneous intracerebral hemorrhage: a guideline for healthcare professionals from the American heart Association/American Stroke Association. Stroke 46, 2032–2060. doi: 10.1161/str.0000000000000069
Kang, D. W., Roh, J. K., Lee, Y. S., Song, I. C., Yoon, B. W., and Chang, K. H. (2000). Neuronal metabolic changes in the cortical region after subcortical infarction: a proton MR spectroscopy study. J. Neurol. Neurosurg. Psychiatry 69, 222–227. doi: 10.1136/jnnp.69.2.222
Karaszewski, B., Thomas, R. G., Chappell, F. M., Armitage, P. A., Carpenter, T. K., Lymer, G. K., et al. (2010). Brain choline concentration. Early quantitative marker of ischemia and infarct expansion?. Neurology 75, 850–856. doi: 10.1212/WNL.0b013e3181f11bf1
Keep, R. F., Hua, Y., and Xi, G. (2012a). Brain water content. A misunderstood measurement? Transl. Stroke Res. 3, 263–265. doi: 10.1007/s12975-012-0152-2
Keep, R. F., Hua, Y., and Xi, G. (2012b). Intracerebral haemorrhage: mechanisms of injury and therapeutic targets. Lancet Neurol. 11, 720–731. doi: 10.1016/s1474-4422(12)70104-7
Klahr, A. C., Kate, M., Kosior, J., Buck, B., Shuaib, A., Emery, D., et al. (2018). Early hematoma retraction in intracerebral hemorrhage is uncommon and does not predict outcome. PLoS One 13:e0205436. doi: 10.1371/journal.pone.0205436
Kobayashi, M., Takayama, H., Suga, S., and Mihara, B. (2001). Longitudinal changes of metabolites in frontal lobes after hemorrhagic stroke of basal ganglia: a proton magnetic resonance spectroscopy study. Stroke 32, 2237–2245. doi: 10.1161/hs1001.096621
Kreis, R., Ernst, T., and Ross, B. D. (1993). Development of the human brain: in vivo quantification of metabolite and water content with proton magnetic resonance spectroscopy. Magn. Reson. Med. 30, 424–437. doi: 10.1002/mrm.1910300405
Lim-Hing, K., and Rincon, F. (2017). Secondary hematoma expansion and perihemorrhagic edema after intracerebral hemorrhage: from bench work to practical aspects. Front. Neurol. 8:74. doi: 10.3389/fneur.2017.00074
Littell, R. C., Henry, P. R., and Ammerman, C. B. (1998). Statistical analysis of repeated measures data using SAS procedures. J. Anim. Sci. 76, 1216–1231. doi: 10.2527/1998.7641216x
Liu, R., Li, H., Hua, Y., Keep, R. F., Xiao, J., Xi, G., et al. (2019). Early Hemolysis within human intracerebral hematomas: an MRI study. Transl. Stroke Res. 10, 52–56. doi: 10.1007/s12975-018-0630-2
Madhavarao, C. N., and Namboodiri, A. M. (2006). NAA synthesis and functional roles. Adv. Exp. Med. Biol. 576, 49–66. doi: 10.1007/0-387-30172-0_4
Murthy, S. B., Urday, S., Beslow, L. A., Dawson, J., Lees, K., Kimberly, W. T., et al. (2016). Rate of perihaematomal oedema expansion is associated with poor clinical outcomes in intracerebral haemorrhage. J. Neurol. Neurosurg. Psychiatry 87, 1169–1173. doi: 10.1136/jnnp-2016-313653
Ozdinc, S., Unlu, E., Karakaya, Z., Turamanlar, O., Dogan, N., Isler, Y., et al. (2016). Prognostic value of perihematomal edema area at the initial ED presentation in patients with intracranial hematoma. Am. J. Emerg. Med. 34, 1241–1246. doi: 10.1016/j.ajem.2016.03.048
Prado, M. A., Reis, R. A., Prado, V. F., De Mello, M. C., Gomez, M. V., and De Mello, F. G. (2002). Regulation of acetylcholine synthesis and storage. Neurochem. Int. 41, 291–299. doi: 10.1016/s0197-0186(02)00044-x
Qureshi, A. I., Ling, G. S., Khan, J., Suri, M. F., Miskolczi, L., Guterman, L. R., et al. (2001). Quantitative analysis of injured, necrotic, and apoptotic cells in a new experimental model of intracerebral hemorrhage. Crit. Care Med. 29, 152–157. doi: 10.1097/00003246-200101000-00030
Rackayova, V., Cudalbu, C., Pouwels, P. J. W., and Braissant, O. (2017). Creatine in the central nervous system: from magnetic resonance spectroscopy to creatine deficiencies. Anal. Biochem. 529, 144–157. doi: 10.1016/j.ab.2016.11.007
Reyngoudt, H., De Deene, Y., Descamps, B., Paemeleire, K., and Achten, E. (2010). (1)H-MRS of brain metabolites in migraine without aura: absolute quantification using the phantom replacement technique. MAGMA 23, 227–241. doi: 10.1007/s10334-010-0221-z
Rigotti, D. J., Inglese, M., and Gonen, O. (2007). Whole-brain N-acetylaspartate as a surrogate marker of neuronal damage in diffuse neurologic disorders. AJNR Am. J. Neuroradiol. 28, 1843–1849. doi: 10.3174/ajnr.a0774
Rodriguez-Luna, D., Coscojuela, P., Rubiera, M., Hill, M. D., Dowlatshahi, D., Aviv, R. I., et al. (2016). Ultraearly hematoma growth in active intracerebral hemorrhage. Neurology 87, 357–364. doi: 10.1212/WNL.0000000000002897
Scremin, O. U., and Jenden, D. J. (1991). Time-dependent changes in cerebral choline and acetylcholine induced by transient global ischemia in rats. Stroke 22, 643–647. doi: 10.1161/01.str.22.5.643
Selim, M., and Norton, C. (2018). Perihematomal edema: Implications for intracerebral hemorrhage research and therapeutic advances. J. Neurosci. Res. doi: 10.1002/jnr.24372 [Epub ahead of print].
Selim, M., and Sheth, K. N. (2015). Perihematoma edema: a potential translational target in intracerebral hemorrhage? Transl. Stroke Res. 6, 104–106. doi: 10.1007/s12975-015-0389-7
Volbers, B., Giede-Jeppe, A., Gerner, S. T., Sembill, J. A., Kuramatsu, J. B., Lang, S., et al. (2018). Peak perihemorrhagic edema correlates with functional outcome in intracerebral hemorrhage. Neurology 90, e1005–e1012. doi: 10.1212/WNL.0000000000005167
Wagner, K. R., Sharp, F. R., Ardizzone, T. D., Lu, A., and Clark, J. F. (2003). Heme and iron metabolism: role in cerebral hemorrhage. J. Cereb. Blood Flow Metab. 23, 629–652. doi: 10.1097/01.wcb.0000073905.87928.6d
Wagner, K. R., Xi, G., Hua, Y., Zuccarello, M., De Courten-Myers, G. M., Broderick, J. P., et al. (1999). Ultra-early clot aspiration after lysis with tissue plasminogen activator in a porcine model of intracerebral hemorrhage: edema reduction and blood-brain barrier protection. J. Neurosurg. 90, 491–498. doi: 10.3171/jns.1999.90.3.0491
Wagner, M., Jurcoane, A., Hildebrand, C., Guresir, E., Vatter, H., Zanella, F. E., et al. (2013). Metabolic changes in patients with aneurysmal subarachnoid hemorrhage apart from perfusion deficits: neuronal mitochondrial injury? AJNR Am. J. Neuroradiol. 34, 1535–1541. doi: 10.3174/ajnr.A3420
Xi, G., Hua, Y., Bhasin, R. R., Ennis, S. R., Keep, R. F., and Hoff, J. T. (2001). Mechanisms of edema formation after intracerebral hemorrhage: effects of extravasated red blood cells on blood flow and blood-brain barrier integrity. Stroke 32, 2932–2938. doi: 10.1161/hs1201.099820
Yang, J., Li, Q., Wang, Z., Qi, C., Han, X., Lan, X., et al. (2017). Multimodality MRI assessment of grey and white matter injury and blood-brain barrier disruption after intracerebral haemorrhage in mice. Sci. Rep. 7:40358. doi: 10.1038/srep40358
Yin, X., Zhang, X., Wang, W., Chang, L., Jiang, Y., and Zhang, S. (2006). Perihematoma damage at different time points in experimental intracerebral hemorrhage. J. Huazhong. Univ. Sci. Technolog. Med. Sci. 26, 59–62. doi: 10.1007/bf02828039
Zhang, Z., Zhang, Z., Lu, H., Yang, Q., Wu, H., and Wang, J. (2017). Microglial polarization and inflammatory mediators after intracerebral hemorrhage. Mol. Neurobiol. 54, 1874–1886. doi: 10.1007/s12035-016-9785-6
Zhao, X., Sun, G., Zhang, J., Strong, R., Song, W., Gonzales, N., et al. (2007). Hematoma resolution as a target for intracerebral hemorrhage treatment: role for peroxisome proliferator-activated receptor gamma in microglia/macrophages. Ann. Neurol. 61, 352–362. doi: 10.1002/ana.21097
Keywords: intracerebral hemorrhage, pig ICH model, perihematomal edema, magnetic resonance spectroscopy, serial neuroimaging study
Citation: Haque ME, Gabr RE, George SD, Zhao X, Boren SB, Zhang X, Ting S-M, Sun G, Hasan KM, Savitz S and Aronowski J (2019) Serial Metabolic Evaluation of Perihematomal Tissues in the Intracerebral Hemorrhage Pig Model. Front. Neurosci. 13:888. doi: 10.3389/fnins.2019.00888
Received: 09 May 2019; Accepted: 07 August 2019;
Published: 21 August 2019.
Edited by:
Aurel Popa-Wagner, University Hospital Essen, GermanyReviewed by:
Dazhi Liu, University of California, Davis, United StatesGuodong Cao, University of Pittsburgh, United States
Copyright © 2019 Haque, Gabr, George, Zhao, Boren, Zhang, Ting, Sun, Hasan, Savitz and Aronowski. This is an open-access article distributed under the terms of the Creative Commons Attribution License (CC BY). The use, distribution or reproduction in other forums is permitted, provided the original author(s) and the copyright owner(s) are credited and that the original publication in this journal is cited, in accordance with accepted academic practice. No use, distribution or reproduction is permitted which does not comply with these terms.
*Correspondence: Muhammad E. Haque, TXVoYW1tYWQuRS5IYXF1ZUB1dGgudG1jLmVkdQ==