 Shun Zhang
 Junghun Cho
 Thanh D. Nguyen
 Pascal Spincemaille
 Ajay Gupta
 Wenzhen Zhu
 Yi Wang
- 1Department of Radiology, Tongji Hospital, Tongji Medical College, Huazhong University of Science and Technology, Wuhan, China
- 2Department of Radiology, Weill Cornell Medicine, New York, NY, United States
- 3Department of Biomedical Engineering, Cornell University, Ithaca, NY, United States
MRI-based oxygen extraction fraction imaging has a great potential benefit in the selection of clinical strategies for ischemic stroke patients. This study aimed to evaluate the performance of a challenge-free oxygen extraction fraction (OEF) mapping in a cohort of acute and subacute ischemic stroke patients. Consecutive ischemic stroke patients (a total of 30 with 5 in the acute stage, 19 in the early subacute stage, and 6 in the late subacute stage) were recruited. All subjects underwent MRI including multi-echo gradient echo (mGRE), diffusion weighted imaging (DWI), and 3D-arterial spin labeling (ASL). OEF maps were generated from mGRE phase + magnitude data, which were processed using quantitative susceptibility mapping (QSM) + quantitative blood oxygen level-dependent (qBOLD) imaging with cluster analysis of time evolution. Cerebral blood flow (CBF) and apparent diffusion coefficient (ADC) maps were reconstructed from 3D-ASL and DWI, respectively. Further, cerebral metabolic rate of oxygen (CMRO2) was calculated as the product of CBF and OEF. OEF, CMRO2, CBF, and ADC values in the ischemic cores (absolute values) and their contrasts to the contralateral regions (relative values) were evaluated. One-way analysis of variance (ANOVA) was used to compare OEF, CMRO2, CBF, and ADC values and their relative values among different stroke stages. The OEF value of infarct core showed a trend of decrease from acute, to early subacute, and to late subacute stages of ischemic stroke. Significant differences among the three stroke stages were only observed in the absolute OEF (F = 6.046, p = 0.005) and relative OEF (F = 5.699, p = 0.009) values of the ischemic core, but not in other measurements (absolute and relative CMRO2, CBF, ADC values, all values of p > 0.05). In conclusion, the challenge-free QSM + qBOLD-generated OEF mapping can be performed on stroke patients. It can provide more information on tissue viability that was not available with CBF and ADC and, thus, may help to better manage ischemic stroke patients.
Introduction
Ischemic stroke due to impaired blood flow to the brain is one of the leading causes of mortality and morbidity all over the world (Benjamin et al., 2017; Wang et al., 2017). A major therapy objective is to salvage tissue in the ischemic penumbra, a region with perfusion below a functional threshold but above a preservation threshold (Dirnagl et al., 1999; Pushie et al., 2018; Thirugnanachandran et al., 2018). The penumbra is estimated using MRI according to the mismatch between perfusion weighted imaging (PWI, indicating a functional threshold) and diffusion weighted imaging (DWI, non-hyperintensity indicating a preservation threshold). However, the difficulty in perfusion quantification makes it problematic to define a PWI threshold (Wouters et al., 2017; Zaro-Weber et al., 2017). The PWI–DWI mismatch may overestimate the penumbral tissue with the mismatch volume varying with quantification methods (Sobesky et al., 2005).
Penumbra evolves rapidly within the first few hours (Dirnagl et al., 1999; Pushie et al., 2018; Thirugnanachandran et al., 2018), and 24 h may be the threshold time window beyond which ischemic lesion becomes irreversible (Bonova et al., 2013). Accordingly, therapy of ischemic stroke is guided by the time from stroke onset. In current guidelines, intravenous administration of thrombolytic tissue plasminogen activator can be performed within 4.5 h (Davis and Donnan, 2009), and endovascular thrombectomy guided by advanced imaging of penumbral pattern can be performed within 24 h (Saver et al., 2016; Albers et al., 2018; Nogueira et al., 2018; Powers et al., 2018; Adeoye et al., 2019). Additionally, about 14% of strokes are wake-up types without known onset time (Mackey et al., 2011). Therefore, it is important for stroke therapy to assess tissue viability in ischemic lesions and differentiate stroke stages (Allen et al., 2012).
Oxygen extraction fraction (OEF) mapping reflects tissue metabolic state and is regarded as a very sensitive parameter in characterizing neural damage as tissue evolves from oligemia, to penumbra, and finally to death during ischemia (Powers, 1991; Leigh et al., 2018). The 15O positron emission tomography (15O-PET) is the gold standard for quantitatively assessing OEF and cerebral metabolic rate of oxygen (CMRO2). However, the 2 min half-life of 15O requires a cyclotron in the PET room, which is not available in almost all clinical practices, and PET is too expensive for routine use (Heiss, 2012; Leigh et al., 2018).
MRI-based OEF and CMRO2 mapping techniques have recently been developed to evaluate oxygen consumption in tissue using quantitative blood oxygenation level-dependent (BOLD) contrast (He and Yablonskiy, 2007; Yablonskiy et al., 2013a), quantitative imaging of extraction of oxygen and tissue consumption (QUIXOTIC) (Bolar et al., 2011), calibrated BOLD (Davis et al., 1998; Gauthier and Hoge, 2012; Hoge, 2012; Blockley et al., 2013), and quantitative susceptibility mapping (QSM) (Zhang et al., 2015, 2017, 2018; Cho et al., 2018, 2020). In QSM, post-processing of complex 3D multi-echo gradient echo (mGRE) data (de Rochefort et al., 2010), tissue iron (ferritin, diffuse), and blood deoxyheme iron (in venioles, cylinders) can be separated using vascular challenges or prior knowledge (Zhang et al., 2015, 2017, 2018). Recently, OEF mapping can be achieved by combining QSM processing of phase and quantitative blood oxygen level-dependent (qBOLD) modeling of magnitude (Ogawa et al., 1990; Yablonskiy and Haacke, 1994b) of mGRE data without any vascular challenge administration (Cho et al., 2018, 2020), making it ready for routine use in imaging acute ischemic patients. When 3D OEF is multiplied by cerebral blood flow (CBF) from 3D arterial spin labeling (ASL) images, CMRO2 can be generated from MRI examinations.
In this work, we report an initial experience using challenge-free OEF mapping from mGRE (Cho et al., 2020) in a cohort of acute and subacute ischemic stroke patients, and compared it with apparent diffusion coefficient (ADC), CBF, and CMRO2 mapping.
Materials and Methods
Patient Cohort
This was a retrospective study for which written informed consent from patients was waived by the local institutional review board.
A total of 30 consecutive patients with ischemic stroke from January 2014 to January 2015 were recruited according to the following inclusion criteria: (1) the time interval between stroke onset and MRI examination was quantifiable and ranged between 6 h and 15 days; (2) ischemic lesion caused by the stenosis or occlusion of the middle cerebral artery; (3) MRI scan protocol included 3D mGRE and 3D-ASL, in addition to conventional T1 weighted (T1w), T2 weighted (T2w), T2w FLAIR, and DWI sequences; (4) patients did not receive therapy of intravenous thrombolysis or mechanical thrombectomy before the MRI scan; and (5) patients did not show hemorrhage transformation in subsequent MRI scans. A detailed description of the patient characteristics is shown in Table 1.

Table 1. Patient characteristics and demographics.
The included ischemic stroke patients were classified into three groups (Fung et al., 2011) based on the time interval between stroke onset and MRI examination: (1) acute stage (6–24 h, n = 5); (2) early subacute stage (1–7 days, n = 19); and (3) late subacute stage (7–15 days, n = 6) (Table 1).
MRI Protocol and Image Processing
Brain MRIs were performed on a GE 3.0T scanner (Discovery MR750, GE Healthcare) with a 32-channel head coil. The image protocol consisted of 3D mGRE, 3D-ASL, and conventional sequences (T1w, T2w, T2w FLAIR, and DWI). The acquisition parameters for mGRE were field of view = 24 × 24 cm, TR = 42.8 m, TE1/ΔTE = 4.5/4.9 m, number of TEs = 8, acquisition matrix = 416 × 320, readout bandwidth = 244 Hz/pixel, slice thickness = 2 mm, flip angle = 20°, number of averages = 1, and scan time = 5 min 15 s Parameters for 3D-ASL were field of view = 24 × 24 cm, TR = 4,787 m, TE = 14.6 m, acquisition matrix = 128 × 128, slice thickness = 4 mm, post-labeling delay time = 1,525 m, and number of averages = 3. Parameters for DWI were field of view = 24 × 24 cm, TR = 3,000 m, TE = 71 m, acquisition matrix = 160 × 160, flip angle = 90°, slice thickness = 5 mm, number of averages = 4, b-value = 0, 1,000 s/mm2. The 3D-ASL and DWI images were sent to a GE workstation (GE Healthcare, AW4.5 workstation) for cerebral blood flow (CBF) and apparent diffusion coefficient (ADC) calculation. QSM was reconstructed from mGRE images using a fully automated zero-referenced morphology enabled dipole inversion (MEDI + 0) method with the ventricular cerebrospinal fluid as a zero reference according to the following optimization (Liu et al., 2018):
where SMV is the spherical mean value operator (radius 5 mm), w(r) reflects the reliability of the local field b(r), MG(r) is the edge mask, ∇ is the 3D gradient operator, and is the average of χ(r) over the mask MCSF. All the images were co-registered to the magnitude image, which is the geometric mean of the magnitude of mGRE along the time direction and has the same space with QSM, using the FMRIB’s Linear Image Registration Tool algorithm (Jenkinson et al., 2002).
To decompose the susceptibility source into cylindrical deoxyheme iron and diffuse susceptibility source, QSM susceptibility sources was modeled as
where α is the vein volume fraction assumed to be constant (0.77), ψHb is the hemoglobin volume fraction (0.0909 for tissue and 0.1197 for vein), and ΔχHb is the susceptibility difference between deoxy- and oxy-hemoglobin (12,522 ppb). The qBOLD model of the magnitude signal |sj| for the jth echo at echo time jΔTE in multi-echo magnitude time evolution was (Yablonskiy et al., 2013b)
where with 1F2is the generalized hypergeometric function, δω, and g accounts for the macroscopic contributions due to voxel sensitivity function. Here, γ is the gyromagnetic ratio (267.513 MHz/T), B0 is the main magnetic field (3T in our study), Hct is the hematocrit (0.357), Δχ0 is the susceptibility difference between fully oxygenated and fully deoxygenated blood (4π× 0.27 ppm) (Yablonskiy and Haacke, 1994a), χba is the purely oxygenated blood susceptibility (-108.3 ppb), Yis the oxygenation, χnb is the non-blood susceptibility, and v is the vein blood volume fraction. In determining with Ya, the arterial oxygen saturation (0.98), the reconstruction problem from the multi-echo data is to combine the QSM value χ of the phase analysis and the qBOLD data fitting of the magnitude analysis using denoising regularization R(Y,v,χnb,s0,R2) (Cho et al., 2018):
The above minimization problem is solved using a strong denoising algorithm called a cluster analysis of time evolution (CAT) where voxels with similar mGRE magnitude time evolutions are assumed to have similar model parameter values, including OEF, and are grouped into a cluster (Cho et al., 2020). For the grouping, X-means, a modified K-means method that provides an optimal number of clusters, was used with the squared Euclidean distance of the magnitude time evolution across echoes as the similarity measurement. CBF maps were used to further generate the CMRO2 maps using the equation: CMRO2 = CBF × OEF × [H]a, where [H]a = 7.377 μmol/ml is the oxygenated heme molar concentration in the arteriole.
Image Analysis
The ischemic core region was manually segmented on co-registered DWI and ADC images by an experienced neuroradiologist (7 years of experience), and the contralateral mirror area with a similar size was also drawn. Infarct cores were defined by identifying the hyperintense regions on the DWI maps and confirmed to be hypointense on the corresponding ADC map. The hypoperfused region on CBF was identified by comparison with the contralateral region. A mismatch region between the hypoperfused region on CBF and the ischemic core on DWI/ADC was also segmented when existed. For each patient, OEF, CMRO2, CBF, and ADC were measured on a segmented ischemic core region of interest (ROI) as their absolute values. The differences in OEF, CMRO2, CBF, and ADC between an ischemic core and its contralateral ROI were also computed using their contrasts or relative values.
Statistical Analysis
Statistical analyses were performed with SPSS for Windows (version 22.0, Chicago, IL, United States). The differences among the three ischemic stages for absolute OEF, CMRO2, CBF, and ADC values and relative OEF, CMRO2, CBF, and ADC were performed using one-way analysis of variance (ANOVA), followed by the least significant difference (LSD) multiple comparison post hoc tests. A value of p < 0.05 was recognized as statistically significant.
Results
In three of five acute stroke cases (6, 18, and 24 h from stroke symptom onset), there was a mismatch between the hypoperfused region on CBF and the ischemic core region on DWI/ADC (Figure 1 and Supplementary Figure 1), and the hypoperfused mismatch region had a slightly higher OEF value than the ischemic core region (yellow ROI in Figure 1). The matched region had a similar signal or scattered hypointense signal on OEF when compared to the contralateral region. On CMRO2 and CBF maps, the ischemic core region showed a low signal in every stage. There existed no mismatch region in the other two acute stroke cases. The ischemic core region had a decreased ADC for all the five acute cases. The OEF, CMRO2, and the relevant CBF, QSM, DWI, and ADC maps of one acute ischemic stroke patient are shown in Figure 1. In early subacute and late subacute stages, the OEF of the ischemic core region manifested as a heterogeneously low signal, compared to the contralateral region.
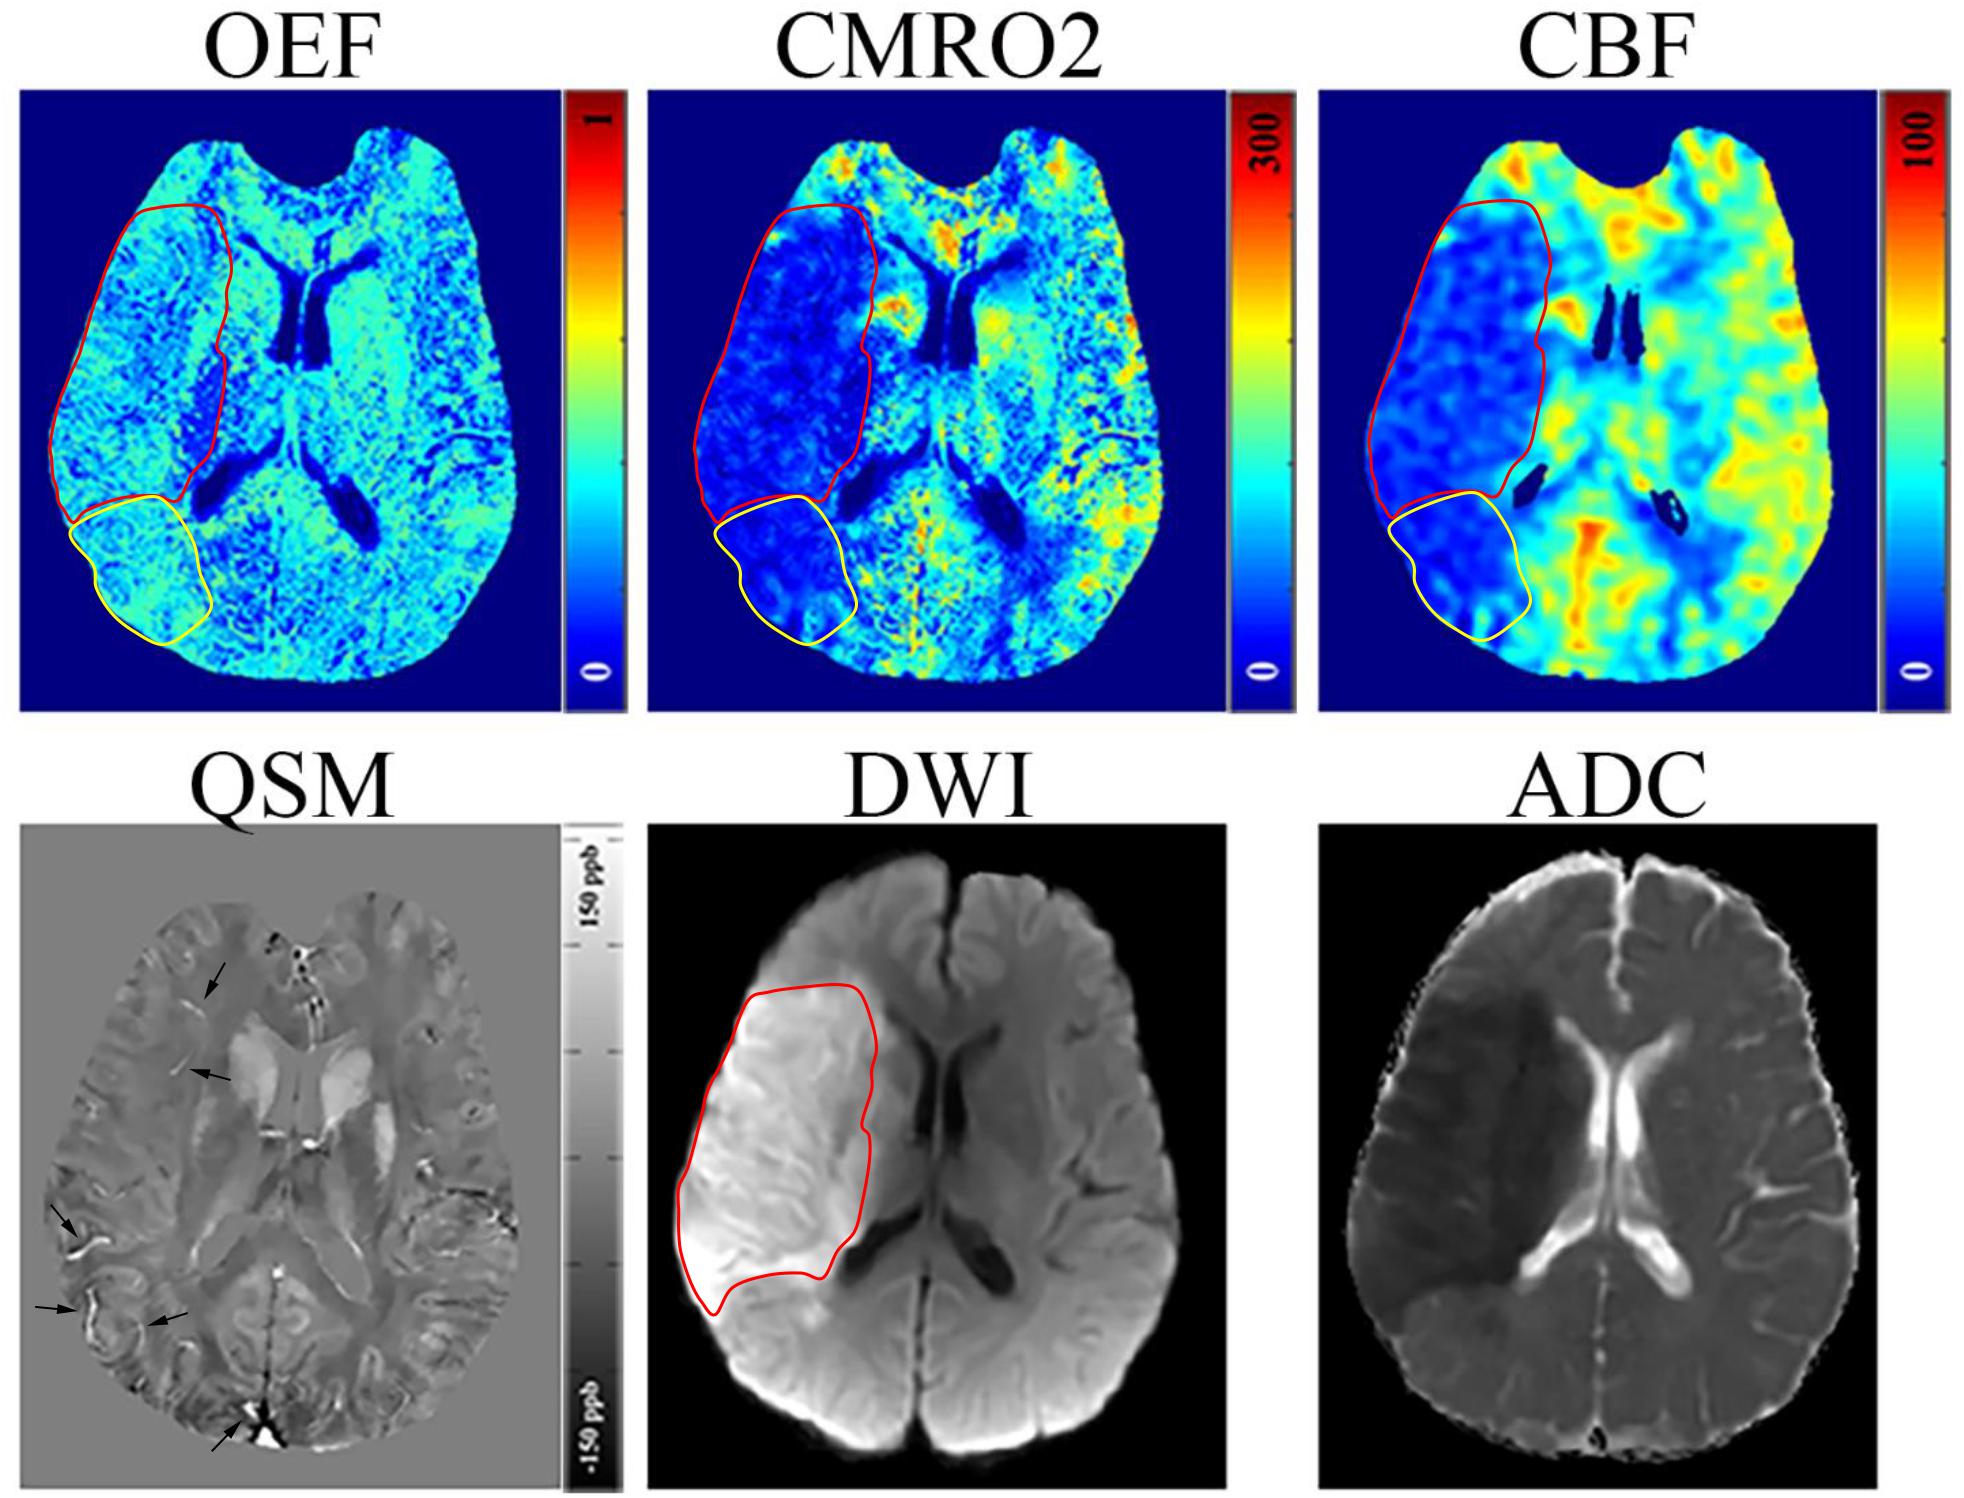
Figure 1. Representative images of an acute ischemic stroke patient with 18 h between MRI examination and stroke symptom onset. The ischemic lesion was caused by the occlusion of the right middle cerebral artery. The ischemic core (red circle) identified on diffusion weighted imaging (DWI) and apparent diffusion coefficient (ADC) maps manifested as a slight decrease (30.38%) in oxygen extraction fraction (OEF) by comparing to the contralateral region (32.12%); some scattered dots within the ischemic core showed a higher OEF. A mismatch (yellow circle) is seen between the cerebral blood flow (CBF) and DWI maps near the ischemic core showing a relatively high OEF (32.15%), slightly higher than the contralateral region, which may represent salvageable ischemic tissue or benign oligemia tissue. Both the ischemic core and mismatch region showed a decrease in cerebral metabolic rate of oxygen (CMRO2). On the quantitative susceptibility mapping (QSM) map, some hyperintense veins (arrow) can be seen surrounding the ischemic core.
The absolute OEF, CMRO2, CBF, and ADC values of the ischemic core and the contralateral region in each individual case, averaged values, and their differences or relative values in each stage are shown in Figures 2–5. The OEF and CMRO2 values in the ischemic core showed a decreasing trend as the time between symptom onset and MRI examination increased (Figures 2, 3, respectively), while the CBF and ADC values showed a slight increasing trend (Figures 4, 5, respectively). There were significant changes among the three stages for the absolute OEF value (F = 6.046, p = 0.005) in the ischemic core and the relative OEF (F = 5.699, p = 0.009). Post hoc tests showed that the changes in absolute OEF values from acute to early subacute phase (p = 0.003), and from acute to late subacute phase (p = 0.004) were significant, but not significant from early subacute to late subacute phase (p = 0.555); the changes in the relative OEF from acute to early subacute phase (p = 0.003) and from acute to late subacute phase (p = 0.009) were significant, but not significant from early subacute to late subacute phase (p = 0.867). No significant changes among the three stages were found for absolute and relative CMRO2, CBF, and ADC values (all values of p > 0.05) (Table 2).
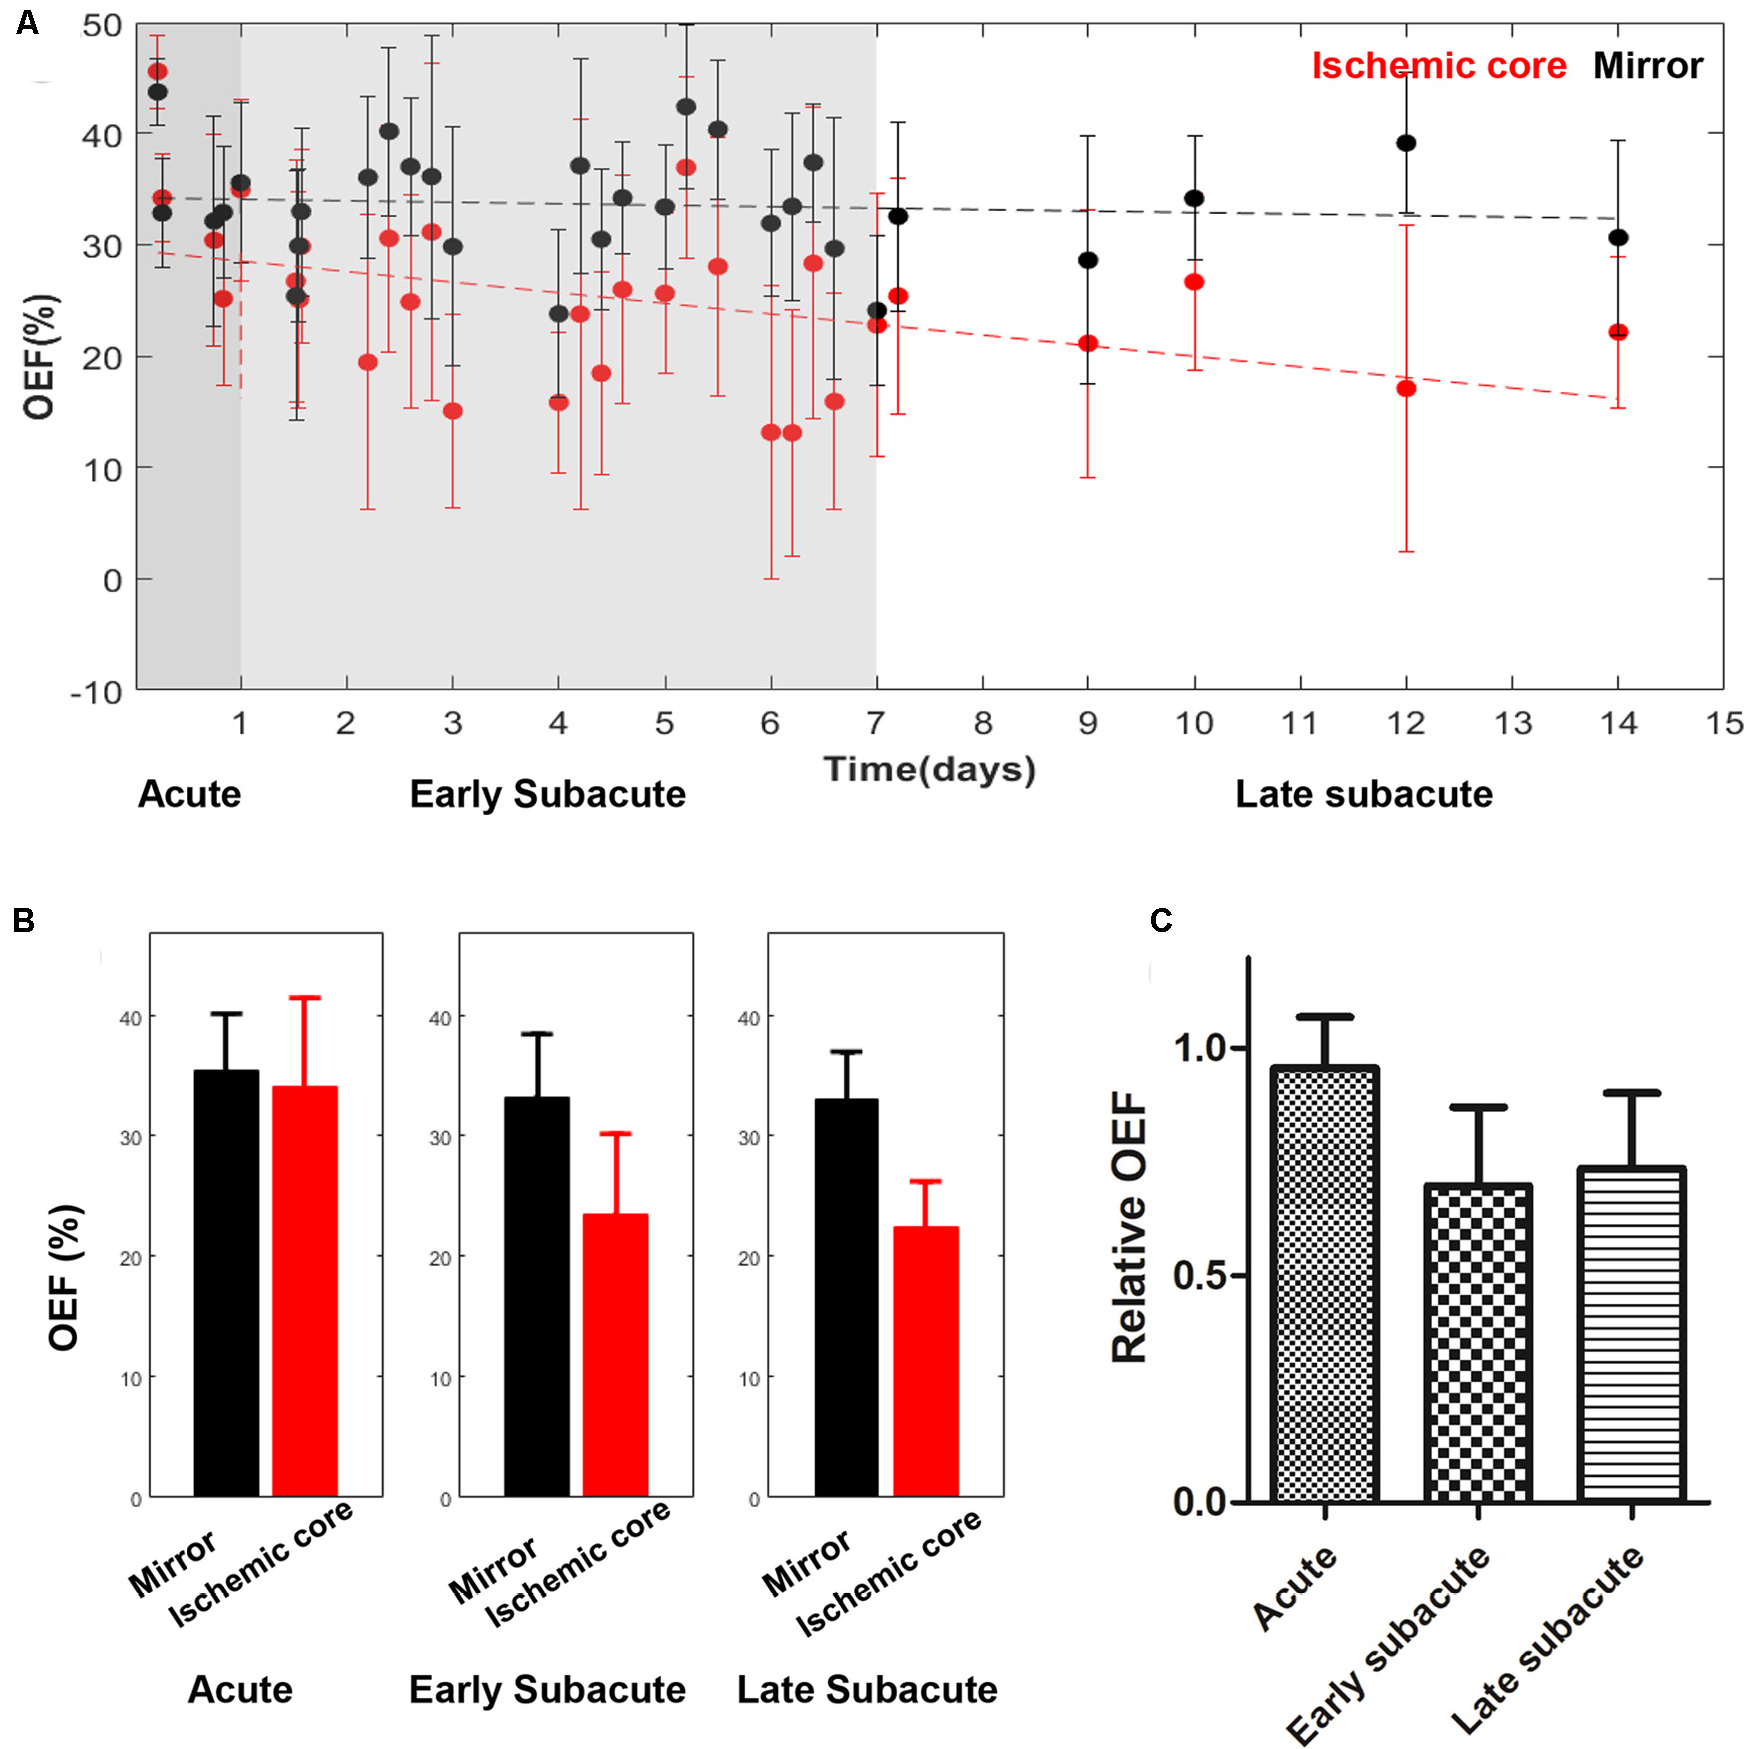
Figure 2. Absolute OEF values in the ischemic core and the contralateral region of the 30 included cases (A) and averaged OEF value (B), relative OEF (C) in every stage. The absolute OEF value in the ischemic core showed a trend of decrease as the time between symptom onset and MRI examination increased, while OEF values of contralateral regions were relatively stable. Relative OEF also showed a trend of decrease.
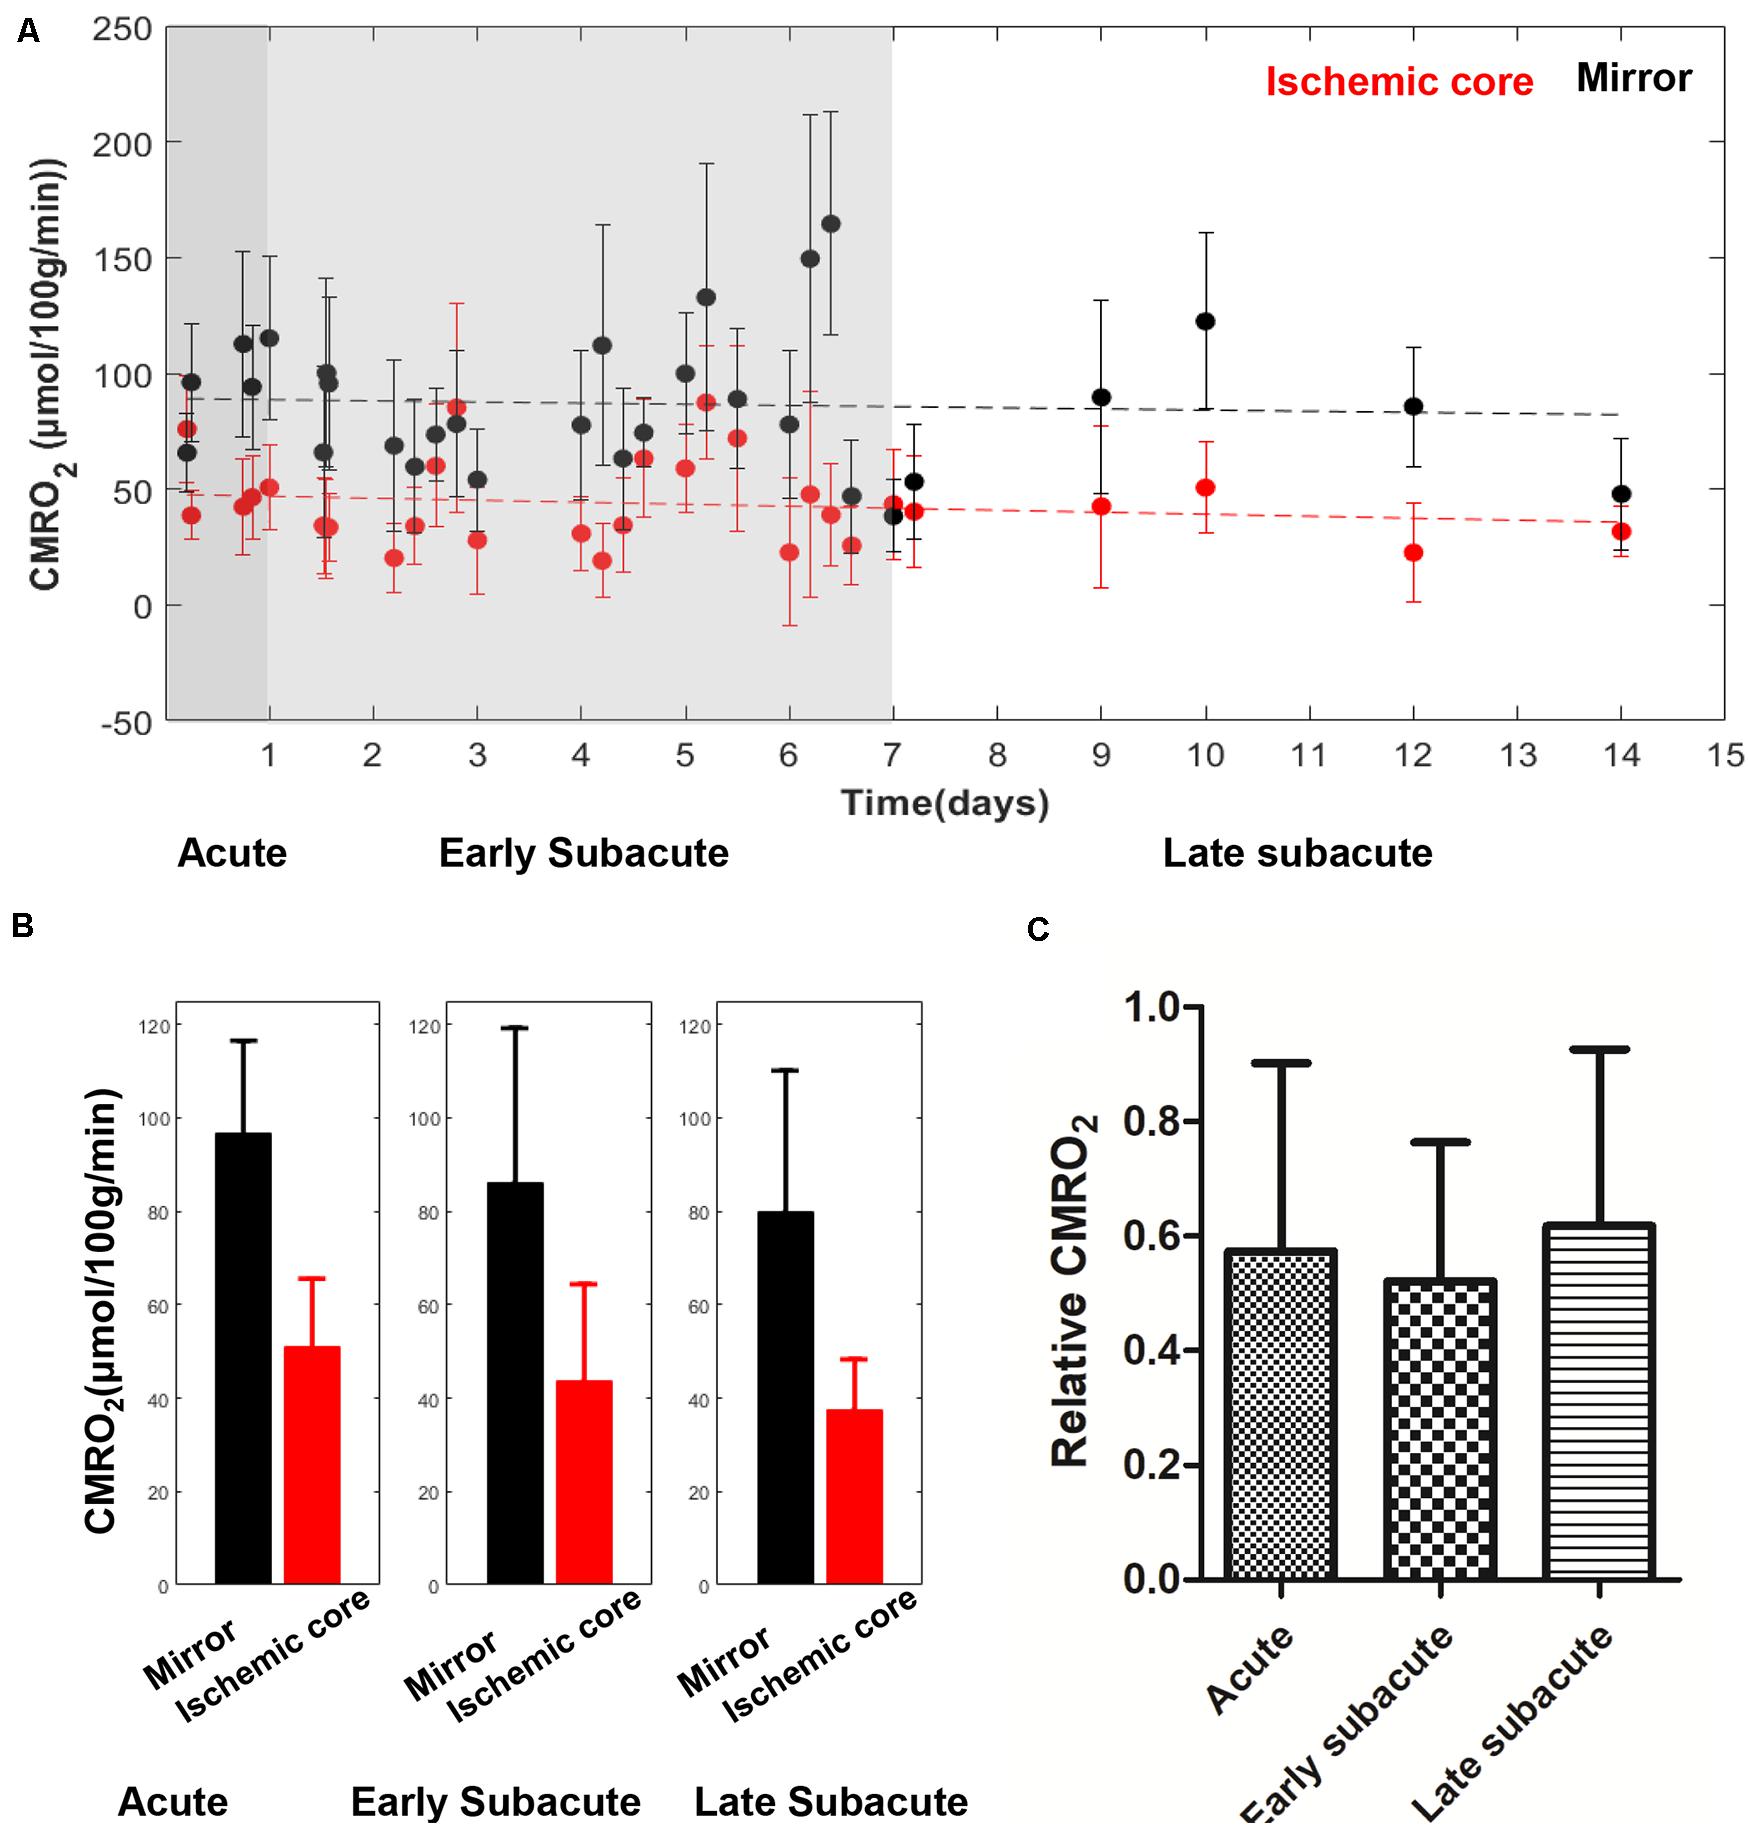
Figure 3. Absolute CMRO2 values in the ischemic core and the contralateral region of the 30 included cases (A) and averaged CMRO2 value (B), relative CMRO2 (C) in every stage. The absolute CMRO2 value in the ischemic core showed a trend of slight decrease with time increase. Relative CMRO2 were relatively stable in the three stages.
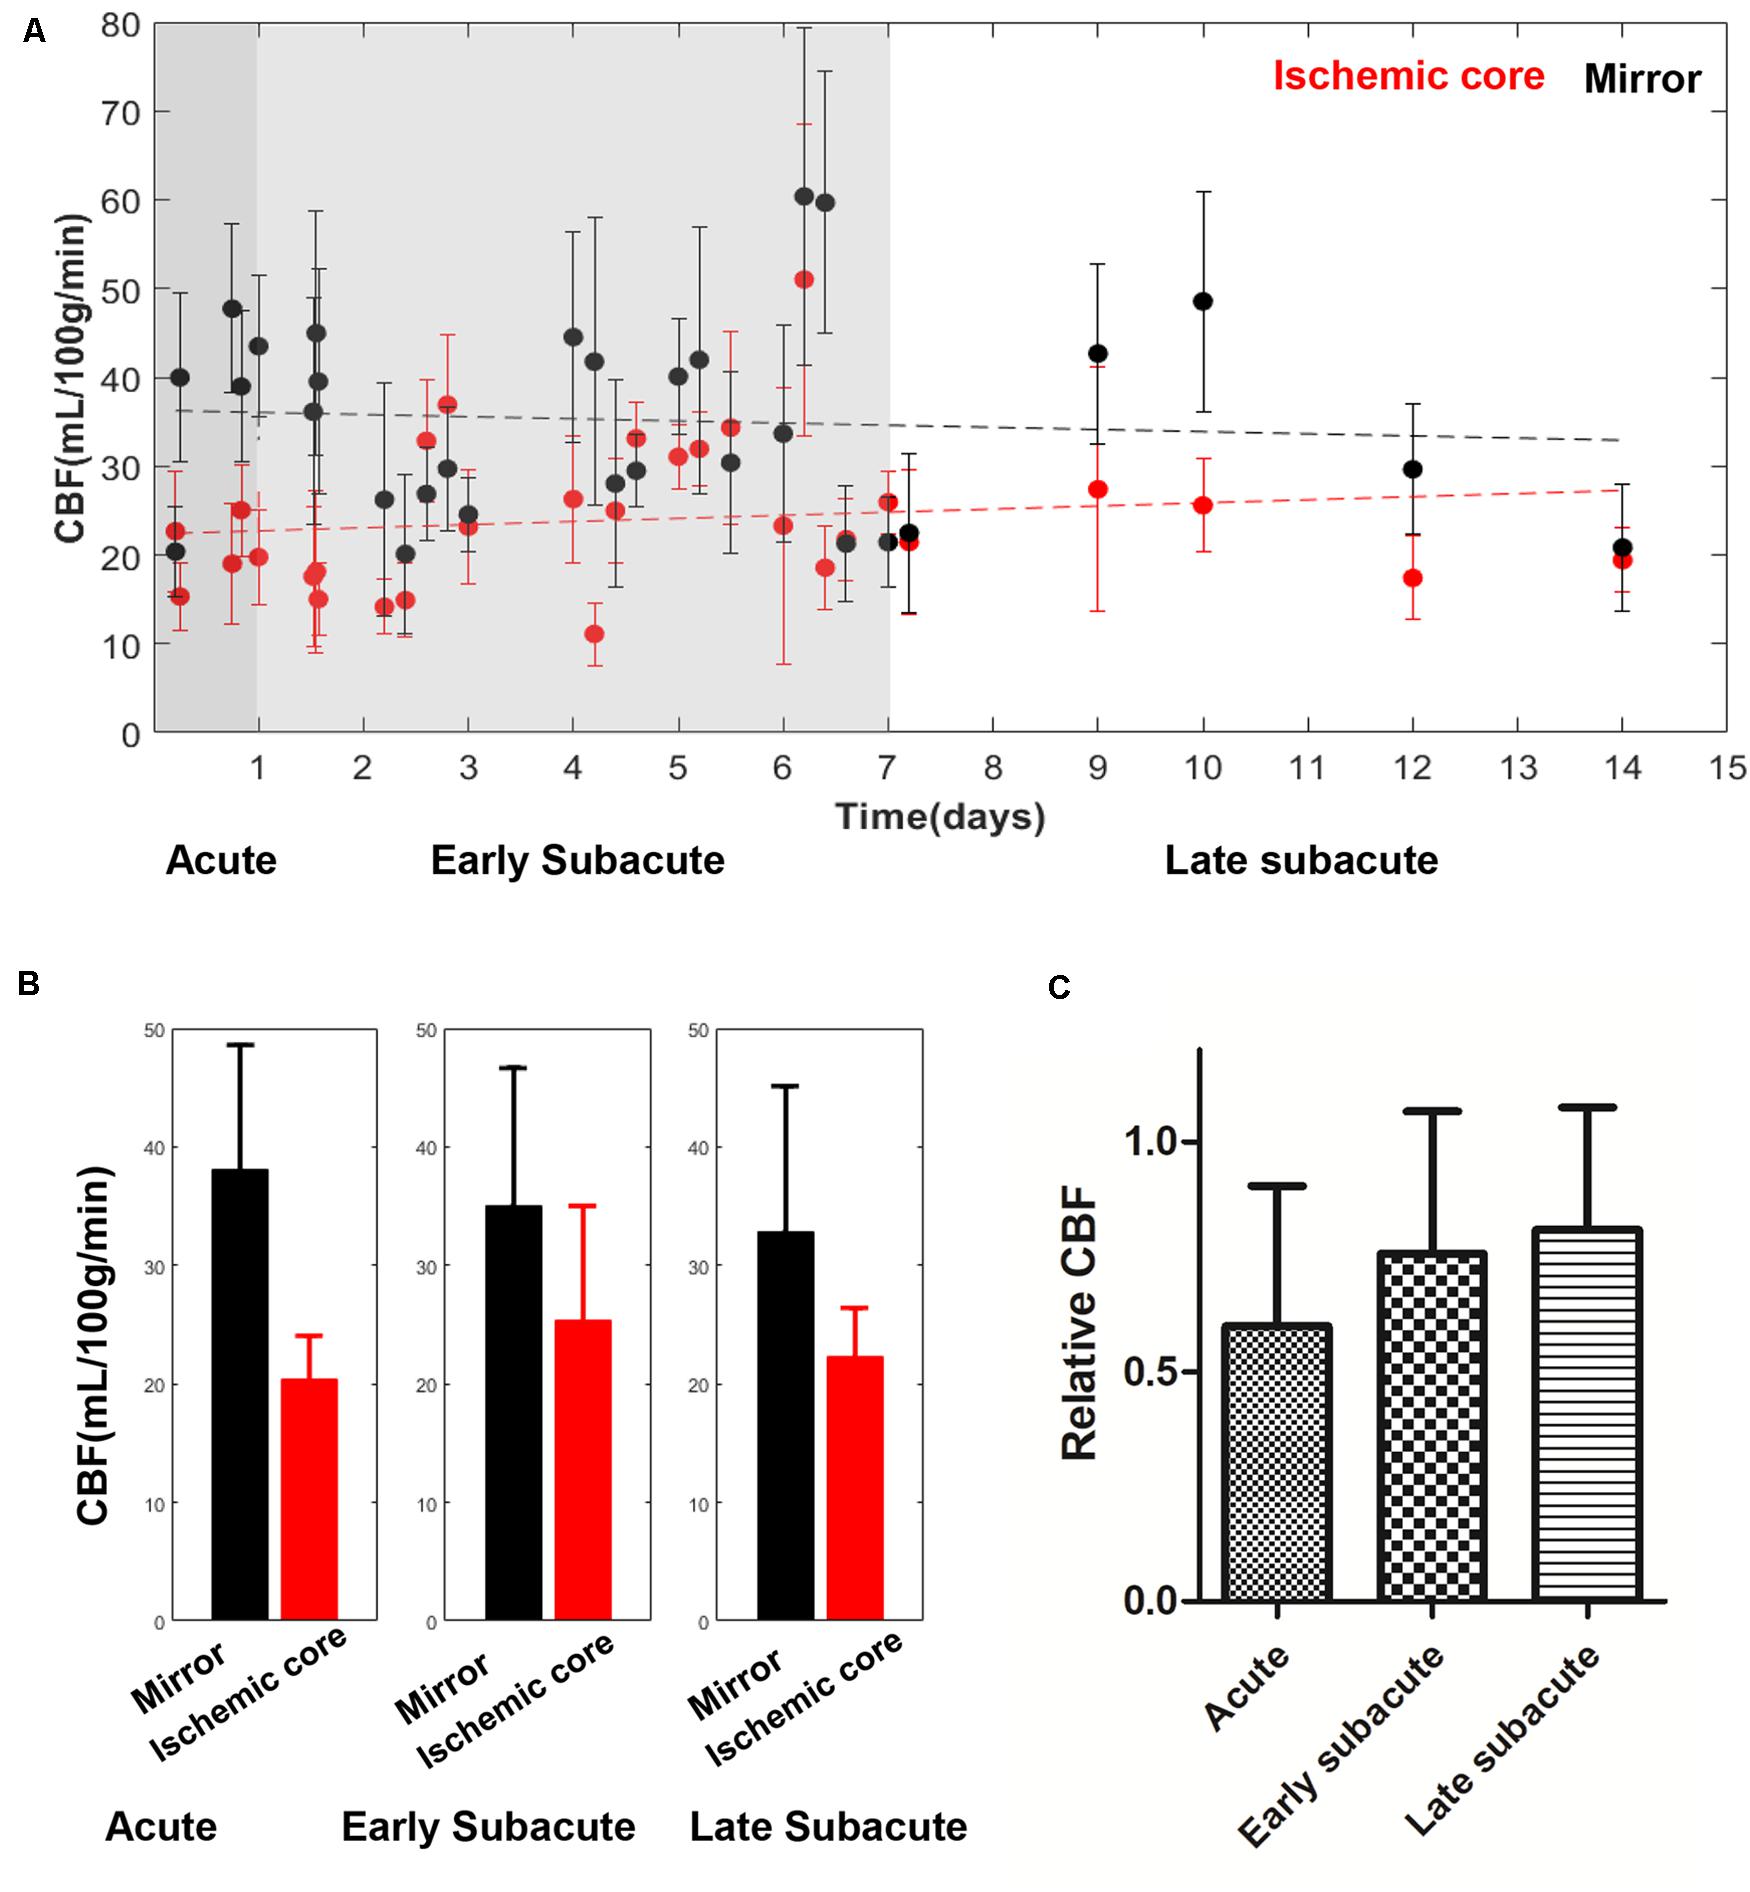
Figure 4. Absolute CBF values in the ischemic core and the contralateral region of the 30 included cases (A) and averaged CBF value (B), relative CBF (C) in every stage. The absolute CBF value in the ischemic core showed a trend of increase with time increase. Relative CBF also showed a trend of increase.
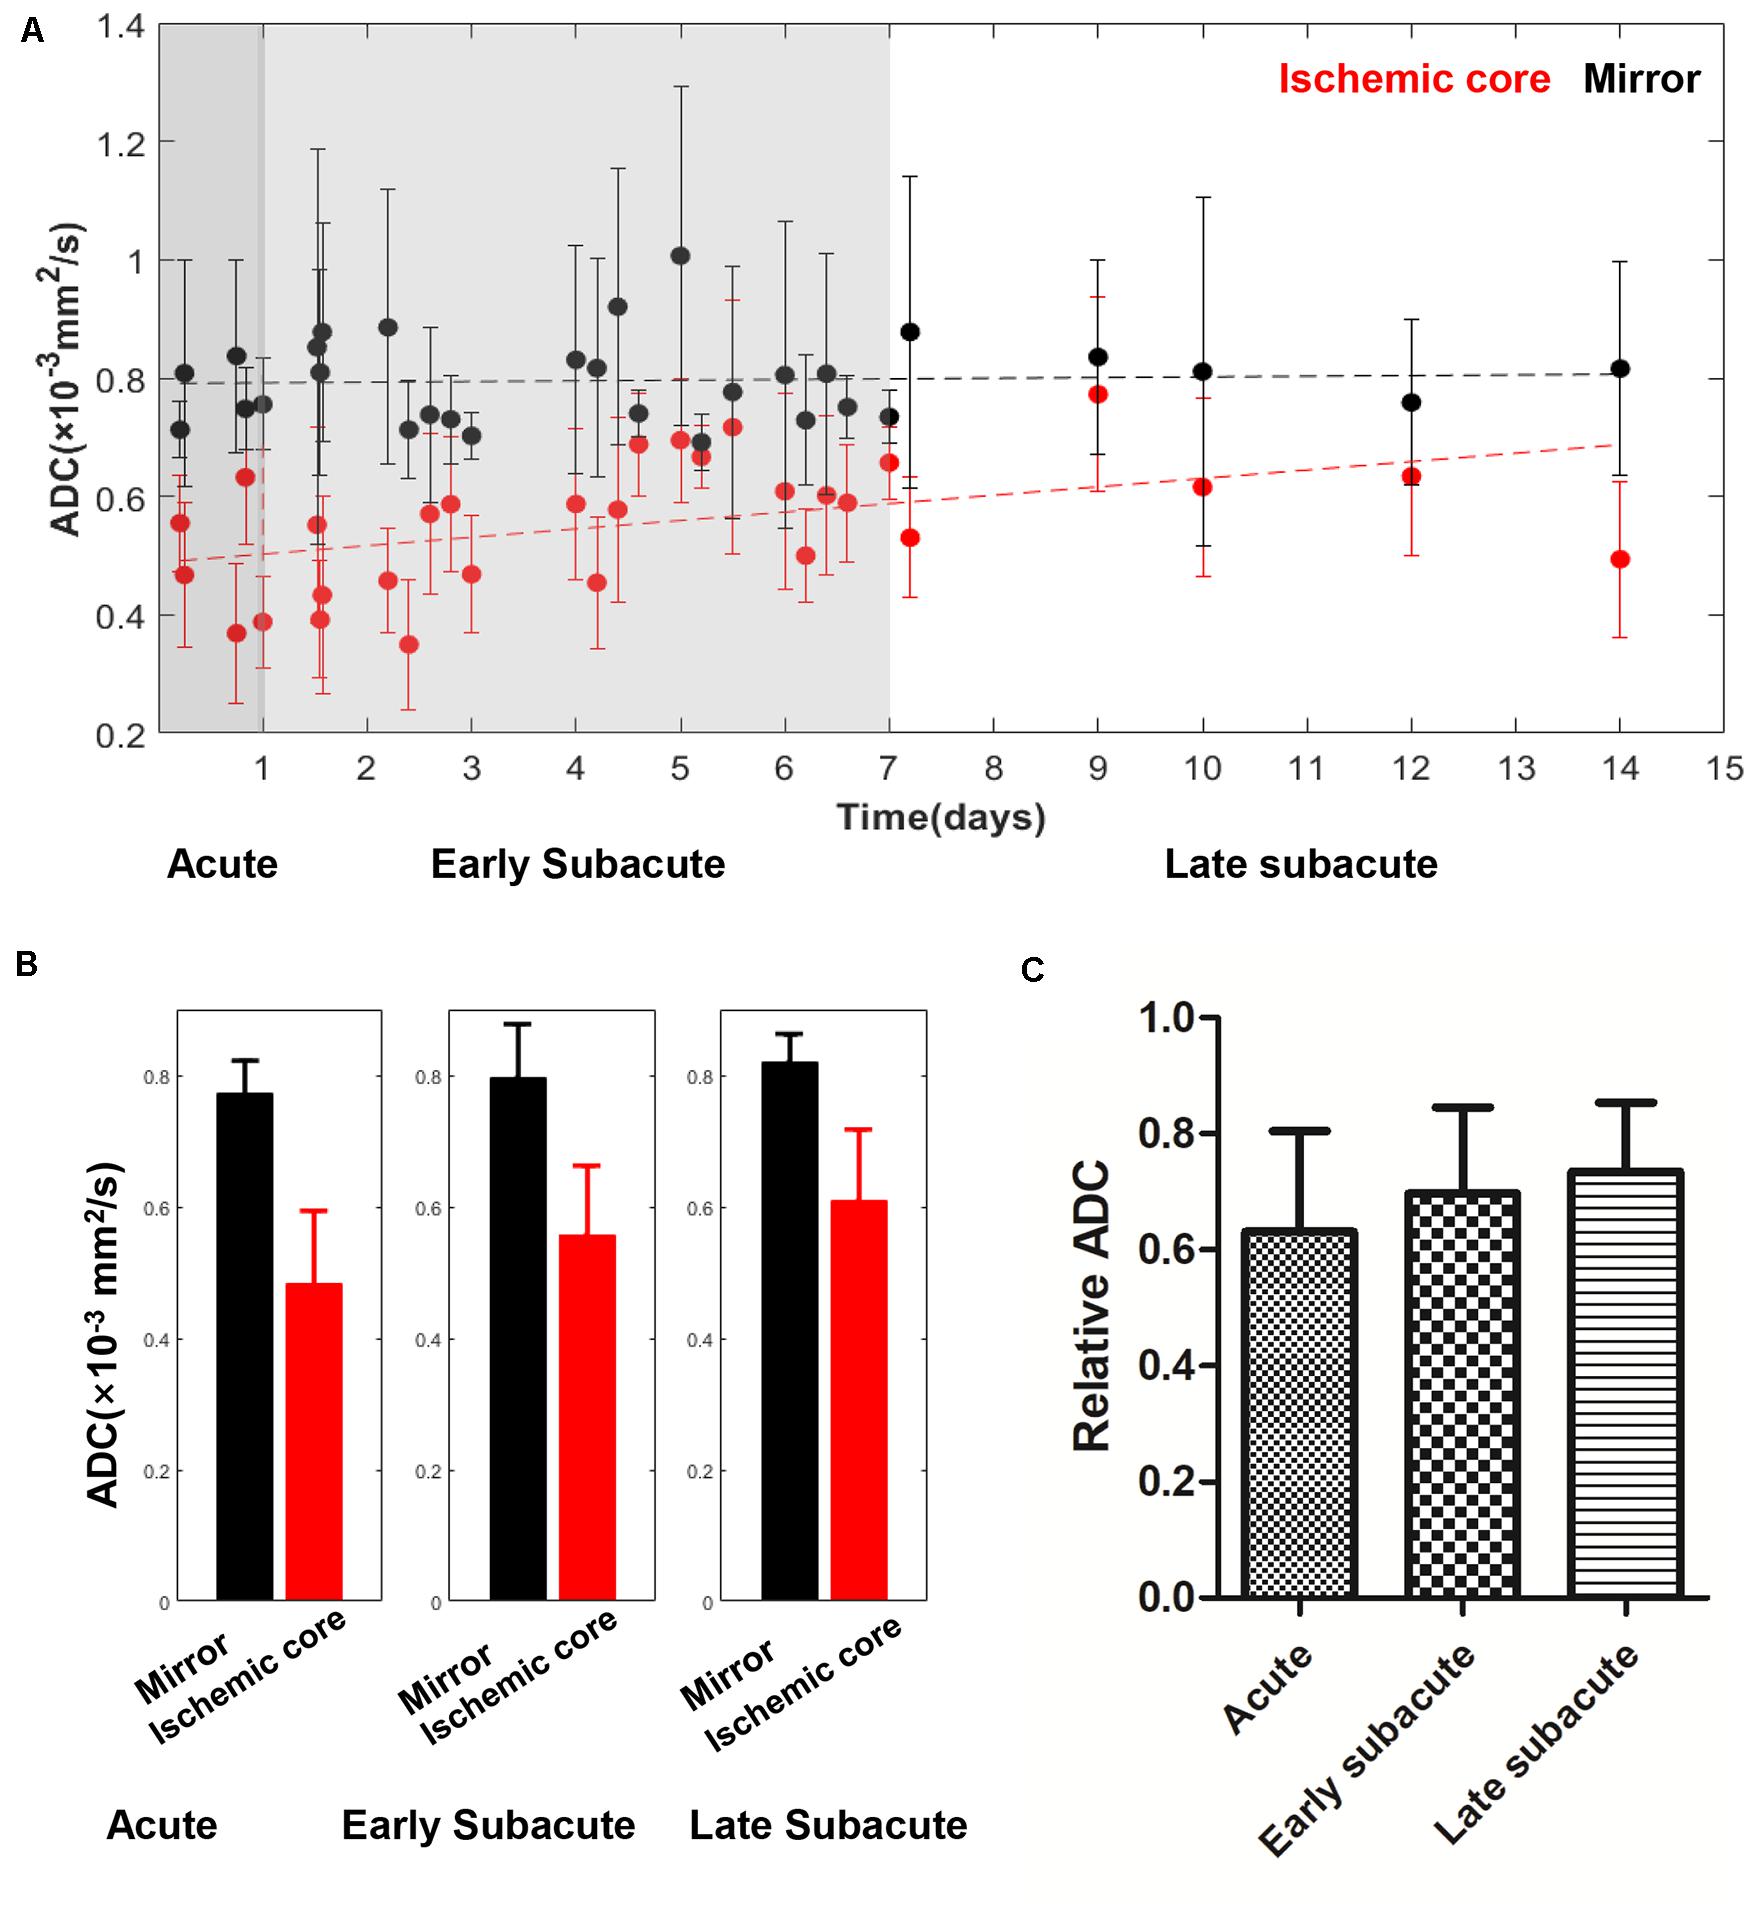
Figure 5. Absolute ADC values in the ischemic core and the contralateral region of the 30 included cases (A) and averaged ADC value (B), relative ADC (C) in every stage. The absolute ADC value in the ischemic core showed a trend of increase with the time between symptom onset and MRI examination increased, while the ADC value of the contralateral region was relatively stable. Relative ADC also showed a trend of increase.

Table 2. The absolute OEF, oxygen extraction fraction; CMRO2, cerebral metabolic rate of oxygen; CBF, cerebral blood flow and ADC, apparent diffusion coefficient values of ischemic core, and the relative OEF, CMRO2, CBF, and ADC in different stages.
Discussion
Our preliminary results demonstrate that challenge-free oxygen extraction fraction (OEF) mapping can be performed in a clinical setting. OEF is the most sensitive imaging for measuring tissue functional changes in stroke stages compared to cerebral blood flow (CBF), apparent diffusion coefficient (ADC), and cerebral metabolic rate of oxygen consumption (CMRO2). The challenge-free OEF mapping is achieved from quantitative susceptibility mapping (QSM) and quantitative blood oxygen level-dependent (qBOLD) modeling of 3D multi-echo gradient echo data, using cluster analysis of time evolution (CAT) to denoise QSM + qBOLD estimation of OEF. Challenge-free OEF mapping can be used to assess vital oxygen metabolism information of the ischemic tissue for comprehensive stratification of stroke therapy.
The current guidelines (Powers et al., 2018) in selecting eligible acute ischemic stroke patients to receive intravenous thrombolysis therapy are time dependent: the patient should be treated within 3 and 4.5 h of ischemic stroke symptom onset. Now, several studies (Sobesky et al., 2005; Heidenreich et al., 2008; Heiss and Zaro Weber, 2017; Zaro-Weber et al., 2017; Leslie-Mazwi et al., 2018) have reported that identifying the existence of ischemic penumbra using MRI techniques, such as PWI/DWI mismatch approach, can prolong the time window to 24 h, or help change the treatment plan for intra-arterial thrombectomy (Albers et al., 2018). The ischemic penumbra region (Wu et al., 2018), which has preserved neuronal integrity, but impaired function due to hypoperfusion, can recover completely if it receives blood supply in a timely manner but will die otherwise. In the small patient cohort of this study, some of the acute ischemic stroke patients were found to have a slightly elevated OEF in some scattered areas of the ischemic core compared to the contralateral region. This implies that the ischemic core may contain some penumbral tissues even at 4.5 h after the stroke onset.
The CBF/DWI mismatch region in three acute cases was found to have a higher OEF than the ischemic core. The elevated OEF indicates that the ischemic tissue is probably struggling to survive by maintaining energy consumption under reduced blood flow. This information is useful in addressing the ASL-CBF underestimation of the hypoperfused ischemic tissue, due to the presence of a prolonged transit delay resulting from arterial occlusion (Wolf and Detre, 2007; Wang et al., 2012; Bivard et al., 2014). The CBF/DWI mismatch region is difficult to interpret, as it may correspond to ischemic penumbra that benefits from timely revascularization or benign oligemia that does not progress to infarction and does not benefit from thrombotic therapy (Leigh et al., 2018; Wu et al., 2018). The risks of thrombolysis or intra-arterial thrombectomy may outweigh the benefits, if the ischemic core has a substantially decreased OEF, such as in case 5 in Supplementary Figure 1. Therefore, the challenge-free QSM + qBOLD-based OEF mapping that can be performed in clinical settings to assess tissue viability may be included in the routine MRI of ischemic stroke patients for comprehensive evaluation in therapy decision making.
OEF mapping captured the metabolic changes in different ischemic stages that are difficult to detect in CBF and ADC mapping. As the time between stroke symptom onset and MRI examination prolongs, OEF decreases, indicating that the ischemic tissue becomes functionally impaired without timely reperfusion, ending with cell death, consistent with the dynamic process of the pathophysiological change (Dirnagl et al., 1999; Tian et al., 2016). Our observed data on the trend of CBF increase with stroke onset time is consistent with the cerebral perfusion temporal changes measured on CT (Yang et al., 2015), usually as a result of the formation of collateral flow surrounding the ischemic core; a few acute/early subacute cases of CBF at ischemic cores larger than contralateral regions (Figure 4) may reflect the extremes of collateral vascular remodeling or measurement errors. The available CBF map multiplied by the OEF map generates the CMRO2 map, which in our results showed a relatively homogenous low signal. CMRO2 errors might be mainly driven by the underestimation of ASL–CBF, which was, in part, caused by the short postlabel time (1,525 min) used in our study (Zaharchuk, 2011; Wang et al., 2012; Bivard et al., 2014) and, consequently, were not as sensitive as OEF in detecting metabolic changes in ischemic stroke stages. Accurate computation of CMRO2 requires improvements in the accuracy of CBF mapping.
The CAT algorithm based on X-means machine learning has made QSM + qBOLD post-processing of the available multi-echo gradient echo MRI (mGRE) data for OEF mapping robust against noise. This CAT QSM + qBOLD OEF mapping eliminates assumptions in and, therefore, is theoretically more accurate than other OEF mapping methods (Kudo et al., 2016; Uwano et al., 2017; Zhang et al., 2017, 2018). QSM (de Rochefort et al., 2010; Wang and Liu, 2015; Liu et al., 2018) has been shown to be highly reproducible (Deh et al., 2015; Spincemaille et al., 2019), and recent technical developments in preconditioning for optimization execution (Liu et al., 2016) and in phase unwrapping (Dong et al., 2015) promise to make QSM robust even in brain regions near the air–tissue interface. The challenge of qBOLD prone to noise is effectively addressed by the CAT algorithm. The OEF map is generated from mGRE within 25 min on a standard desktop computer, which can be further shortened to a few minutes by optimizing the processing codes and using more powerful computers. Therefore, rapid OEF mapping can be included in routine clinical MRI protocols to accurately evaluate tissue viability in acute ischemic stroke patients, and upon further validation, would help patient management stratification for a timely beneficial therapy.
There are some limitations in this study. The small number of patients, particularly in the acute phase, only allowed a limited demonstration of the broad possible manifestations of the metabolic changes of stroke. The results here may not be generalized without further studies in larger cohorts of stroke patients. The delineation of penumbra tissue at risk, which is of great importance in guiding therapy stratification, could only be shown in three patients. The patients in this cross-section study only had one MRI, and there was an imbalanced gender distribution. Therefore, the benefits of the presented OEF mapping method illustrated here should be understood with caution. Future studies including more acute cases and longitudinal MRI scans are needed to validate our preliminary results. Finally, ischemic stroke patients with hemorrhagic transformation were not included. As further improvements are being developed to account for the strong susceptibility sources of hemorrhages for accurate OEF estimation, OEF mapping using the method described here should become feasible in these patients.
In conclusion, the challenge-free OEF mapping using CAT QSM + qBOLD modeling of mGRE data can be performed in clinical practice to assess oxygen metabolic information, which is helpful in evaluating tissue viability in acute ischemic stroke patients.
Data Availability Statement
The datasets generated for this study are available on request to the corresponding author.
Ethics Statement
The studies involving human participants were reviewed and approved by the Institutional Review Board of Tongji Hospital, Tongji Medical College, Huazhong University of Science and Technology, Wuhan, China. Written informed consent for participation was not required for this study in accordance with the national legislation and the institutional requirements.
Author Contributions
SZ, WZ, and YW were responsible for the study concepts and design. SZ, AG, WZ, and YW were responsible for literature research. SZ, AG, and WZ were responsible for the clinical studies. SZ, JC, TN, and PS were responsible for the statistical analysis. All authors were guarantors of integrity of the entire study and responsible for the experimental studies and data analysis, manuscript preparation and editing, and final approval.
Funding
This work was supported, in part, by grants from the National Natural Science Foundation of China (Grant Nos. 81801666, 81570462, and 81730049) and the National Institutes of Health (R01NS090464, R01NS095562, R21EB024366, S10OD021782, and R01CA181566).
Conflict of Interest
QSM post-processing software has been developed by Medimagemetric LLC, a Cornell spinoff company that YW owns shares. AG reports non-financial support from GE Healthcare and non-financial support from Siemens Medical Solutions USA, Inc., outside the submitted work.
The remaining authors declare that the research was conducted in the absence of any commercial or financial relationships that could be construed as a potential conflict of interest.
Supplementary Material
The Supplementary Material for this article can be found online at: https://www.frontiersin.org/articles/10.3389/fnins.2020.535441/full#supplementary-material
References
Adeoye, O., Nystrom, K. V., Yavagal, D. R., Luciano, J., Nogueira, R. G., Zorowitz, R. D., et al. (2019). Recommendations for the Establishment of Stroke Systems of Care: A 2019 Update. Stroke 50, e187–e210. doi: 10.1161/STR.0000000000000173
Albers, G. W., Marks, M. P., Kemp, S., Christensen, S., Tsai, J. P., Ortega-Gutierrez, S., et al. (2018). Thrombectomy for Stroke at 6 to 16 Hours with Selection by Perfusion Imaging. New England Journal of Medicine 378, 708–718. doi: 10.1056/NEJMoa1713973
Allen, L. M., Hasso, A. N., Handwerker, J., and Farid, H. (2012). Sequence-specific MR imaging findings that are useful in dating ischemic stroke. Radiographics 32, 1285–1297. doi: 10.1148/rg.325115760
Ay, H., Furie, K. L., Singhal, A., Smith, W. S., Sorensen, A. G., and Koroshetz, W. J. (2005). An evidence-based causative classification system for acute ischemic stroke. Ann. Neurol. 58, 688–697. doi: 10.1002/ana.20617
Benjamin, E. J., Blaha, M. J., Chiuve, S. E., Cushman, M., Das, S. R., Deo, R., et al. (2017). Heart Disease and Stroke Statistics-2017 Update A Report From the American Heart Association. Circulation 135, E146–E603. doi: 10.1161/Cir.0000000000000485
Bivard, A., Krishnamurthy, V., Stanwell, P., Levi, C., Spratt, N. J., Davis, S., et al. (2014). Arterial spin labeling versus bolus-tracking perfusion in hyperacute stroke. Stroke 45, 127–133. doi: 10.1161/STROKEAHA.113.003218
Blockley, N. P., Griffeth, V. E., Simon, A. B., and Buxton, R. B. (2013). A review of calibrated blood oxygenation level-dependent (BOLD) methods for the measurement of task-induced changes in brain oxygen metabolism. NMR Biomed. 26, 987–1003. doi: 10.1002/nbm.2847
Bolar, D. S., Rosen, B. R., Sorensen, A., and Adalsteinsson, E. (2011). QUantitative Imaging of eXtraction of oxygen and TIssue consumption (QUIXOTIC) using venular-targeted velocity-selective spin labeling. Magn. Reson. Med. 66, 1550–1562. doi: 10.1002/mrm.22946
Bonova, P., Burda, J., Danielisova, V., Nemethova, M., and Gottlieb, M. (2013). Development of a pattern in biochemical parameters in the core and penumbra during infarct evolution after transient MCAO in rats. Neurochem. Int. 62, 8–14. doi: 10.1016/j.neuint.2012.10.015
Cho, J., Kee, Y., Spincemaille, P., Nguyen, T. D., Zhang, J., Gupta, A., et al. (2018). Cerebral metabolic rate of oxygen (CMRO2) mapping by combining quantitative susceptibility mapping (QSM) and quantitative blood oxygenation level-dependent imaging (qBOLD). Magn. Reson. Med. 80, 1595–1604. doi: 10.1002/mrm.27135
Cho, J., Zhang, S., Kee, Y., Spincemaille, P., Nguyen, T. D., Hubertus, S., et al. (2020). Cluster analysis of time evolution (CAT) for quantitative susceptibility mapping (QSM) and quantitative blood oxygen level-dependent magnitude (qBOLD)-based oxygen extraction fraction (OEF) and cerebral metabolic rate of oxygen (CMRO2) mapping. Magn. Reson. Med. 83, 844–857. doi: 10.1002/mrm.27967
Davis, S. M., and Donnan, G. A. (2009). 4.5 hours: the new time window for tissue plasminogen activator in stroke. Stroke 40, 2266–2267. doi: 10.1161/STROKEAHA.108.544171
Davis, T. L., Kwong, K. K., Weisskoff, R. M., and Rosen, B. R. (1998). Calibrated functional MRI: mapping the dynamics of oxidative metabolism. Proc. Natl. Acad. Sci. USA 95, 1834–1839. doi: 10.1073/pnas.95.4.1834
de Rochefort, L., Liu, T., Kressler, B., Liu, J., Spincemaille, P., Lebon, V., et al. (2010). Quantitative susceptibility map reconstruction from MR phase data using bayesian regularization: validation and application to brain imaging. Magn. Reson. Med. 63, 194–206. doi: 10.1002/mrm.22187
Deh, K., Nguyen, T. D., Eskreis-Winkler, S., Prince, M. R., Spincemaille, P., Gauthier, S., et al. (2015). Reproducibility of quantitative susceptibility mapping in the brain at two field strengths from two vendors. J. Magn. Reson. Imaging 42, 1592–1600. doi: 10.1002/jmri.24943
Dirnagl, U., Iadecola, C., and Moskowitz, M. A. (1999). Pathobiology of ischaemic stroke: an integrated view. Trends Neurosci 22, 391–397. doi: 10.1016/s0166-2236(99)01401-0
Dong, J., Liu, T., Chen, F., Zhou, D., Dimov, A., Raj, A., et al. (2015). Simultaneous phase unwrapping and removal of chemical shift (SPURS) using graph cuts: application in quantitative susceptibility mapping. IEEE Trans. Med. Imaging 34, 531–540. doi: 10.1109/TMI.2014.2361764
Fung, S. H., Roccatagliata, L., Gonzalez, R. G., and Schaefer, P. W. (2011). MR diffusion imaging in ischemic stroke. Neuroimaging Clin. N. Am. 21, 345–377. doi: 10.1016/j.nic.2011.03.001
Gauthier, C. J., and Hoge, R. D. (2012). Magnetic resonance imaging of resting OEF and CMRO2 using a generalized calibration model for hypercapnia and hyperoxia. Neuroimage 60, 1212–1225. doi: 10.1016/j.neuroimage.2011.12.056
He, X., and Yablonskiy, D. A. (2007). Quantitative BOLD: mapping of human cerebral deoxygenated blood volume and oxygen extraction fraction: default state. Magn. Reson. Med. 57, 115–126. doi: 10.1002/mrm.21108
Heidenreich, J. O., Hsu, D., Wang, G., Jesberger, J. A., Tarr, R. W., Zaidat, O. O., et al. (2008). Magnetic resonance imaging results can affect therapy decisions in hyperacute stroke care. Acta Radiol. 49, 550–557. doi: 10.1080/02841850801958320
Heiss, W. D. (2012). David sherman lecture 2012: the role of positron emission tomography for translational research in stroke. Stroke 43, 2520–2525. doi: 10.1161/STROKEAHA.112.658237
Heiss, W. D., and Zaro Weber, O. (2017). Validation of MRI Determination of the Penumbra by PET Measurements in Ischemic Stroke. J Nucl Med 58, 187–193. doi: 10.2967/jnumed.116.185975
Jenkinson, M., Bannister, P., Brady, M., and Smith, S. (2002). Improved optimization for the robust and accurate linear registration and motion correction of brain images. NeuroImage 17, 825–841. doi: 10.1006/nimg.2002.1132
Kudo, K., Liu, T., Murakami, T., Goodwin, J., Uwano, I., Yamashita, F., et al. (2016). Oxygen extraction fraction measurement using quantitative susceptibility mapping: Comparison with positron emission tomography. J. Cereb. Blood Flow Metab. 36, 1424–1433. doi: 10.1177/0271678x15606713
Leigh, R., Knutsson, L., Zhou, J., and van Zijl, P. C. (2018). Imaging the physiological evolution of the ischemic penumbra in acute ischemic stroke. J. Cereb. Blood Flow Metab. 38, 1500–1516. doi: 10.1177/0271678X17700913
Leslie-Mazwi, T. M., Lev, M. H., Schaefer, P. W., Hirsch, J. A., and Gonzalez, R. G. (2018). MR Imaging Selection of Acute Stroke Patients with Emergent Large Vessel Occlusions for Thrombectomy. Neuroimaging Clin. N. Am. 28, 573–584. doi: 10.1016/j.nic.2018.06.003
Liu, Z., Kee, Y., Zhou, D., Wang, Y., and Spincemaille, P. (2016). Preconditioned total field inversion (TFI) method for quantitative susceptibility mapping∗. Magn Reson Med. doi: 10.1002/mrm.26331
Liu, Z., Spincemaille, P., Yao, Y., Zhang, Y., and Wang, Y. (2018). MEDI+0: Morphology enabled dipole inversion with automatic uniform cerebrospinal fluid zero reference for quantitative susceptibility mapping. Magn. Reson. Med. 79, 2795–2803. doi: 10.1002/mrm.26946
Mackey, J., Kleindorfer, D., Sucharew, H., Moomaw, C. J., Kissela, B. M., Alwell, K., et al. (2011). Population-based study of wake-up strokes. Neurology 76, 1662–1667. doi: 10.1212/WNL.0b013e318219fb30
Nogueira, R. G., Jadhav, A. P., Haussen, D. C., Bonafe, A., Budzik, R. F., Bhuva, P., et al. (2018). Thrombectomy 6 to 24 Hours after Stroke with a Mismatch between Deficit and Infarct. N. Engl. J. Med. 378, 11–21. doi: 10.1056/NEJMoa1706442
Ogawa, S., Lee, T. M., Kay, A. R., and Tank, D. W. (1990). Brain magnetic resonance imaging with contrast dependent on blood oxygenation. Proc. Natl. Acad. Sci. U.S.A. 87, 9868–9872. doi: 10.1073/pnas.87.24.9868
Powers, W. J. (1991). Cerebral hemodynamics in ischemic cerebrovascular disease. Ann. Neurol. 29, 231–240. doi: 10.1002/ana.410290302
Powers, W. J., Rabinstein, A. A., Ackerson, T., Adeoye, O. M., Bambakidis, N. C., Becker, K., et al. (2018). 2018 Guidelines for the Early Management of Patients With Acute Ischemic Stroke: A Guideline for Healthcare Professionals From the American Heart Association/American Stroke Association. Stroke 49, e46–e110. doi: 10.1161/STR.0000000000000158
Pushie, M. J., Crawford, A. M., Sylvain, N. J., Hou, H., Hackett, M. J., George, G. N., et al. (2018). Revealing the Penumbra through Imaging Elemental Markers of Cellular Metabolism in an Ischemic Stroke Model. ACS Chem Neurosci 9, 886–893. doi: 10.1021/acschemneuro.7b00382
Saver, J. L., Goyal, M., van der Lugt, A., Menon, B. K., Majoie, C. B. L. M., Dippel, D. W., et al. (2016). Time to Treatment With Endovascular Thrombectomy and Outcomes From Ischemic Stroke: A Meta-analysis. Jama-Journal of the American Medical Association 316, 1279–1288. doi: 10.1001/jama.2016.13647
Sobesky, J., Zaro-Weber, O., Lehnhardt, F. G., Vaaa, H., Neveling, M., Jacobs, A., et al. (2005). Does the mismatch match the penumbra? Magnetic resonance imaging and positron emission tomography in early ischemic stroke∗∗. Stroke 36, 980–985. doi: 10.1161/01.STR.0000160751.79241.a3
Spincemaille, P., Liu, Z., Zhang, S., Kovanlikaya, I., Ippoliti, M., Makowski, M., et al. (2019). Clinical Integration of Automated Processing for Brain Quantitative Susceptibility Mapping: Multi-Site Reproducibility and Single-Site Robustness. J. Neuroimaging 29, 689–698. doi: 10.1111/jon.12658
Thirugnanachandran, T., Ma, H., Singhal, S., Slater, L. A., Davis, S. M., Donnan, G. A., et al. (2018). Refining the ischemic penumbra with topography. Int J Stroke 13, 277–284. doi: 10.1177/1747493017743056
Tian, T., Guo, L., Xu, J., Zhang, S., Shi, J., Liu, C., et al. (2016). Brain white matter plasticity and functional reorganization underlying the central pathogenesis of trigeminal neuralgia. Sci Rep 6, 36030. doi: 10.1038/srep36030
Uwano, I., Kudo, K., Sato, R., Ogasawara, K., Kameda, H., Nomura, J. I., et al. (2017). Noninvasive Assessment of Oxygen Extraction Fraction in Chronic Ischemia Using Quantitative Susceptibility Mapping at 7 Tesla. Stroke 48, 2136–2141. doi: 10.1161/STROKEAHA.117.017166
Wang, D. J., Alger, J. R., Qiao, J. X., Hao, Q., Hou, S., Fiaz, R., et al. (2012). The value of arterial spin-labeled perfusion imaging in acute ischemic stroke: comparison with dynamic susceptibility contrast-enhanced MRI. Stroke 43, 1018–1024. doi: 10.1161/STROKEAHA.111.631929
Wang, W. Z., Jiang, B., Sun, H. X., Ru, X. J., Sun, D. L., Wang, L. H., et al. (2017). Prevalence, Incidence, and Mortality of Stroke in China Results from a Nationwide Population-Based Survey of 480 687 Adults. Circulation 135, 759. doi: 10.1161/Circulationaha.116.025250
Wang, Y., and Liu, T. (2015). Quantitative susceptibility mapping (QSM): Decoding MRI data for a tissue magnetic biomarker. Magn. Reson. Med. 73, 82–101. doi: 10.1002/mrm.25358
Wolf, R. L., and Detre, J. A. (2007). Clinical neuroimaging using arterial spin-labeled perfusion magnetic resonance imaging. Neurotherapeutics 4, 346–359. doi: 10.1016/j.nurt.2007.04.005
Wouters, A., Christensen, S., Straka, M., Mlynash, M., Liggins, J., Bammer, R., et al. (2017). A Comparison of Relative Time to Peak and Tmax for Mismatch-Based Patient Selection. Front Neurol 8:539. doi: 10.3389/fneur.2017.00539
Wu, L., Wu, W., Tali, E. T., and Yuh, W. T. (2018). Oligemia, Penumbra, Infarction: Understanding Hypoperfusion with Neuroimaging. Neuroimaging Clin. N. Am. 28, 599–609. doi: 10.1016/j.nic.2018.06.013
Yablonskiy, D. A., and Haacke, E. M. (1994a). Theory of NMR signal behavior in magnetically inhomogeneous tissues: the static dephasing regime. Magn. Reson. Med. 32, 749–763. doi: 10.1002/mrm.1910320610
Yablonskiy, D. A., and Haacke, E. M. (1994b). Theory of NMR signal behavior in magnetically inhomogeneous tissues: the static dephasing regime. Magn. Reson. Med. 32, 749–763. doi: 10.1002/mrm.1910320610
Yablonskiy, D. A., Sukstanskii, A. L., and He, X. (2013a). BOLD-based Techniques for Quantifying Brain Hemodynamic and Metabolic Properties – Theoretical Models and Experimental Approaches. NMR Biomed. 26, 963–986. doi: 10.1002/nbm.2839
Yablonskiy, D. A., Sukstanskii, A. L., Luo, J., and Wang, X. (2013b). Voxel spread function method for correction of magnetic field inhomogeneity effects in quantitative gradient-echo-based MRI. Magn. Reson. Med. 70, 1283–1292. doi: 10.1002/mrm.24585
Yang, J., d’Esterre, C., Ceruti, S., Roversi, G., Saletti, A., Fainardi, E., et al. (2015). Temporal changes in blood-brain barrier permeability and cerebral perfusion in lacunar/subcortical ischemic stroke. BMC Neurol. 15:214. doi: 10.1186/s12883-015-0468-460
Zaharchuk, G. (2011). Arterial spin label imaging of acute ischemic stroke and transient ischemic attack. Neuroimaging Clin. N. Am. 21, 285–301. doi: 10.1016/j.nic.2011.01.003
Zaro-Weber, O., Moeller-Hartmann, W., Siegmund, D., Kandziora, A., Schuster, A., Heiss, W. D., et al. (2017). MRI-based mismatch detection in acute ischemic stroke: Optimal PWI maps and thresholds validated with PET. J. Cereb. Blood Flow Metab. 37, 3176–3183. doi: 10.1177/0271678x16685574
Zhang, J., Cho, J., Zhou, D., Nguyen, T. D., Spincemaille, P., Gupta, A., et al. (2018). Quantitative susceptibility mapping-based cerebral metabolic rate of oxygen mapping with minimum local variance. Magn. Reson. Med. 79, 172–179. doi: 10.1002/mrm.26657
Zhang, J., Liu, T., Gupta, A., Spincemaille, P., Nguyen, T. D., and Wang, Y. (2015). Quantitative mapping of cerebral metabolic rate of oxygen (CMRO2) using quantitative susceptibility mapping (QSM). Magn. Reson. Med. 74, 945–952. doi: 10.1002/mrm.25463
Keywords: ischemic stroke, MRI, oxygen extraction fraction, cerebral metabolic rate of oxygen, quantitative susceptibility mapping, cerebral blood flow
Citation: Zhang S, Cho J, Nguyen TD, Spincemaille P, Gupta A, Zhu W and Wang Y (2020) Initial Experience of Challenge-Free MRI-Based Oxygen Extraction Fraction Mapping of Ischemic Stroke at Various Stages: Comparison With Perfusion and Diffusion Mapping. Front. Neurosci. 14:535441. doi: 10.3389/fnins.2020.535441
Received: 16 February 2020; Accepted: 18 August 2020;
Published: 16 September 2020.
Edited by:
Alard Roebroeck, Maastricht University, NetherlandsReviewed by:
Ives R. Levesque, McGill University, CanadaJean Chen, University of Toronto, Canada
Chunmei Li, Beijing Hospital, China
Kamil Uludag, Maastricht University, Netherlands
Lirong Yan, University of Southern California, Los Angeles, United States
Copyright © 2020 Zhang, Cho, Nguyen, Spincemaille, Gupta, Zhu and Wang. This is an open-access article distributed under the terms of the Creative Commons Attribution License (CC BY). The use, distribution or reproduction in other forums is permitted, provided the original author(s) and the copyright owner(s) are credited and that the original publication in this journal is cited, in accordance with accepted academic practice. No use, distribution or reproduction is permitted which does not comply with these terms.
*Correspondence: Wenzhen Zhu, emh1d2Vuemhlbjg2MTJAMTYzLmNvbQ==; Yi Wang, eWl3YW5nQG1lZC5jb3JuZWxsLmVkdQ==