 Yvonne Bouter
 Tim Kacprowski
 Fanny Rößler
 Lars R. Jensen
 Andreas W. Kuss
 Thomas A. Bayer
- 1Division of Molecular Psychiatry, Department of Psychiatry and Psychotherapy, University Medical Center Göttingen (UMG), Georg-August-University, Göttingen, Germany
- 2Research Group Computational Systems Medicine, Chair of Experimental Bioinformatics, TUM School of Life Sciences Weihenstephan (WZW), Technical University of Munich (TUM), Weihenstephan, Germany
- 3Human Molecular Genetics Group, Department of Functional Genomics, Interfaculty Institute for Genetics and Functional Genomics, University Medicine Greifswald, Greifswald, Germany
The transcriptome of non-coding RNA (ncRNA) species is increasingly focused in Alzheimer’s disease (AD) research. NcRNAs comprise, among others, transfer RNAs, long non-coding RNAs and microRNAs (miRs), each with their own specific biological function. We used smallRNASeq to assess miR expression in the hippocampus of young (3 month old) and aged (8 month old) Tg4-42 mice, a model system for sporadic AD, as well as age-matched wildtype controls. Tg4-42 mice express N-truncated Aβ4–42, develop age-related neuron loss, reduced neurogenesis and behavioral deficits. Our results do not only confirm known miR-AD associations in Tg4-42 mice, but more importantly pinpoint 22 additional miRs associated to the disease. Twenty-five miRs were differentially expressed in both aged Tg4-42 and aged wildtype mice while eight miRs were differentially expressed only in aged wildtype mice, and 33 only in aged Tg4-42 mice. No significant alteration in the miRNome was detected in young mice, which indicates that the changes observed in aged mice are down-stream effects of Aβ-induced pathology in the Tg4-42 mouse model for AD. Targets of those miRs were predicted using miRWalk. For miRs that were differentially expressed only in the Tg4-42 model, 128 targets could be identified, whereas 18 genes were targeted by miRs only differentially expressed in wildtype mice and 85 genes were targeted by miRs differentially expressed in both mouse models. Genes targeted by differentially expressed miRs in the Tg4-42 model were enriched for negative regulation of long-term synaptic potentiation, learning or memory, regulation of trans-synaptic signaling and modulation of chemical synaptic transmission obtained. This untargeted miR sequencing approach supports previous reports on the Tg4-42 mice as a valuable model for AD. Furthermore, it revealed miRs involved in AD, which can serve as biomarkers or therapeutic targets.
Introduction
MiRs are short non-coding RNAs that are heavily involved in post-transcriptional regulation of gene expression through targeting specific mRNAs (Bartel, 2004). The miR transcriptome (miRNome) includes all miR species and renders a profile of gene regulation at the studied time point and location. Altered miR expression profiles therefore provide information not only about the miRs themselves, but also about their target genes and, hence, the regulated processes. As miRs have already been implicated in neurodevelopment and brain aging, as well as in synapse function and cognitive performance, in both, health and disease (Salta and De Strooper, 2012, 2017b), this information can pinpoint mechanisms involved in the molecular pathogenesis of Alzheimer’s disease (AD). Furthermore, miRs can easily be targeted by artificial oligonucleotides to influence gene regulation for therapeutic processes (Roshan et al., 2009). Hence, miRNome profiling ultimately promotes the search for new biomarkers and therapeutics.
Next-generation sequencing (NGS) of the miR pool offers an unbiased technical approach to identify the miR signature of cells, tissues or organs. Previous reports have demonstrated the power of NGS to unravel the molecular profile of pathological alterations in neurodegenerative diseases like AD (Twine et al., 2011). Differentially expressed genes (DEGs) were identified by RNASeq of young, and aged Tg4-42 mice in comparison with 5XFAD mice, another AD mouse model (Bouter et al., 2014). Many of the DEGs specifically found in the 5XFAD model belong to neuroinflammatory processes typically associated with plaques. Other DEGs were found in both AD mouse models indicating common disease pathways associated with behavioral deficits and neuron loss. The 5XFAD model develops early plaque formation, intraneuronal Aβ aggregation, neuron loss, and behavioral deficits (Oakley et al., 2006; Jawhar et al., 2012). As such the 5XFAD model is widely used in the AD field. High-throughput RNASeq analysis of young 5XFAD mice, e.g., identified DEGs in the frontal cortex mainly associated with cardiovascular disease and DEGs in the cerebellum mainly associated with mitochondrial dysfunction (Kim et al., 2012).
A plethora of previous publications discuss miRs as potentially involved in the pathogenesis of AD and/or as putative biomarkers for AD including several systematic assessments of the importance of miRs in this disorder [reviewed for example by Salta and De Strooper (2012, 2017b), Angelucci et al. (2019), Wang et al. (2019)]. Notably, the expression of miR-338-5p was significantly down-regulated in the hippocampus of patients with AD and 5XFAD transgenic mice (Qian et al., 2019). The expression of miR-146a correlated with plaque load and synaptic pathology in Tg2576 and in 5XFAD mice (Li et al., 2011).
We have performed NGS of the miRNome of the hippocampus of young (3 month old) and aged (8 month old) Tg4-42 mice, which represent a unique model for sporadic AD. The Tg4-42 model expresses only wildtype non-mutant Aβ4–42 and develops at the age of 8 months, severe neuron loss and hippocampus-related behavioral deficits (Bouter et al., 2013). At 3 months of age, Tg4-42 mice show reduced neurogenesis (Gerberding et al., 2019) and synaptic hyperexcitability (Dietrich et al., 2018), which represents an early sign of AD-typical alteration. Reduced glucose metabolism detected by FDG-PET in vivo imaging (Bouter et al., 2019) correlates well with the observed neuron loss and neurological deficits at 8 months of age (Bouter et al., 2013). The aim of the current study was to identify miRs and their targets to unravel molecules and processes triggered by AD-typical memory deficits and hippocampal neuron death. Therefore, we compared the age of 3 months (prior to neuron loss and neurological alterations) with the age of 8 months (after onset of neuron loss and neurological alterations).
Materials and Methods
Transgenic Mice
We used the transgenic mouse lines Tg4-42 kept on the C57Bl/6J genetic background. Tg4-42 mice express human Aβ4–42 fused to the murine TRH signal peptide under the control of the neuronal Thy-1 promoter (Bouter et al., 2013). Young (3 month) and aged (8 month) Tg4-42 and age-matched wildtype control mice (WT, C57BL/6J) were studied. All animals were handled according to the German guidelines for animal care. All efforts were made to minimize suffering and the number of animals used for this study.
Tissue Harvesting
Mice were sacrificed via CO2 anaesthetization followed by cervical dislocation. Brain hemispheres were carefully dissected and the hippocampus removed, frozen on dry ice and stored at −80°C for subsequent use.
Small RNA Next-Generation Sequencing
Small RNA-isolation was performed using the miRVana miRNA Isolation Kit (Life Technologies) according to the manufacturer’s instructions. For library preparation, we used the Ion Total RNA-Seq Kit v2 for Small RNA Libraries (Life Technologies) for sequencing on an Ion PGM system (Thermo Fisher Scientific) running Torrent Suite software 5.12.1., again following the instructions of the manufacturer. STAR v2.6.0a with default parameters was used to map the reads to the GRCm38 (mm10) mouse assembly (Dobin et al., 2013). Afterward, read counts per feature were determined with HTSeq v0.10.0 (Anders et al., 2015). Bam files were submitted to the European Nucleotide Archive1 with the accession identification number of the project PRJEB39314.
Differential Expression Analysis
During quality control of the mapped data, RNAs with less than 10 readcounts across all samples were excluded and technical replicates were collapsed after heatmap inspection (Supplementary Figure S1). Transcripts with less than 10 reads across all remaining samples were discarded. The heatmap in Supplementary Figure S1 was compiled with variance-stabilized data, while the differential expression analyses were conducted on the raw count data, due to DESeq2’s statistical model (Love et al., 2014). The comparisons were done across contrasts corresponding to the age groups or the genotypes, respectively. Correction for multiple testing was done via independent hypothesis weighting as implemented in DESeq2 (Love et al., 2014), and a result was deemed significant if FDR <0.05.”
MiR Target and Overrepresentation Analysis
For the target mining of differentially expressed miRs (FDR<0.05) we used miRWalk version 3 (Sticht et al., 2018), which uses a random forest based algorithm, and TarPmiR (Ding et al., 2016), to predict possible miR targets. It also allows to compare the results with the predictions of other target mining algorithms such as TargetScan (Agarwal et al., 2015) and miRDB (Chen and Wang, 2020), as well as validated interactions from miRTarBase (Chou et al., 2018). Only gene targets that were confirmed by at least two of these databases were considered for the further analysis to minimize false positives. The analysis required unique miR names mapped to the specific strand. Hence, we used both miR-3p and miR-5p, if available. The identified targets were then used to conduct a Gene Ontology (GO) (Rigden and Fernandez, 2018) overrepresentation analysis with the PANTHER algorithm (Mi et al., 2019) relying on the GO release of December 9th, 2019, to check for biological processes that are targeted by the differentially expressed miRs.
Results
NGS of Non-coding RNAs in Mouse Hippocampus
Small RNASeq yielded 761,373 and 1,054,109 raw sequence reads for young and old wildtype (WT) mouse hippocampi, respectively. For young WT mice on average 160,723 reads (n = 4; on average 84% of raw reads) and for old WT mice 213,338 reads (n = 4; on average 81% of raw reads) per animal were mapped.
For Tg4-42 mice a total of 758,968 (4 young animals) and 2,252,799 (4 old animals, each sequenced twice) raw reads were produced. In young Tg4-42 mice, mapping was successful for on average 160,808 reads per sample (on average 85% of raw reads) and for old Tg4-42 mice on average 449,797 mapped reads per animal (224,899 reads per sample; on average 80% of raw reads) were obtained.
Analyses of miRs at 3 and 8 Months of Age in Tg4-42 and Wildtype Mice
In order to demonstrate the expression and significant distribution of identified miRs volcano plots were created (Figures 1A,B). In total, 237 miRs were detected. There was a significant change in expression of 58 miRs observed between young and aged Tg4-42, as well as between young and aged WT mice (Figure 1C). No significant differences were observed across genotypes within an age group (data not shown). Of 33 differentially expressed miRs exclusively found in aged Tg4-42 mice, some were reported to be association with AD. The remaining miRs could now be associated with an AD-typical mouse model for the first time. Figure 2 demonstrates the levels of all miRs with a significantly altered expression level between 3 and 8 months of age either in Tg4-42, WT or in both. In aged Tg4-42 mice, mostly decreased levels of miRs have been observed.
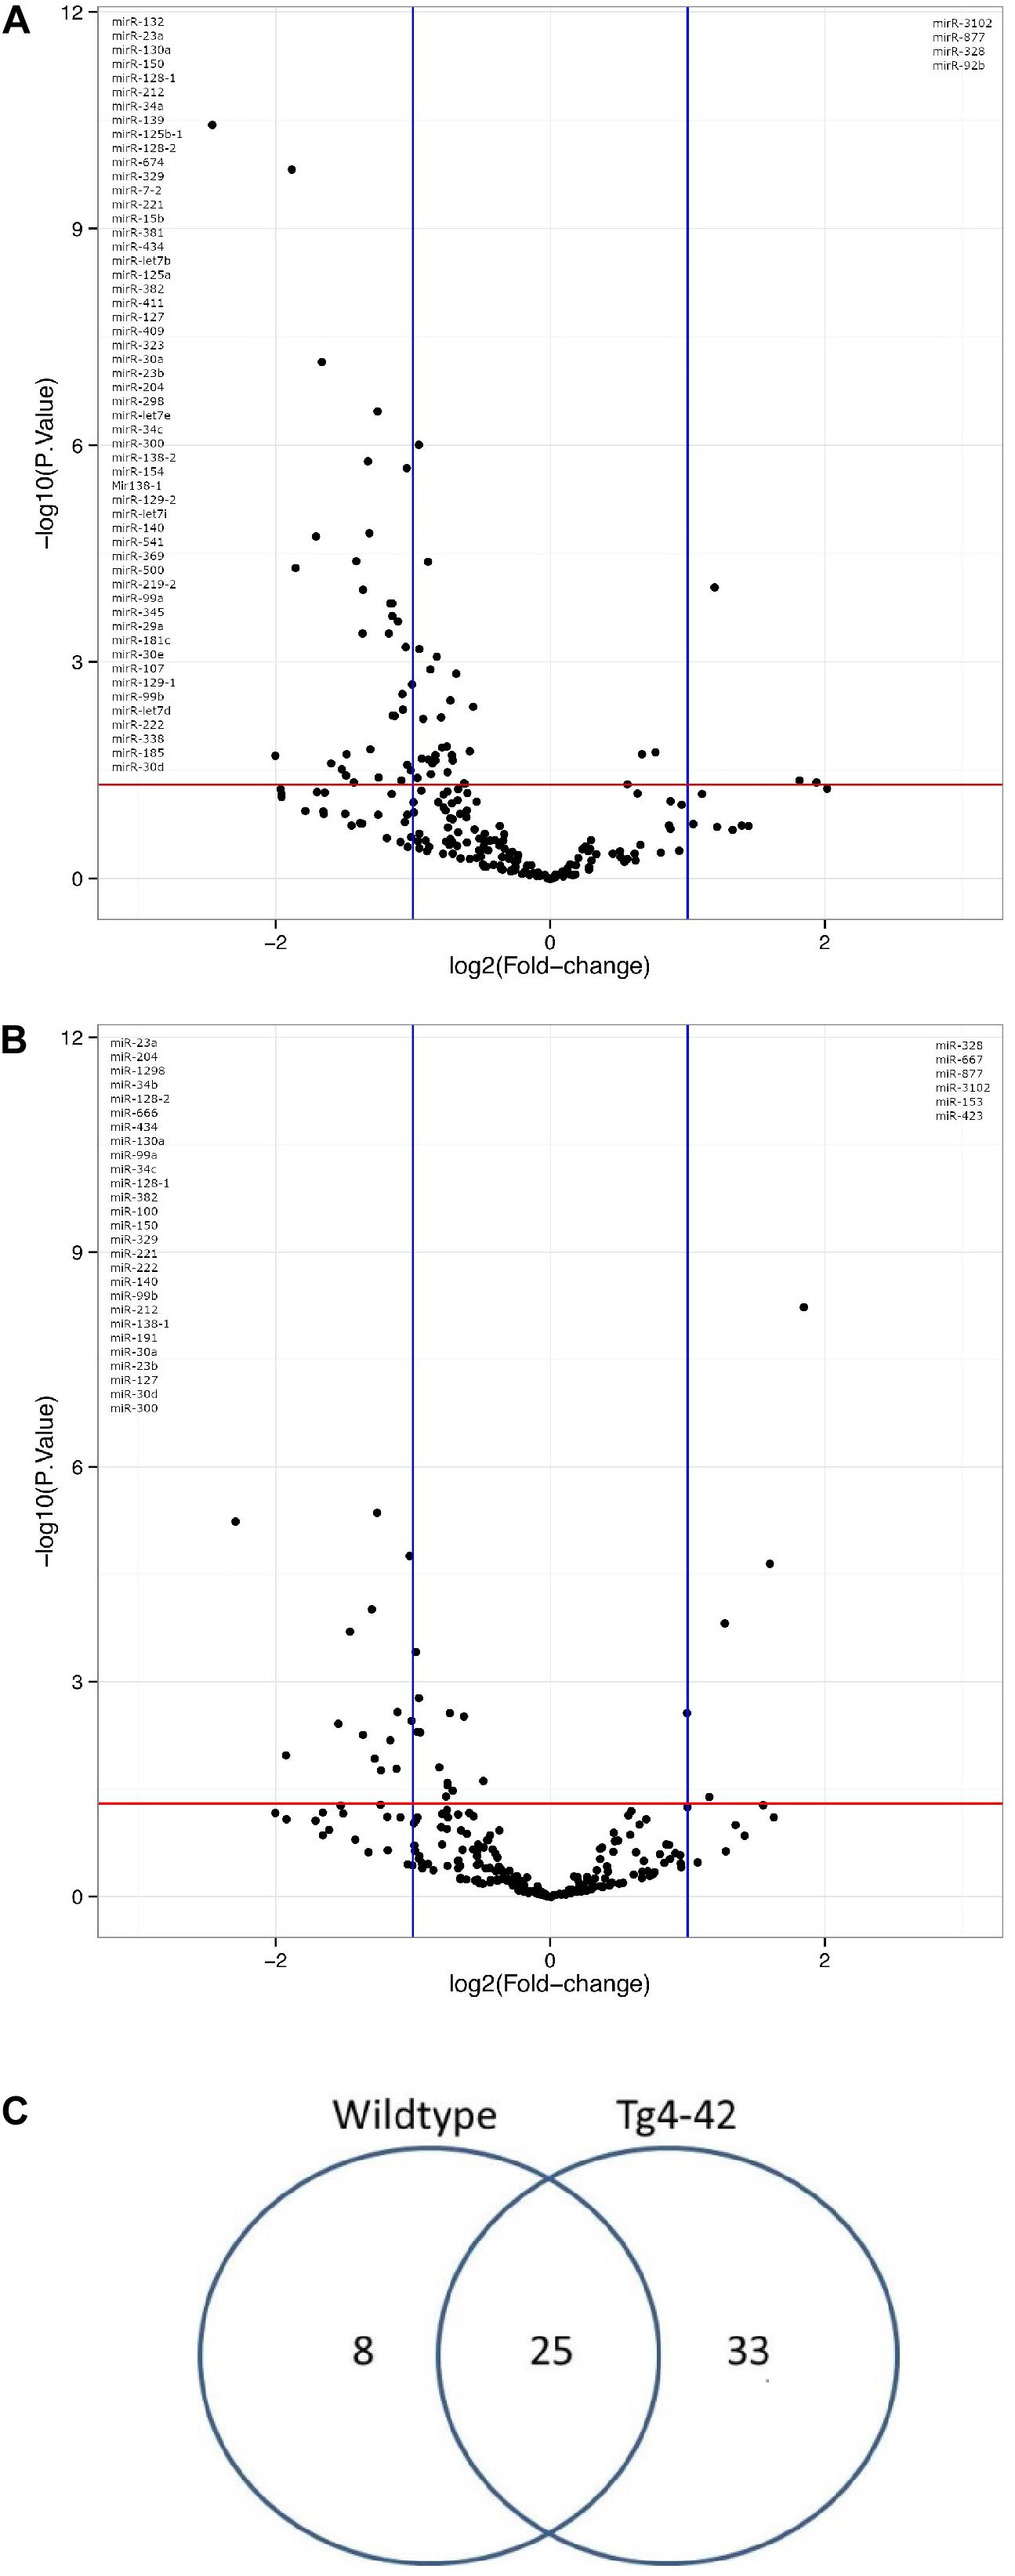
Figure 1. Genotyp-specific expression of miRs with significantly altered expression level during aging. Volcano plot comparison of the fold changes and values of miR expression in WT (A) and Tg4-42 (B) mice. The vertical lines correspond to 2-fold up and down, respectively, and the horizontal line represents a p-value of 0.05. (C) miRs in hippocampus of young (3 month old) and aged (8 month old) Tg4-42 and WT mice. Total number of significantly altered miR expression levels between 3 and 8 months of age n = 58; 8 in WT, 33 in Tg4-42 and 25 in both WT and Tg4-42 mice.
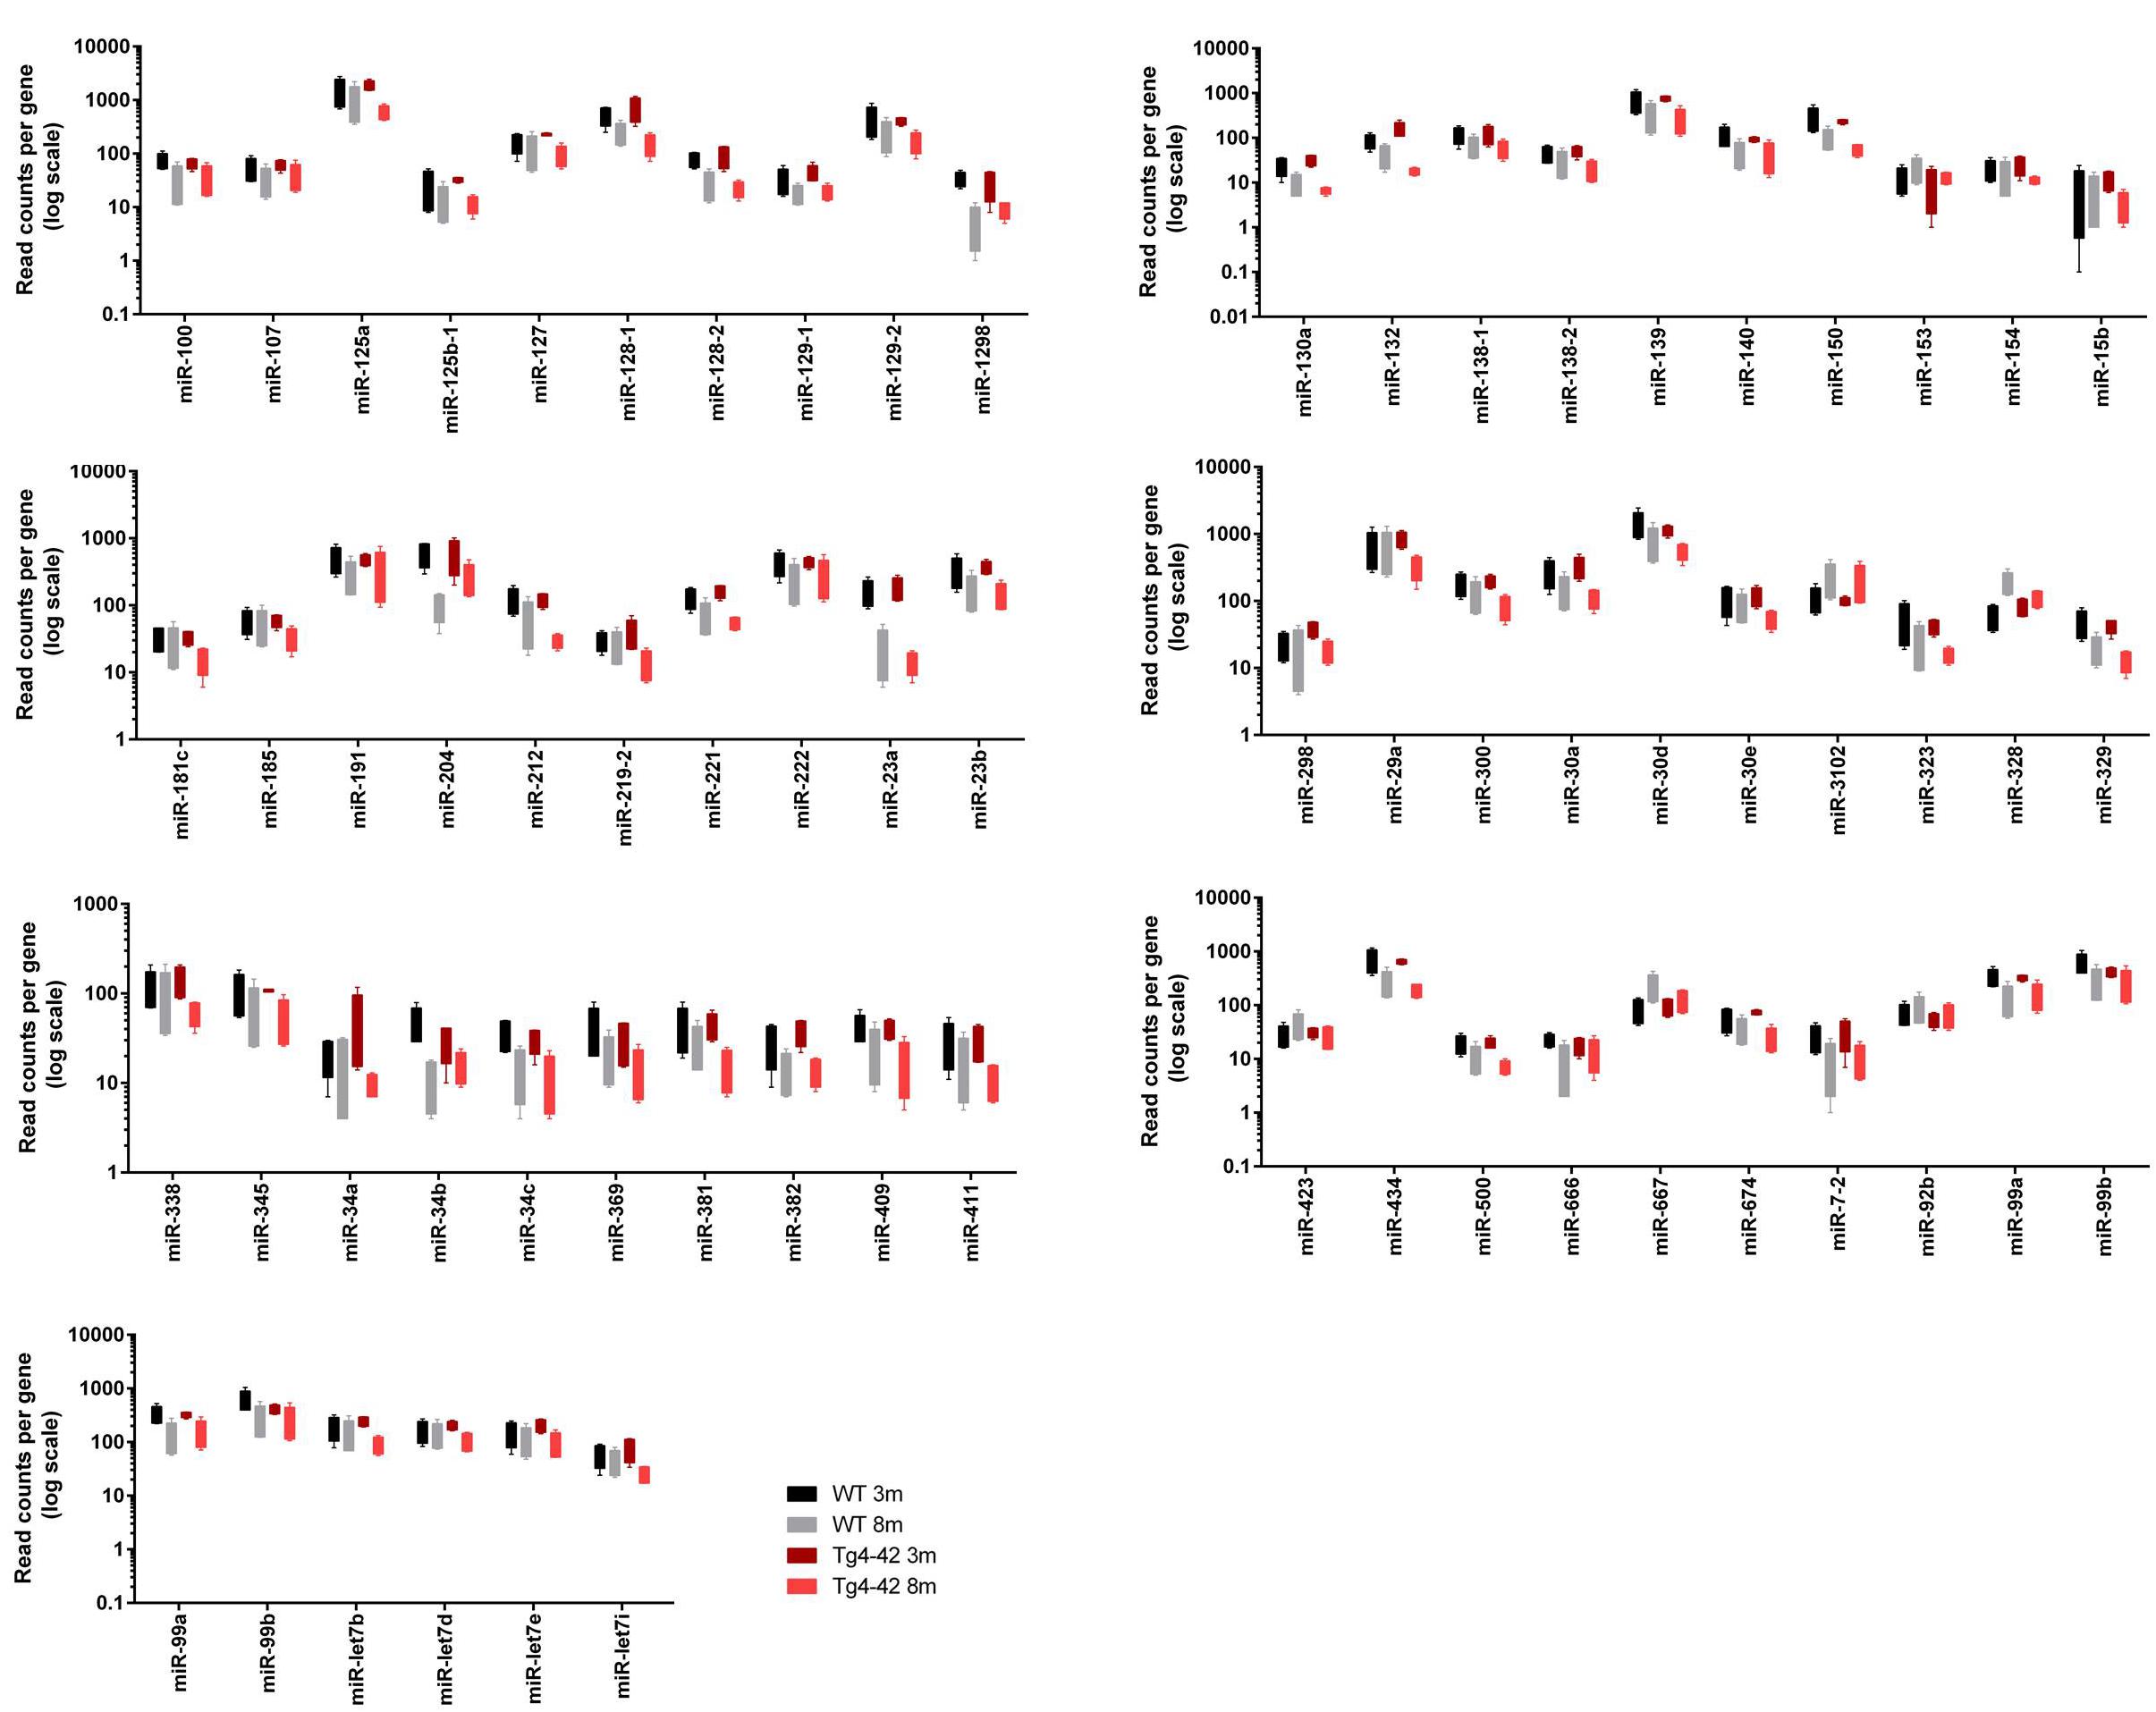
Figure 2. Box plots of significantly altered miRs in hippocampus of young (3 month old; 3m) and aged (8 month old; 8m) Tg4-42 and WT.
Table 1 lists references for known links to AD, other neurodegenerative disorders and/or brain function. Five miRs identified in aged WT mouse brain were increased and four decreased during aging (Table 2). MiRs found in both Tg4-42 and WT hippocampi were decreased during aging, only one was increased (Table 3). The GO annotation analysis of predicted miR targets in Tg4-42 revealed that reduced long-term synaptic potentiation, learning or memory, regulation of trans-synaptic signaling and modulation of chemical synaptic transmission obtained top scores (Figure 3A). None of these annotations were overrepresented in WT mice (Figure 3B). The GO analysis of predicted miR targets in either Tg4-42 or WT mice or both elicited also other cellular components (Table 4), molecular functions (Table 5) and biological processes (Table 6).
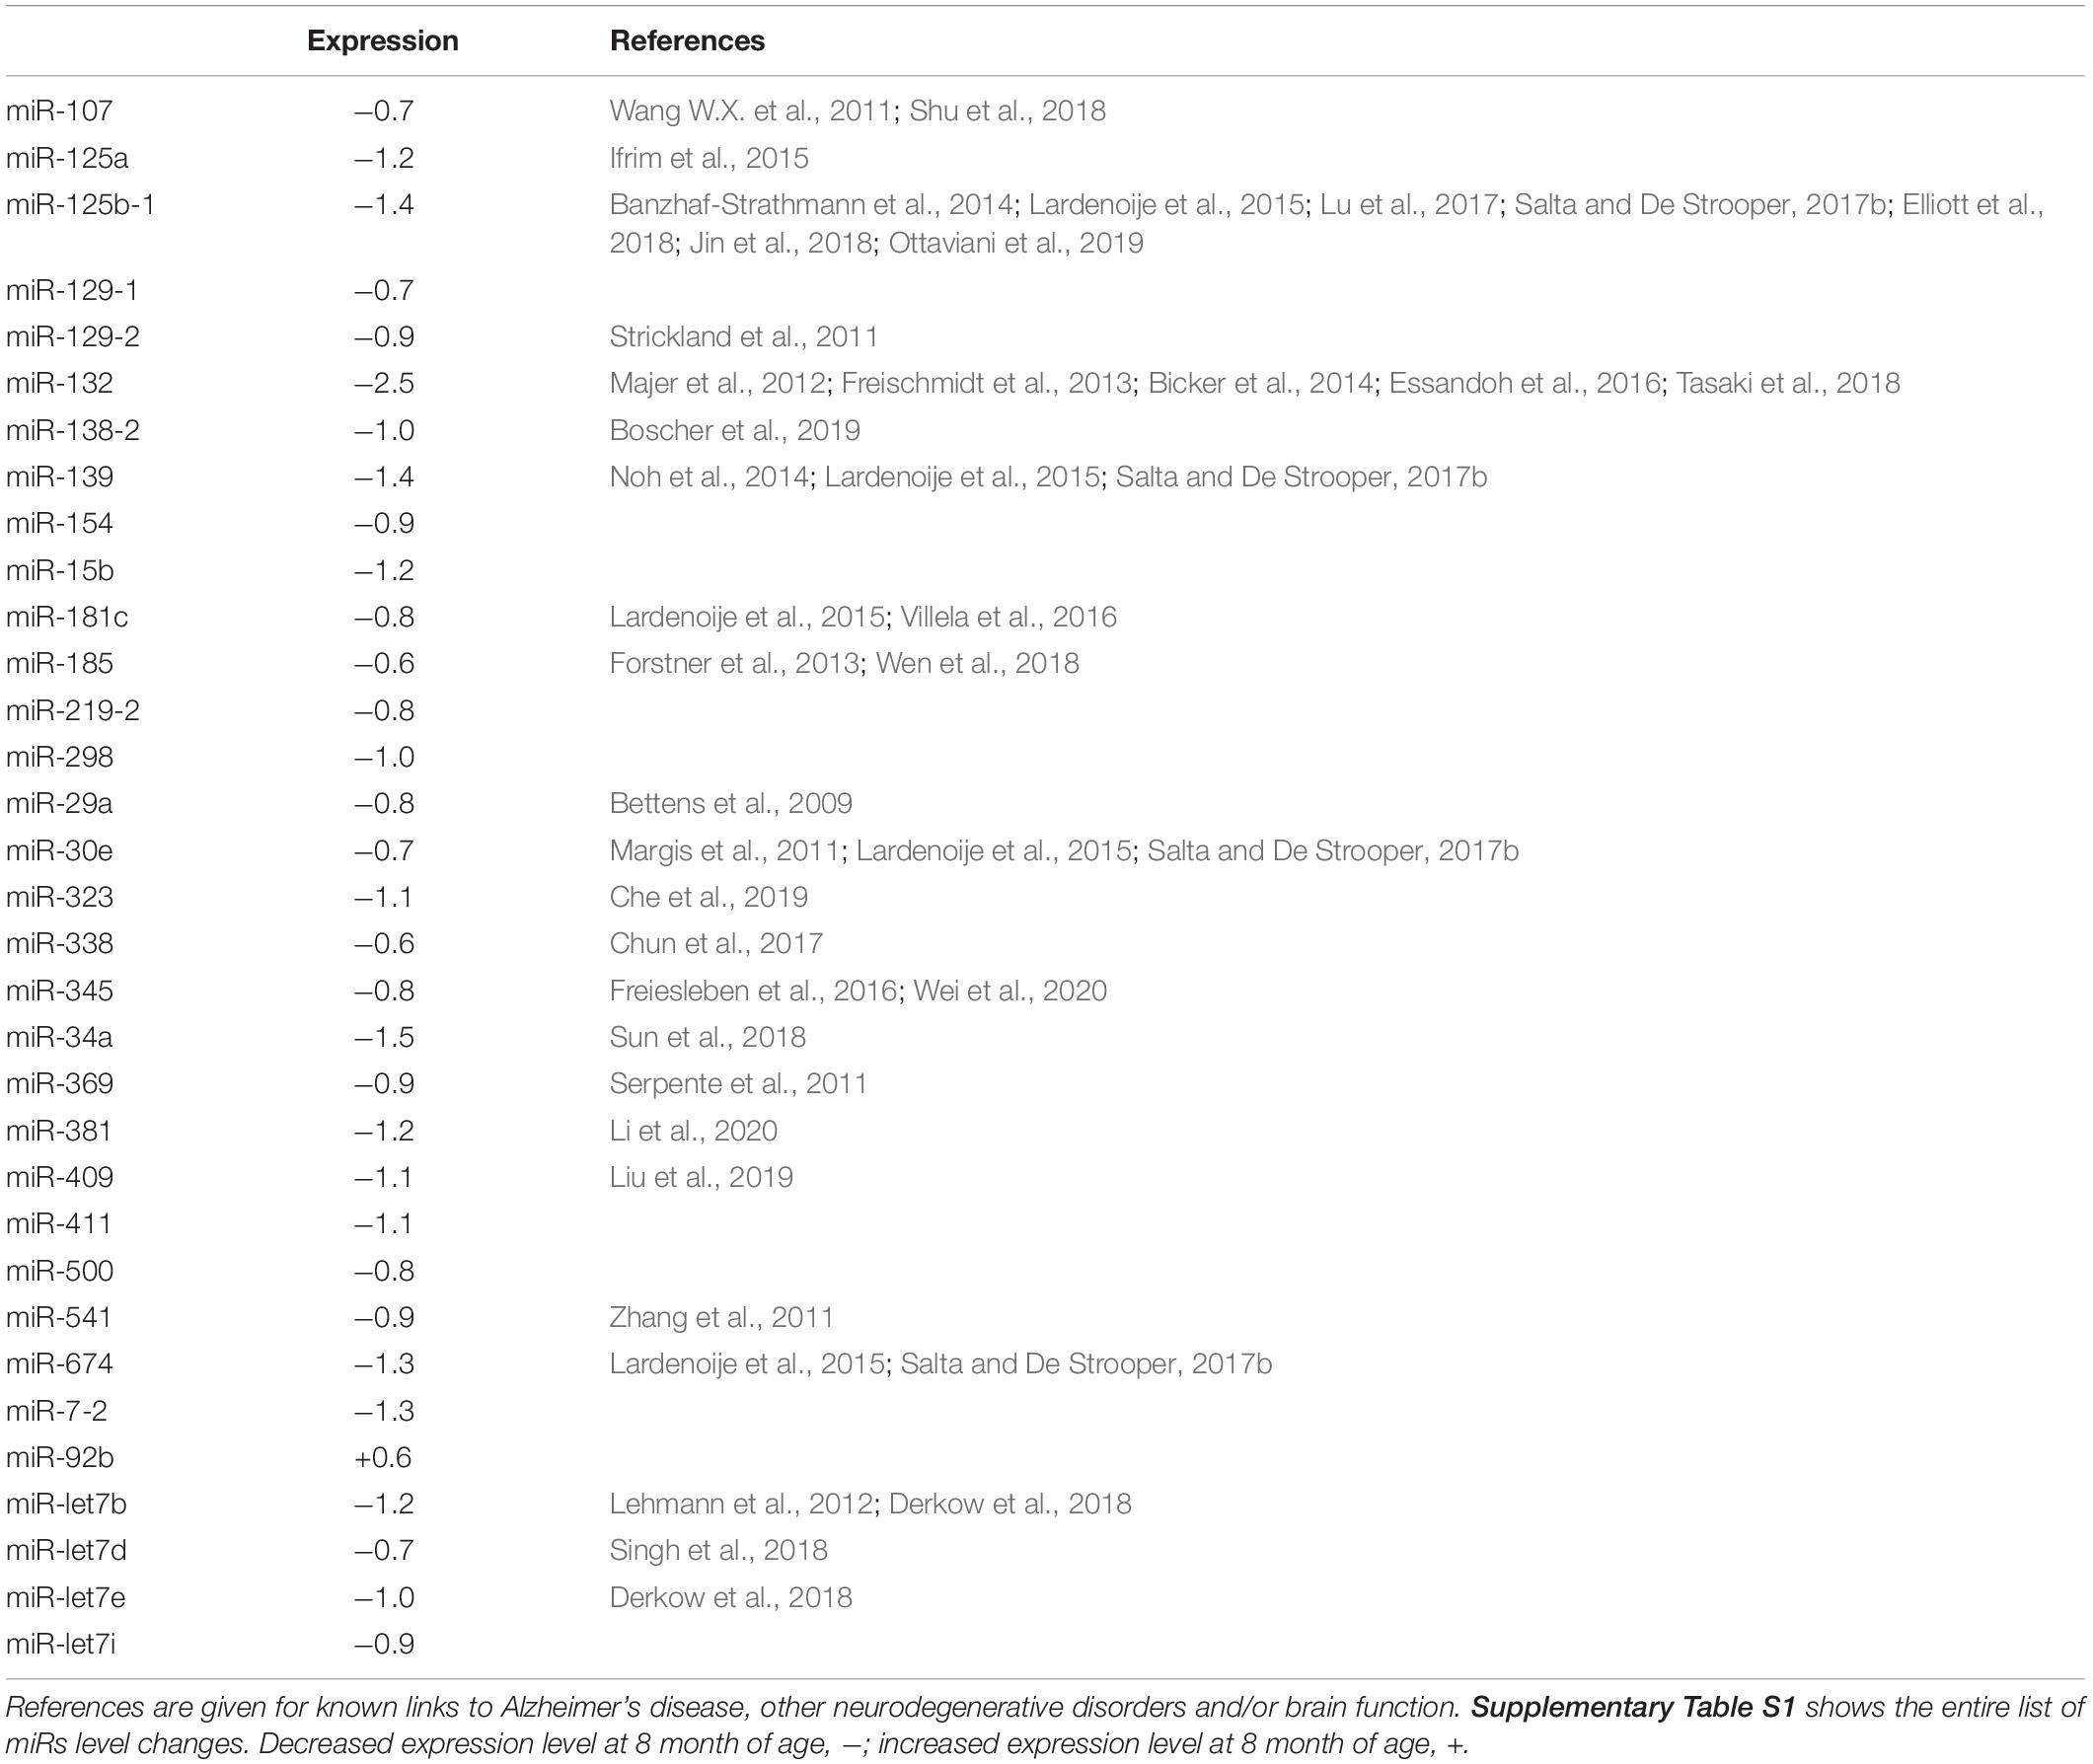
Table 1. MiRs significantly altered in hippocampus between 3 and 8 month-old exclusively in Tg4-42 mice.
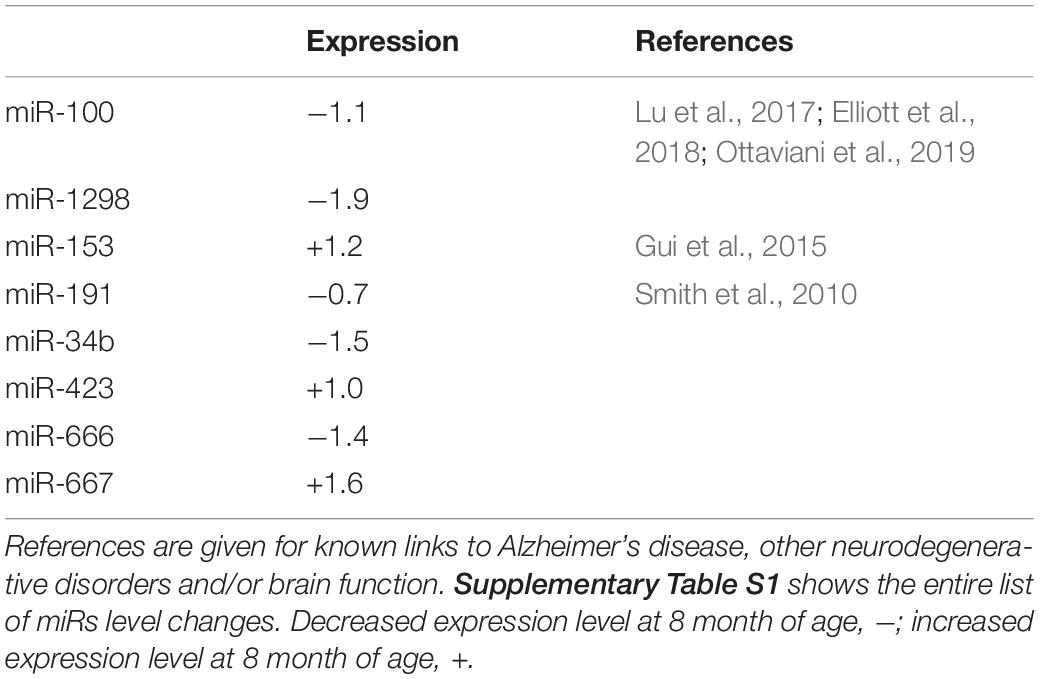
Table 2. MiRs significantly altered in hippocampus between 3 and 8 month-old exclusively in wildtype mice.
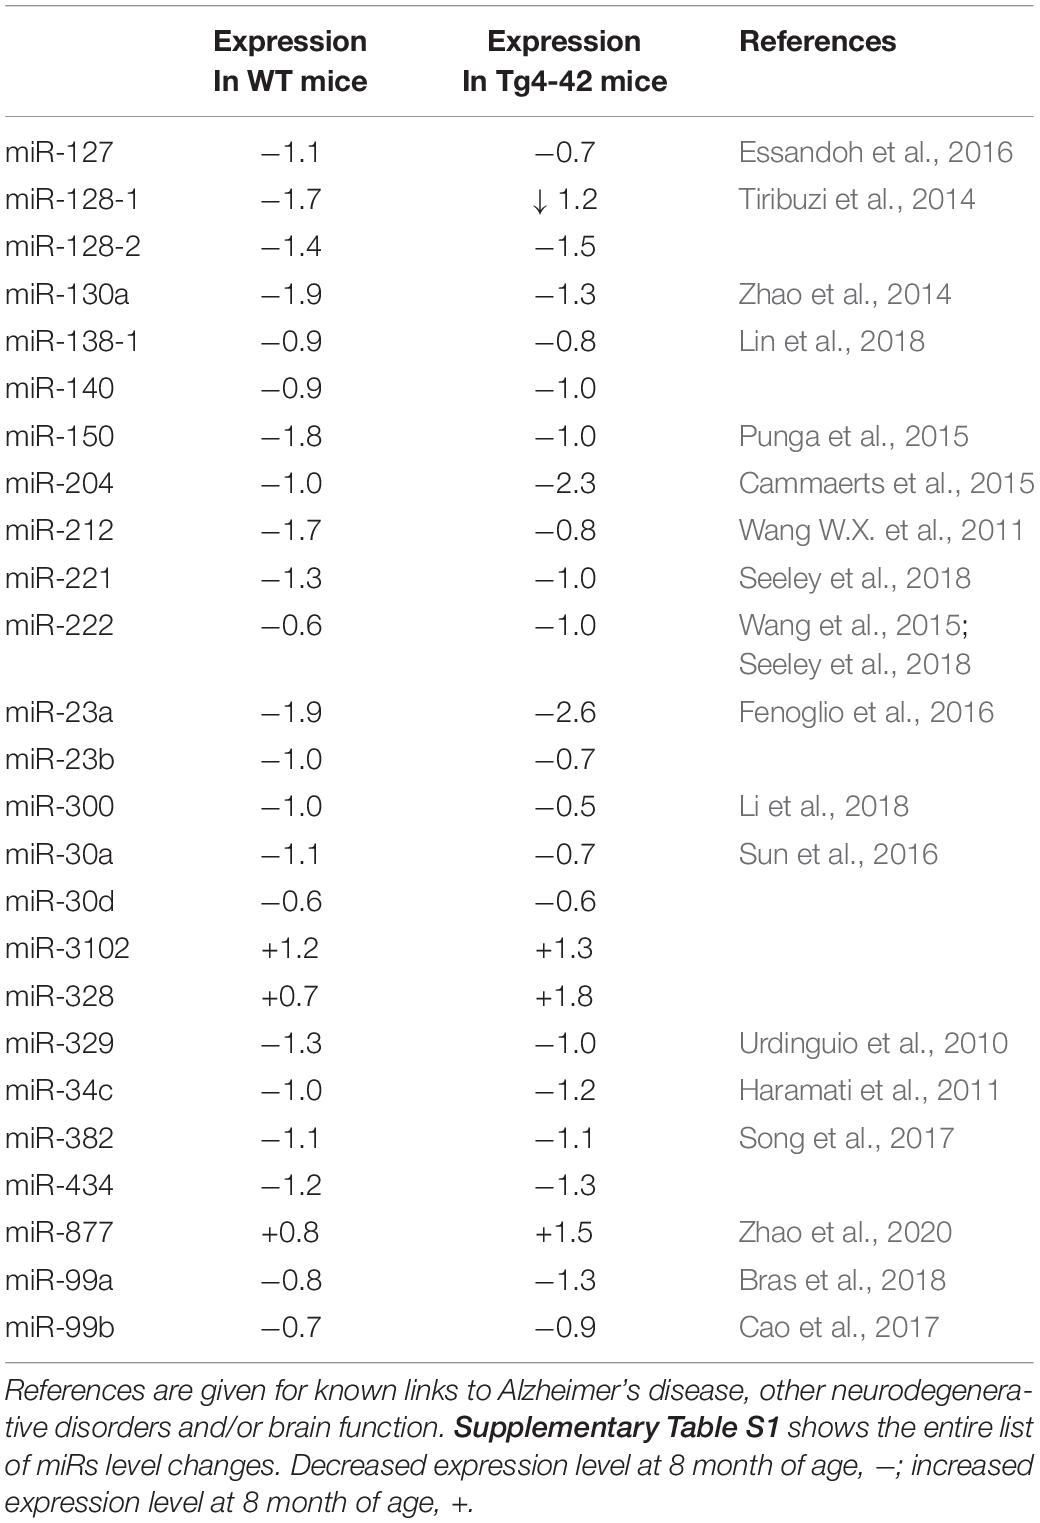
Table 3. MiRs significantly altered in hippocampus between 3 and 8 month-old wildtype mice and Tg4-42 mice.
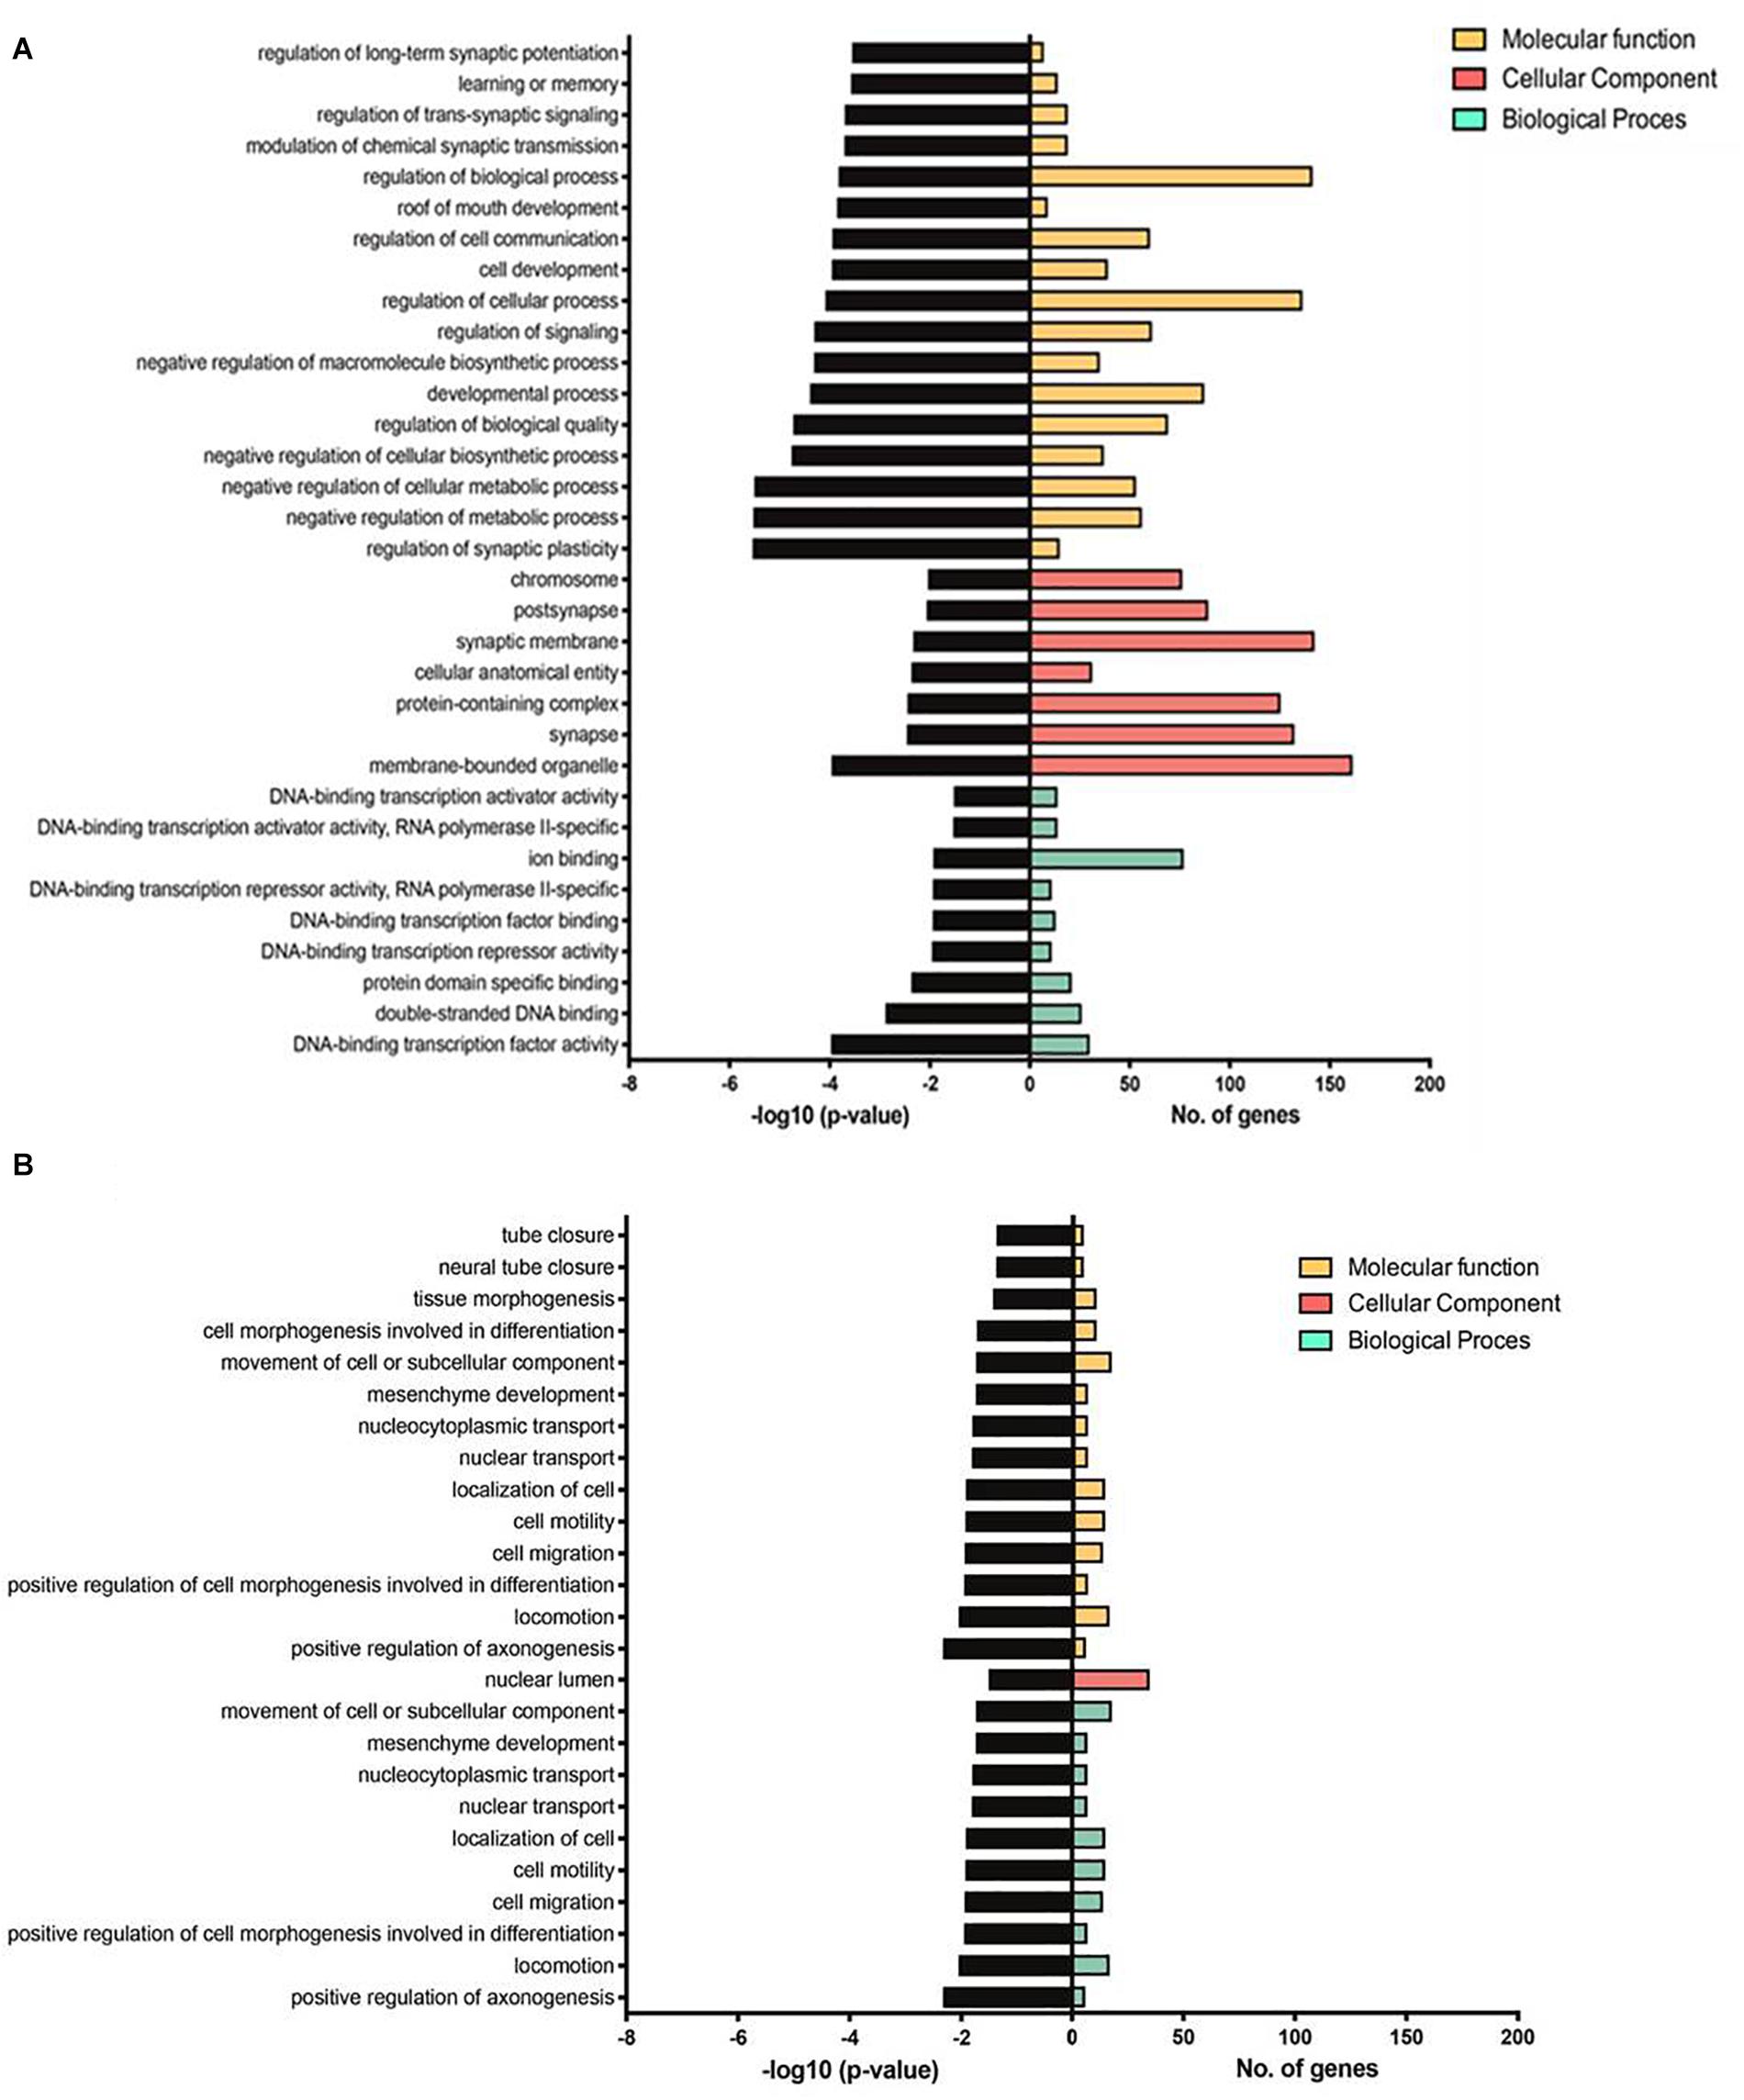
Figure 3. GO annotation analysis of predicted miR targets in Tg4-42 (A) and WT mice (B). Number of genes enriched and –log10 (P-value) for each term are displayed for the top 17 GO terms, if applicable, in molecular function, cellular component and biological process.
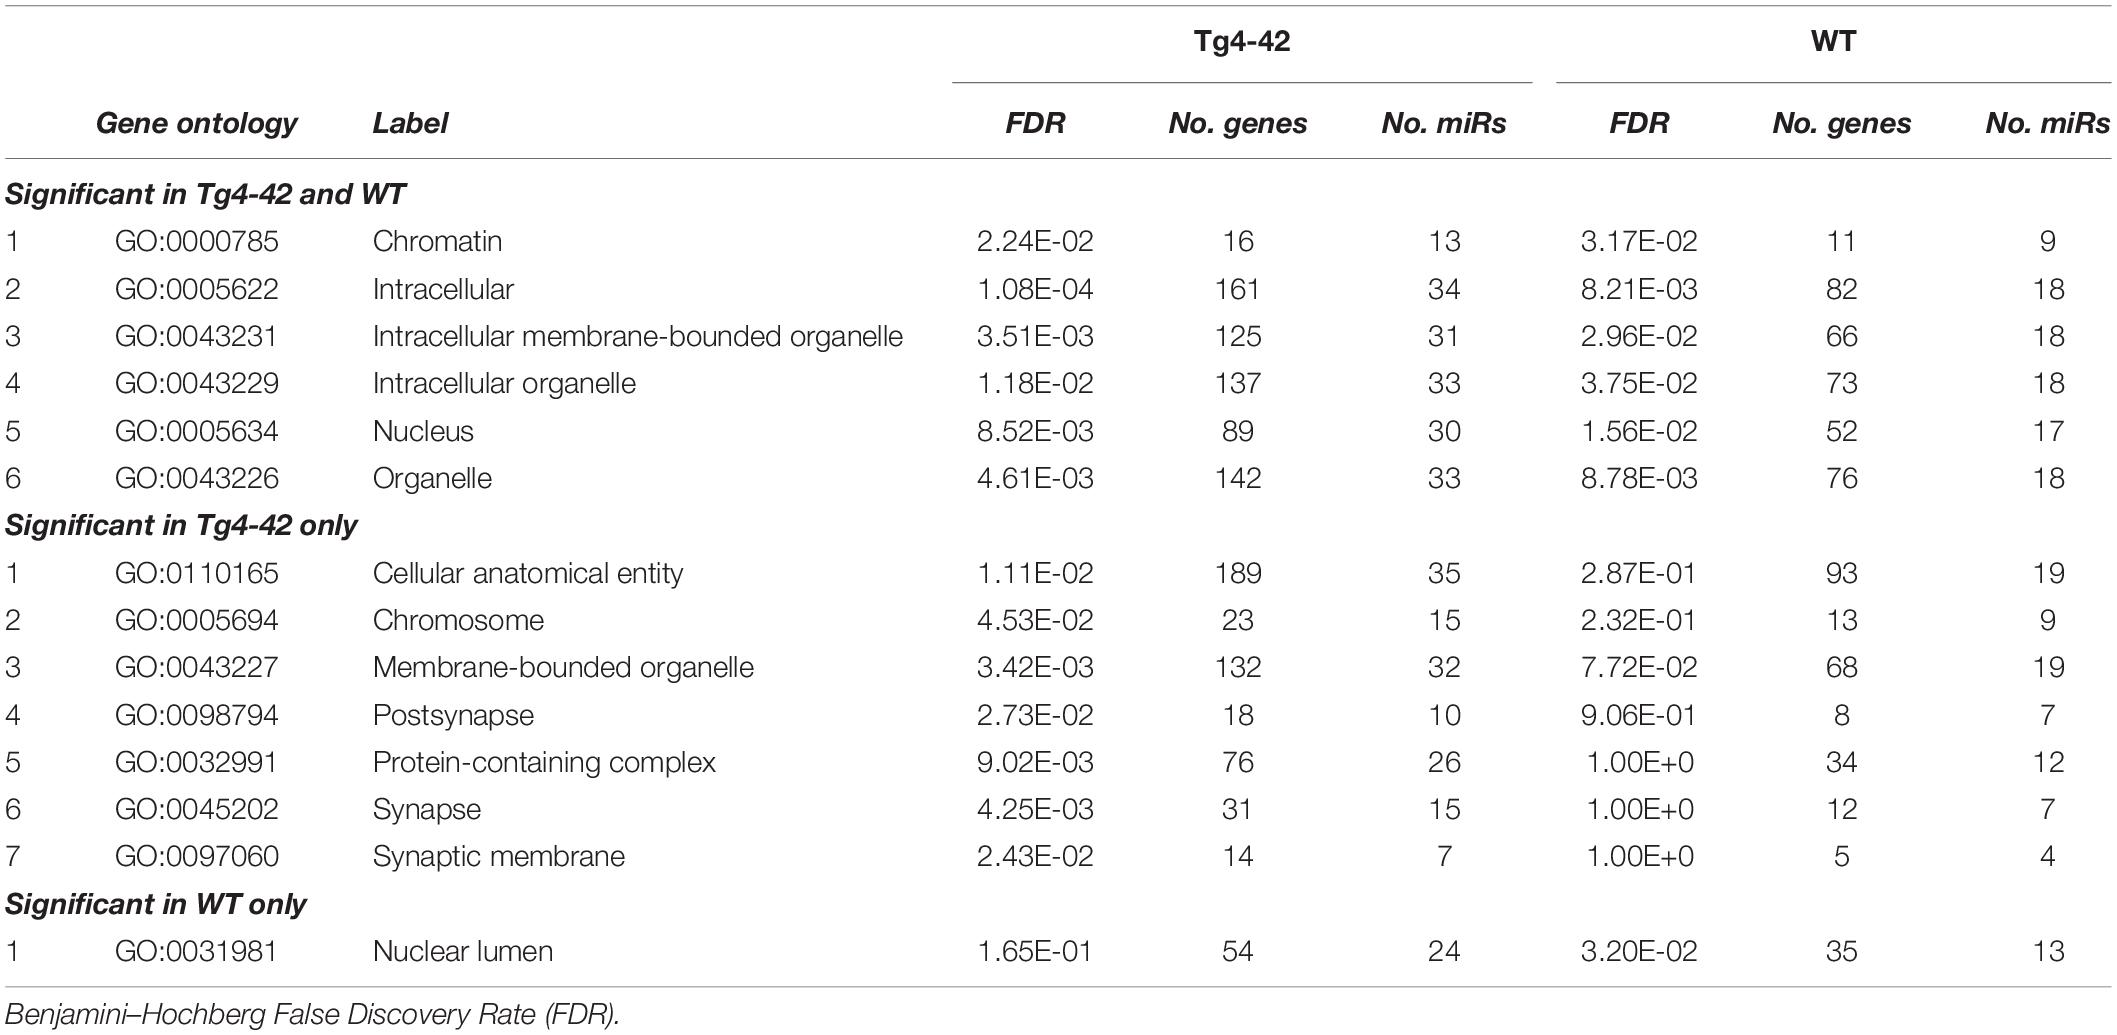
Table 4. GO annotation and pathway enrichment analysis of predicted miR targets on Cellular Components.
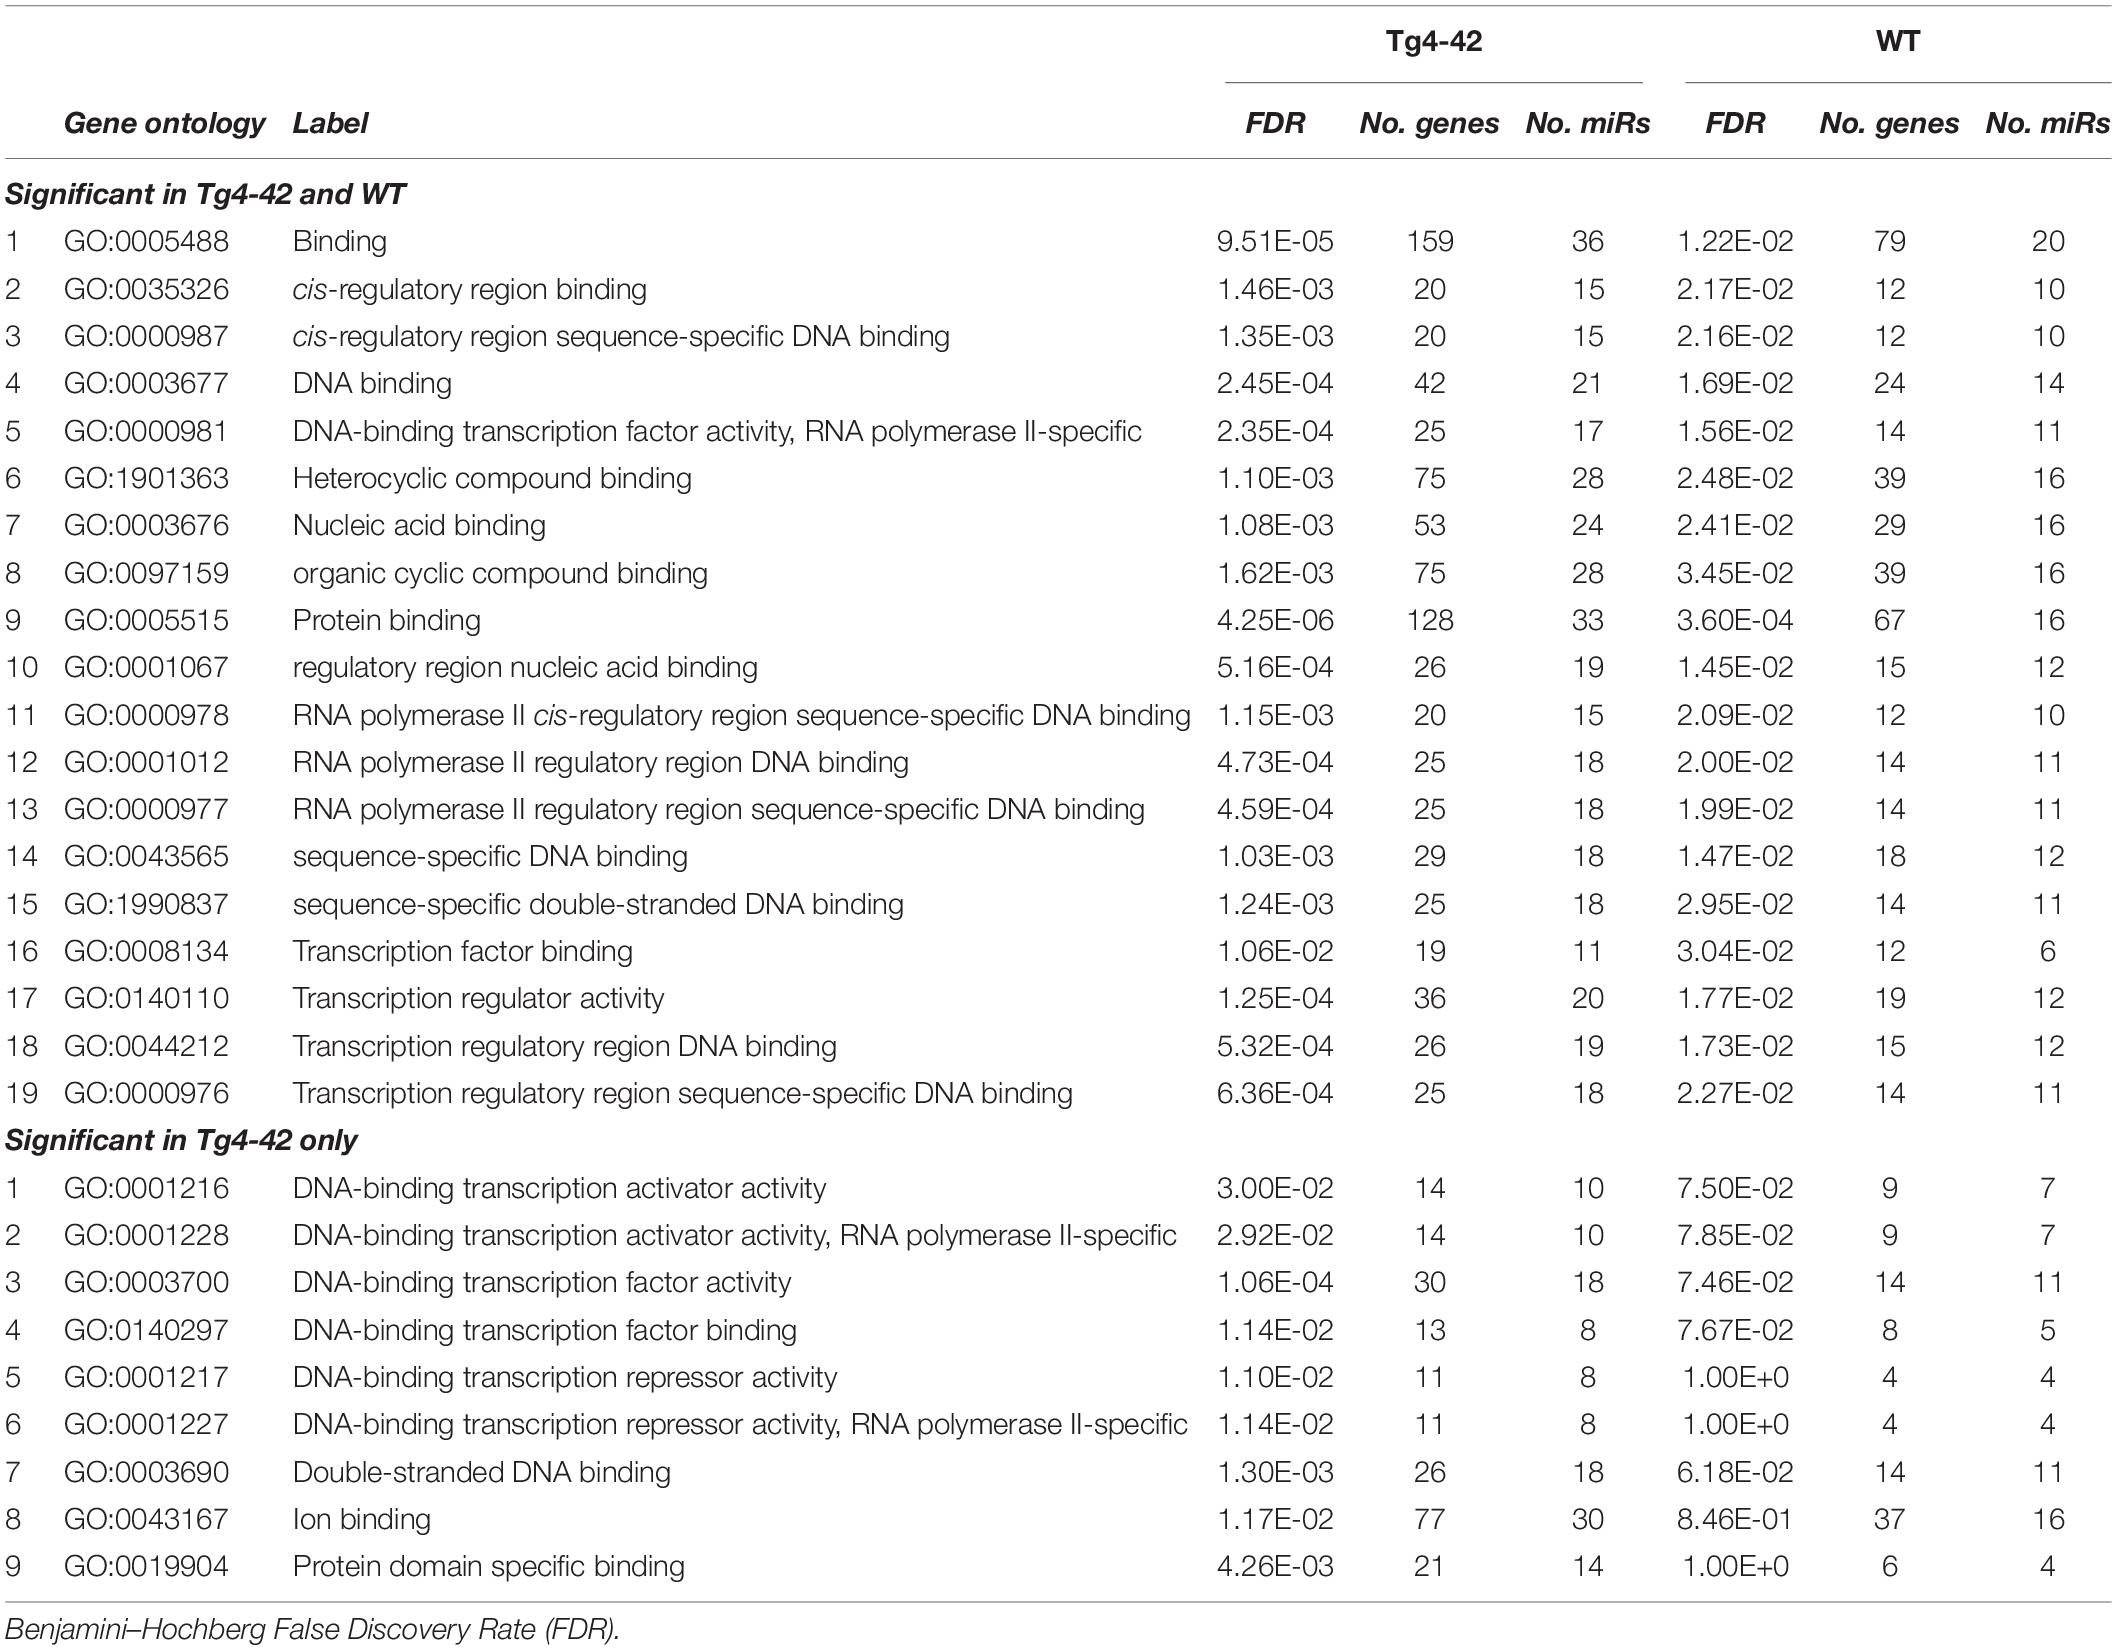
Table 5. GO annotation and pathway enrichment analysis of predicted miR targets on Molecular Function.
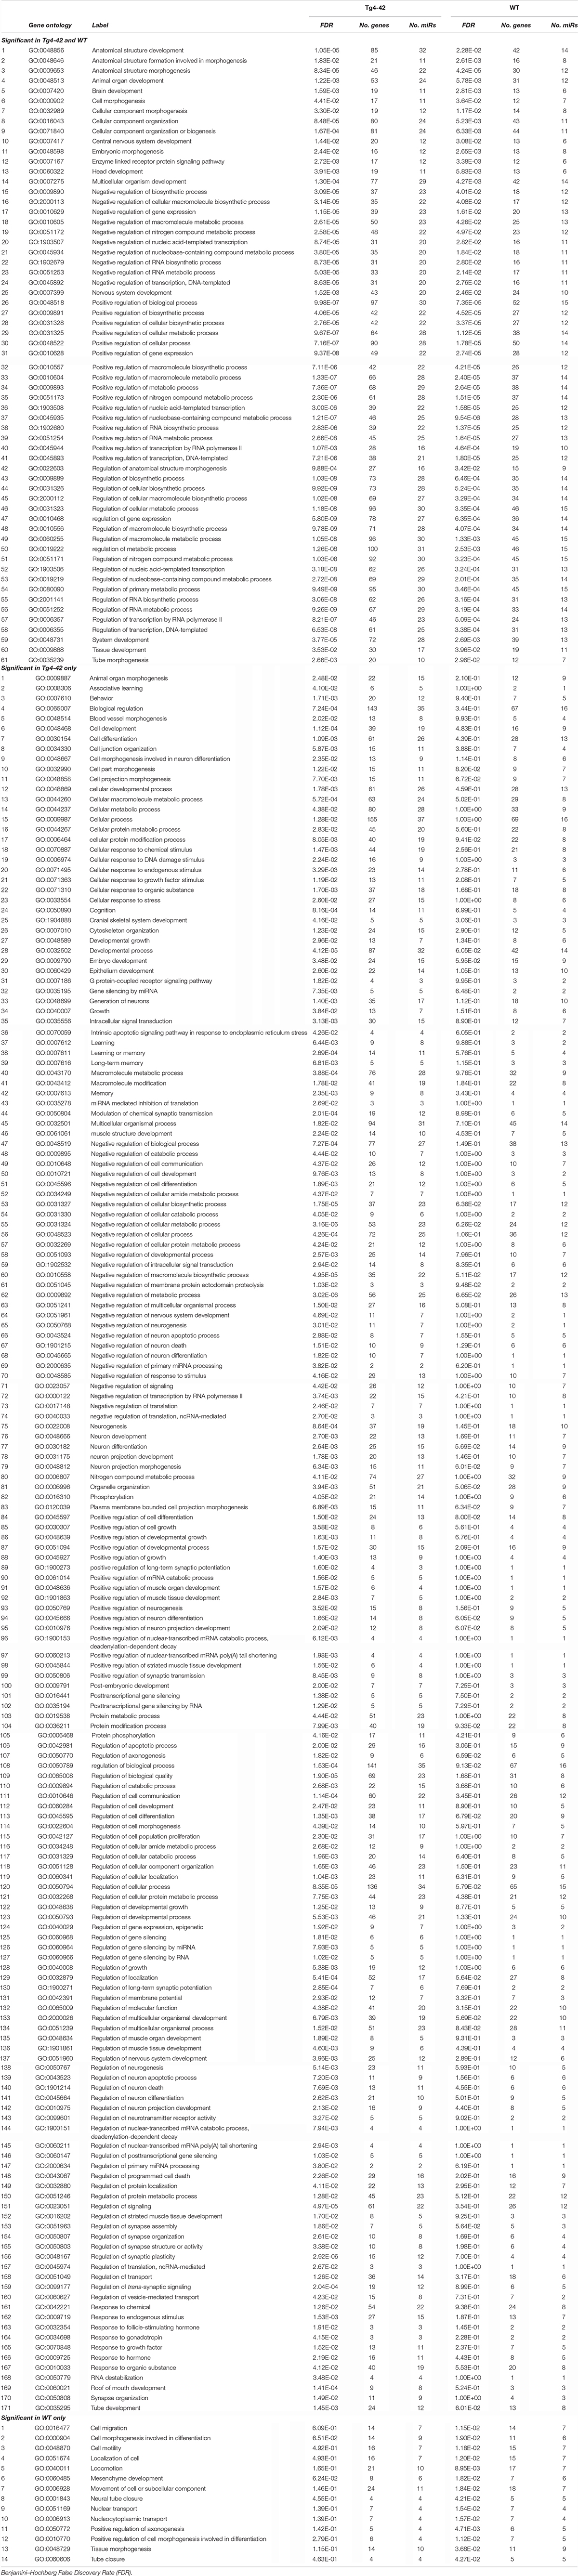
Table 6. GO annotation and pathway enrichment analysis of predicted miR targets on Biological Process.
Discussion
We performed NGS of the miRNome of the hippocampus of Tg4-42 mice, a model for sporadic AD. We assessed the pool of miRs before and after onset of AD-typical changes like gliosis, reduced glucose uptake into the brain, neuron loss and loss of reference memory (Bouter et al., 2013, 2019; Dietrich et al., 2018; Gerberding et al., 2019). The Tg4-42 mouse model is one of few mouse models developing neuron death in the CA1 region of the hippocampus (Bayer and Wirths, 2014), as such it might provide a powerful tool for preclinical drug testing and identification of the underlying molecular pathways driving AD pathology. The difference of diverse miR levels between 3 and 8 months of age in Tg4-42 elicits the AD-typical effects after onset of neuron loss and behavioral deficits. We cannot draw any conclusion on the difference in miR levels in aged mice, as the normal lifespan is at least 24 months.
At least 1% of the human genome encodes miR and every miR can regulate up to 200 mRNAs suggesting that dysregulation of miR expression could be associated with several human pathological conditions including central neurological disorders (Angelucci et al., 2019). In addition to NGS of the miRs, we have performed a search for the targets of identified miRs using state-of-the-art bioinformatics and addressed the question whether the affected processes are meaningful in the context of known AD-typical changes in the Tg4-42 mouse model.
MiRs Identified in the Hippocampus of 8 Month Old Tg4-42 Mice
A total of 33 miRs were altered in the hippocampus between 3 and 8 month-old exclusively found in Tg4-42 mice. All but one was significantly decreased at the age of 8 months. Some of the miRs identified were already linked to AD pathology, while others could be associated to AD for the first time. In gray matter of the brain of patients with AD, down-regulation of a set of miRs (including several miR-15/107 genes and miR-29 paralogs) correlated strongly with the density of amyloid plaques. MiR-212 was found decreased in white matter, whereas miR-424 was upregulated in AD (Wang A. et al., 2011). Expression of miR-107 and BACE1 mRNA correlated with alterations in brain pathology in individuals with mild cognitive impairment (Wang et al., 2016). MiR-107 reversed the impairments of spatial memory and long-term potentiation caused by intraventricular injection of Aβ1–42 (Shu et al., 2018). MiR-125a may have a role in regulating the translation of PSD-95 mRNA. Impairments in the local synthesis of PSD-95, important for synaptic structure and function, may affect dendritic spine development and synaptic plasticity in fragile X syndrome (Ifrim et al., 2015). MiR-125b-1 induced tau hyperphosphorylation and cognitive deficits in AD (Banzhaf-Strathmann et al., 2014), may be involved in the regulation of inflammatory factors and oxidative stress by SphK1 (Jin et al., 2018). It has been found to be associated with other neurodegenerative diseases as well (Lardenoije et al., 2015; Salta and De Strooper, 2017b). TGF-β induced miR-100 and miR-125b (Ottaviani et al., 2019). MiR-100 and miR-125b coordinately suppress Wnt/b-catenin negative regulators, thereby increasing Wnt signaling (Lu et al., 2017). A pathogenic-positive feedback loop has been identified in which Aβ induced Dickkopf-1 expression activating non-canonical Wnt signaling, promoting synapse loss and enhancing Aβ production (Elliott et al., 2018). MiR-129-2 was reported to be down-regulated in spinal cord (Strickland et al., 2011). MiR-132 is involved in synaptic plasticity (Bicker et al., 2014) and may be associated with TDP-43 binding in amyotrophic lateral sclerosis (Freischmidt et al., 2013). Prion-infected hippocampal neurons elicited altered expression of miR-132 (Majer et al., 2012) and have been discussed to play an important role in inflammation control (Essandoh et al., 2016). MiR profiling in the human brain has revealed miR-132 as one of the most severely down-regulated miRs at the intermediate and late Braak stages of AD, as well as in other neurodegenerative disorders (Salta and De Strooper, 2017a). MiR-132 has been implicated in synaptic plasticity together with miR-134 and miR-138 (Bicker et al., 2014). Duplication of the miR-138-2 locus was observed exclusively in early onset AD cases and miR-138 overexpression in vitro induced Aβ production and tau phosphorylation (Boscher et al., 2019). Interestingly, levels of miR-132 and miR-138-2 were significantly decreased in aged Tg4-42 mice indicating that dendritic mRNA transport and local translation in the postsynaptic compartment play an important role in synaptic plasticity, learning and memory (Bicker et al., 2014) in this model system for AD. In vitro Aβ treatment increased the expression of miR-139 targets (Noh et al., 2014), and has been found to be associated with other neurodegenerative diseases (Lardenoije et al., 2015; Salta and De Strooper, 2017b). MiR-181c correlated with genome-wide DNA methylation changes of ncRNAs in patients with AD (Villela et al., 2016), and is involved in epigenetics of aging and neurodegeneration (Lardenoije et al., 2015). Overexpression of miR-185 inhibits autophagy and apoptosis of dopaminergic neurons by regulating the AMPK/mTOR signaling pathway in Parkinson’s disease (Bicker et al., 2014). The 22q11.2 deletion is a known genetic risk factor for schizophrenia and mouse models of 22q11.2DS have demonstrated down-regulation of miR-185 in key brain areas of affected individuals. This reduction was associated with dendritic and spine development deficits in hippocampal neurons (Freischmidt et al., 2013). Association studies in the 3′UTR of BACE1 and the miR-29 gene cluster did not identify an association with AD. A weak statistical interaction was observed between rs535860 (BACE1 3′UTR) and rs34772568 (near miR-29a). The authors concluded a major contribution of this miR (Bettens et al., 2009). MiR-30a has been found to be associated with Parkinson disease (Margis et al., 2011) as well as Huntington disease (Lardenoije et al., 2015; Salta and De Strooper, 2017b). MiR-338-3p depletion has been shown to be important for auditory thalamo-cortical signaling in 22q11DS mice, and may trigger the pathogenic mechanism of 22q11DS-related psychosis (Chun et al., 2017). MiR-345-5p may act as blood biomarker in multiple sclerosis (Freiesleben et al., 2016), and miR-345-3p attenuated apoptosis and inflammation caused by oxidized low-density lipoprotein by targeting TRAF6 via TAK1/p38/NF-kB signaling (Wei et al., 2020). An in vitro study indicated that miR-34a may inhibit Aβ clearance by targeting endophilin-3 including uptake and autophagy-mediated degradation (Sun et al., 2018). The rs1050283 SNP likely acts as a risk factor for sporadic AD. It is associated with a decreased expression of oxidized LDL receptor 1 mRNA in the absence of miR-369-3p de-regulation and may affect the binding of miR-369-3p to its 3′UTR consensus sequence (Bettens et al., 2009). MiR-381 showed a protective effect against inflammatory damage (Li et al., 2020). MiR-409 was reported in IL-17-induced inflammatory cytokine production in astrocytes by targeting the SOCS3/STAT3 signaling pathway in EAE mice (Liu et al., 2019). MiR-541 acts on neurite outgrowth and differentiation via nerve growth factor and synapsin I in neuronal precursor cells (Chun et al., 2017). MiR-674 demonstrated an association with Parkinson disease and Huntington (Lardenoije et al., 2015; Salta and De Strooper, 2017b). CSF from individuals with AD contained increased amounts of miR-let7b, and intrathecal injection of miR-let7b in wild-type mice induced neurodegeneration (Lehmann et al., 2012). Elevated levels of miR-let7b and miR-let7e were found in CSF of patients with AD and major depressive symptoms, but not in patients with fronto-temporal disorder (Derkow et al., 2018). MiR-let7d is a key regulator of bi-directionally transcribed genes mediating epigenetic silencing and nucleolar organization (Singh et al., 2018). For miRs miR-129-1, miR-154, miR-15b, miR-219-2, miR-298, miR-323, miR-411, miR-500, miR-7-2, miR-92b, miR-let7i this study is the first to describe deregulation in an AD mouse model. Interestingly, GO-Annotation analysis (“Cellular Components”) revealed that only miRs, which were exclusively deregulated in the Tg4-42 model showed an enrichment of targets in connection with the synapse. Such and similar annotations were completely absent among the targets of miRs that were deregulated in both aged mutant and WT mice. With respect to the “Molecular Function” and “Biological Process” annotation, this difference is even more pronounced.
As the Tg4-42 model shows reduced neurogenesis, synaptic hyperexcitability and develops neuron loss as well as behavioral deficits without plaque formation, the newly found deregulated miRs in this model could be involved in plaque-independent pathological pathways. Taken together these observations strongly support our conclusion that the identified miRs play a role in the etiology of AD and thus deserve further investigation as putative biomarkers or therapeutics.
MiRs Identified in the Hippocampus of 8 Month Old Wildtype Mice
Eight miRs were exclusively altered in the hippocampus between 3 and 8 month-old in WT mice. TGF-β induced an lncRNA with its encoded miRs, miR-100 and miR-125b (Ottaviani et al., 2019). MiR-100 and miR-125b coordinately suppressed Wnt/β-catenin negative regulators thereby increased Wnt signaling (Lu et al., 2017). MiR-153 was over-expressed in CSF exosomes from patients with Parkinson disease (Serpente et al., 2011). There is evidence that miR-191 and miR-222 are co-regulated and are important for neurodevelopment (Li et al., 2020). MiR-1298, miR-34b, miR-423, miR-666 and miR-667 have not been previously reported to be association to AD, neurodegenerative disorders or brain function.
MiRs Identified in the Hippocampus of 8 Month Old Tg4-42 and Wildtype Mice
25 miRs were differentially expressed between 3 and 8 month-old Tg4-42 as well as WT mice. All but three of them were significantly decreased at 8 months of age. MiR-127 has been reported to modulate macrophage polarization and therefore may have a crucial role in inflammation (Essandoh et al., 2016). MiR-128-1 up-regulation correlated with Aβ degradation in monocytes from patients with sporadic AD (Tiribuzi et al., 2014). MiR-130a was involved in inflammatory processes by targeting the transforming growth factor-beta1 and interleukin 18 genes (Zhao et al., 2014). MiR-132 expression levels were found to be associated with hippocampal sclerosis in a subgroup of AD patients (Tasaki et al., 2018). MiR-138-1 was transcriptionally up-regulated during myelination and downregulated upon nerve injury (Lin et al., 2018). miR-150-5p may act as a circulating biomarker for patients with the autoimmune neuromuscular disorder myasthenia gravis (Punga et al., 2015). A genetic variant located near the miR-204 gene was significantly associated with schizophrenia resulting in reduced expression of miR-204 in neuronal-like SH-SY5Y cells (Cammaerts et al., 2015). MiR-212 was down-regulated in white matter of patients with AD (Wang W.X. et al., 2011). MiR-222 was down-regulated in the AD mouse model APPswe/PSΔE9 (Wang et al., 2015). Lipopolysaccharide stimulation in mice led to increased expression of miR-221 and miR-222, thereby causing transcriptional silencing of a subset of inflammatory genes, which depend on chromatin remodeling. In patients with sepsis, increased expression of miR-221 and miR-222 correlated with immunoparalysis and increased organ damage (Seeley et al., 2018). Preliminary results indicated that aberrant levels of circulating miR-23a are recovered in fingolimod-treated multiple sclerosis patients representing a potential biomarker (Fenoglio et al., 2016). MiR-300 was involved in the inflammatory response in endothelial cells and enhanced autophagy by activation of the AMPK/mTOR signaling pathway (Li et al., 2018). MiR-323 suppressed neuron death via the transforming growth factor-β1/SMAD3 signaling pathway (Che et al., 2019). The expression of miR-30a was associated as a prediction serum marker in epilepsy (Lin et al., 2018). MiR-34c has been shown to have a physiological role in regulating the central stress response (Cammaerts et al., 2015). MiR-329 was upregulated in a mouse model for Rett syndrome, which is a complex neurological disorder that has been associated with mutations in the gene coding for Mecp2 (Urdinguio et al., 2010). MiR-382 inhibited cell proliferation and invasion of retinoblastoma by targeting BDNF-mediated PI3K/AKT signaling pathway (Song et al., 2017). MiR-877-3P regulated vascular endothelial cell autophagy and apoptosis under the high-glucose condition (Zhao et al., 2020). MiR-99a was found overexpressed in the brain of patients with Down syndrome (Bras et al., 2018). MiR-99b may have a role in spinal cord injury via the regulation of mTOR (Cao et al., 2017). Again, several miRs, namely, miR-128-2, miR-140, miR-23b, miR-30d, miR-3102, miR-328 and miR-434 could be linked to an AD mouse model for the first time in this study.
Annotation Analysis of miR Targets
The analyses of the GO annotation of predicted miR targets in Tg4-42 and WT mice revealed diverse cellular component, molecular functions and biological processes similar to our previous study of the mRNome of the whole brain of Tg4-42 and 5XFAD mice (Bouter et al., 2014). The GO annotations in Tg4-42 hippocampus demonstrated that the most enriched pathways belong to synaptic signaling and transmission involved in memory processes, which was not found in WT mice. Hence, these pathways appear specific for the AD-typical mental decline and neurodegenerative events.
Conclusion
We were able to validate the Tg4-42 as a valuable model for sporadic AD. We could confirm previously reported AD-associations of several miRs. Importantly, the untargeted small RNASeq approach also allowed us to link several additional miRs to a mouse model for AD. The identified miRs have a role in the age-dependent deficits in learning and memory as well as neuron loss in the hippocampus in Tg4-42 mice. The annotation of miR target genes supported these strong reductions in synaptic processes involved in learning and memory.
Data Availability Statement
The datasets for this study have been uploaded to the European Nucleotide Archive (https://www.ebi.ac.uk/ena) with the accession identification number of the project PRJEB39314.
Ethics Statement
The animal study was reviewed and approved by the Niedersächsisches Landesamt für Verbraucherschutz und Lebensmittelsicherheit, Röverskamp 5, 26203 Oldenburg, Germany and Landesamt für Gesundheit und Soziales LAGe So Darwinstr. 15, 10589 Berlin, Germany.
Author Contributions
YB contributed to the experimental design and analyzed the data. TK and FR analyzed the data. AK and LJ contributed to the experimental design and were responsible for NGS-data generation and primary data analysis. TB wrote the manuscript, analyzed the data, and supervised the experimental design and the entire project. All authors read, reviewed, and approved the final manuscript.
Conflict of Interest
The University Medicine Göttingen holds a patent on the Tg4-42 mouse model for Alzheimer’s disease.
Acknowledgments
We thank Robert Weissman and Stefan Weiss for bioinformatics support in primary data analysis and Corina Jensen and Christian Sperling for excellent technical assistance.
Supplementary Material
The Supplementary Material for this article can be found online at: https://www.frontiersin.org/articles/10.3389/fnins.2020.580524/full#supplementary-material
FIGURE S1 | Heatmap of most variable genes for quality control. Individual sample after collapsing replicates with DESeq2. S1–20 represent individual sample labels.
TABLE S1 | Analysis of hippocampal miR between young and aged Tg4-42 and wildtype mice. Plus log 2-fold change means higher levels at 8 months of age. Minus log 2-fold change means lower levels at 8 months of age. P-values are only shown if significant (<0.05). Abbreviations: 3M, 3 month old; 8M, 8 month old.
Footnotes
References
Agarwal, V., Bell, G. W., Nam, J. W., and Bartel, D. P. (2015). Predicting effective microRNA target sites in mammalian mRNAs. eLife 4:5. doi: 10.7554/eLife.05005
Anders, S., Pyl, P. T., and Huber, W. (2015). HTSeq–a Python framework to work with high-throughput sequencing data. Bioinformatics 31, 166–169. doi: 10.1093/bioinformatics/btu638
Angelucci, F., Cechova, K., Valis, M., Kuca, K., Zhang, B., and Hort, J. (2019). MicroRNAs in Alzheimer’s disease: diagnostic markers or therapeutic agents? Front. Pharmacol. 10:665. doi: 10.3389/fphar.2019.00665
Banzhaf-Strathmann, J., Benito, E., May, S., Arzberger, T., Tahirovic, S., Kretzschmar, H., et al. (2014). MicroRNA-125b induces tau hyperphosphorylation and cognitive deficits in Alzheimer’s disease. EMBO J. 33, 1667–1680. doi: 10.15252/embj.201387576
Bayer, T., and Wirths, O. (2014). Focusing the amyloid cascade hypothesis on N-truncated Abeta peptides as drug targets against Alzheimer’s disease. Acta Neuropathol. 127, 787–801. doi: 10.1007/s00401-014-1287-x
Bettens, K., Brouwers, N., Engelborghs, S., Van Miegroet, H., De Deyn, P. P., Theuns, J., et al. (2009). APP and BACE1 miR genetic variability has no major role in risk for Alzheimer disease. Hum. Mutat. 30, 1207–1213. doi: 10.1002/humu.21027
Bicker, S., Lackinger, M., Weiss, K., and Schratt, G. (2014). MicroRNA-132, -134, and -138: a microRNA troika rules in neuronal dendrites. Cell Mol. Life. Sci. 71, 3987–4005. doi: 10.1007/s00018-014-1671-7
Boscher, E., Husson, T., Quenez, O., Laquerriere, A., Marguet, F., Cassinari, K., et al. (2019). Copy number variants in miR-138 as a potential risk factor for early-onset Alzheimer’s disease. J. Alzheimers Dis. 68, 1243–1255. doi: 10.3233/jad-180940
Bouter, C., Henniges, P., Franke, T. N., Irwin, C., Sahlmann, C. O., Sichler, M. E., et al. (2019). 18F-FDG-PET detects drastic changes in brain metabolism in the Tg4-42 model of Alzheimer’s disease. Front. Aging Neurosci. 10:425. doi: 10.3389/fnagi.2018.00425
Bouter, Y., Dietrich, K., Wittnam, J. L., Rezaei-Ghaleh, N., Pillot, T., Papot-Couturier, S., et al. (2013). N-truncated amyloid beta (Abeta) 4-42 forms stable aggregates and induces acute and long-lasting behavioral deficits. Acta Neuropathol. 126, 189–205. doi: 10.1007/s00401-013-1129-2
Bouter, Y., Kacprowski, T., Weissmann, R., Dietrich, K., Borgers, H., Brauß, A., et al. (2014). Deciphering the molecular profile of plaques, memory decline and neuron-loss in two mouse models for Alzheimer’s disease by deep sequencing. Front. Aging Neurosci. 6:75. doi: 10.3389/fnagi.2014.00075
Bras, A., Rodrigues, A. S., Gomes, B., and Rueff, J. (2018). Down syndrome and microRNAs. Biomed. Rep. 8, 11–16.
Cammaerts, S., Strazisar, M., Smets, B., Weckhuysen, S., Nordin, A., De Jonghe, P., et al. (2015). Schizophrenia-associated MIR204 Regulates Noncoding RNAs and affects neurotransmitter and ion channel gene sets. PLoS One 10:e0144428. doi: 10.1371/journal.pone.0144428
Cao, F., Liu, T., Sun, S., and Feng, S. (2017). The role of the miR-99b-5p/mTOR signaling pathway in neuroregeneration in mice following spinal cord injury. Mol. Med. Rep. 16, 9355–9360. doi: 10.3892/mmr.2017.7816
Che, F., Du, H., Wei, J., Zhang, W., Cheng, Z., and Tong, Y. (2019). MicroRNA-323 suppresses nerve cell toxicity in cerebral infarction via the transforming growth factor-beta1/SMAD3 signaling pathway. Int. J. Mol. Med. 43, 993–1002.
Chen, Y., and Wang, X. (2020). miRDB: an online database for prediction of functional microRNA targets. Nucleic Acids Res. 48, D127–D131.
Chou, C. H., Shrestha, S., Yang, C. D., Chang, N. W., Lin, Y. L., Liao, K. W., et al. (2018). miRTarBase update 2018: a resource for experimentally validated microRNA-target interactions. Nucleic Acids Res. 46, D296–D302.
Chun, S., Du, F., Westmoreland, J. J., Han, S. B., Wang, Y. D., Eddins, D., et al. (2017). Thalamic miR-338-3p mediates auditory thalamocortical disruption and its late onset in models of 22q11.2 microdeletion. Nat. Med. 23, 39–48. doi: 10.1038/nm.4240
Derkow, K., Rossling, R., Schipke, C., Kruger, C., Bauer, J., Fahling, M., et al. (2018). Distinct expression of the neurotoxic microRNA family let-7 in the cerebrospinal fluid of patients with Alzheimer’s disease. PLoS One 13:e0200602. doi: 10.1371/journal.pone.0200602
Dietrich, K., Bouter, Y., Muller, M., and Bayer, T. A. (2018). Synaptic alterations in mouse models for Alzheimer disease-a special focus on N-truncated Abeta 4-42. Molecules 23:718. doi: 10.3390/molecules23040718
Ding, J., Li, X., and Hu, H. (2016). TarPmiR: a new approach for microRNA target site prediction. Bioinformatics 32, 2768–2775. doi: 10.1093/bioinformatics/btw318
Dobin, A., Davis, C. A., Schlesinger, F., Drenkow, J., Zaleski, C., Jha, S., et al. (2013). STAR: ultrafast universal RNA-seq aligner. Bioinformatics 29, 15–21. doi: 10.1093/bioinformatics/bts635
Elliott, C., Rojo, A. I., Ribe, E., Broadstock, M., Xia, W., Morin, P., et al. (2018). A role for APP in Wnt signalling links synapse loss with beta-amyloid production. Transl. Psychiatry 8:179. doi: 10.1038/s41398-018-0231-6
Essandoh, K., Li, Y., Huo, J., and Fan, G. C. (2016). MiR-mediated macrophage polarization and its potential role in the regulation of inflammatory response. Shock 46, 122–131. doi: 10.1097/shk.0000000000000604
Fenoglio, C., De Riz, M., Pietroboni, A. M., Calvi, A., Serpente, M., Cioffi, S. M., et al. (2016). Effect of fingolimod treatment on circulating miR-15b, miR23a and miR-223 levels in patients with multiple sclerosis. J. Neuroimmunol. 299, 81–83. doi: 10.1016/j.jneuroim.2016.08.017
Forstner, A. J., Degenhardt, F., Schratt, G., and Nothen, M. M. (2013). MicroRNAs as the cause of schizophrenia in 22q11.2 deletion carriers, and possible implications for idiopathic disease: a mini-review. Front. Mol. Neurosci. 6:47. doi: 10.3389/fnmol.2013.00047
Freiesleben, S., Hecker, M., Zettl, U. K., Fuellen, G., and Taher, L. (2016). Analysis of microRNA and gene expression profiles in multiple sclerosis: integrating interaction data to uncover regulatory mechanisms. Sci. Rep. 6:34512. doi: 10.1038/srep34512
Freischmidt, A., Muller, K., Ludolph, A. C., and Weishaupt, J. H. (2013). Systemic dysregulation of TDP-43 binding microRNAs in amyotrophic lateral sclerosis. Acta Neuropathol. Commun. 1:42. doi: 10.1186/2051-5960-1-42
Gerberding, A. L., Zampar, S., Stazi, M., Liebetanz, D., and Wirths, O. (2019). Physical activity ameliorates impaired hippocampal neurogenesis in the Tg4-42 mouse model of Alzheimer’s disease. ASN Neurol. 11:692. doi: 10.1177/1759091419892692
Gui, Y., Liu, H., Zhang, L., Lv, W., and Hu, X. (2015). Altered microRNA profiles in cerebrospinal fluid exosome in Parkinson disease and Alzheimer disease. Oncotarget 6, 37043–37053. doi: 10.18632/oncotarget.6158
Haramati, S., Navon, I., Issler, O., Ezra-Nevo, G., Gil, S., Zwang, R., et al. (2011). MicroRNA as repressors of stress-induced anxiety: the case of amygdalar miR-34. J. Neurosci. 31, 14191–14203. doi: 10.1523/jneurosci.1673-11.2011
Ifrim, M. F., Williams, K. R., and Bassell, G. J. (2015). Single-molecule imaging of PSD-95 mRNA translation in dendrites and its dysregulation in a mouse model of fragile X syndrome. J. Neurosci. 35, 7116–7130. doi: 10.1523/jneurosci.2802-14.2015
Jawhar, S., Trawicka, A., Jenneckens, C., Bayer, T. A., and Wirths, O. (2012). Motor deficits, neuron loss, and reduced anxiety coinciding with axonal degeneration and intraneuronal Abeta aggregation in the 5XFAD mouse model of Alzheimer’s disease. Neurobiol. Aging 33, 196.e29–196.e40.
Jin, Y., Tu, Q., and Liu, M. (2018). MicroRNA125b regulates Alzheimer’s disease through SphK1 regulation. Mol. Med. Rep. 18, 2373–2380.
Kim, K. H., Moon, M., Yu, S. B., Mook-Jung, I., and Kim, J. I. (2012). RNA-Seq analysis of frontal cortex and cerebellum from 5XFAD mice at early stage of disease pathology. J. Alzheimers Dis. 29, 793–808. doi: 10.3233/jad-2012-111793
Lardenoije, R., Iatrou, A., Kenis, G., Kompotis, K., Steinbusch, H. W., Mastroeni, D., et al. (2015). The epigenetics of aging and neurodegeneration. Prog. Neurobiol. 131, 21–64.
Lehmann, S. M., Kruger, C., Park, B., Derkow, K., Rosenberger, K., Baumgart, J., et al. (2012). An unconventional role for miR: let-7 activates Toll-like receptor 7 and causes neurodegeneration. Nat. Neurosci. 15, 827–835. doi: 10.1038/nn.3113
Li, Y., Huang, J., Yan, H., Li, X., Ding, C., Wang, Q., et al. (2020). Protective effect of microRNA381 against inflammatory damage of endothelial cells during coronary heart disease by targeting CXCR4. Mol. Med. Rep. 21, 1439–1448.
Li, Y., Ke, J., Peng, C., Wu, F., and Song, Y. (2018). microRNA-300/NAMPT regulates inflammatory responses through activation of AMPK/mTOR signaling pathway in neonatal sepsis. Biomed. Pharmacother. 108, 271–279. doi: 10.1016/j.biopha.2018.08.064
Li, Y. Y., Cui, J. G., Hill, J. M., Bhattacharjee, S., Zhao, Y., and Lukiw, W. J. (2011). Increased expression of miR-146a in Alzheimer’s disease transgenic mouse models. Neurosci. Lett. 487, 94–98. doi: 10.1016/j.neulet.2010.09.079
Lin, H. P., Oksuz, I., Svaren, J., and Awatramani, R. (2018). Egr2-dependent microRNA-138 is dispensable for peripheral nerve myelination. Sci. Rep. 8:3817. doi: 10.1038/s41598-018-22010-8
Liu, X., Zhou, F., Yang, Y., Wang, W., Niu, L., Zuo, D., et al. (2019). MiR-409-3p and MiR-1896 co-operatively participate in IL-17-induced inflammatory cytokine production in astrocytes and pathogenesis of EAE mice via targeting SOCS3/STAT3 signaling. Glia 67, 101–112. doi: 10.1002/glia.23530
Love, M. I., Huber, W., and Anders, S. (2014). Moderated estimation of fold change and dispersion for RNA-seq data with DESeq2. Genome Biol. 15:550.
Lu, Y., Zhao, X., Liu, Q., Li, C., Graves-Deal, R., Cao, Z., et al. (2017). lncRNA MIR100HG-derived miR-100 and miR-125b mediate cetuximab resistance via Wnt/beta-catenin signaling. Nat. Med. 23, 1331–1341. doi: 10.1038/nm.4424
Majer, A., Medina, S. J., Niu, Y., Abrenica, B., Manguiat, K. J., Frost, K. L., et al. (2012). Early mechanisms of pathobiology are revealed by transcriptional temporal dynamics in hippocampal CA1 neurons of prion infected mice. PLoS Pathog. 8:e1003002. doi: 10.1371/journal.ppat.1003002
Margis, R., Margis, R., and Rieder, C. R. M. (2011). Identification of blood microRNAs associated to Parkinsońs disease. J. Biotechnol. 152, 96–101. doi: 10.1016/j.jbiotec.2011.01.023
Mi, H., Muruganujan, A., Ebert, D., Huang, X., and Thomas, P. D. (2019). PANTHER version 14: more genomes, a new PANTHER GO-slim and improvements in enrichment analysis tools. Nucleic Acids Res. 47, D419–D426.
Noh, H., Park, C., Park, S., Lee, Y. S., Cho, S. Y., and Seo, H. (2014). Prediction of miR-mRNA associations in Alzheimer’s disease mice using network topology. BMC Genom. 15:644. doi: 10.1186/1471-2164-15-644
Oakley, H., Cole, S. L., Logan, S., Maus, E., Shao, P., Craft, J., et al. (2006). Intraneuronal beta-amyloid aggregates, neurodegeneration, and neuron loss in transgenic mice with five familial Alzheimer’s disease mutations: potential factors in amyloid plaque formation. J. Neurosci. 26, 10129–10140. doi: 10.1523/jneurosci.1202-06.2006
Ottaviani, S., Stebbing, J., Frampton, A. E., Zagorac, S., Krell, J., De Giorgio, A., et al. (2019). Author correction: TGF-beta induces miR-100 and miR-125b but blocks let-7a through LIN28B controlling PDAC progression. Nat. Commun. 10:3738. doi: 10.1038/s41467-019-11752-2
Punga, A. R., Andersson, M., Alimohammadi, M., and Punga, T. (2015). Disease specific signature of circulating miR-150-5p and miR-21-5p in myasthenia gravis patients. J. Neurol. Sci. 356, 90–96. doi: 10.1016/j.jns.2015.06.019
Qian, Q., Zhang, J., He, F. P., Bao, W. X., Zheng, T. T., Zhou, D. M., et al. (2019). Down-regulated expression of microRNA-338-5p contributes to neuropathology in Alzheimer’s disease. FASEB J. 33, 4404–4417. doi: 10.1096/fj.201801846r
Rigden, D. J., and Fernandez, X. M. (2018). The 2018 Nucleic acids research database issue and the online molecular biology database collection. Nucleic Acids Res. 46, D1–D7.
Roshan, R., Ghosh, T., Scaria, V., and Pillai, B. (2009). MicroRNAs: novel therapeutic targets in neurodegenerative diseases. Drug Discov. Today 14, 1123–1129. doi: 10.1016/j.drudis.2009.09.009
Salta, E., and De Strooper, B. (2012). Non-coding RNAs with essential roles in neurodegenerative disorders. Lancet Neurol. 11, 189–200. doi: 10.1016/s1474-4422(11)70286-1
Salta, E., and De Strooper, B. (2017a). microRNA-132: a key noncoding RNA operating in the cellular phase of Alzheimer’s disease. FASEB J. 31, 424–433. doi: 10.1096/fj.201601308
Salta, E., and De Strooper, B. (2017b). Noncoding RNAs in neurodegeneration. Nat. Rev. Neurosci. 18, 627–640. doi: 10.1038/nrn.2017.90
Seeley, J. J., Baker, R. G., Mohamed, G., Bruns, T., Hayden, M. S., Deshmukh, S. D., et al. (2018). Induction of innate immune memory via microRNA targeting of chromatin remodelling factors. Nature 559, 114–119. doi: 10.1038/s41586-018-0253-5
Serpente, M., Fenoglio, C., Villa, C., Cortini, F., Cantoni, C., Ridolfi, E., et al. (2011). Role of OLR1 and its regulating hsa-miR369-3p in Alzheimer’s disease: genetics and expression analysis. J. Alzheimers Dis. 26, 787–793. doi: 10.3233/jad-2011-110074
Shu, B., Zhang, X., Du, G., Fu, Q., and Huang, L. (2018). MicroRNA-107 prevents amyloid-beta-induced neurotoxicity and memory impairment in mice. Int. J. Mol. Med. 41, 1665–1672.
Singh, I., Contreras, A., Cordero, J., Rubio, K., Dobersch, S., Gunther, S., et al. (2018). MiCEE is a ncRNA-protein complex that mediates epigenetic silencing and nucleolar organization. Nat. Genet. 50, 990–1001. doi: 10.1038/s41588-018-0139-3
Smith, B., Treadwell, J., Zhang, D., Ly, D., Mckinnell, I., Walker, P. R., et al. (2010). Large-scale expression analysis reveals distinct microRNA profiles at different stages of human neurodevelopment. PLoS One 5:e11109. doi: 10.1371/journal.pone.0011109
Song, D., Diao, J., Yang, Y., and Chen, Y. (2017). MicroRNA382 inhibits cell proliferation and invasion of retinoblastoma by targeting BDNFmediated PI3K/AKT signalling pathway. Mol. Med. Rep. 16, 6428–6436. doi: 10.3892/mmr.2017.7396
Sticht, C., De La Torre, C., Parveen, A., and Gretz, N. (2018). miRWalk: An online resource for prediction of microRNA binding sites. PLoS One 13:e0206239. doi: 10.1371/journal.pone.0206239
Strickland, E. R., Hook, M. A., Balaraman, S., Huie, J. R., Grau, J. W., and Miranda, R. C. (2011). MicroRNA dysregulation following spinal cord contusion: implications for neural plasticity and repair. Neuroscience 186, 146–160. doi: 10.1016/j.neuroscience.2011.03.063
Sun, B., Fan, P., Liao, M., and Zhang, Y. (2018). Modeling endophilin-mediated Abeta disposal in glioma cells. Biochim. Biophys. Acta Mol. Cell Res. 1865, 1385–1396. doi: 10.1016/j.bbamcr.2018.06.015
Sun, J., Cheng, W., Liu, L., Tao, S., Xia, Z., Qi, L., et al. (2016). Identification of serum miRs differentially expressed in human epilepsy at seizure onset and post-seizure. Mol. Med. Rep. 14, 5318–5324. doi: 10.3892/mmr.2016.5906
Tasaki, S., Gaiteri, C., Mostafavi, S., De Jager, P. L., and Bennett, D. A. (2018). The molecular and neuropathological consequences of genetic risk for Alzheimer’s dementia. Front. Neurosci. 12:699. doi: 10.3389/fnins.2018.00699
Tiribuzi, R., Crispoltoni, L., Porcellati, S., Di Lullo, M., Florenzano, F., Pirro, M., et al. (2014). miR128 up-regulation correlates with impaired amyloid beta(1-42) degradation in monocytes from patients with sporadic Alzheimer’s disease. Neurobiol. Aging 35, 345–356. doi: 10.1016/j.neurobiolaging.2013.08.003
Twine, N. A., Janitz, K., Wilkins, M. R., and Janitz, M. (2011). Whole transcriptome sequencing reveals gene expression and splicing differences in brain regions affected by Alzheimer’s disease. PLoS One 6:e16266. doi: 10.1371/journal.pone.016266
Urdinguio, R. G., Fernandez, A. F., Lopez-Nieva, P., Rossi, S., Huertas, D., Kulis, M., et al. (2010). Disrupted microRNA expression caused by Mecp2 loss in a mouse model of Rett syndrome. Epigenetics 5, 656–663. doi: 10.4161/epi.5.7.13055
Villela, D., Ramalho, R. F., Silva, A. R., Brentani, H., Suemoto, C. K., Pasqualucci, C. A., et al. (2016). Differential DNA methylation of MicroRNA genes in temporal cortex from Alzheimer’s disease individuals. Neural Plast. 2016:2584940. doi: 10.1155/2016/2584940
Wang, A., Das, P., Switzer, R. C. III, Golde, T. E., and Jankowsky, J. L. (2011). Robust amyloid clearance in a mouse model of Alzheimer’s disease provides novel insights into the mechanism of amyloid-beta immunotherapy. J. Neurosci. 31, 4124–4136. doi: 10.1523/jneurosci.5077-10.2011
Wang, M., Qin, L., and Tang, B. (2019). MicroRNAs in Alzheimer’s disease. Front. Genet. 10:153. doi: 10.3389/fgene.2019.00153
Wang, T., Shi, F., Jin, Y., Jiang, W., Shen, D., and Xiao, S. (2016). Abnormal changes of brain cortical anatomy and the association with plasma MicroRNA107 level in amnestic mild cognitive impairment. Front. Aging Neurosci. 8:112. doi: 10.3389/fnagi.2016.00112
Wang, W. X., Huang, Q., Hu, Y., Stromberg, A. J., and Nelson, P. T. (2011). Patterns of microRNA expression in normal and early Alzheimer’s disease human temporal cortex: white matter versus gray matter. Acta Neuropathol. 121, 193–205. doi: 10.1007/s00401-010-0756-0
Wang, X., Xu, Y., Zhu, H., Ma, C., Dai, X., and Qin, C. (2015). Downregulated microRNA-222 is correlated with increased p27Kip(1) expression in a double transgenic mouse model of Alzheimer’s disease. Mol. Med. Rep. 12, 7687–7692. doi: 10.3892/mmr.2015.4339
Wei, Q., Tu, Y., Zuo, L., Zhao, J., Chang, Z., Zou, Y., et al. (2020). MiR-345-3p attenuates apoptosis and inflammation caused by oxidized low-density lipoprotein by targeting TRAF6 via TAK1/p38/NF-kB signaling in endothelial cells. Life Sci. 241:117142. doi: 10.1016/j.lfs.2019.117142
Wen, Z., Zhang, J., Tang, P., Tu, N., Wang, K., and Wu, G. (2018). Overexpression of miR185 inhibits autophagy and apoptosis of dopaminergic neurons by regulating the AMPK/mTOR signaling pathway in Parkinson’s disease. Mol. Med. Rep. 17, 131–137.
Zhang, J., Liu, L. H., Zhou, Y., Li, Y. P., Shao, Z. H., Wu, Y. J., et al. (2011). Effects of miR-541 on neurite outgrowth during neuronal differentiation. Cell Biochem. Funct. 29, 279–286. doi: 10.1002/cbf.1747
Zhao, H., Li, H., Du, W., Zhang, D., Ge, J., Xue, F., et al. (2014). Reduced MIR130A is involved in primary immune thrombocytopenia via targeting TGFB1 and IL18. Br. J. Haematol. 166, 767–773. doi: 10.1111/bjh.12934
Keywords: miRNA transcriptome, miRNA-Seq, NGS, transgenic mouse model, Tg4-42, Alzheimer
Citation: Bouter Y, Kacprowski T, Rößler F, Jensen LR, Kuss AW and Bayer TA (2020) miRNA Alterations Elicit Pathways Involved in Memory Decline and Synaptic Function in the Hippocampus of Aged Tg4-42 Mice. Front. Neurosci. 14:580524. doi: 10.3389/fnins.2020.580524
Received: 06 July 2020; Accepted: 18 August 2020;
Published: 10 September 2020.
Edited by:
Jie Tu, Chinese Academy of Sciences (CAS), ChinaReviewed by:
Wang-Xia Wang, University of Kentucky, United StatesNataliya G. Kolosova, Russian Academy of Sciences, Russia
Copyright © 2020 Bouter, Kacprowski, Rößler, Jensen, Kuss and Bayer. This is an open-access article distributed under the terms of the Creative Commons Attribution License (CC BY). The use, distribution or reproduction in other forums is permitted, provided the original author(s) and the copyright owner(s) are credited and that the original publication in this journal is cited, in accordance with accepted academic practice. No use, distribution or reproduction is permitted which does not comply with these terms.
*Correspondence: Andreas W. Kuss, a3Vzc2FAdW5pLWdyZWlmc3dhbGQuZGU=; Thomas A. Bayer, dGJheWVyQGd3ZGcuZGU=