 Alexandra Petiet1,2*
- 1Centre de Neuroimagerie de Recherche, Institut du Cerveau, Paris, France
- 2Inserm U1127, CNRS UMR 7225, Sorbonne Universités, Paris, France
Parkinson’s disease (PD) is a major neurodegenerative disease characterized by massive degeneration of the dopaminergic neurons in the substantia nigra pars compacta, α-synuclein-containing Lewy bodies, and neuroinflammation. Magnetic resonance (MR) imaging plays a crucial role in the diagnosis and monitoring of disease progression and treatment. A variety of MR methods are available to characterize neurodegeneration and other disease features such as iron accumulation and metabolic changes in animal models of PD. This review aims at giving an overview of how those physiopathological features of PD have been investigated using various MR methods in rodent models. Toxin-based and genetic-based models of PD are first described. MR methods for neurodegeneration evaluation, iron load, and metabolism alterations are then detailed, and the main findings are provided in those models. Ultimately, future directions are suggested for neuroinflammation and neuromelanin evaluations in new animal models.
Introduction
Parkinson’s disease is a major neurodegenerative disease in the elderly affecting 7 to 10 million people worldwide. This disease is characterized by massive degeneration of the dopaminergic (DA) neurons and Lewy body inclusions containing α-synuclein proteins in the subtantia nigra pars compacta (SNc), as well as neuroinflammation. The reduction of DA levels in the striatum (STR) causes the appearance of the clinical symptoms such as akinesia, rigidity, and tremor. The clinical diagnosis can only be done when 50% of those neurons are destroyed (Redgrave et al., 2010). While most forms of PD are sporadic, less than 10% are associated with familial mutations (Dauer and Przedborski, 2003; Thomas and Beal, 2007). Mutations in the leucin-rich repeat kinase 2 (LRRK2) and the α-synuclein coding gene (SNCA) are responsible for the autosomal-dominant PD, and mutations in the Parkin (PARK2), the phosphatase and tensin (Pten)-induced kinase 1 (PINK1), and DJ-1 genes are responsible for the autosomal–recessive PD.
Motor dysfunction in PD is classically described by the corticobasal ganglia–thalamocortical motor pathway model and with the direct, indirect, and hyperdirect pathways illustrated in Figure 1 (Delong, 1990; Honey et al., 2003; Lanciego et al., 2012). The basal ganglia (BG) include the dorsal STR, the globus pallidus (GP) interna and externa, the SNc, the substantia nigra pars reticulata (SNr), the thalamus (TH), and the subthalamic nuclei (STN). The dorsal STR receives excitatory glutamatergic (Glu) inputs from the cortex, while projection neurons from the SN and GP to the TH use inhibitory γ-aminobutyric acid (GABA) neurotransmitters. To close the loop, the motor cortex receives back excitatory Glu projections from the TH. Consequently, inhibition of the TH therefore leads to inhibition of the motor activation. Within the BG, the direct pathway is composed of monosynaptic connections from the dorsal STR to the GP interna, whereas the indirect pathway is composed of polysynaptic connections from the dorsal STR to the GP externa, STN, and to the GP interna. The hyperdirect pathway projects cortical neurons directly to the STN. Coming from the SNc, DA excites or inhibits GABAergic medium spiny neurons via D1 or D2 receptors in the STR, respectively. Those structures and neurotransmitters have been the targets for neuroimaging methods developments.
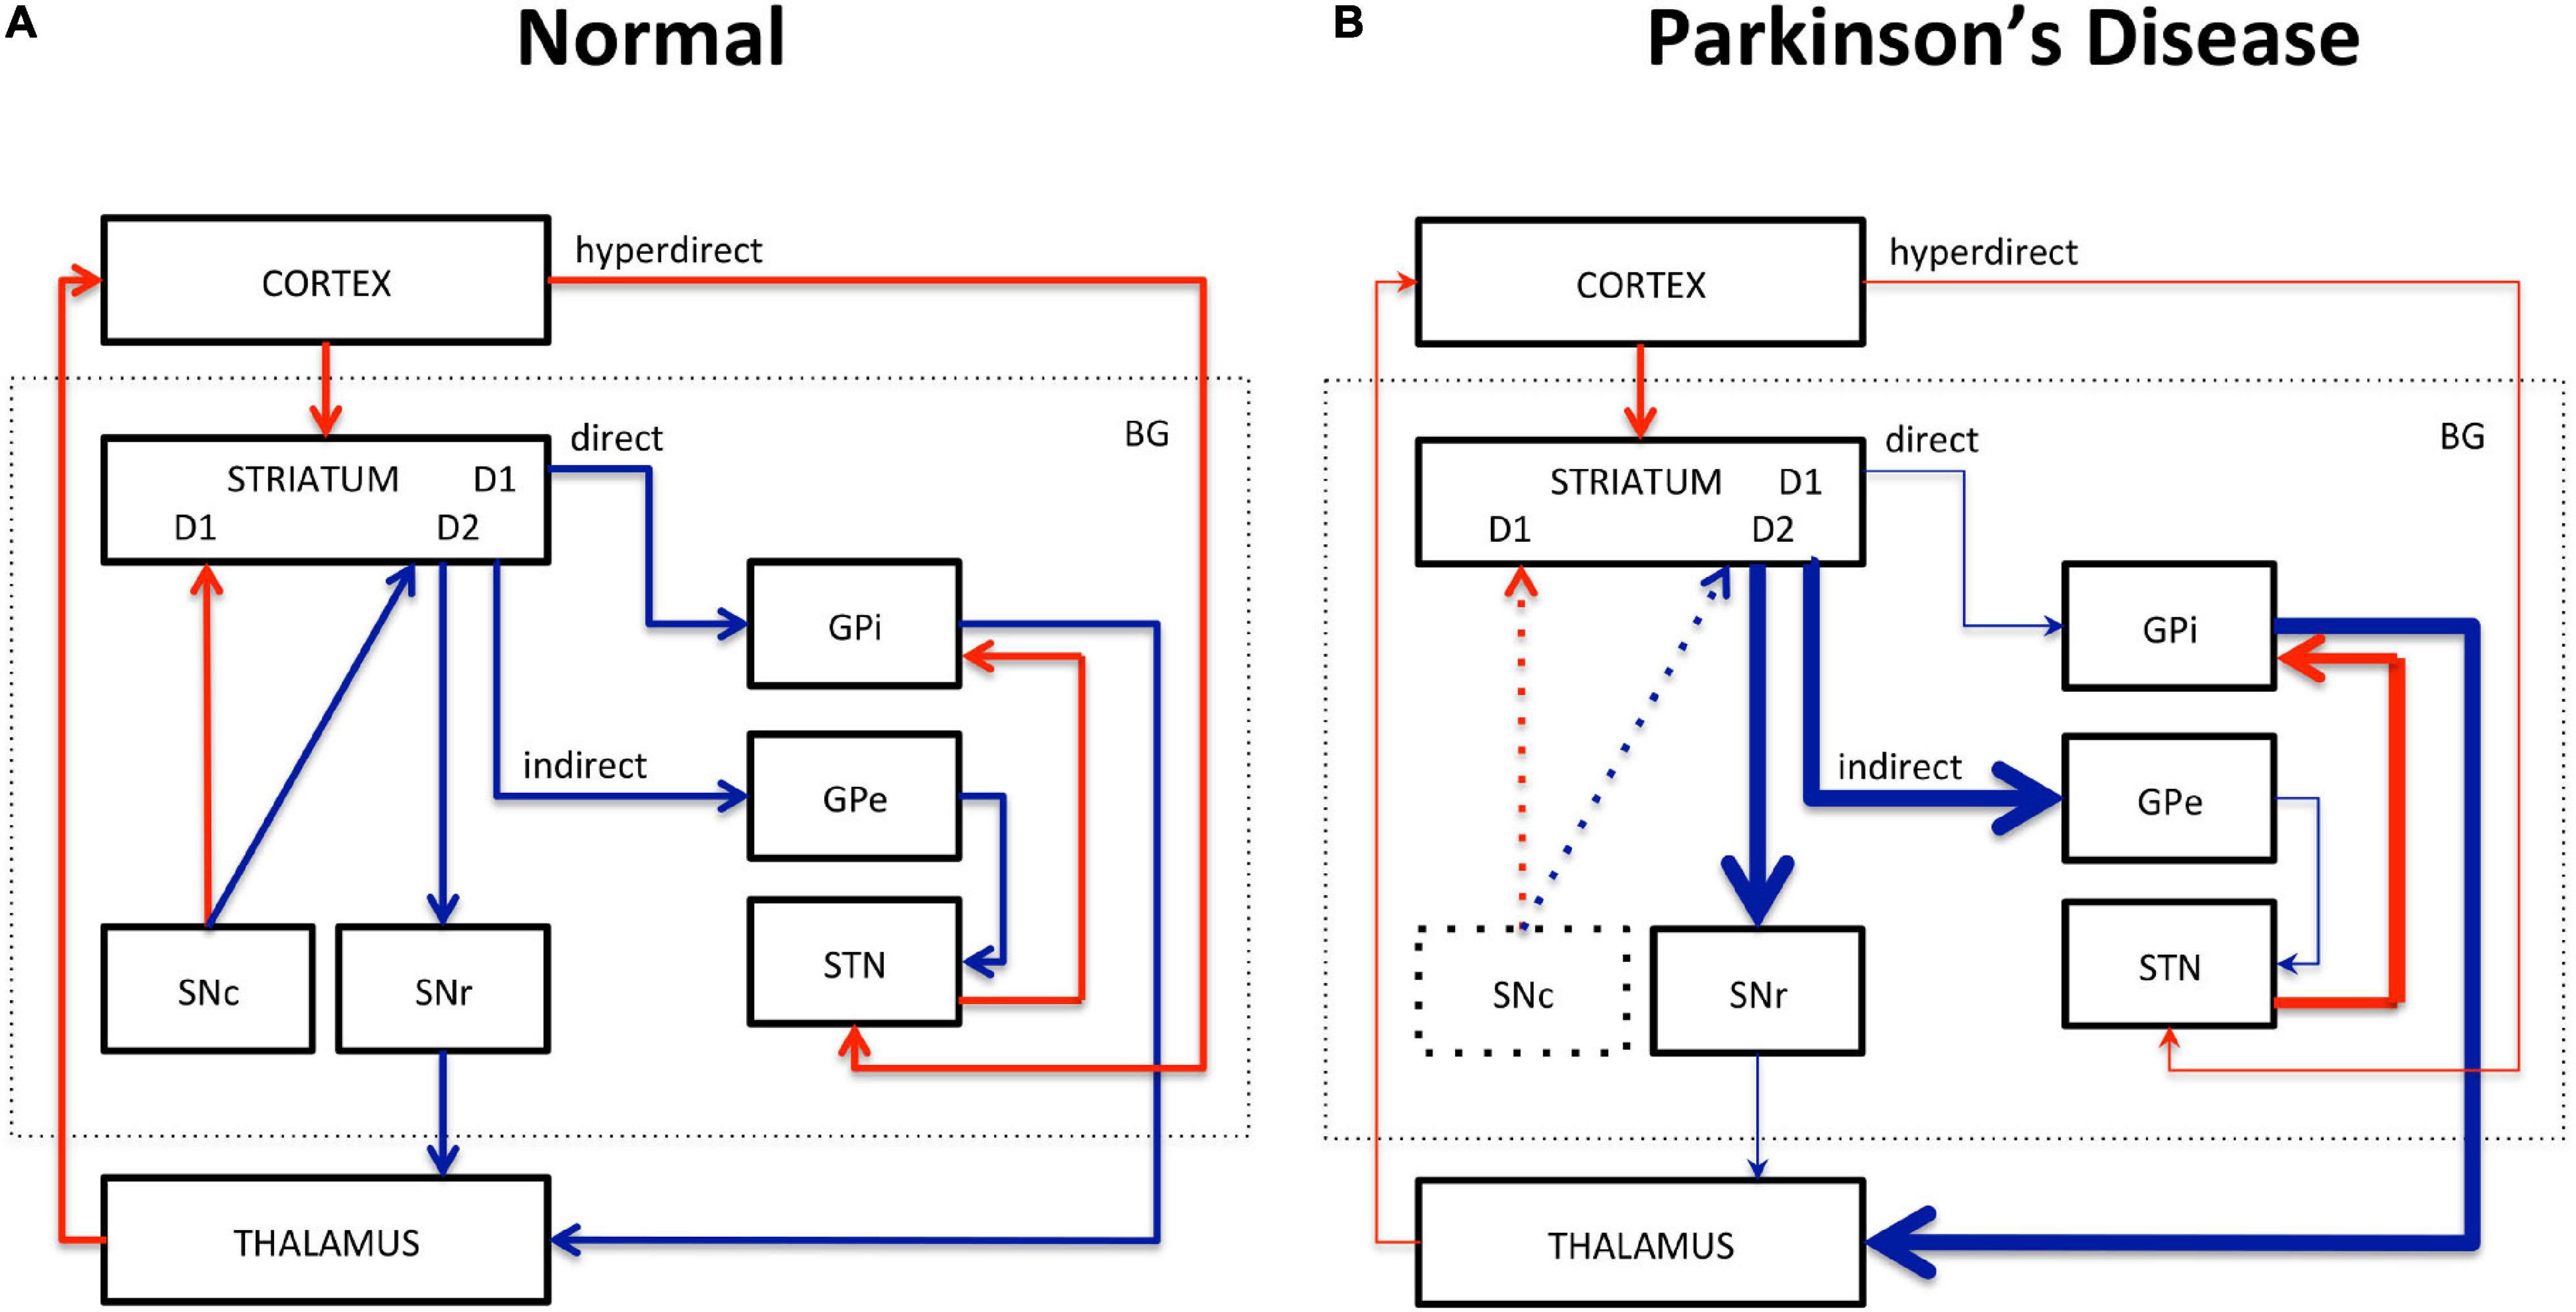
Figure 1. Schematic representation of the corticobasal ganglia–thalamocortical motor pathway model. (A) Normal pathway. (B) PD pathway. Red arrows correspond to glutamatergic excitatory projection neurons. Blue arrows correspond to GABAergic inhibitory projection neurons. D1, D2: striatal receptors. SNc, subtantia nigra pars compacta; SNr, subtantia nigra pars reticulata; STN, subthalamic nucleus; GPi, globus pallidus interna; GPe, globus pallidus externa; BG, basal ganglia. The direct (STR/GPi/TH), indirect (STR/GPe/STN/GPi/TH), and hyperdirect (cortex/STN) pathways are represented. Thick lines represent increased excitation/inhibition. Thin lines represent decreased excitation/inhibition. Dotted lines represent DA neuronal loss in the SNc.
Neuroinflammation also characterizes PD and includes microglial activation, astrocyte proliferation, lymphocyte infiltration, and the presence of proinflammatory cytokines (Glass et al., 2010). Whether inflammation is a cause or consequence of neurodegeneration in PD is still under debate (de Lau and Breteler, 2006; Glass et al., 2010; Tansey and Goldberg, 2010; Cabezudo et al., 2020). Likewise, the protective or deleterious role of inflammation in PD is still unknown (Sofroniew, 2015).
Non-invasive imaging tools have the potential to add critical value for earlier diagnosis and therefore for the development of more efficient treatments against the disease. In this regard, Magnetic Resonance Imaging (MRI) plays a crucial role in the diagnosis and monitoring of disease progression and treatment in both humans and animal models. Neurodegeneration has been evaluated in the SN and nigrostriatal fibers in PD patients using MRI. Changes in diffusion metrics have been reported in the SN of patients [decreased anisotropy and increased mean diffusivity (MD)] and spreading to other gray and white matter regions and tracts, indicating expended loss of microstructural integrity (see review by Weingarten et al., 2015). Likewise, changes in the functional properties of these structures can be detected with resting-state functional MRI (rs-fMRI) (see review by Lehéricy et al., 2012). Reduced functional connectivity (FC) in the SN and in corticostriatal networks was also reported in patients (Helmich et al., 2010; Sharman et al., 2012).
Abnormal iron accumulation in specific brain regions has been observed in several neurodegenerative diseases including PD. Up to 35% increase in the SNc of PD patients has been reported (Dexter et al., 1989; Hirsch et al., 1991). As T2- and T2∗-weighted imaging are sensitive to the presence of paramagnetic iron, they have been used to evaluate iron deposits in the SN (Lehéricy et al., 2014; see review by Pietracupa et al., 2017). Decreased T2 values have been measured in the caudate nucleus, putamen, and SN of PD patients (Antonini et al., 1993). Increased nigral transverse relaxation rates R2∗ (1/T2∗) have been reported in PD patients and correlated with disease progression (Ulla et al., 2013; Hopes et al., 2016).
Metabolism alterations in PD patients have been investigated with MR spectroscopy (MRS). While N-acetyl-aspartate (NAA) is a marker of neuronal integrity, myo-inositol (mIns) is a marker of gliosis, and creatine (Cre) is a marker of energy metabolism. Changes in neurotransmitters levels can also inform on the pathological state. For instance, decreased levels of NAA have been reported in the cortex and SN, whereas increased GABA and Glu levels have been found in the pons, putamen, and SN of PD patients (Emir et al., 2012; Levin et al., 2012; Graff-Radford et al., 2014; Gröger et al., 2014).
Animal models have been widely used to improve our understanding of PD features with anatomical, functional, and metabolic MR-based tools. Toxic models based on intracerebral or systemic injections of neurotoxins produce nigrostriatal lesions that replicate many of PD features (see the review by Blandini and Armentero, 2012). The most used models of neurodegeneration are based on injections of the 6-hydroxydopamine (6-OHDA) and the 1-methyl-4-phenyl-1,2,3,6-tetrahydropyridine (MPTP) neurotoxins to produce degeneration of DA neurons in the SN and subsequently of the entire nigrostriatal pathway (Yuan et al., 2005). Although those models are partial models and more acute than the progressive human pathology, they have been extremely useful in mimicking many of PD features accompanied by motor symptoms. Alternatively, genetic-based animal models of PD allow the investigation of the prodromal stage of the disease during the presymptomatic period, as well as the study of specific pathways related to genetic and biochemical alterations (see reviews by Chesselet et al., 2008; Creed and Goldberg, 2018 and by Dawson et al., 2010).
This review aims at giving an overview of how the physiopathological features of PD have been investigated using the most represented MR methods in animal models. It is based on PubMed searches within the last 10 years, and it is limited to rodent models of PD as they have been the most widely used and for their potential in genetic studies. It was elaborated based on a physiopathological perspective to demonstrate how various imaging approaches have been used to investigate PD physiopathology in animals. Rodent models are first described, including toxin-based and genetic-based models. Then structural and functional MR methods are detailed, such as diffusion and rs-fMRI to evaluate neurodegeneration, followed by T2∗ and susceptibility imaging to evaluate iron accumulation and MRS to evaluate metabolism changes. Future directions for preclinical MR developments are suggested and include strategies for neuroinflammation and neuromelanin evaluations.
Rodent Models
Toxin-Based Models
The 6-OHDA Model
Following the discovery that 6-OHDA could produce selective degeneration of sympathetic adrenergic nerves (Thoenen and Tranzer, 1968), this neurotoxin has been used as a denervation tool in animals (Ungerstedt, 1968; Jonsson, 1980). As a hydroxylated analog of DA, 6-OHDA enters DA neurons through DA transporters. Once in the cytosol, it forms hydrogen peroxide by auto-oxidation reaction. As 6-OHDA does not cross the blood-brain barrier (BBB), it is necessary to administer it directly into the brain with stereotaxic injections. As bilateral injections cause high mortality rates, unilateral injections have been preferred. The mechanism of action varies depending on the injection site along the nigrostriatal pathway. Injections into the SNc or into the medial forebrain bundle (MFB) produce massive and rapid anterograde degeneration of the nigral DA neurons, up to 90%–100% of SN and striatal neurons, and subsequently of the entire nigrostriatal pathway within days. Alternatively, injections into the dorsal STR induce partial lesions of the nigral DA neurons, up to 50%–70% loss within 4 to 6 weeks, which leads to progressive retrograde degeneration of the nigrostriatal pathway more closely mimicking human pathology and allowing longitudinal evaluations (Berger et al., 1991; Przedborski et al., 1995; Shimohama et al., 2003). In the STR, greater than 90% loss of DA can be reached after intrastriatal infusion of 6-OHDA in mice (Xiao et al., 2011).
The MPTP Model
The selective toxicity of MPTP for the nigrostriatal tract was first described by Langston et al. (1983). MPTP is converted to 1-methyl-4-phenylpyridinium ion (MPP+) and accumulates in the SNc neurons via DA transporters. As MPTP can cross the BBB, it can be injected via the peripheral system. However, systemic MPTP administration fails in rats as the conversion from MPTP to MPP+ occurs at the BBB preventing influx into the brain (Giovanni et al., 1994; Pienaar et al., 2010; Jagmag et al., 2016; Konnova and Swanberg, 2018); it is therefore alternatively used in mice (Mori et al., 1988). Repeated intraperitoneal injections in mice cause rapid and massive DA neuron loss, which leads to similar symptoms as those found in patients such as akinesia, rigidity, and episodes of tremor (Jackson-Lewis et al., 1995; Tatton and Kish, 1997).
Genetic-Based Models
Autosomal-Dominant Models
The most common mutations in autosomal-dominant PD are the LRRK2 mutations (Zimprich et al., 2004). This kinase enzyme is normally present in membranes and plays a role in mitochondria, autophagy, and endocytosis (Winklhofer and Haass, 2010; Berwick et al., 2019). Transgenic mice present little to no DA neurodegeneration; however, most of them have abnormalities in the nigrostriatal system, α-synuclein aggregation, or impaired DA release (Li et al., 2009; Jagmag et al., 2016). Likewise, LRRK2 mutated rats do not show any DA neurodegeneration in the SN but rather behavioral alterations (Daher et al., 2014; Walker et al., 2014; Lee et al., 2015; Shaikh et al., 2015; Sloan et al., 2016).
The SNCA gene codes for the presynaptic α-synuclein protein, which is abundantly found in the brain (Maroteaux et al., 1988). Its function is not fully understood; however, it is believed to play a role in synaptic vesicle function, hence of neurotransmitter release (Kahle et al., 2002). Overexpression of α-synuclein produces heterogeneous phenotypes in mice, depending on the promoters used for transgene expression. Although they lack DA degeneration, some of them present nigrostriatal dysfunctions (Abeliovich et al., 2000; Fleming et al., 2005; Chesselet et al., 2008).
Autosomal–Recessive Models
The Parkin (PARK2) gene is involved in the ubiquitin proteasome system as an E3 ubiquitin ligase, and mutations of this gene cause loss of function in patients. Parkin knockout does not seem to induce nigrostriatal or DA lesions in mice (Perez and Palmiter, 2005). However, overexpression of a mutated form of this gene leads to nigral DA cell depletion, striatal synaptic loss, and decreased striatal DA levels in mice (Lu et al., 2009). Likewise, overexpression of Parkin induces mild neurodegeneration in rats (Van Rompuy et al., 2014).
PINK1 is a mitochondrial protein kinase that protects neurons from mitochondrial dysfunction stress. The PINK1 mutation leads to loss of function mainly affecting the kinase domain in patients (Klein and Westenberger, 2012). PINK1 knockout does not produce any DA neuronal depletion in mice, but it alters DA neurotransmission and mitochondrial function (Kitada et al., 2007; Gautier et al., 2008; Gispert et al., 2009). In contrast, PINK1 knockout rats have SN DA neuronal loss, α-synuclein accumulation, mitochondrial defects, and motor dysfunction (Dave et al., 2014; Villeneuve et al., 2016).
DJ-1 is a ThiJ/Pgpl molecular chaperone encoded by the PARK7 gene and widely expressed in the body. DJ-1 knockout mice do not exhibit any DA depletion but show some nigrostriatal and mitochondrial abnormalities (Goldberg et al., 2005; Kim et al., 2005; Andres-Mateos et al., 2007).
Other Models
A conditional knockout mouse model with respiratory chain-deficient DA neurons was created in 2007 and named MitoPark mice (Ekstrand et al., 2007). This model is based on the inactivation of the mitochondrial transcription factor A (Tfam) gene in DA neurons. Among the different genetic models, those mice present the most PD-like phenotypes including DA cell death, intraneuronal inclusions, and progressive motor dysfunction.
MR Methods for Neurodegeneration Evaluation
Diffusion Imaging
In an unrestricted medium, water molecules undergo random Brownian motion and diffuse freely. Its motion can be hindered by membranes, extracellular hindrance, or tissue heterogeneity. Diffusion-weighted imaging is sensitive to water diffusion through the application of diffusion gradients (Le Bihan, 2003). In the white matter, where fiber bundles constitute physical constraints, water molecules diffuse along a preferred direction along the fibers, which is referred to as anisotropy. The diffusion tensor model, a model of the displacement of water molecules, can provide indices such as the MD, characterizing the overall displacement of water molecules; the fractional anisotropy (FA), characterizing the orientation of diffusion; and the eigenvalues, characterizing the main directions of diffusivities, also derived as axial and radial diffusivities (AD, RD). Although the cellular origin of anisotropy is multifactorial and remains unclear (Chabert and Scifo, 2007), it has been shown that AD changes can be used as an index of axonal damage, whereas RD can be used as an index of myelin damage (Song et al., 2005). In highly oriented fiber bundles, FA is high (close to 1), whereas in regions of crossing fibers, it is low (close to 0).
Diffusion imaging has been used to evaluate microstructural changes in rodents. The SN can be sufficiently resolved from those images, and the nigrostriatal tract can clearly be identified and reconstructed (Figure 2). Following MFB injections of 6-OHDA in rats, Monnot et al. (2017) reported decreased FA and increased RD in the ipsilateral SNc and SNr. Those results were supported by a previous study by Soria et al. (2011), which showed bilateral changes in the SN in the same model targeting the MFB. They showed that FA was decreased in the ipsilateral SNr, AD was bilaterally decreased in the SNr, and RD was bilaterally increased in the cortex (Soria et al., 2011). Furthermore, those results were consistent with neurodegeneration and with human findings (Vaillancourt et al., 2009; Rolheiser et al., 2011; Skorpil et al., 2012; Cochrane and Ebmeier, 2013; Schwarz et al., 2013). In contrast, they were in disagreement with a previous study by Van Camp et al. (2009), which found increased FA in the ipsilateral SN of 6-OHDA rats injected in the STR. This FA increase was attributed to neuroinflammation, but the discrepancy with the other studies might also be due to differences in the injection site (MFB vs. STR). A more recent study by Perlbarg et al. (2018) demonstrated increased FA in the ipsilateral and contralateral STR of 6-OHDA rats who received intrastriatal injections (Perlbarg et al., 2018). This result was consistent with neurodegeneration in a crossing-fiber structure. Indeed, regions of crossing fibers such as the STR have lower FA than regions of linearly oriented fibers such as corpus callosum (CC). Therefore, the selective degeneration of a group of fibers crossing other populations of fibers leads to increase of FA (Winston, 2012). Additionally, they found increased MD in the ipsilateral STR indicating loss of microstructural integrity and in line with human findings. However, in this study, no changes in the SN could be detected presumably because of a lack of sensitivity.
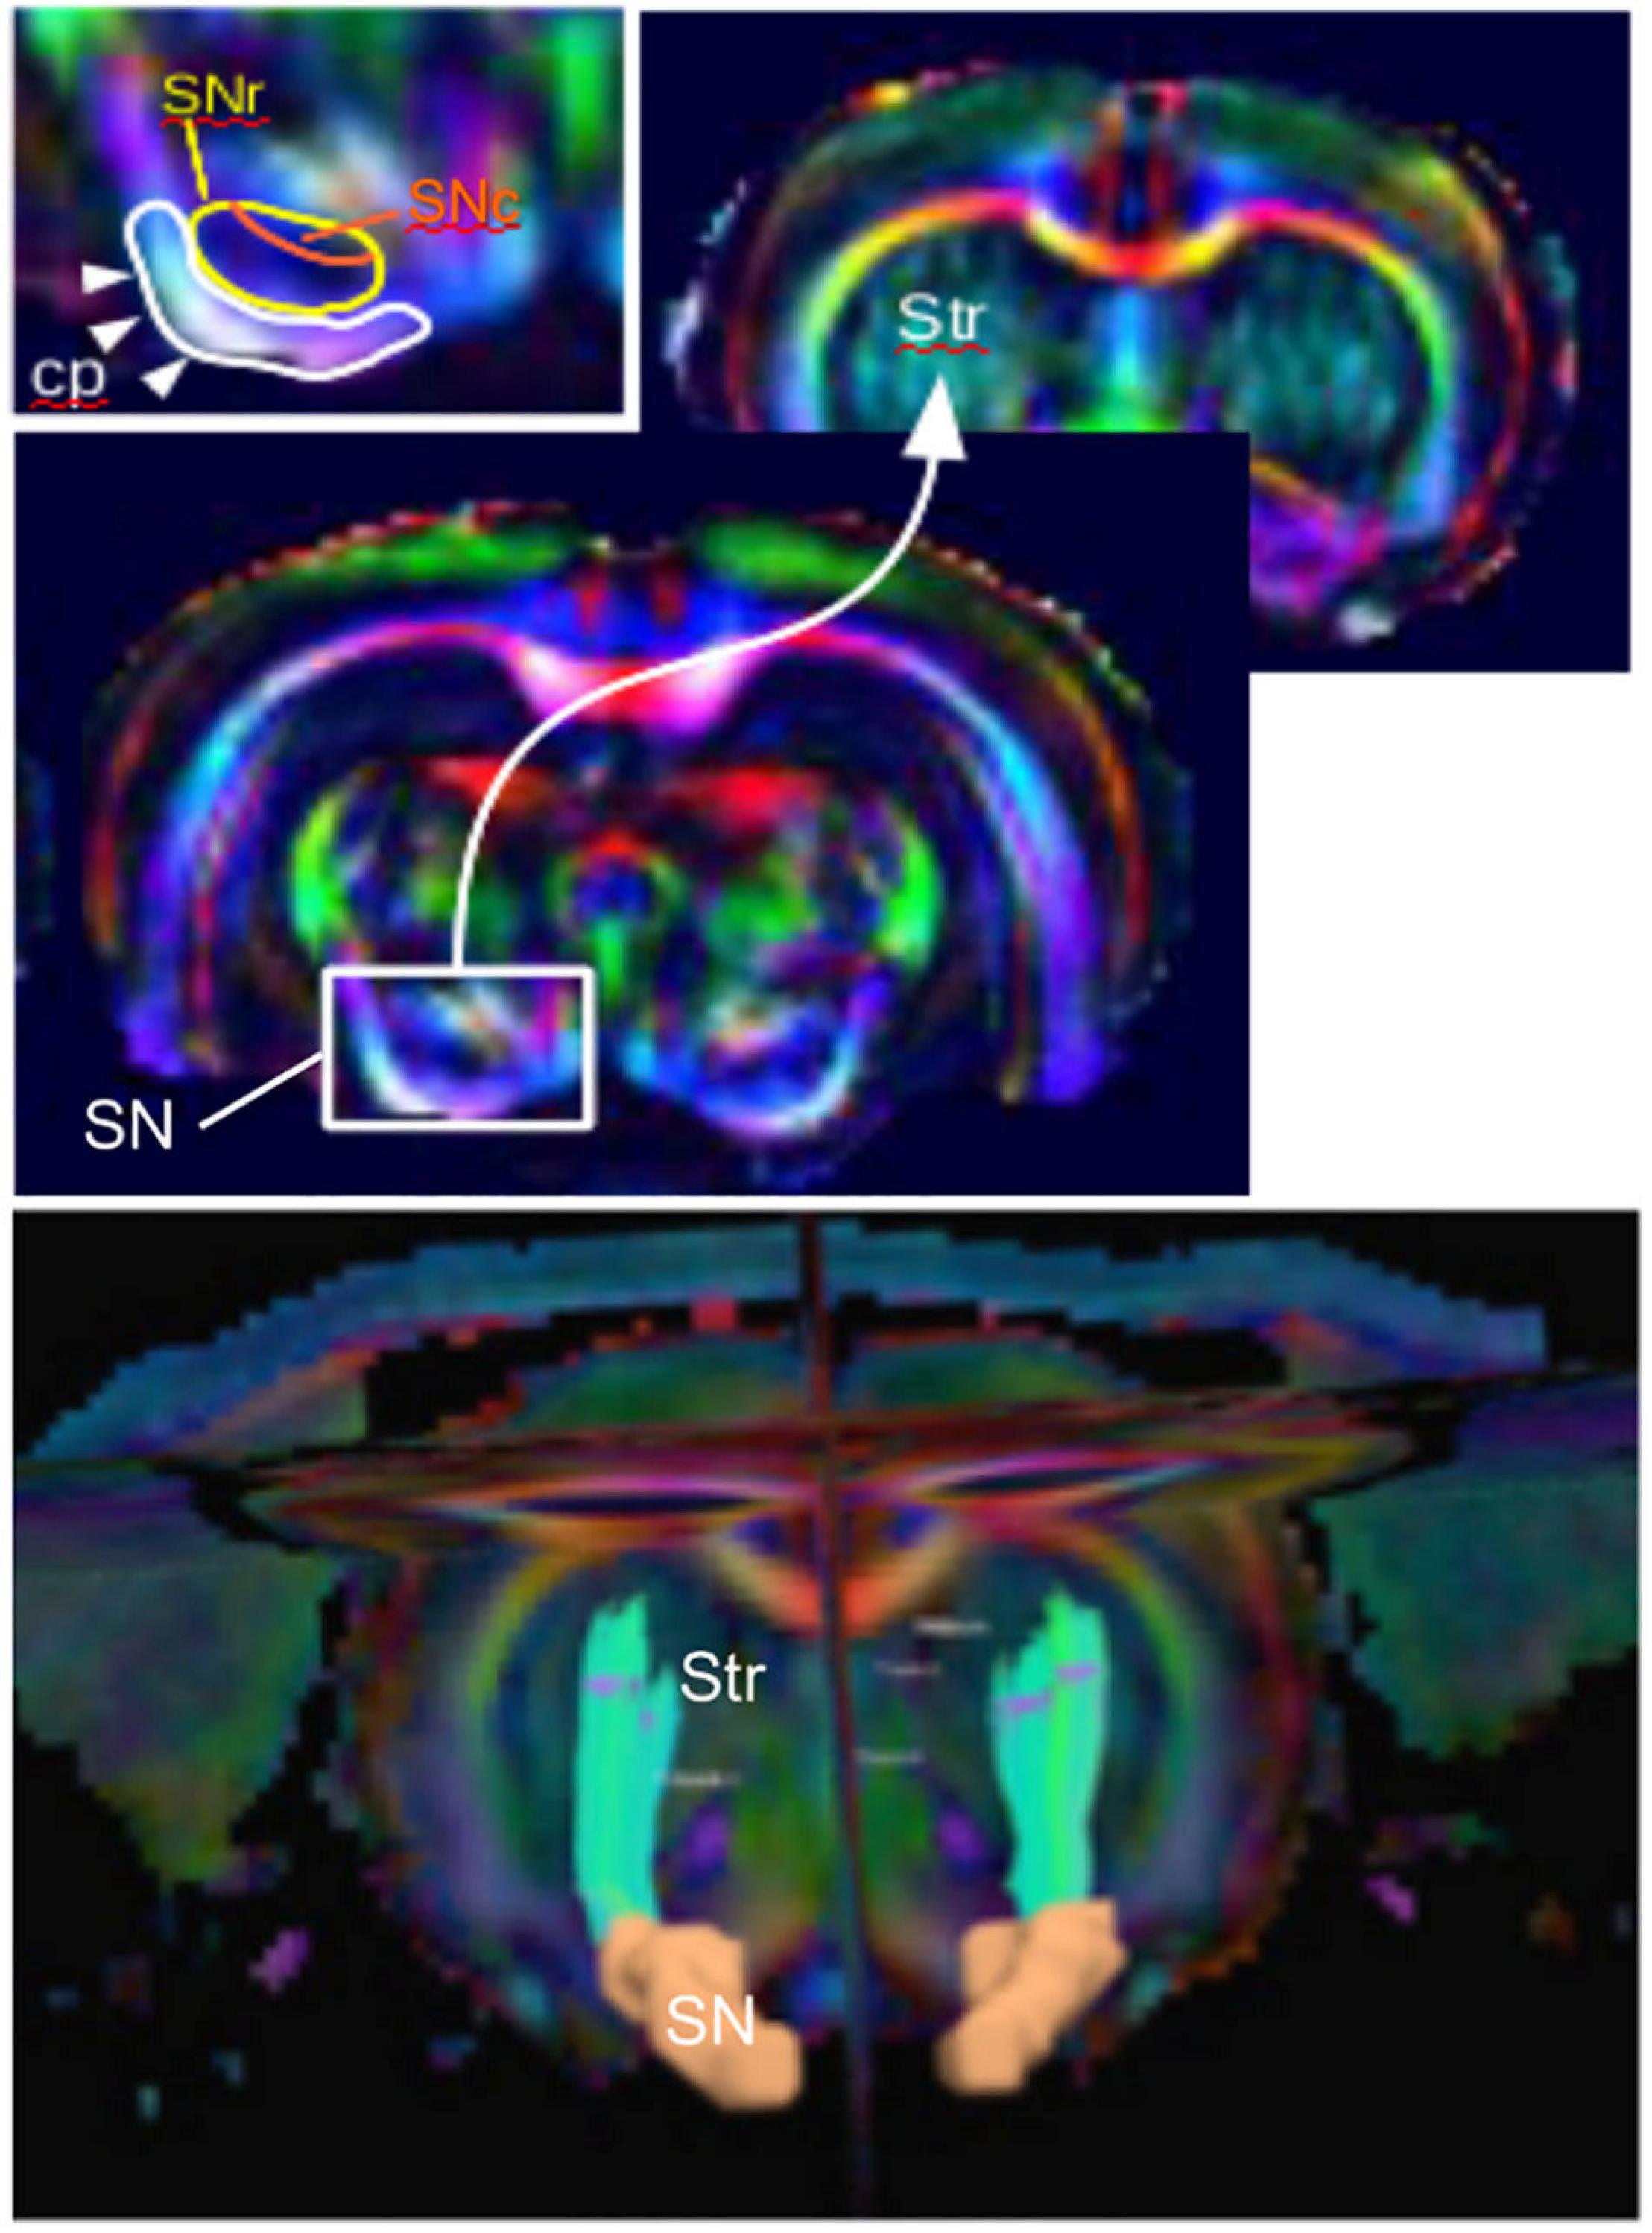
Figure 2. The nigrostriatal pathway illustrated with color-coded diffusion tensor images of a rat brain (coronal views). (Top) Zoom into the subtantia nigra (SN) projection to the striatum (Str) and inlet showing the detailed structure with the cerebral peduncle (cp), the SN reticulata (SNr), and the SN compacta (SNc). (Bottom) Three-dimensional reconstructed nigrostriatal tract (green) from the SN (orange) to the dorsal Str using diffusion-based tractography.
In genetic-based models, neuroimaging studies showed decreased MD, AD, and RD in regions of known α-synuclein accumulation such as the SN, STR, sensorimotor cortex (SM), and TH in α-synuclein transgenic mice (Supplementary data, Khairnar et al., 2015). Those results could be explained by the presumable decrease of free water diffusion caused by the protein aggregation. In a presymptomatic PINK1 knockout rat model, altered diffusion metrics [reduced anisotropy and apparent diffusion coefficient (ADC)] were observed in the BG and other regions (e.g., hippocampus, brainstem, and cerebellum) (Cai et al., 2019). Those widespread changes throughout the brain have also been described in PD patients (Braak et al., 2004). In the MitoPark mouse model, decreased FA has been measured in the SN and CC, indicating neuronal and fiber degeneration (Cong et al., 2016).
Functional Imaging
Functional connectivity or “synchrony” between and within brain regions refers to temporal correlations between spatially remote neurophysiological events, as measured by fMRI blood oxygenation level-dependent (BOLD) signal (Friston et al., 1993). Using fMRI, low-frequency, spontaneous, and, in some cases, coherent signal fluctuations may be detected in the resting brain (Biswal et al., 1995). Rs-fMRI studies have thus revealed co-activation in distributed networks of cortical and subcortical regions that characterize functional brain networks. Such connectivity may or may not also involve a structural connection (Honey et al., 2009). Most of PD imaging in patients and in animal models has been conducted in the resting state.
Functional connectivity changes have been explored in the nigrostriatal pathway in animal models. Decreased FC was found in the interhemispheric STR and in the ipsilateral cortices of 6-OHDA rats (Monnot et al., 2017; Westphal et al., 2017). Those animals were injected in the MFB and anesthetized with either a mixture of isoflurane and medetomidine (former study) or with medetomidine alone (latter study) during imaging. Likewise, decreased FC between the ipsilateral primary motor cortex (M1) and contralateral TH was reported in the intrastriatal 6-OHDA model using isoflurane alone (Perlbarg et al., 2018). Zhurakovskaya et al. (2019) also reported decreased FC in corticocortical and striatocortical connections of 6-OHDA-injected rats under urethane anesthesia (Zhurakovskaya et al., 2019). Decreased FC is commonly interpreted as direct lesioning effects.
Increased FC was found between the STR and the SM and in the TH of both hemispheres in 6-OHDA rats injected in the MFB (Monnot et al., 2017; Westphal et al., 2017). Similarly, increased FC was found between the ipsilateral STR and the GP, the contralateral M1 and the GP, and the interhemispheric STR and the GP of 6-OHDA rats injected in the STR (Perlbarg et al., 2018). Figure 3 illustrates the FC maps from the lesioned STR to the rest of the brain in this study and highlights the (non-significant) increased FC between the ipsilateral and contralateral STR in the 6-OHDA group compared to the sham-operated group 3 weeks after lesioning. Increased FC is generally attributed to compensatory effects and reorganization, like it has been observed in PD patients (Helmich et al., 2010; Sharman et al., 2012).
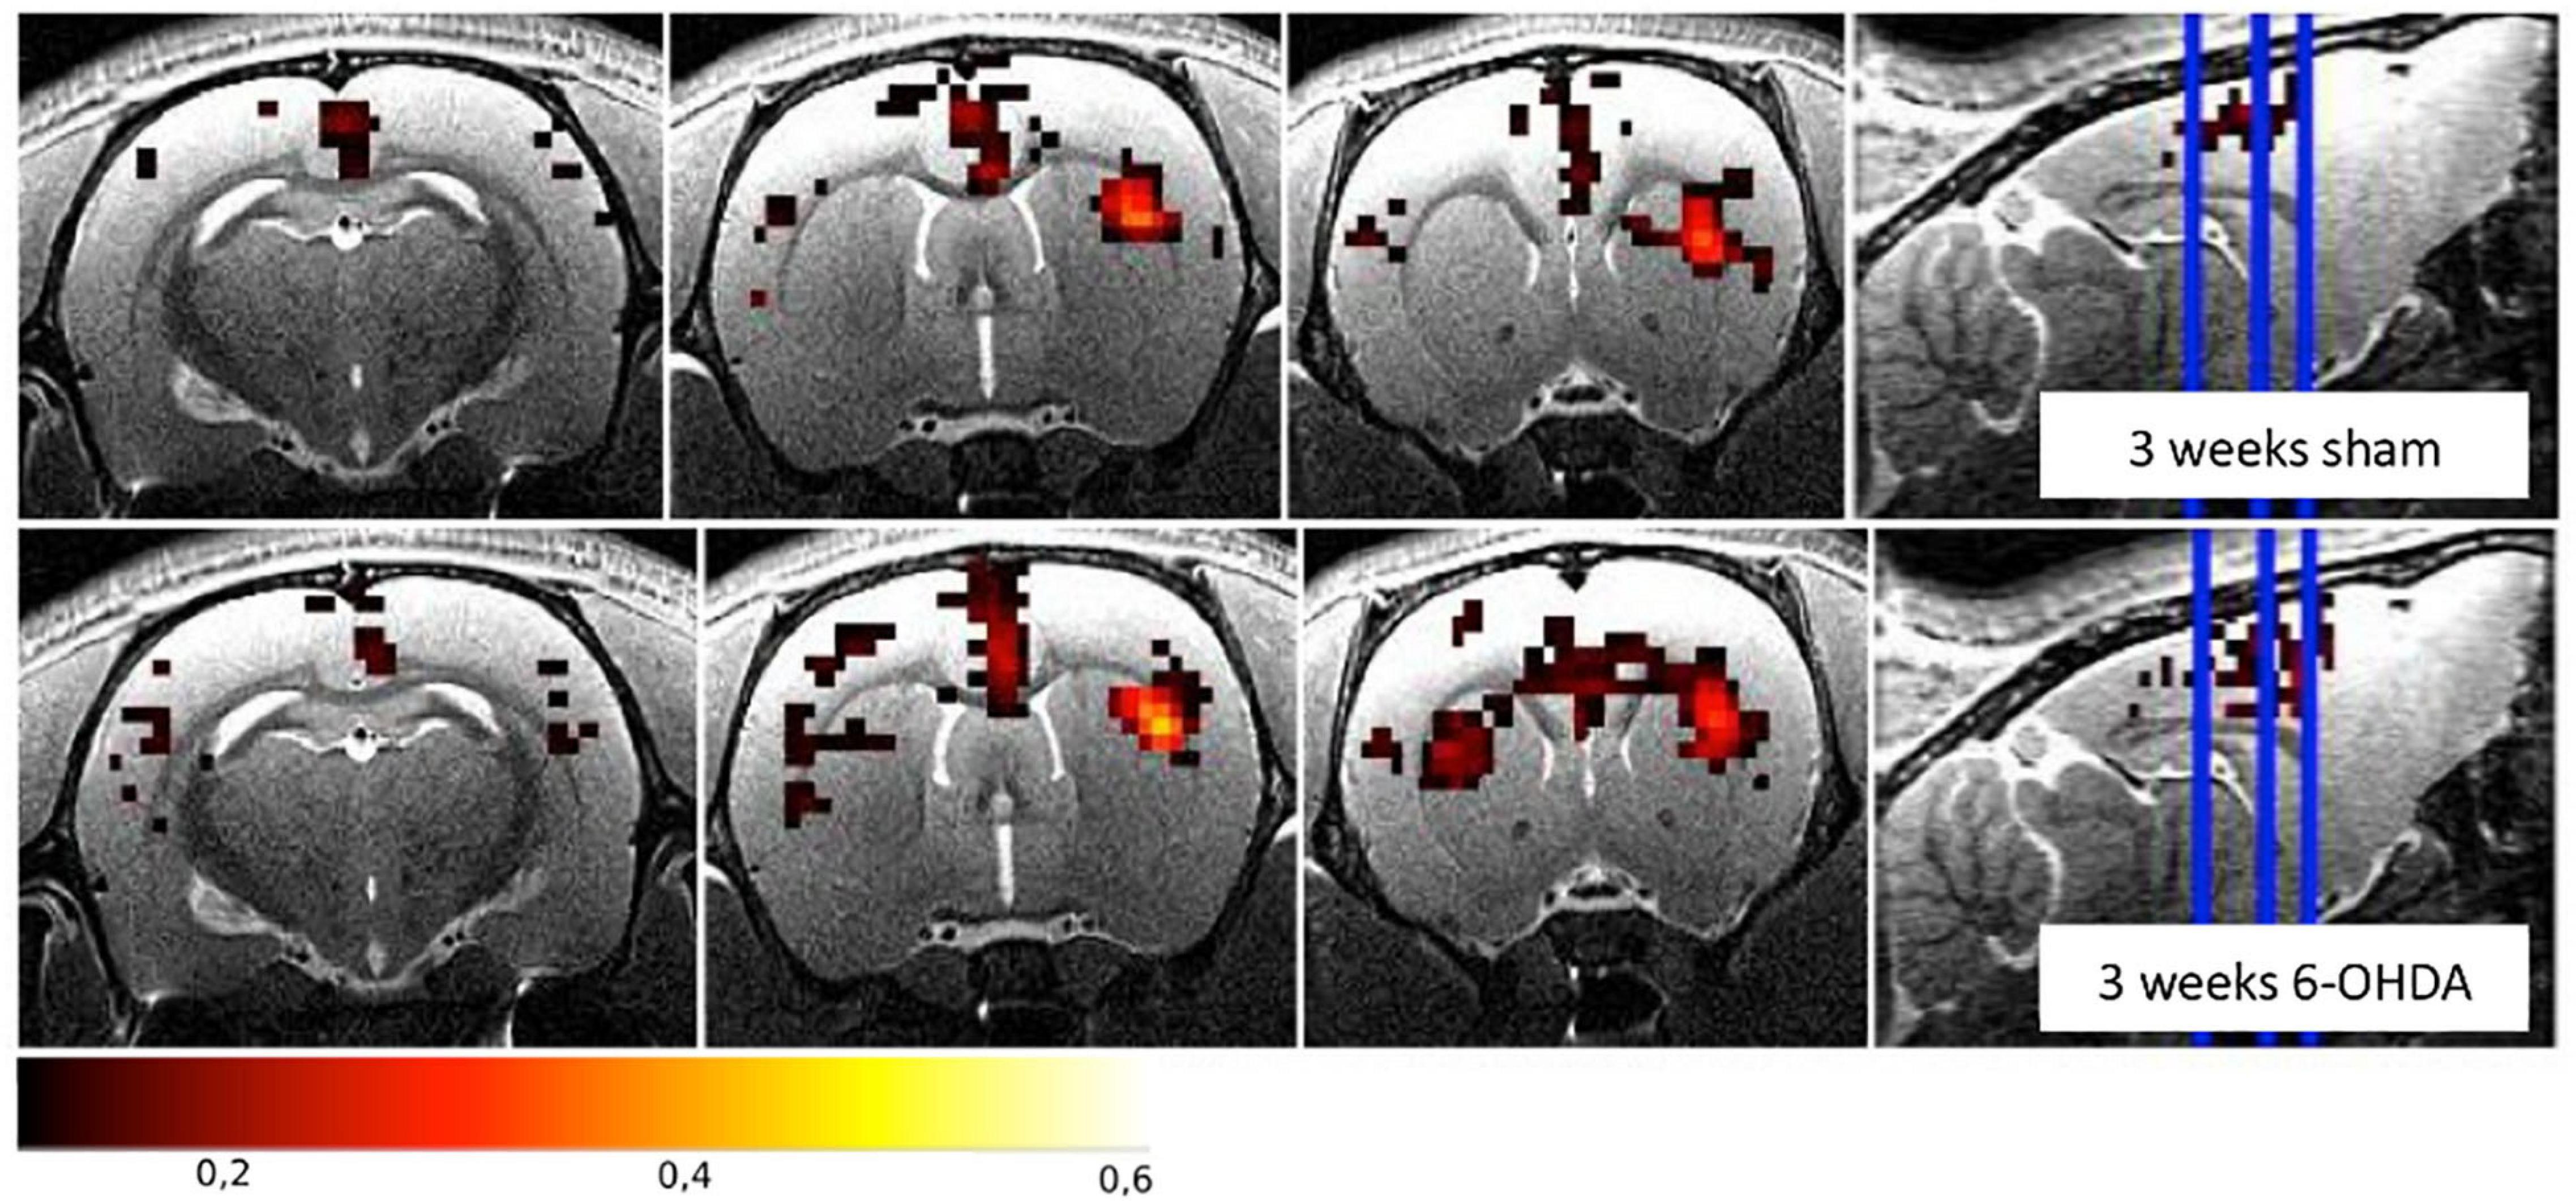
Figure 3. Functional connectivity maps from the right striatum for the sham-operated and the 6-OHDA groups at 3 weeks postinjection in the right hemisphere (i.e., on the right side of the brain on the images). The 6-OHDA group shows a non-significant increase of FC between the left and right striatum. Maps are expressed as correlation coefficient R. See Perlbarg et al. (2018) for the full study description.
In a presymptomatic PINK1 knockout rat model, Cai et al. (2019) observed changes in rs-fMRI connectivity in the BG and other regions such as the amygdala, cortex, septum, and pons. They measured decreased connectivity between the TH and STR, whereas the cerebellar nuclei showed increased connectivity within the cerebellum and hippocampus in PINK1 rats under isoflurane anesthesia. Based on their findings, they suggested a reorganization of connectivity pathways in PINK1 mice, in which the STR to TH connection would be rerouted from the STR to the hippocampus also showing increased connectivity from the cerebellum. They argued on the role of the cerebellum in PD pathology similar to the cerebellar hyperconnectivity found in PD patients (Cerasa et al., 2016; Tuovinen et al., 2018).
MR Methods for Iron Accumulation Evaluation
T2∗ Imaging
It has been shown that iron accumulates in the SN of MPTP and 6-OHDA-lesioned animals (Wang et al., 2004; Hare et al., 2009; Jiang et al., 2010; Lv et al., 2011). Iron deposits can be detected with conventional T2∗ imaging. For example, Olmedo et al. (2017) quantified hyposignal levels in the SN of 6-OHDA rats 1 and 4 weeks postinjection in the MFB. They reported significantly increased hypointense pixels (i.e., decreased T2∗ signal) in 6-OHDA rats compared to sham rats, which correlated to iron staining with Prussian blue at 4 weeks. Furthermore, Virel et al. (2014) evidenced iron accumulation in the STR of 6-OHDA rats following intrastriatal injections. In this study, they measured increased T2∗ hypointensities (i.e., decreased T2∗ signal) in the ipsilateral STR as early as 1 week postlesioning and persisting up to 4 weeks. They also showed correlations of those hypointensities with edematous hyperintensities and with iron accumulation revealed with Prussian blue staining at 4 weeks only. In contrast, the SN remained intact, presumably due to milder and delayed depletion in this structure at this later timepoint.
Decreased T2∗ in the SN and STR has also been found in the MitoPark mouse model and was presumably attributed to iron accumulation in the SN as it is a shared feature with PD patients.
Susceptibility Imaging
Other iron-sensitive MRI methods include susceptibility-weighted imaging (SWI) and quantitative susceptibility mapping (QSM), both of which have been used to improve imaging of the SN nigrosomes, STN, and GP interna (Lotfipour et al., 2012; Liu et al., 2013; Schwarz et al., 2014). In SWI methods, the phase data are used to detect susceptibility differences between tissues and are combined to the magnitude data to improve image contrast (Haacke et al., 2004). Increased iron accumulation in PD patients has been measured in deep gray nuclei using SWI (Zhang et al., 2009, 2010; Jin et al., 2011; Wu et al., 2014; Guan et al., 2016; Hopes et al., 2016). QSM is a more recent technique that converts the phase shifts to localize magnetic susceptibility (Haacke et al., 2015). Very little literature is available in PD rodent models applications; nevertheless, increased QSM has been reported in the SN of an MPTP mouse model (Guan and Feng, 2018). This study also evidenced that QSM was a more accurate method than R2∗ to detect iron-related changes in the SN, which was supported by a study including PD patients (Hopes et al., 2016). Further improvements of QSM methods have been developed for imaging the mouse brain microstructure at a very high resolution, such that striatal tracts can be reconstructed at 20-μm resolution based on QSM images from postmortem brains (Wei et al., 2016). It has therefore the potential to be used in PD models applications.
MR Spectroscopy for Metabolism Evaluation
Magnetic resonance spectroscopy is based on the chemical shift and the spin–spin coupling effects. Different nuclei possess different resonant frequencies depending on their chemical environment and local magnetic fields. Their chemical shift is expressed in parts per million (ppm) relative to the standard reference compound tetramethylsilane (Barker et al., 2010).
Magnetic resonance spectroscopy has been used to assess brain metabolic changes in PD models. For example, increased GABA levels have been measured in the STR of MPTP mice and of 6-OHDA rats injected in the MFB (Chassain et al., 2010; Coune et al., 2013). Those results were consistent with human data in which increased GABA levels were found in the pons, putamen, and in the SN of patients (Emir et al., 2012; Gröger et al., 2014). Those findings could be explained by the following mechanism: the STR receives DA projections from the SNc, and knowing that DA inhibits GABAergic spiny neurons via D2 receptors in the STR, DA denervation should lead to hyperactivation of those neurons (Gerfen, 1992).
Likewise, Glu and glutamine (Gln) levels were found to increase in the STR of MPTP mice (Chassain et al., 2010), consistent with increased Glu in the SN of PD patients (Gröger et al., 2014). In their article, Chassain et al. (2010) explain that this Glu increase inducing changes in the corticostriatal activity is “related to an increased synthesis and release of Glu in the synaptic terminal of the STR.” In contrast, decreased Glu levels were measured in the STR of 6-OHDA rats injected in the MFB (Coune et al., 2013).
Decreased NAA levels were found in the ipsilateral STR and in the cortex of 6-OHDA rats injected in the MFB and SN, respectively (Hou et al., 2010; Coune et al., 2013), consistent with neuronal loss also reported in PD patients (Levin et al., 2012; Graff-Radford et al., 2014). However, no changes in NAA levels were found in an MPTP mouse model (Chassain et al., 2010).
Viral vector-based α-synuclein rodent models can be used as an alternative to transgenic models to produce α-synuclein accumulation and subsequent DA cell loss. Intranigral injections of an adeno-associated viral vector coding for human α-synuclein resulted in increased GABA levels in the STR as measured by MRS in rats (Coune et al., 2013). This finding was also reported in a 6-OHDA rat model by the same group and was consistent with MRS data in patients (Emir et al., 2012; Gröger et al., 2014). Furthermore, decreased NAA levels were measured in the SN of rats following intranigral injections. This finding was consistent with nigral cell loss induced in the model and with NAA decrease also found in patients (Clarke and Lowry, 2001; Öz et al., 2006).
Metabolic changes have also been observed in PINK1 knockout rats using MRS. Villeneuve et al. (2016) found decreased taurine and Cre in the STR of PINK1 rats. Similarly, decreased taurine and increased Gln were reported in the STR in the same model by Ren et al. (2019). Decreased taurine has been found in patients (Engelborghs et al., 2003) and is associated with mitochondrial function (Hansen et al., 2010). Increased Gln could be attributed to Glu dysregulation as found in the STR of patients (Gardoni and Bellone, 2015).
Suggested Future Directions
Evaluation of Neuroinflammation
Inflammation is common to many brain diseases as it has been shown to contribute to neurodegeneration (Ransohoff, 2016). To improve our understanding of the role of inflammation in the etiology of PD, lipopolysaccharide (LPS) animal models have been developed.
LPS Animal Model
The endotoxin LPS is a large molecule found in the outer membrane of Gram-negative bacteria. It binds the CD14/TLR4/MD2 (cluster of differentiation 14/Toll-like receptor 4/myeloid differentiation factor 2) receptor complex, which triggers the activation of proinflammatory pathways and ultimately the activation of microglia (Park and Lee, 2013).
Lipopolysaccharide can be injected in the central or peripheral nervous system to generate various inflammatory responses associated with neurodegeneration (see review by Batista et al., 2019). To induce Parkinson-like features, LPS is injected in the SN or STR, leading to DA degeneration and motor dysfunction in rats (Castano et al., 1998), as well as to macrophage and microglia reactions (Herrera et al., 2000; Gao et al., 2002). Likewise, systemic LPS injections in mice cause microglial activation, progressive loss of nigral DA neurons, and locomotor deficits (Qin et al., 2007).
Lipopolysaccharide models can also be used to assess mitochondrial dysfunction and their contribution to PD pathophysiology. For example, intrastriatal injections of LPS lead to energy dysfunction and neuronal loss in the STR (Hunter et al., 2017). Furthermore, LPS injections can change iron and ferritin levels in nigral glial cells of rats associated with decreased tyrosine hydroxylase staining in the GP and STR (Zhang et al., 2005; Hunter et al., 2008). Interestingly, transgenic mice overexpressing α-synuclein and injected with LPS show increased protein aggregation, chronic nigral DA neuronal loss, and nigral inflammation compared to wild-type mice, suggesting a potentiation role of inflammation on α-synuclein dysfunction (Gao et al., 2011).
In their review, Belloli et al. (2020) give an overview of neuroinflammation imaging markers in PD. Based on the work by Ostrerova-Golts et al. (2000), which provides further data that support the role of toxic iron in α-synuclein aggregation (Ostrerova-Golts et al., 2000), the authors suggest a link between iron concentration and neuroinflammation (Belloli et al., 2020). As SWI can measure iron accumulation, it can therefore be used to assess iron-driven neuroinflammation.
Overall, the use of animal models with LPS-induced inflammation can help our understanding of the neuroinflammatory component of PD. To date, no MRI studies have been conducted on LPS rodent models of PD, which opens new paths to the field. Combined MR methods have the potential to investigate both inflammation and neurodegeneration and to help better define the role of inflammation in the pathophysiology of PD.
Diffusion MR Spectroscopy of Metabolites
Among other complex mechanisms, inflammation involves glial cells activation, and it participates both to the clearance of damaged tissue and to tissue repair. Whether astrocytes play a protective role against inflammation or triggers it is still unknown and constitutes the topic of much ongoing research (Sofroniew, 2015). As brain metabolites are present in specific cell types, they can provide cell-specific markers. For instance, increased levels of choline (Cho) and mIns have been attributed to inflammation and gliosis, respectively (Öz et al., 2014). However, while metabolite concentration changes derived from conventional MRS cannot be attributed to specific pathological mechanisms, diffusion-weighted MRS can probe microstructural changes, such as glial cell swelling upon activation (Palombo et al., 2018). This emerging technique is based on the diffusion properties of metabolites within the intracellular space. For instance, metabolites in hypertrophic cells have more space to diffuse, which should increase their ADC—derived from multiple diffusion spectroscopy experiments.
The diffusivities of Cho and mIns have been proposed as specific markers of cellular hypertrophy triggered during glial activation (Ercan et al., 2016; Ligneul et al., 2019). Ligneul et al. (2019) used a cytokine ciliary neurotrophic factor-induced mouse model in which only hypertrophic reactive astrocytes were detected, whereas neuronal death and microglia were absent. They evidenced that the diffusivity of mIns was the most sensitive and specific marker of astrocytes morphological modulations in those mice.
Evaluation of Neuromelanin
Neuromelanin is the intracellular pigmentation present in nigral DA neurons. While its accumulation in the SN during aging is normal, it is known that its deposition beyond a certain threshold and its specific degeneration can be a marker of the disease (Vila, 2019; Vila et al., 2019). Imaging methods sensitive to neuromelanin have been developed in humans including first spin echo T1-weighted MRI (Sasaki et al., 2006), and then magnetization transfer MRI after the magnetization transfer effect was found to be responsible for the neuromelanin contrast (Ogisu et al., 2013; Langley et al., 2015). The combination of multicontrast MRI such as SWI and magnetization transfer for iron (found in large amounts in the SNr) and neuromelanin (found in the SNc) detection, respectively, has been used to improve the delineation of the SN structures (Langley et al., 2015). Furthermore, diffusion-based tractography can add critical information on structural connections within the BG to better segregate the SNr from the SNc (Menke et al., 2010).
Multicontrast imaging can more easily be performed in anesthetized animals than in humans as scan time is less limited. In addition, the use of ultrahigh magnetic fields can drastically improve the visualization of the SN through increased signal-to-noise ratio (therefore resolution) and increased contrast, as reviewed in Lehéricy et al. (2014). It is therefore expected that the use of 11.7 T and 17 T scanners in rodents should be highly beneficial for better visualizing the details of the SN anatomy.
While neuromelanin is present in the human SNc, its absence in rodents (Marsden, 1961; Barden and Levine, 1983) prevents any investigation in those models. The group of M. Vila recently developed a rat model in which an adeno-associated viral vector expressing human tyrosinase is stereotaxically injected in the SNc region of their brains. Subsequently, those rats overexpressing human tyrosinase produce neuromelanin in the nigral DA neurons (Carballo-Carbajal et al., 2019). This model opens tremendous opportunities for the development of preclinical neuromelanin imaging strategies.
Conclusion and Discussion
The changes in the MRI and MRS measures in the different rodent models presented are summarized in Table 1. The discrepancies found in the studies can be explained by several factors: the choice of a genetic or toxic model. Genetic models give insights into widespread cerebral alterations, but they lack the neurodegeneration component for most of them, limiting symptomatic evaluations. In toxic models, the injection site can produce different types of degeneration—massive or partial, rapid or progressive—and can have contrasting effects on the MR measures. The anesthesia protocols, isoflurane or medetomidine alone or a combination of both, which have different modes of action, can impact the rs-fMRI output measures (Williams et al., 2010; Schroeter et al., 2014). The detection sensitivity can also be modulated by different magnetic field strengths (from 7 to 11.7 T) and varying spatial resolutions used in those studies. The effect of iron on water diffusivity can also bias the measurements. Indeed, the presence of iron in the brain causes local magnetic field disturbances, which can lead to reduced water diffusivity if measured by imaging sequences sensitive to those local magnetic changes. In addition, it has been shown that the level of signal-to-noise ratio has an impact on anisotropy measurements, leading to overestimated high eigenvalues and underestimated low eigenvalues (Pierpaoli and Basser, 1996; Anderson, 2001). Therefore, one could expect to find higher FA in low-signal and iron-rich structures such as the SN. For example, Xu et al. (2015) showed that iron accumulation correlated with decreased MD and increased FA in the putamen of healthy adults. All of those considerations highlight the fact that the interpretation of diffusivity measures is complex and influenced by various mechanisms, such as iron accumulation in the SN and other regions involved in PD, which further contributes to the discrepancies found in the literature. Multimodal imaging combining susceptibility and diffusion sequences may help disentangle the relationship between iron and water diffusivity and could add valuable insights into human and rodent investigations. For instance, Du et al. (2011) demonstrated improved sensitivity and specificity of combined R2∗ and FA measures over the use of single measures to differentiate PD patients from healthy controls.
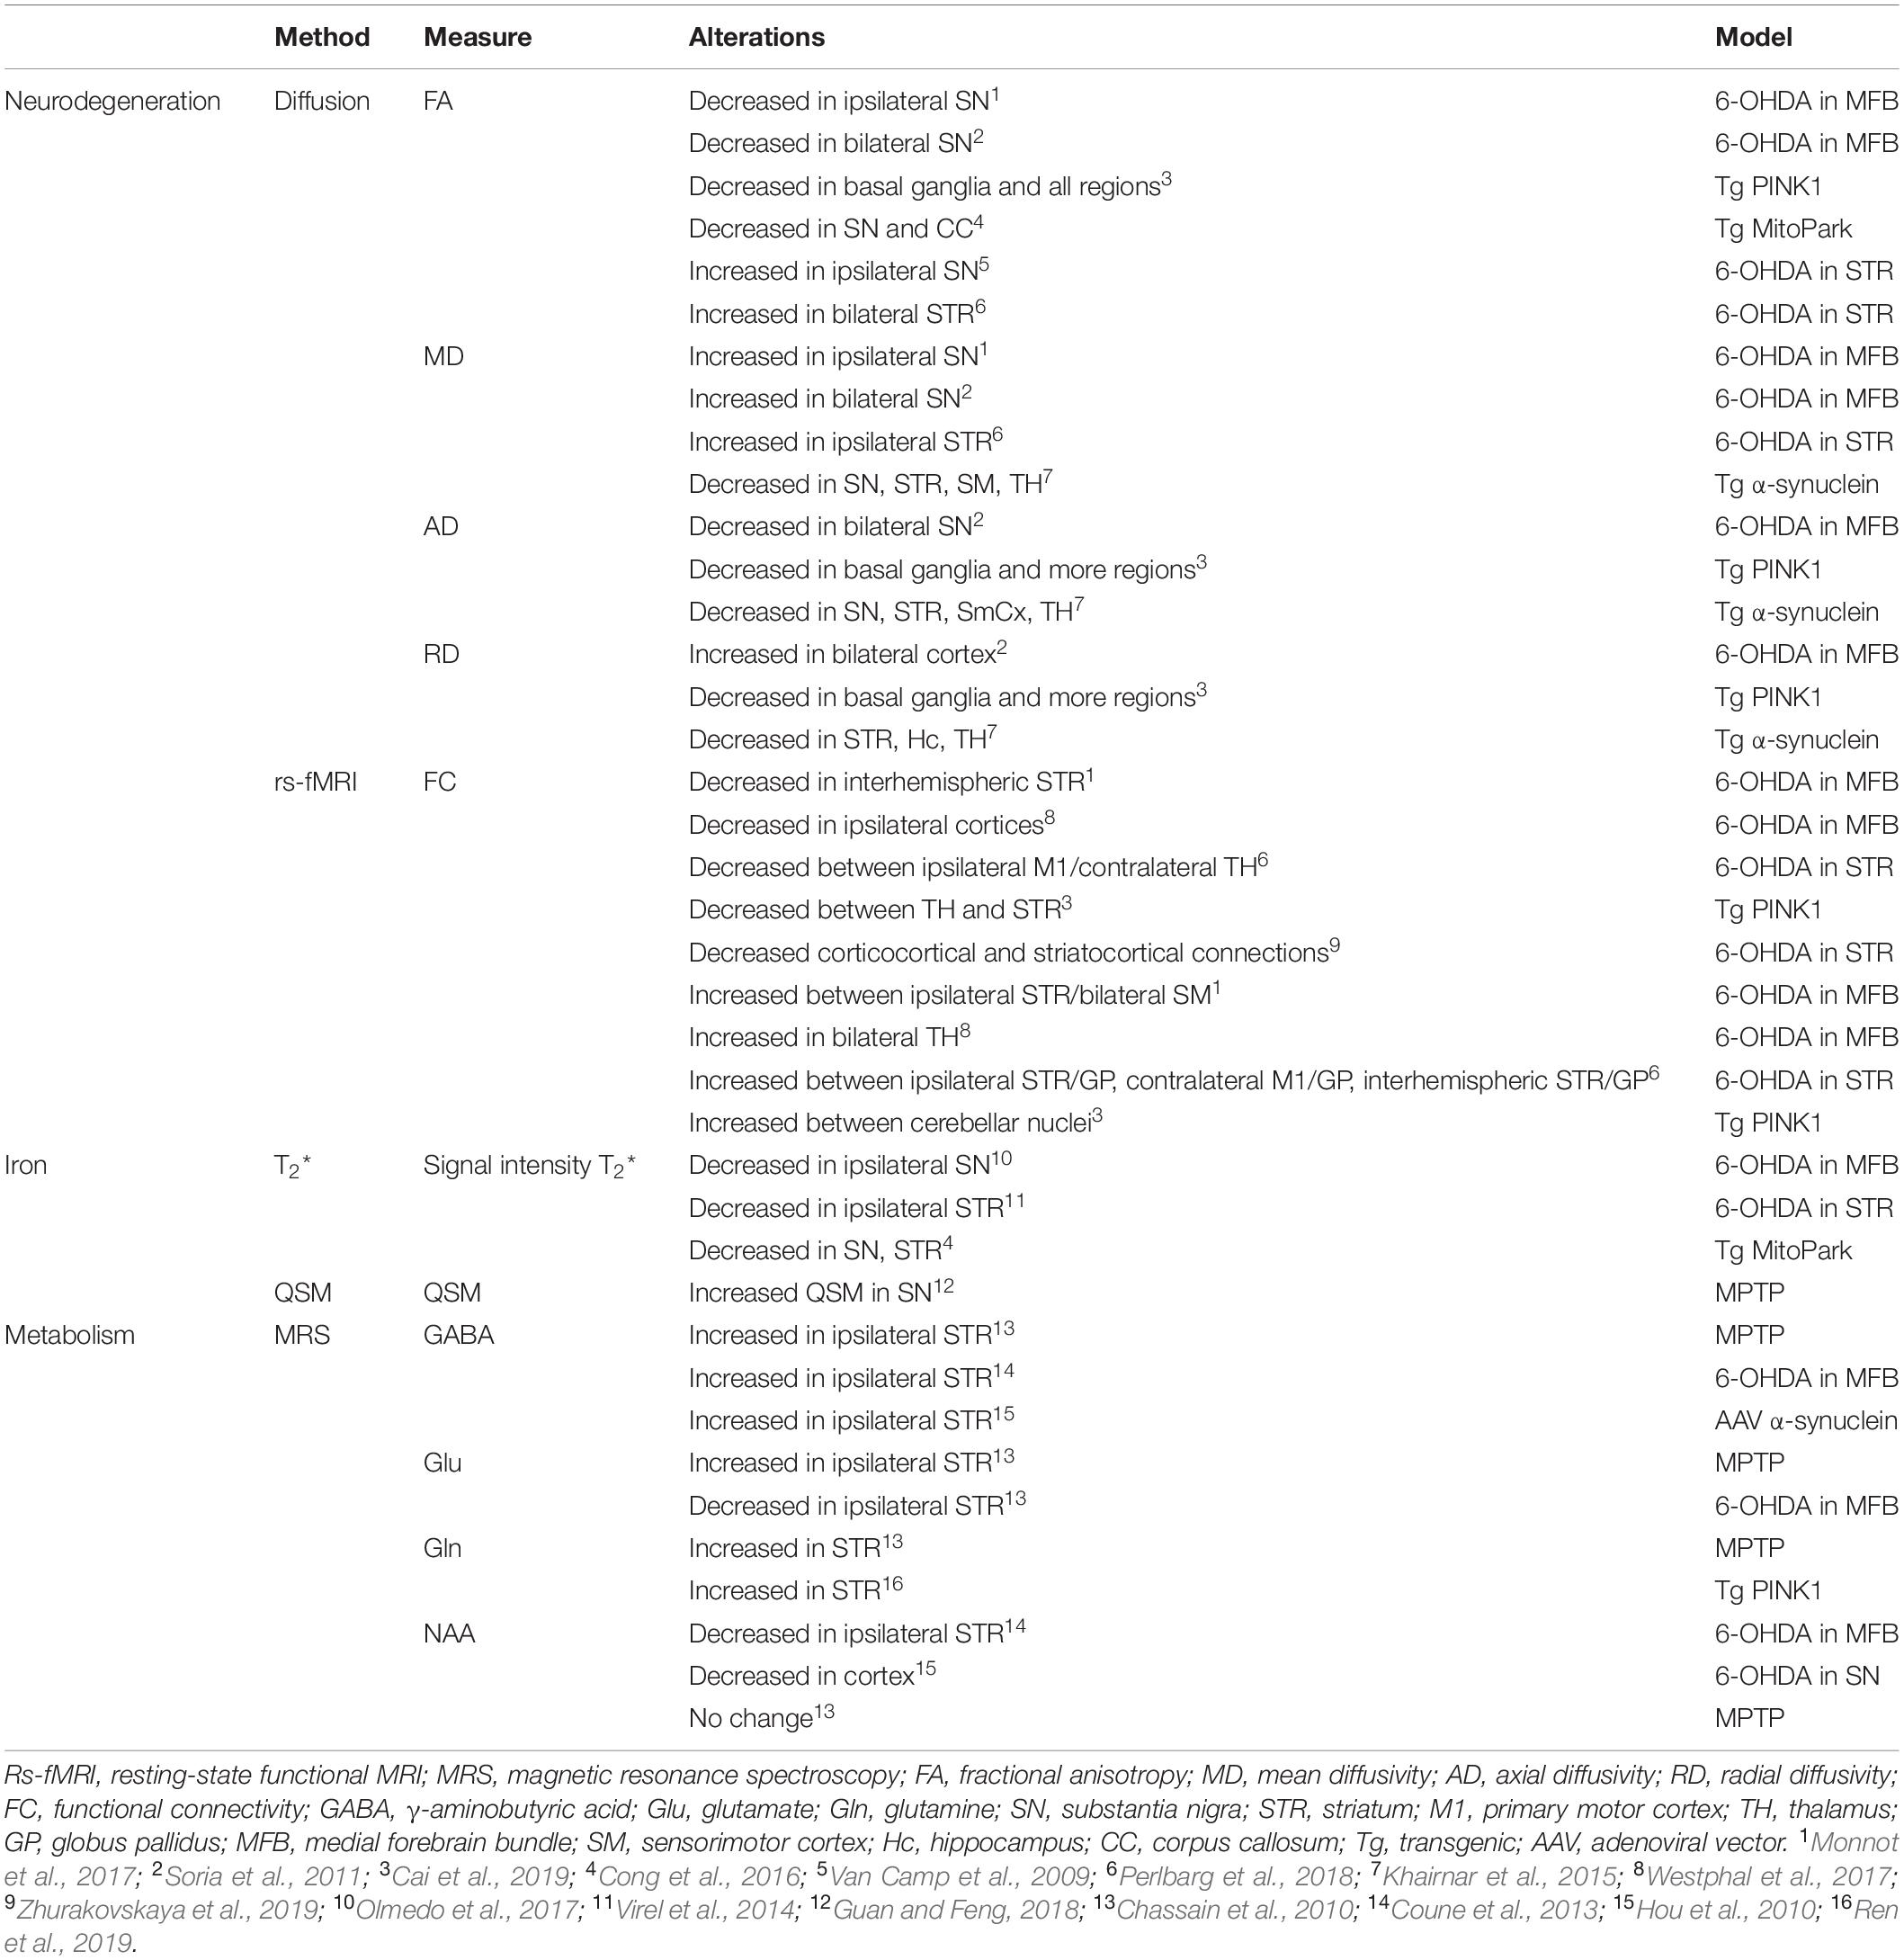
Table 1. Summary of the MRI/MRS measure changes with the corresponding rodent models.
The limited number of MRI studies in genetic models makes the comparison with toxic models difficult. However, it can be highlighted that decreased FA and AD in the SN and increased GABA and Gln in the STR seem to be the most robust measures across toxic and genetic models. Increased MD seems to be measured only in 6-OHDA models, not in genetic models; however, more studies are needed to confirm this trend. Interestingly, decreased FC and increased FC in various brain regions, as well as interhemispheric changes, are common findings in both toxic and genetic models and suggest overall functional reorganizations. Decreased T2∗ signal or value in the SN and STR is also common across studies. Those major findings are illustrated in Figure 4.
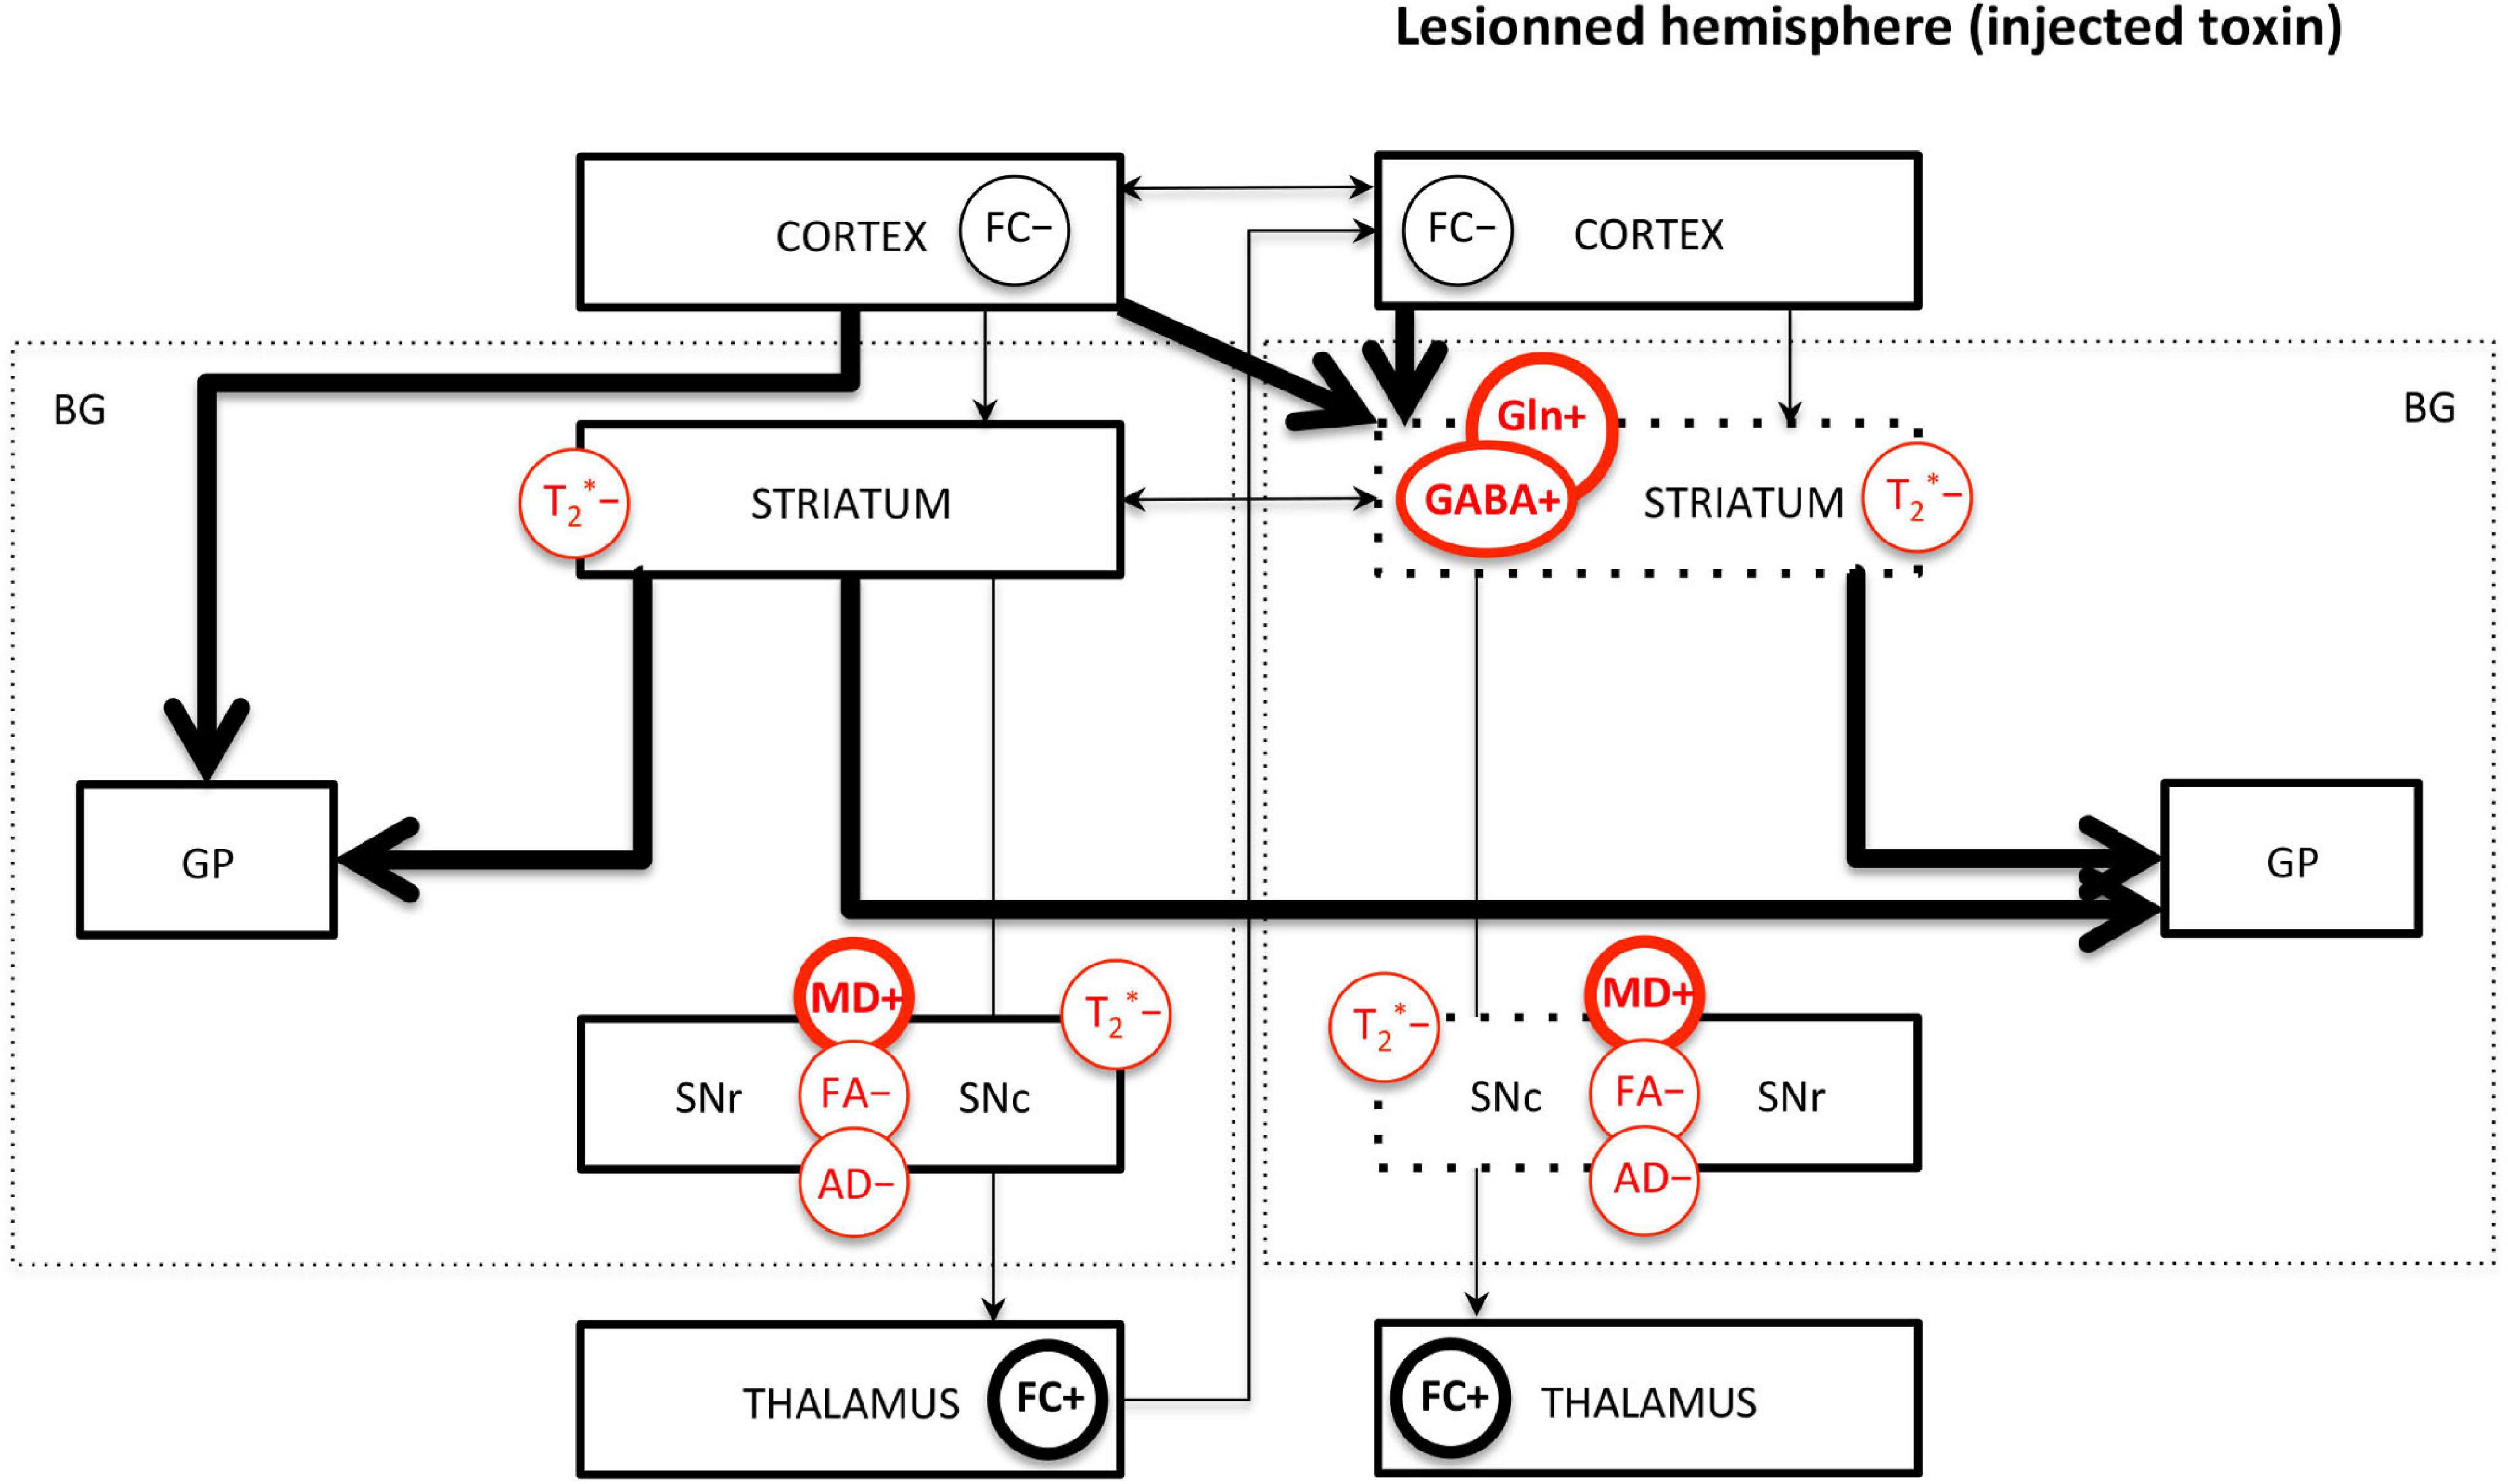
Figure 4. Main MRI/MRS findings in PD rodents affecting the basal ganglia pathways. FC, functional connectivity; MD, mean diffusivity; FA, fractional anisotropy; AD, axial diffusivity; GABA, γ-aminobutyric acid; Gln, glutamine; T2*, effective transverse relaxation time. “+” means increase and “-” means decrease of the MR measure. Measures indicated in red are commonly found across studies. Thick/thin lines represent increased/decreased measure. Arrows represent FC changes between structures. For toxic models, the dotted lines represent the lesioned structures; the left/right side of the figure represents the intact/lesioned hemispheres.
All of those imaging measures provide insight into the physiopathology of PD; however, the animal models used do not replicate the entire complexity of the disease. The results should therefore be interpreted with this knowledge. Toxin-based models have been the most widely used in rodents, especially the 6-OHDA rat model; however, genetic-based models are being increasingly used in neuroimaging studies, especially the α-synuclein mouse and the PINK1 rat models. Gathering more MRI data in various genetic models will help improve our understanding of the role of pathogenic genes in PD. The ideal model should be progressive and age-dependent and include DA depletion together with motor dysfunction as the ones observed in PD patients, as well as inflammation, which is not the case in most models so far. As a consequence, improving animal models is sought after by different groups for either genetic-based rat models (Creed and Goldberg, 2018) or humanized rat models expressing neuromelanin (Carballo-Carbajal et al., 2019).
Ongoing work from various groups aims at improving the specificity of MR-based methods (Petiet et al., 2019). As described above, the diffusivity of mIns as a specific marker of astrogliosis triggers increasing interest for diffusion-weighted MRS developments. Furthermore, this technique has the potential to quantitatively evaluate cell sizes, fiber lengths, and diameters (of either neuronal or glial cells). Indeed, the use of different diffusion time scales allows the quantification of the different parameters governing molecular displacement. Measuring the ADC in the limit of ultrashort diffusion times (<1 ms) allows probing short-range restrictions and cytosol viscosity (Marchadour et al., 2012), whereas measuring ADC in the limit of long diffusion times allows probing long-range restrictions such as cell walls, such that cell geometry and size can be inferred (Najac et al., 2014; Valette et al., 2018). Those technical developments open new fields of investigations in MR-based methods, and they should help better understand the underlying mechanisms.
Author Contributions
AP solely contributed to this review, performed bibliographic searches, elaborated the figures and table and wrote the manuscript.
Funding
The author thanks the “Institut des Neurosciences Translationnelles” ANR-10-IAIHU-06 and “Infrastructure d’Avenir en Biologie Santé” ANR-11-INBS-0006 for their financial support.
Conflict of Interest
The author declares that the research was conducted in the absence of any commercial or financial relationships that could be construed as a potential conflict of interest.
Acknowledgments
The author thanks the Paris Brain Institute “Movement, Investigation and Therapeutics” team for their fruitful discussions on the topic. The author is also grateful to Vincent Perlbarg and Justine Lambert (from the Institut du Cerveau) for their help in the elaboration of Figure 3.
Abbreviations
PD, Parkinson disease; MRI, magnetic resonance imaging; DA, dopamine; LRRK2, leucin-rich repeat kinase 2; SNCA, α-synuclein coding gene; PARK2, Parkin 2; PINK1, phosphatase and tensin (Pten)-induced kinase 1; rs-fMRI, resting-state functional MRI; FC, functional connectivity; R2∗, transverse relaxation rate (1/T2∗); T2∗, transverse relaxation time; MRS, magnetic resonance spectroscopy; 6-OHDA, 6-hydroxydopamine; MPTP, 1-methyl-4-phenyl-1,2,3,6-tetrahydropyridine; BBB, blood–brain barrier; fMRI, functional MRI; BOLD, blood oxygenation level-dependent signal; SWI, susceptibility-weighted imaging; QSM, quantitative susceptibility mapping; LPS, lipopolysaccharide; Tg, transgenic; Glu, glutamate; GABA, γ-aminobutyric acid; NAA, N-acetyl -aspartate; mIns, myo-inositol; Cre, creatine; Gln, glutamine; Cho, choline; MD, mean diffusivity; FA, fractional anisotropy; AD, axial diffusivity; RD, radial diffusivity; ADC, apparent diffusion coefficient; SNc, substantia nigra pars compacta; STR, striatum; GP, globus pallidus; SNr, substantia nigra pars reticulata; TH, thalamus; STN, subthalamic nucleus; MFB, medial forebrain bundle; M1, primary motor cortex; CC, corpus callosum; SM, sensorimotor cortex; Hc, hippocampus; GPi, globus pallidus interna; GPe, globus pallidus externa; BG, basal ganglia; cp, cerebral peduncle.
References
Abeliovich, A., Schmitz, Y., Farinas, I., Choi-Lundberg, D., Ho, W. H., Castillo, P. E., et al. (2000). Mice lacking α-synuclein display functional deficits in the nigrostriatal dopamine system. Neuron 25, 239–252. doi: 10.1016/S0896-6273(00)80886-7
Anderson, A. W. (2001). Theoretical analysis of the effects of noise on diffusion tensor imaging. Magn. Reson. Med. 46, 1174–1188. doi: 10.1002/mrm.1315
Andres-Mateos, E., Perier, C., Zhang, L., Blanchard-Fillion, B., Greco, T. M., Thomas, B., et al. (2007). DJ-1 gene deletion reveals that DJ-1 is an atypical peroxiredoxin-like peroxidase. Proc. Natl. Acad. Sci. U.S.A. 104, 14807–14812. doi: 10.1073/pnas.0703219104
Antonini, A., Leenders, K. L., Meier, D., Oertel, W. H., Boesiger, P., and Anliker, M. (1993). T2 relaxation time in patients with Parkinson’s disease. Neurology 43, 697–700. doi: 10.1212/wnl.43.4.697
Barden, H., and Levine, S. (1983). Histochemical observations on rodent brain melanin. Brain Res. Bull. 10, 847–851. doi: 10.1016/0361-9230(83)90218-6
Barker, P. B., Bizzi, A., De Stefano, N., Gullapalli, R., and Lin, D. D. M. (2010). Clinical MR Spectroscopy: Techniques and Applications. Cambridge: Cambridge University Press.
Batista, C. R. A., Gomes, G. F., Candelario-Jalil, E., Fiebich, B. L., and de Oliveira, A. C. P. (2019). Lipopolysaccharide-induced neuroinflammation as a bridge to understand neurodegeneration. Int. J. Mol. Sci. 20:2293. doi: 10.3390/ijms20092293
Belloli, S., Morari, M., Murtaj, V., Valtorta, S., Moresco, R. M., and Gilardi, M. C. (2020). Tranlation imaging in Parkinson’s disease: focus on neuroinflammation. Front. Aging Neurosci. 12:152. doi: 10.3389/fnagi.2020.00152
Berger, K., Przedborski, S., and Cadet, J. L. (1991). Retrograde degeneration of nigrostriatal neurons induced by intrastriatal 6-hydroxydopamine injection in rats. Brain Res. Bull. 26, 301–307. doi: 10.1016/0361-9230(91)90242-c
Berwick, D. C., Heaton, G. R., Azeggagh, S., and Harvey, K. (2019). LRRK2 Biology from structure to dysfunction: research progresses, but the themes remain the same. Mol. Neurodegener. 14:49.
Biswal, B., Yetkin, F. Z., Haughton, V. M., and Hyde, J. S. (1995). Functional connectivity in the motor cortex of resting human brain using echo-planar MRI. Magn. Reson. Med. 34, 537–541. doi: 10.1002/mrm.1910340409
Blandini, F., and Armentero, M.-T. (2012). Animal models of Parkinson’s disease. FEBS J. 279, 1156–1166. doi: 10.1111/j.1742-4658.2012.08491.x
Braak, H., Ghebremedhin, E., Rub, U., Bratzke, H., and Del Tredici, K. (2004). Stages in the development of Parkinson’s disease-related pathology. Cell Tissue Res. 318, 121–134. doi: 10.1007/s00441-004-0956-9
Cabezudo, D., Baekelandt, V., and Lobbestael, E. (2020). Multiple-hit hypothesis in Parkinson’s disease: LRRK2 and inflammation. Front. Neurosci. 14:376. doi: 10.3389/fnins.2020.00376
Cai, X., Qiao, J., Knox, T., Iriah, S., Kulkarni, P., Madularu, D., et al. (2019). In search of early neuroradiological biomarkers for Parkinson’s disease: alterations in resting state functional connectivity and gray matter microarchitecture in PINK1 -/- rats. Brain Res. 1706, 58–67. doi: 10.1016/j.brainres.2018.10.033
Carballo-Carbajal, I., Laguna, A., Romero-Gimenez, J., Cuadros, T., Bové, J., Martinez-Vicente, M., et al. (2019). Brain tyrosinase overexpression implicates age-dependent neuromelanin production in Parkinson’s disease pathogenesis. Nat. Commun. 10:973. doi: 10.1038/s41467-019-08858-y
Castano, A., Herrera, A. J., Cano, J., and Machado, A. (1998). Lipopolysaccharide intranigral injection induces inflammatory reaction and damage in nigrostriatal dopaminergic system. J. Neurochem. 70, 1584–1592. doi: 10.1046/j.1471-4159.1998.70041584.x
Cerasa, A., Novellino, F., and Quattrone, A. (2016). Connectivity changes in Parkinson’s disease. Curr. Neurol. Neurosci. Rep. 16:91. doi: 10.1007/s11910-016-0687-9
Chabert, S., and Scifo, P. (2007). Diffusion signal in magnetic resonance imaging: origin and interpretation in neurosciences. Biol. Res. 40, 385–400. doi: 10.4067/S0716-97602007000500003
Chassain, C., Bielicki, G., Keller, C., Renou, J. P., and Durif, F. (2010). Metabolic changes detected in vivo by 1H MRS in the MPTP-intoxicated mouse. NMR Biomed. 23, 547–553. doi: 10.1002/nbm.1504
Chesselet, M. F., Fleming, S., Mortazavi, F., and Meurers, B. (2008). Strengths and limitations of genetic mouse models of Parkinson’s disease. Parkinsonism Relat. Disord. 14, S84–S87. doi: 10.1016/j.parkreldis.2008.04.004
Clarke, C., and Lowry, M. (2001). Systematic review of proton magnetic resonance spectroscopy of the striatum in parkinsonian syndromes. Eur. J. Neurol. 8, 573–577. doi: 10.1046/j.1468-1331.2001.00308.x
Cochrane, C. J., and Ebmeier, K. P. (2013). Diffusion tensor imaging in parkinsonian syndromes: a systematic review and meta-analysis. Neurology 80, 857–864. doi: 10.1212/WNL.0b013e318284070c
Cong, L., Muir, E. R., Chen, C., Qian, Y., Liu, J., and Biju, K. C. (2016). Multimodal MRI evaluation of the MitoPark mouse model of Parkinson’s disease. PLoS One 11:e0151884. doi: 10.1371/journal.pone.0151884
Coune, P. G., Craveiro, M., Gaugler, M. N., Mlynarik, V., Schneider, B. L., Aebischer, P., et al. (2013). An in vivo ultrahigh field 14.1T 1H-MRS study on 6-OHDA and α-synuclein-based rat models of Parkinson’s disease: GABA as an early disease marker. NMR Biomed. 26, 43–50. doi: 10.1002/nbm.2817
Creed, R. B., and Goldberg, M. S. (2018). New developments in genetic rat models of Parkinson’s disease. Mov. Dis. 33, 717–729. doi: 10.1002/MDS.27296
Daher, J. P. L., Volpicelli-Daley, L. A., Blackburn, J. P., Moehle, M. S., and West, A. B. (2014). Abrogation of–synuclein-mediated dopaminergic neurodegeneration in LRRK2-deficient rats. Proc. Natl. Acad. Sci. U.S.A. 111, 9289–9294. doi: 10.1073/pnas.1403215111
Dauer, W., and Przedborski, S. (2003). Parkinson’s disease: mechanisms and models. Neuron 39, 889–909. doi: 10.1016/s0896-6273(03)00568-3
Dave, K. D., De Silva, S., Sheth, N. P., Ramboz, S., Beck, M. J., Quang, C., et al. (2014). Phenotypic characterization of recessive gene knockout rat models of Parkinson’s disease. Neurobiol. Dis. 70, 190–203. doi: 10.1016/j.nbd.2014.06.009
Dawson, T. M., Ko, H. S., and Dawson, V. L. (2010). Genetic animal models of Parkinson’s disease. Neuron 66, 646–661. doi: 10.1016/j.neuron.2010.04.034
de Lau, L. M. L., and Breteler, M. M. B. (2006). Epidemiology of Parkinson’s disease. Lancet Neurol. 5, 525–535. doi: 10.1016/S1474-4422(06)70471-9
Delong, M. R. (1990). Primate models of movement disorders of basal ganglia origin. Trends Neurosci. 13, 281–285. doi: 10.1016/0166-2236(90)90110-v
Dexter, D. T., Wells, F. R., Lees, A. J., Agid, F., Agid, Y., Jenner, P., et al. (1989). Increased nigral iron content and alterations in other metal ions occurring in brain in Parkinson’s disease. J. Neurochem. 52, 1830–1836. doi: 10.1111/j.1471-4159.1989.tb07264.x
Du, G., Lewis, M. M., Styner, M., Shaffer, M. L., Sen, S., Yang, Q. X., et al. (2011). Combined R2∗ and diffusion tenser imaging changes in the substantia nigra in Parkinson disease. Mov. Disord. 26, 1627–1632. doi: 10.1002/mds.23643
Ekstrand, M. I., Terzioglu, M., Galter, D., Zhu, S., Hofstetter, C., Lindqvist, E., et al. (2007). Progressive parkinsonism in mice with respiratory-chain-deficient dopamine neurons. Proc. Natl. Acad. Sci. U.S.A. 104, 1325–1330. doi: 10.1073/pnas.0605208103
Emir, U. E., Tuite, P. J., and Öz, G. (2012). Elevated pontine and putamenal GABA levels in mid-moderate Parkinson disease detected by 7 Tesla proton MRS. PLoS One 7:e30918. doi: 10.1371/journal.pone.0030918
Engelborghs, S., Marescau, B., and De Deyn, P. P. (2003). Amino acids and biogenic amines in cere–brospinal fluid of patients with Parkinson’s disease. Neurochem. Res. 28, 1145–1150. doi: 10.1023/a:1024255208563
Ercan, E., Magro-Checa, C., Valabregue, R., Branzoli, F., Wood, E. T., Steup-Beekman, G. M., et al. (2016). Glial and axonal changes in systemic lupus erythematosus measured with diffusion of intracellular metabolites. Brain 139, 1447–1457. doi: 10.1093/brain/aww031
Fleming, S. M., Fernagut, P. O., and Chesselet, M. F. (2005). Genetic mouse models of Parkinsonism: strengths and limitations. NeuroRx 2, 495–503. doi: 10.1602/neurorx.2.3.495
Friston, K. J., Frith, C. D., Liddle, P. F., and Frackowiak, R. S. (1993). Functional connectivity: the principal-component analysis of large (PET) data sets. J. Cereb. Blood Flow Metab. 13, 5–14. doi: 10.1038/jcbfm.1993.4
Gao, H. M., Jiang, J., Wilson, B., Zhang, W., Hong, J. S., and Liu, B. (2002). Microglial activation-mediated delayed and progressive degeneration of rat nigral dopaminergic neurons: relevance to Parkinson’s disease. J. Neurochem. 81, 1285–1297. doi: 10.1046/j.1471-4159.2002.00928.x
Gao, H. M., Zhang, F., Zhou, H., Kam, W., Wilson, B., and Hong, J. S. (2011). Neuroinflammation and alpha-synuclein dysfunction potentiate each other, driving chronic progression of neurodegeneration in a mouse model of Parkinson’s disease. Environ. Health Perspect. 119, 807–814. doi: 10.1289/ehp.1003013
Gardoni, F., and Bellone, C. (2015). Modulation of the glutamatergic transmission by dopamine: a focus on Parkinson, huntington and addiction diseases. Front. Cell. Neurosci. 9:25. doi: 10.3389/fncel.2015.00025
Gautier, C. A., Kitada, T., and Shen, J. (2008). Loss of PINK1 causes mitochon- drial functional defects and increased sensitivity to oxidative stress. Proc. Natl. Acad. Sci. U.S.A. 105, 11364–11369. doi: 10.1073/pnas.0802076105
Gerfen, C. R. (1992). The neostriatal mosaic: multiple levels of compartmental organization. Trends Neurosci. 15, 133–139. doi: 10.1016/0166-2236(92)90355-c
Giovanni, A., Sieber, B. A., Heikkila, R. E., and Sonsalla, P. K. (1994). Studies on species sensitivity to the dopaminergic neurotoxin 1-methyl-4- phenyl-1,2,3,6-tetrahydropyridine. part 1: systemic administration. J. Pharmacol. Exp. Therap. 270, 1000–1007.
Gispert, S., Ricciardi, F., Kurz, A., Azizov, M., Hoepken, H. H., Becker, D., et al. (2009). Parkinson phenotype in aged PINK1-deficient mice is accompanied by progressive mitochondrial dysfunction in absence of neurodegeneration. PLoS One 4:e5777. doi: 10.1371/journal.pone.0005777
Glass, C. K., Saijo, K., Winner, B., Marchetto, M. C., and Gage, F. H. (2010). Mechanisms underlying inflammation in neurodegeneration. Cell 140, 918–934. doi: 10.1016/j.cell.2010.02.016
Goldberg, M. S., Pisani, A., Haburcak, M., Vortherms, T. A., Kitada, T., Costa, C., et al. (2005). Nigrostriatal dopaminergic deficits and hypokinesia caused by inactivation of the familial Parkinsonism-linked gene DJ-1. Neuron 45, 489–496. doi: 10.1016/j.neuron.2005.01.041
Graff-Radford, J., Boeve, B. F., Murray, M., Ferman, T. J., Tosakulwong, N., Lesnick, T. G., et al. (2014). Regional proton magnetic resonance spectroscopy patterns in dementia with Lewy bodies. Neurobiol. Aging 35, 1483–1490. doi: 10.1016/j.neurobiolaging.2014.01.001
Gröger, A., Kolb, R. K., Schäfer, R., and Klose, U. (2014). Dopamine reduction in the substantia nigra of Parkinson’s disease patients confirmed by in vivo magnetic resonance spectroscopic imaging. PLoS One 9:e84081. doi: 10.1371/journal.pone.0084081
Guan, J.-J., and Feng, Y.-Q. (2018). Quantitative magnetic resonance imaging of brain iron deposition: comparison between quantitative susceptibility mapping and transverse relaxation rate (R2∗) mapping. Nan Fang Yi Ke Da Xue Xue Bao 38, 305–311. doi: 10.3969/j.issn.1673-4254.2018.03.10
Guan, X., Xuan, M., Gu, Q., Huang, P., Liu, C., Wang, N., et al. (2016). Regionally progressive accumulation of iron in Parkinson’s disease as measured by quantitative susceptibility map- ping. NMR Biomed. 30:e3489. doi: 10.1002/nbm.3489
Haacke, E. M., Liu, S., Buch, S., Zheng, W., Wu, D., and Ye, Y. (2015). Quantitative susceptibility mapping: current status and future directions. Magn. Res. Im. 33, 1–25. doi: 10.1016/j.mri.2014.09.004
Haacke, E. M., Xu, Y., Cheng, Y. C., and Reichenbach, J. R. (2004). Susceptibility weighted imaging (SWI). Magn. Reson. Med. 52, 612–618. doi: 10.1002/mrm.20198
Hansen, S. H., Andersen, M. L., Cornett, C., Gradinaru, R., and Grunnet, N. (2010). A role for taurine in mitochondrial function. J. Biomed. Sci. 17(Suppl 1):S23.
Hare, D., Reedy, B., Grimm, R., Wilkins, S., Volitakis, I., George, J. L., et al. (2009). Quantitative elemental bio-imaging of Mn, Fe, Cu and Zn in 6-hydroxydopamine induced Parkinsonism mouse models. Metallomics 1, 53–58. doi: 10.1039/B816188G
Helmich, R. C., Derikx, L. C., Bakker, M., Scheeringa, R., Bloem, B. R., and Toni, I. (2010). Spatial remapping of cortico- striatal connectivity in Parkinson’s disease. Cereb. Cortex 20, 1175–1186. doi: 10.1093/cercor/bhp178
Herrera, A. J., Castano, A., Venero, J. L., Cano, J., and Machado, A. (2000). The single intranigral injection of LPS as a new model for studying the selective effects of inflammatory reactions on dopaminergic system. Neurobiol. Dis. 7, 429–447. doi: 10.1006/nbdi.2000.0289
Hirsch, E. C., Brandel, J. P., Galle, P., Javoy-Agid, F., and Agid, Y. (1991). Iron and aluminum increase in the substantia nigra of patients with Parkinson’s disease: an X-ray microanalysis. J. Neurochem. 56, 446–451. doi: 10.1111/j.1471-4159.1991.tb08170.x
Honey, C. J., Sporns, O., Cammoun, L., Gigandet, X., Thiran, J. P., Meuli, R., et al. (2009). Predicting human resting-state functional connectivity from structural connectivity. Proc. Natl. Acad. Sci. U.S.A. 106, 2035–2040. doi: 10.1073/pnas.0811168106
Honey, G. D., Suckling, J., Zelaya, F., Long, C., Routledge, C., Jackson, S., et al. (2003). Dopaminergic drug effects on physiological connectivity in a human corticostriato-thalamic system. Brain 126, 1767–1781. doi: 10.1093/brain/awg184
Hopes, L., Grolez, G., Moreau, C., Lopes, R., Ryckewaert, G., Carrière, N., et al. (2016). Magnetic resonance imaging features of the nigrostriatal system: biomarker of Parkinson’s disease stages? PLoS One 11:e0147947. doi: 10.1371/journal.pone.0147947
Hou, Z., Lei, H., Hong, S., Sun, B., Fang, K., Lin, X., et al. (2010). Functional changes in the frontal cortex in Parkinson’s disease using a rat model. J. Clin. Neurosci. 17, 628–633. doi: 10.1016/j.jocn.2009.07.101
Hunter, R., Ojha, U., Bhurtel, S., Bing, G., and Choi, D. Y. (2017). Lipopolysaccharide-induced functional and structural injury of the mitochondria in the nigrostriatal pathway. Neurosci. Res. 114, 62–69. doi: 10.1016/j.neures.2016.09.007
Hunter, R. L., Choi, D. Y., Ross, S. A., and Bing, G. (2008). Protective properties afforded by pioglitazone against intrastriatal LPS in Sprague-Dawley rats. Neurosci. Lett. 432, 198–201. doi: 10.1016/j.neulet.2007.12.019
Jackson-Lewis, V., Jakowec, M., Burke, R. E., and Przedborski, S. (1995). Time course and morphology of dopaminergic neuronal death caused by the neurotoxin 1-methyl-4-phenyl-1,2,3,6- tetrahydropyridine. Neurodegeneration 4, 257–269. doi: 10.1016/1055-8330(95)90015-2
Jagmag, S. A., Tripathi, N., Shukla, S. D., Maiti, S., and Khurana, S. (2016). evaluation of models of Parkinson’s disease. Front. Neurosci. 9:503. doi: 10.3389/fnins.2015.00503
Jiang, H., Song, N., Xu, H., Zhang, S., Wang, J., and Xie, J. (2010). Up-regulation of divalent metal transporter 1 in 6-hydroxydopamine intoxication is IRE/IRP dependent. Cell Res. 20, 345–356. doi: 10.1038/cr.2010.20
Jin, L., Wang, J., Zhao, L., Jin, H., Fei, G., Zhang, Y., et al. (2011). Decreased serum ceruloplasmin levels characteristically ag- gravate nigral iron deposition in Parkinson’s disease. Brain 134, 50–58. doi: 10.1093/brain/awq319
Jonsson, G. (1980). Chemical neurotoxins as denervation tools in neuro- biology. Annu. Rev. Neurosci. 3, 169–187. doi: 10.1146/annurev.ne.03.030180.001125
Kahle, P. J., Haass, C., Kretzschmar, H. A., and Neumann, M. (2002). Structure/function of alpha-synuclein in health and disease: rational development of animal models for Parkinson’s and related diseases. J. Neurochem. 82, 449–457. doi: 10.1046/j.1471-4159.2002.01020.x
Khairnar, A., Latta, P., Drazanova, E., Ruda-Kucerova, J., Szabo, N., Arab, A., et al. (2015). Diffusion kurtosis imaging detects microstructural alterations in brain of α-synuclein overexpressing transgenic mouse model of Parkinson’s disease: a pilot study. Neurotox. Res. 28, 281–289. doi: 10.1007/s12640-015-9537-9
Kim, R. H., Smith, P. D., Aleyasin, H., Hayley, S., Mount, M. P., Pownall, S., et al. (2005). Hypersensitivity of DJ-1-deficient mice to 1-methyl-4-phenyl-1,2,3,6-tetrahydropyrindine (MPTP) and oxidative stress. Proc. Natl. Acad. Sci. U.S.A. 102, 5215–5220. doi: 10.1073/pnas.0501282102
Kitada, T., Pisani, A., Porter, D. R., Yamaguchi, H., Tscherter, A., Martella, G., et al. (2007). Impaired dopamine release and synaptic plasticity in the striatum of PINK1-deficient mice. Proc. Natl. Acad. Sci. U.S.A. 104, 11441–11446. doi: 10.1073/pnas.0702717104
Klein, C., and Westenberger, A. (2012). Genetics of Parkinson’s disease. Cold Spring Harb. Perspect. Med. 2:a008888. doi: 10.1101/cshperspect.a008888
Konnova, E. A., and Swanberg, M. (2018). “Animal models of Parkinson’s disease,” in Parkinson’s Disease: Pathogenesis and Clinical Aspects, (Brisbane: Codon Publications), doi: 10.15586/codonpublications.parkinsonsdisease.2018.ch5
Lanciego, J. L., Luquin, N., and Obeso, J. A. (2012). Functional neuroanatomy of the basal ganglia. Cold Spring Harb. Perspect. Med. 2:a009621. doi: 10.1101/cshperspect.a009621
Langley, J., Huddleston, D. E., Chen, X., Sedlacik, J., Zachariah, N., and Hu, X. (2015). A multicontrast approach for comprehensive imaging of substantia nigra. Neuroimage 15, 7–13. doi: 10.1016/j.neuroimage.2015.02.045
Langston, J. W., Ballard, P., Tetrud, J. W., and Irwin, I. (1983). Chronic Parkinsonism in humans due to a product of meperidine-analog synthesis. Science 219, 979–980. doi: 10.1126/science.6823561
Le Bihan, D. (2003). Looking into the functional architecture of the brain with diffusion MRI. Nat. Rev. 4, 469–480. doi: 10.1038/nrn1119
Lee, J. W., Tapias, V., Di Maio, R., Greenamyre, J. T., and Cannon, J. R. (2015). Behavioral, neurochemical, and pathologic alterations in bacterial artificial chromosome transgenic G2019S leucine-rich repeated kinase 2 rats. Neurobiol. Aging 36, 505–518. doi: 10.1016/j.neurobiolaging.2014.07.011
Lehéricy, S., Bardinet, E., Poupon, C., Vidailhet, M., and François, C. (2014). 7 Tesla magnetic resonance imaging: a closer look at substantia nigra anatomy in Parkinson’s disease. Mov. Disord. 29, 1574–1581. doi: 10.1002/mds.26043
Lehéricy, S., Sharman, M. A., Longo Dos Santos, C., Paquin, R., and Galléa, C. (2012). Magnetic resonance imaging of the substantia nigra in Parkinson’s disease. Mov Disord. 27, 822–830. doi: 10.1002/mds.25015
Levin, B. E., Katzen, H. L., Maudsley, A., Post, J., Myerson, C., Govind, V., et al. (2012). Whole-brain proton MR spectroscopic imaging in Parkinson’s disease. J. Neuroimaging 24, 39–44. doi: 10.1111/j.1552-6569.2012.00733.x
Li, Y., Liu, W., Oo, T. F., Wang, L., Tang, Y., Jackson-Lewis, V., et al. (2009). Mutant LRRK2(R1441G) BAC transgenic mice recapitulate cardinal features of Parkinson’s disease. Nat. Neurosci. 12, 826–828. doi: 10.1038/nn.2349
Ligneul, C., Palombo, M., Hernandez-Garzon, E., Carrillo-de-Sauvage, M. A., Flament, J., Hantraye, P., et al. (2019). Diffusion-weighted magnetic resonance spectroscopy enables cell-specific monitoring of astrocyte reactivity in vivo. Neuroimage 191, 457–469. doi: 10.1016/j.neuroimage.2019.02.046
Liu, T., Eskreis-Winkler, S., Schweitzer, A. D., Chen, W., Kaplitt, M. G., Tsiouris, A. J., et al. (2013). Improved subthalamic nucleus depiction with quantitative susceptibility mapping. Radiology 269, 216–223. doi: 10.1148/radiol.13121991
Lotfipour, A. K., Wharton, S., Schwarz, S. T., Gontu, V., Schäfer, A., Peters, A. M., et al. (2012). High resolution magnetic susceptibility mapping of the substantia nigra in Parkinson’s disease. J. Magn. Reson. Imaging 35, 48–55. doi: 10.1002/jmri.22752
Lu, X.-H., Fleming, S. M., Meurers, B., Ackerson, L. C., Mortazavi, F., Lo, V., et al. (2009). Bacterial artificial chromosome transgenic mice expressing a truncated mutant parkin exhibit age-dependent hypokinetic motor deficits, dopaminergic neuron degeneration, and accumulation of proteinase K-Resistant –Synuclein. J. Neurosci. 29, 1962–1976. doi: 10.1523/jneurosci.5351-08.2009
Lv, Z., Jiang, H., Xu, H., Song, N., and Xie, J. (2011). Increased iron levels correlate with the selective nigral dopaminergic neuron degeneration in Parkinson’s disease. J. Neural Transm. 118, 361–369. doi: 10.1007/s00702-010-0434-3
Marchadour, C., Brouillet, E., Hantraye, P., Lebon, V., and Valette, J. (2012). Anomalous diffusion of brain metabolites evidenced by diffusion-weighted magnetic resonance spectroscopy in vivo. J. Cereb. Blood Flow Metab. 32:2160. doi: 10.1038/jcbfm.2012.119
Maroteaux, L., Campanelli, J., and Scheller, R. (1988). Synuclein: a neuron-specific protein localized to the nucleus and presynaptic nerve terminal. J. Neurosci. 8, 2804–2815. doi: 10.1523/jneurosci.08-08-02804.1988
Marsden, C. D. (1961). Pigmentation in the nucleus substantiae nigrae of mammals. J. Anat. 95, 256–261.
Menke, R. A., Jbabdi, S., Miller, K. L., Matthews, P. M., and Zarei, M. (2010). Connectivity-based segmentation of the substantia nigra in human and its implications in Parkinson’s disease. NeuroImage 52, 1175–1180. doi: 10.1016/j.neuroimage.2010.05.086
Monnot, C., Zhang, X., Nikkhou-Aski, S., Damberg, P., and Svenningsson, P. (2017). Asymmetric dopaminergic degeneration and levodopa alter functional corticostriatal connectivity bilaterally in experimantal parkinsonism. Exp. Neurol. 292, 11–20. doi: 10.1016/j.expneurol.2017.02.014
Mori, S., Fujitake, J., Kuno, S., and Sano, Y. (1988). Immunohistochemical evaluation of the neurotoxic effect of 1-methyl-4-phenyl-1,2,3,6-tetrahydropyridine (MPTP) on dopaminergic nigrostriatal neurons of young adult mice using dopamine and tyrosine hydroxylase antibodies. Neurosci. Lett. 90, 57–62. doi: 10.1016/0304-3940(88)90786-0
Najac, C., Marchadour, C., Guillermier, M., Houitte, D., Slavov, V., Brouillet, E., et al. (2014). Intracellular metabolites in the primate brain are primarily localized in long fibers rather than in cell bodies, as shown by diffusion-weighted magnetic resonance spectroscopy. Neuroimage 90, 374–380. doi: 10.1016/j.neuroimage.2013.12.045
Ogisu, K., Kudo, K., Sasaki, M., Sakushima, K., Yabe, I., Sasaki, H., et al. (2013). 3D neuromelanin-sensitive magnetic resonance imaging with semi-automated volume measurement of the substantia nigra pars compacta for diagnosis of Parkinson’s disease. Neuroradiology 55, 719–724. doi: 10.1007/s00234-013-1171-8
Olmedo, A., Estevez-Silva, H., Orädd, G., Bjerken, S., Marcellino, D., and Virel, A. (2017). An altered blood-brain barrier contributes to brain iron accumulation and neuroinflammation in the 6-OHDA rat model of Parkinson’s disease. Neuroscience 362, 141–151. doi: 10.1016/j.neuroscience.2017.08.023
Ostrerova-Golts, N., Petrucelli, L., Hardy, J., Lee, J. M., Farer, M., and Wolozin, B. (2000). The A53T α-synuclein mutation increases iron-dependent aggregation and toxicity. J. Neurosci. 20, 6048–6054. doi: 10.1523/jneurosci.20-16-060 48.2000
Öz, G., Alger, J. R., Barker, P. B., Bartha, R., Bizzi, A., Boesh, C., et al. (2014). Clinical proton MR spectroscopy in central nervous system disorders. Radiology 270, 658–679. doi: 10.1148/radiol.13130531
Öz, G., Terpstra, M., Tkac, I., Aia, P., Lowary, J., Tuite, P., et al. (2006). Proton MRS of the unilateral substantia nigra in the human brain at 4 tesla: detection of high GABA concentrations. Magn. Reson. Med. 55, 296–301. doi: 10.1002/mrm.20761
Palombo, M., Shemesh, N., Ronen, I., and Valette, J. (2018). Insights into brain microstructure from in vivo DW-MRS. Neuroimage 182, 97–116. doi: 10.1016/j.neuroimage.2017.11.028
Park, B. S., and Lee, J. O. (2013). Recognition of lipopolysaccharide pattern by TLR4 complexes. Exp. Mol. Med. 45:e66. doi: 10.1038/emm.2013.97
Perez, F. A., and Palmiter, R. D. (2005). Parkin-deficient mice are not a robust model of parkinsonism. Proc. Nat. Acad. Sci. U.S A. 102, 2174–2179. doi: 10.1073/pnas.0409598102
Perlbarg, V., Lambert, J., Butler, B., Felfli, M., Valabrègue, R., Privat, A.-L., et al. (2018). Alterations of the nigrostriatal pathway in a 6-OHDA rat model of Parkinson’s disease evaluated with multimodal MRI. PlosOne 13:e0202597. doi: 10.1371/journal.pone.0202597
Petiet, A., Adanyeguh, I., Aigrot, M.-S., Poirion, E., Nait-Oumesmar, B., Santin, M., et al. (2019). Ultrahigh field imaging of myelin disease models: toward specific markers of myelin integrity? J. Comp. Neurol. 527, 2179–2189. doi: 10.1002/cne.24598
Pienaar, I. S., Götz, J., and Feany, M. B. (2010). Parkinson’s disease: insights from non-traditional model organisms. Prog. Neurobiol. 92, 558–571. doi: 10.1016/j.pneurobio.2010.09.001
Pierpaoli, C., and Basser, P. J. (1996). Toward a quantitative assessment of diffusion anisotropy. Magn. Reson. Med. 36, 893–906. doi: 10.1002/mrm.1910360612
Pietracupa, S., Martin-Bastida, A., and Piccini, P. (2017). Iron metabolism and its detection through MRI in parkinsonian disorders: a systemic review. Neurol. Sci. 38, 2095–2101. doi: 10.1007/s10072-017-3099-y
Przedborski, S., Levivier, M., Jiang, H., Ferreira, M., Jackson-Lewis, V., Donaldson, D., et al. (1995). Dose-dependent lesions of the dopaminergic nigrostriatal pathway induced by intrastriatal injection of 6-hydroxydopamine. Neuroscience 67, 631–647. doi: 10.1016/0306-4522(95)00066-r
Qin, L., Wu, X., Block, M. L., Liu, Y., Breese, G. R., Hong, J. S., et al. (2007). Systemic LPS causes chronic neuroinflammation and progressive neurodegeneration. Glia 55, 453–462. doi: 10.1002/glia.20467
Ransohoff, R. M. (2016). How neuroinflammation contributes to neurodegeneration. Science 353, 777–783. doi: 10.1126/science.aag2590
Redgrave, P., Rodriguez, M., Smith, Y., Rodriguez-Oroz, M. C., Lehéricy, S., Bergman, H., et al. (2010). Goal-directed and habitual control in the basal ganglia: implications for parkinson’s disease. Nat. Rev. Neurosci. 11, 760–772. doi: 10.1038/nrn2915
Ren, X., Hinchie, A., Swomley, A., Powell, D. K., and Butterfield, D. A. (2019). Profiles of brain oxidative damage, ventricular alterations, and neurochemical metabolites in the striatum of PINK1 knockout rats as functions of age and gender: relevance to Parkinson disease. Free Radic. Biol. Med. 143, 146–152. doi: 10.1016/j.freeradbiomed.2019.08.008
Rolheiser, T. M., Fulton, H. G., Good, K. P., Fisk, J. D., McKelvey, J. R., Scherfler, C., et al. (2011). Diffusion tensor imaging and olfactory identification testing in early-stage Parkinson’s disease. J. Neurol. 258, 1254–1260. doi: 10.1007/s00415-011-5915-2
Sasaki, M., Shibata, E., Tohyama, K., Junko, T., Otsuka, K., Tsuchiya, K., et al. (2006). Neuromelanin magnetic resonance imaging of locus ceruleus and substantia nigra in Parkinson’s disease. Neuroreport 17, 1215–1218. doi: 10.1097/01.wnr.0000227984.84927.a7
Schroeter, A., Schlegel, F., Seuwen, A., Grandjean, J., and Rudin, M. (2014). Specificity of stimulus-evoked fMRI responses in the mouse: the influence of systemic physiological changes associated with innocuous stimulation under four different anesthetics. Neuroimage 94, 372–384. doi: 10.1016/j.neuroimage.2014.01.046
Schwarz, S. T., Abaei, M., Gontu, V., Morgan, P. S., Bajaj, N., and Auer, D. P. (2013). Diffusion tensor imaging of nigral degeneration in Parkinson’s disease: a region-of-interest and voxel- based study at 3 T and systematic review with meta-analysis. Neuroimage Clin. 3, 481–488. doi: 10.1016/j.nicl.2013.10.006
Schwarz, S. T., Afzal, M., Morgan, P. S., Bajaj, N., Gowland, P. A., and Auer, D. P. (2014). The ‘swallow tail’ appearance of the healthy nigrosome–a new accurate test of Parkinson’s disease: a case control and retrospective cross-sectional MRI study at 3T. PLoS One 9:e93814. doi: 10.1371/journal.pone.0093814
Shaikh, K. T., Yang, A., Youshin, E., and Schmid, S. (2015). Transgenic LRRK2R1441G rats-a model for Parkinson disease? PeerJ 3:e945. doi: 10.7717/peerj.945
Sharman, M., Valabregue, R., Perlbarg, V., Vidailhet, M., Benali, H., Brice, A., et al. (2012). Parkinson’s disease patients show reduced cortical-subcortical sensorimotor connectivity. Mov. Disord. 28, 447–454. doi: 10.1002/mds.25255
Shimohama, S., Sawada, H., Kitamura, Y., and Taniguchi, T. (2003). Disease model: Parkinson’s disease. Trends Mol. Med. 9, 360–365. doi: 10.1016/s1471-4914(03)00117-5
Skorpil, M., Söderlund, V., Sundin, A., and Svenningsson, P. (2012). MRI diffusion in Parkinson’s disease: using the technique’s inherent directional information to study the olfactory bulb and substantia nigra. J. Parkinsons. Dis. 2, 171–180. doi: 10.3233/JPD-2012-12091
Sloan, M., Alegre-Abarrategui, J., Potgieter, D., Kaufmann, A. K., Exley, R., Deltheil, T., et al. (2016). LRRK2 BAC transgenic rats develop progressive, L-DOPA-responsive motor impairment, and deficits in dopamine circuit function. Hum. Mol. Genet. 25, 951–963. doi: 10.1093/hmg/ddv628
Sofroniew, M. V. (2015). Astrocyte barriers to neurotoxic inflammation. Nat. Rev. Neurosci. 16, 249–263. doi: 10.1038/nrn3898
Song, S. K., Yoshino, J., Le, T. Q., Lin, S. J., Sun, S. W., Cross, A. H., et al. (2005). Demyelination increases radial diffusivity in corpus callosum of mouse brain. Neuroimage 26, 132–140. doi: 10.1016/j.neuroimage.2005.01.028
Soria, G., Aguilar, E., Tudela, R., Mullol, J., Planas, A. M., and Marin, C. (2011). In vivo magnetic resonance imaging characterization of bilateral structural changes in experimental Parkinson’s disease: a T2 relaxometry study combined with longitudinal diffusion tensor imaging and manganese-enhanced magnetic resonance imaging in the 6-hydroxydopamine rat model. Eur. J. Neurosci. 33, 1551–1560. doi: 10.1111/j.1460-9568.2011.07639.x
Tansey, M. G., and Goldberg, M. S. (2010). Neuroinflammation in Parkinson’s disease: its role in neuronal death and implications for therapeutic intervention. Neurobiol. Dis. 37, 510–518. doi: 10.1016/j.nbd.2009.11.004
Tatton, N. A., and Kish, S. J. (1997). In situ detection of apoptotic nuclei in the substantia nigra compacta of 1-methyl-4-phenyl- 1,2,3,6-tetrahydropyridine-treated mice using terminal deoxynucleotidyl transferase labelling and acridine orange staining. Neuroscience 77, 1037–1048. doi: 10.1016/s0306-4522(96)00545-3
Thoenen, H., and Tranzer, J. P. (1968). Chemical sympathectomy by selective destruction of adrenergic nerve endings with 6- hydroxydopamine. Naunyn Shmiedebergs Arch. Exp. Pathol. Pharmakol. 26, 271–288. doi: 10.1007/BF00536990
Thomas, B., and Beal, M. F. (2007). Parkinson’s disease. Hum. Mol. Genet. 16, R183–R194. doi: 10.1093/hmg/ddm159
Tuovinen, N., Seppi, K., de Pasquale, F., Muller, C., Nocker, M., Schocke, M., et al. (2018). The reorganization of functional architecture in the early-stages of Parkinson’s disease. Parkinsonism Relat. Disord. 50, 61–68. doi: 10.1016/j.parkreldis.2018.02.013
Ulla, M., Bonny, J. M., Ouchchane, L., Rieu, I., Claise, B., and Durif, F. (2013). Is R2∗ a new MRI biomarker for the progression of Parkinson’s disease? A longitudinal follow-up. PLoS One 8:e57904. doi: 10.1371/journal.pone.0057904
Ungerstedt, U. (1968). 6-Hydroxy-dopamine induced degeneration of central monoamine neurons. Eur. J. Pharmacol. 5, 107–110. doi: 10.1016/0014-2999(68)90164-7
Vaillancourt, D. E., Spraker, M. B., Prodoehl, J., Abraham, I., Corcos, D. M., Zhou, X. J., et al. (2009). High-resolution diffusion tensor imaging in the substantia nigra of de novo Parkinson disease. Neurology 72, 1378–1384. doi: 10.1212/01.wnl.0000340982.01727.6e
Valette, J., Ligneul, C., Marchadour, C., Najac, C., and Palombo, M. (2018). Brain metabolite diffusion from ultra-short to ultra-long time scales: what do we learn, where should we go? Front. Neurosci. 12:2. doi: 10.3389/fnins.2018.00002
Van Camp, N., Blockx, I., Verhoye, M., Casteels, C., Coun, F., Leemans, A., et al. (2009). Diffusion tensor imaging in a rat model of Parkinson’s disease after lesioning of the nigrostriatal tract. NMR Biomed. 22, 697–706. doi: 10.1002/nbm.1381
Van Rompuy, A.-S., Lobbestael, E., Van der Perren, A., Van den Haute, C., and Baekelandt, V. (2014). Long-term overexpression of human wild-type and T240R mutant Parkin in rat substantia nigra induces progressive dopaminergic neurodegeneration. J. Neuropathol. Exp. Neurol. 73, 159–174. doi: 10.1097/nen.0000000000000039
Vila, M. (2019). Neuromelanin, aging, and neuronal vulnerability in Parkinson’s disease. Mov. Dis. 34, 1440–1451. doi: 10.1002/mds.27776
Vila, M., Laguna, A., and Carballo-Carbajal, I. (2019). Intracellular crowding by age-dependent neuromelanin accumulation disrupts neuronal proteostasis and triggers Parkinson disease pathology. Autophagy 15, 2028–2030. doi: 10.1080/15548627.2019.1659621
Villeneuve, L. M., Purnell, P. R., Boska, M. D., and Fox, H. S. (2016). Early expression of parkinson’s disease-related mitochondrial abnormalities in PINK1 knockout rats. Mol. Neurobiol. 53, 171–186. doi: 10.1007/s12035-014-8927-y
Virel, A., Faergemann, E., Orädd, G., and Strömberg, I. (2014). Magnetic resonance imaging (MRI) to study striatal iron accumulation in a rat model of Parkinson’s disease. Plos One 9:e112941. doi: 10.1371/journal.pone.0112941
Walker, M. D., Volta, M., Cataldi, S., Dinelle, K., Beccano-Kelly, D., Munsie, L., et al. (2014). Behavioral deficits and striatal DA signaling in LRRK2 p.G2019S transgenic rats: a multimodal investigation including PET neuroimaging. J. Parkinsons Dis. 4, 483–498. doi: 10.3233/JPD-140344
Wang, J., Jiang, H., and Xie, J. X. (2004). Time dependent effects of 6-OHDA lesions on iron level and neuronal loss in rat nigrostriatal system. Neurochem. Res. 29, 2239–2243. doi: 10.1007/s11064-004-7031-5
Wei, H., Xie, L., Dibb, R., Li, W., Decker, K., Zhang, Y., et al. (2016). Imaging whole-brain cytoarchitecture of mouse with MRI-based quantitative susceptibility mapping. Neuroimage 15, 107–115. doi: 10.1016/j.neuroimage.2016.05.033
Weingarten, C., Sundman, M. H., Hickey, P., and Chen, N. (2015). Neuroimaging of Parkinson’s disease: expanding views. Neurosci. Biobehav. Rev. 59, 16–52. doi: 10.1016/j.neubiorev.2015.09.007
Westphal, R., Simmons, C., Mesquita, M. B., Wood, T. C., Williams, S. C. R., Vernon, A. C., et al. (2017). Characterization of the resting-state brain network topology in the 6-hydroxydopamine rat model of Parkinson’s disease. PLoS One 12:e0172394. doi: 10.1371/journal.pone.0172394
Williams, K. A., Magnuson, M., Majeed, W., LaConte, S. M., Peltier, S. J., Hu, X., et al. (2010). Comparison of alpha-chloralose, medetomidine and isoflurane anesthesia for functional connectivity mapping in the rat. Magn. Reson. Imaging 28, 995–1003. doi: 10.1016/j.mri.2010.03.007
Winklhofer, K. F., and Haass, C. (2010). Mitochondrial dysfunction in Parkinson’s disease. Biochim. Biophys. Acta 1802, 29–44. doi: 10.1016/j.bbadis.2009.08.013
Winston, G. P. (2012). The physical and biological basis of quantitative parameters derived from diffusion MRI. Quant. Imaging Med. Surg. 2:25465. doi: 10.3978/j.issn.2223-4292.2012.12.05
Wu, S. F., Zhu, Z. F., Kong, Y., Zhang, H. P., Zhou, G. Q., Jiang, Q. T., et al. (2014). Assessment of cerebral iron content in patients with Parkinson’s disease by the susceptibility-weighted MRI. Eur. Rev. Med. Pharmacol. Sci. 18, 2605–2608.
Xiao, D., Cassin, J. J., Healy, B., Burdett, T. C., Chen, J.-F., Fredholm, B. B., et al. (2011). Deletion of adenosine A1 or A(2A) receptors reduces L-3,4-dihydroxyphenylalanine-induced dyskinesia in a model of Parkinson’s disease. Brain Res. 7, 310–318. doi: 10.1016/j.brainres.2010.08.099
Xu, X., Wang, Q., Zhong, J., and Zhang, M. (2015). Iron deposition influences the measurement of water diffusion tensor in the human brain: a combined analysis of diffusion and iron-induced phase changes. Neuroradiology 57, 1169–1178. doi: 10.1007/s00234-015-1579-4
Yuan, H., Sarre, S., Ebinger, G., and Michotte, Y. (2005). Histological, behavioral and neurochemical evaluation of medial forebrain bundle and striatal 6-OHDA lesions as rat models of Parkinson’s disease. J. Neurosci. Meth. 144, 35–45. doi: 10.1016/j.jneumeth.2004.10.004
Zhang, J., Stanton, D. M., Nguyen, X. V., Liu, M., Zhang, Z., Gash, D., et al. (2005). Intrapallidal lipopolysaccharide injection increases iron and ferritin levels in glia of the rat substantia nigra and induces locomotor deficits. Neuroscience 135, 829–838. doi: 10.1016/j.neuroscience.2005.06.049
Zhang, J., Zhang, Y., Wang, J., Cai, P., Luo, C., Qian, Z., et al. (2010). Characterizing iron deposition in Parkinson’s disease using susceptibility-weighted imaging: an in vivo MR study. Brain Res. 1330, 124–130. doi: 10.1016/j.brainres.2010.03.036
Zhang, W., Sun, S. G., Jiang, Y. H., Qiao, X., Sun, X., and Wu, Y. (2009). Determination of brain iron content in patients with Parkinson’s disease using magnetic susceptibility imaging. Neurosci. Bull. 25, 353–360. doi: 10.1007/s12264-009-0225-8
Zhurakovskaya, E., Leikas, J., Pirttimäki, T., Mon, F. C., Gynther, M., Aliev, R., et al. (2019). Sleep-state dependent alterations in brain functional connectivity under urethane anesthesia in a rat model of early-stage Parkinson’s disease. eNeuro 6, 1–12. doi: 10.1523/ENEURO.0456-18.2019
Keywords: MRI methods, Parkinson’s disease, animal model, diffusion MRI, MR spectroscopy, resting-state functional MRI
Citation: Petiet A (2021) Current and Emerging MR Methods and Outcome in Rodent Models of Parkinson’s Disease: A Review. Front. Neurosci. 15:583678. doi: 10.3389/fnins.2021.583678
Received: 15 July 2020; Accepted: 05 March 2021;
Published: 07 April 2021.
Edited by:
Rodolfo Gabriel Gatto, University of Illinois at Chicago, United StatesReviewed by:
Sung-Ho Lee, University of North Carolina at Chapel Hill, United StatesJason Langley, University of California, Riverside, United States
Danqing Xiao, Regis College, United States
Ikuo Tooyama, Shiga University of Medical Science, Japan
Puneet Bagga, St. Jude Children’s Research Hospital, United States
Copyright © 2021 Petiet. This is an open-access article distributed under the terms of the Creative Commons Attribution License (CC BY). The use, distribution or reproduction in other forums is permitted, provided the original author(s) and the copyright owner(s) are credited and that the original publication in this journal is cited, in accordance with accepted academic practice. No use, distribution or reproduction is permitted which does not comply with these terms.
*Correspondence: Alexandra Petiet, YWxleGFuZHJhLnBldGlldEBpY20taW5zdGl0dXRlLm9yZw==