 Jorge Miguel Amaya1
 Ernst Suidgeest2Isabelle Sahut-Barnola3
 Typhanie Dumontet3Nathanaëlle Montanier3
 Guilhem Pagès4Cécile Keller4
 Louise van der Weerd2,5
 Alberto M. Pereira1
 Antoine Martinez4
 Onno C. Meijer1*
- 1Department of Endocrinology, Leiden University Medical Center, Leiden, Netherlands
- 2Department of Radiology, Leiden University Medical Center, Leiden, Netherlands
- 3Génétique Reproduction et Développement, Université Clermont-Auvergne, CNRS, INSERM, Clermont-Ferrand, France
- 4INRAE, AgroResonance, QuaPA UR370, Saint-Genès-Champanelle, France
- 5Human Genetics Department, Leiden University Medical Center, Leiden, Netherlands
Chronic exposure to high circulating levels of glucocorticoids has detrimental effects on health, including metabolic abnormalities, as exemplified in Cushing’s syndrome (CS). Magnetic resonance imaging (MRI) studies have found volumetric changes in gray and white matter of the brain in CS patients during the course of active disease, but also in remission. In order to explore this further, we performed MRI-based brain volumetric analyses in the AdKO mouse model for CS, which presents its key traits. AdKO mice had reduced relative volumes in several brain regions, including the corpus callosum and cortical areas. The medial amygdala, bed nucleus of the stria terminalis, and hypothalamus were increased in relative volume. Furthermore, we found a lower immunoreactivity of myelin basic protein (MBP, an oligodendrocyte marker) in several brain regions but a paradoxically increased MBP signal in the male cingulate cortex. We also observed a decrease in the expression of glial fibrillary acidic protein (GFAP, a marker for reactive astrocytes) and ionized calcium-binding adapter molecule 1 (IBA1, a marker for activated microglia) in the cingulate regions of the anterior corpus callosum and the hippocampus. We conclude that long-term hypercorticosteronemia induced brain region-specific changes that might include aberrant myelination and a degree of white matter damage, as both repair (GFAP) and immune (IBA1) responses are decreased. These findings suggest a cause for the changes observed in the brains of human patients and serve as a background for further exploration of their subcellular and molecular mechanisms.
Introduction
Glucocorticoid hormones (GCs) are mediators of the response to stress, a state following real or perceived threat to homeostasis (Smith and Vale, 2006). GCs act throughout the body via the widely expressed glucocorticoid receptor (GR) and the mineralocorticoid receptor (MR) (Pujols et al., 2002). GC binding to its receptors results in a wide array of genomic and non-genomic signaling changes at the cellular level (Kadmiel and Cidlowski, 2013). A major aspect of GR-mediated effects concerns its metabolic effects on carbohydrate, lipid, and protein metabolism (from their action on liver, adipose tissue, and muscle), which in the long term predispose for obesity and metabolic syndrome. Chronic exposure to high levels of GCs increases visceral adipose tissue (Debono et al., 2013) and upregulates the expression of lipogenic pathway genes (Hochberg et al., 2015). Accordingly, central obesity and dyslipidemia are very common signs in Cushing’s syndrome (CS) patients, a disorder caused by prolonged exposure to excess GCs (Angeli et al., 1997; Garrapa et al., 2001; Sharma et al., 2015). By screening populations of patients with simple obesity, prevalence rates of CS might be as high as 9% (Tiryakioglu et al., 2010).
GCs also affect brain function. The effects on peripheral energy metabolism and immunity alone may already do this (Koorneef et al., 2018), but MR and GR are also widely (but differentially) expressed in neurons and other cell populations in the brain. Cortisol affects a wide range of brain processes, including food intake (mirroring peripheral effects on metabolism), cognition, emotion, and autonomic responses. The effects may involve biochemical and structural changes (de Kloet et al., 2005). The study of GC actions in the brain has served to illustrate two closely related concepts: (1) The effects of GC can be adaptive or deleterious, and (2) cellular responses to GCs are different depending on the duration of exposure (acute vs chronic) (McEwen et al., 2015). These two concepts are also illustrated clinically by changes in the brain of CS patients.
Cushing’s syndrome patients in active disease have been reported to present with smaller hippocampal volumes (Starkman et al., 1992), larger ventricular diameters, and cerebral atrophy (Simmons et al., 2000; Bourdeau et al., 2002). Strikingly, patients in long-term remission present smaller volumes in total gray matter (Resmini et al., 2012), particularly in the anterior cingulate cortex (Andela et al., 2013), as well as decreased cortical thickness (Crespo et al., 2014; Bauduin et al., 2020). Changes are not limited to gray matter though, as these patients also present significant reductions in white matter integrity (van der Werff et al., 2014).
Recently, we developed mouse models of endogenous CS: the AdKO mice, which carry an inactivating deletion of the gene encoding the regulatory subunit 1 alpha of the PKA, specifically targeted to the adrenal cortex. These mice present adrenal hyperplasia, chronic hypercorticosteronemia, lack of negative feedback after exogenous GCs, and even fat accumulation in the back of the neck (“buffalo hump”), which is one of the most visible signs in CS patients (Sahut-Barnola et al., 2010; Drelon et al., 2016; Dumontet et al., 2018). Here, we used brain magnetic resonance imaging (MRI) in order to find whether the changes observed in human patients were mirrored in our mice. We also performed immunohistochemical staining of glial cells in an attempt to explore the origins of such changes.
Materials and Methods
Mice
All animal work was conducted according to French and European directives for use and care of animals for research purposes and received approval from the French Ministry of Higher Education, Research and Innovation (APAFIS#21153-2019061912044646 v3). The Sf1-Cre (Cre expression in all steroidogenic cells of the adrenal cortex from its inception) (Bingham et al., 2006) and Prkar1afl/fl (floxed allele of Prakar1a that allows Cre-mediated inactivation of R1α subunit and subsequent constitutive activation of PKA catalytic activity; Kirschner et al., 2005) were used as breeders. Mice were all maintained and bred on a mixed background. Throughout the manuscript, AdKO2.0 refers to Sf1-Cre::Prkar1afl/fl, and WT refers to littermate control animals. ACTH-independent CS features of mice bearing R1α inactivation in the adrenal cortex using various Cre-expressing lines were previously described (Sahut-Barnola et al., 2010; Drelon et al., 2016; Dumontet et al., 2018). AdKO2.0 mice were used here because of their more severe CS phenotype compared to the original AdKO line that used the Akr1b7 Cre driver (Sahut-Barnola et al., 2010). Mice from both sexes were analyzed at 8–10 weeks of age (n = 6 for males, n = 6 for females). Femur length was measured for a subset of the mice (n = 3 for male, n = 4 for females).
Magnetic Resonance Imaging
Mice were anesthetized with 2% isoflurane and perfused for 1 min with 1 × phosphate-buffered saline (PBS) and for 4 min with 4% paraformaldehyde (PFA). The skull was freed from the skin and fat tissue and stored in 4% PFA overnight and then transferred to 4% PFA + 1:40 v/v gadoteric acid 0.5 mmol/ml (Dotarem, Guerbet, France) at 4°C for 3 weeks. Then they were transferred to a solution of 1 × PBS, 1:40 v/v Dotarem, and 0.01% sodium azide, and after 2 days, an MRI scan was acquired. MRI acquisitions were performed on a 9.4-T Bruker magnet (Bruker, Germany). The magnet was equipped with a 15-mm microimaging radiofrequency (RF) coil and maximum gradients up to 1.5 T m–1 along the three axes. The fixed brain was introduced inside a flat-bottom 15-mm NMR tube (Hilgenberg, Germany), and Fomblin® (Sigma-Aldrich, France), a perfluorinated polyether, was added to limit the magnetic susceptibility at the interfaces without generating any NMR signal. 2D fast low-angle shot (FLASH) acquisition pilot scans were performed in three planes: axial, sagittal, and coronal. A whole-brain image was acquired based on a 3D-FLASH protocol. The echo and repetition times were set to 5.3 and 15.0 ms, respectively. The flip angle was 30° with a bandwidth of 3 kHz. The field of view (FOV), covering the whole brain, was 16 mm × 14 mm × 15 mm with a matrix of 320 × 280 × 300 points, leading to an isotropic resolution of 50 μm. Eight averages were performed, leading to an experimental time of around 2 h and 50 min. One MRI data set (WT male) was excluded from further MRI analysis due to the presence of imaging artifacts.
The MRI scans were linearly (six parameters followed by 12 parameters) and subsequently nonlinearly registered using a combination of mni_autoreg tools (Collins et al., 1994) and advanced normalization tools (ANTs; Avants et al., 2008, 2011), resulting in unbiased alignment of all scans. A population atlas was created by resampling all MRI scans with the appropriate transform and by averaging the scans. Regional measurements were calculated by registering a preexisting classified MRI atlas on to the population atlas, which parcellated the brain into a volumetric measurement of 182 different brain regions (Dorr et al., 2008; Richards et al., 2011; Ullmann et al., 2013; Steadman et al., 2014). Subsequently, the deformation of the individual brains to the final atlas space was calculated and analyzed (Nieman et al., 2006) using the Jacobian determinant for each voxel between the genotypes. All statistical analyses were performed in R. We ran a linear model separately for each sex including genotype as contrast. Multiple comparisons were controlled for by using the false discovery rate (FDR) at a stringent setting of 1% (Genovese et al., 2002). FDR limits the expected number of false positives in a set of results to a certain predetermined percentage. For example, if a result is considered significant at a 1% FDR, this means that no more than 1% of the results would be expected to be a false positive. The entire pipeline was made available by the Mouse Imaging Centre in Toronto (1 Lerch et al., 2017).
Immunohistochemistry
Brains were frozen and cut in a cryostat, and 12-μm sections were collected directly on glass slides, at coordinates Bregma 1.10 (anterior brain) and -1.82 (hippocampus), according to the Paxinos and Franklin Mouse Brain Atlas (Paxinos and Franklin, 2001). Glass slides were washed in PBS + Tween 20 0.3% (PBST), 3 min × 5 min. After washing, they were boiled in citrate buffer (Sigma) for 20 min and cooled in ice to room temperature. Slides were then washed again in PBST, 3 min × 5 min, and then incubated in PBST + 2% goat serum (Sigma) (PBSTG) at room temperature for 90 min. Sections were then incubated with antibodies for MBP (MAB386, Merck Millipore; 1:1,000), GFAP (PA1239, Boster Bio, 1:200), or Iba1 (019-19741, Wako Chemical, 1:1,000) diluted in PBSTG, overnight at 4°C. The sections were washed in PBST, 3 min × 5 min, and incubated in H2O2 3% for 30 min. After another wash in PBST, slides were incubated with ImpressTM HRP anti-rat (MBP; Vector Labs) or EnVision+ system HRP anti-rabbit (GFAP and Iba1; Dako) for 45 min. After this, they were washed once again in PBST for 3 min × 5 min and colored with NovaREDTM solution (Vector Labs). After 7 min, reaction was stopped by adding excess deionized water. Slides were air-dried and mounted with coverslips using Histomount® (National Diagnostics). Due to long-term immersion in fixative supplemented with contrast medium, an elevated level of background was obtained. Digital images of selected fields were acquired in an Olympus microscope equipped with an Olympus digital camera connected to a Dell OptiPlex PC and were displayed using cellSens Standard 1.14 software (Olympus). A 10× objective was used. Digital images were then analyzed with ImageJ. In order to bypass the high amount of background in our images, we devised a method of signal quantification. Briefly, images were transformed from RGB to 8 bit, with a resolution of 2,560 × 1,920 pixels, and mean, median, mode, and standard deviation of the gray values in the entire picture were obtained. With these values, the signal threshold for each picture was determined by subtracting a fixed amount of standard deviations from the mode of the entire picture, which represents the background staining. The number of standard deviations was kept constant within the entire series of pictures for each antibody (2 for MBP, 2.5 for GFAP, and 3 for Iba1). The amount of positive signal marked by the threshold was expressed as the percentage area of total ROI and compared with two-way ANOVA with sex and genotype as factors. In GFAP and Iba1, we estimated the total number of cells, by counting the number of objects (cell bodies) above 250 pixels (∼20 μm2). The threshold for a significant effect was set at p < 0.05. Each animal from each subgroup contributed with only one section per brain area for this analysis.
Results
Magnetic Resonance Imaging
To assess whether a CS phenotype results in neuroanatomical changes, we scanned ex vivo brain samples using high-resolution MRI. We observed volumetric differences that were widespread over the brain, including both gray and white matter areas (Figure 1A), with prominent differences, particularly in the corpus callosum and large parts of the cortex. Looking at absolute volumes, we found a significantly reduced brain size in males, with a trend toward significance in females (Figure 1B). For a subgroup of animals, the femur length was measured, showing a significantly smaller value in the transgenic animals (Figure 1C), indicating that the large difference in brain volume between WT and transgenic mice may be due to generalized growth retardation and not brain specific. Therefore, we also normalized the segmented structures for the whole-brain volume. Relative volume differences were then apparent for a number of brain regions. Supplementary Table 1 provides an overview of all brain structures with differential relative volumes and uncorrected significance level. A list of all segmented structures with absolute and relative volumes and uncorrected p-values is given in Supplementary Table 2.
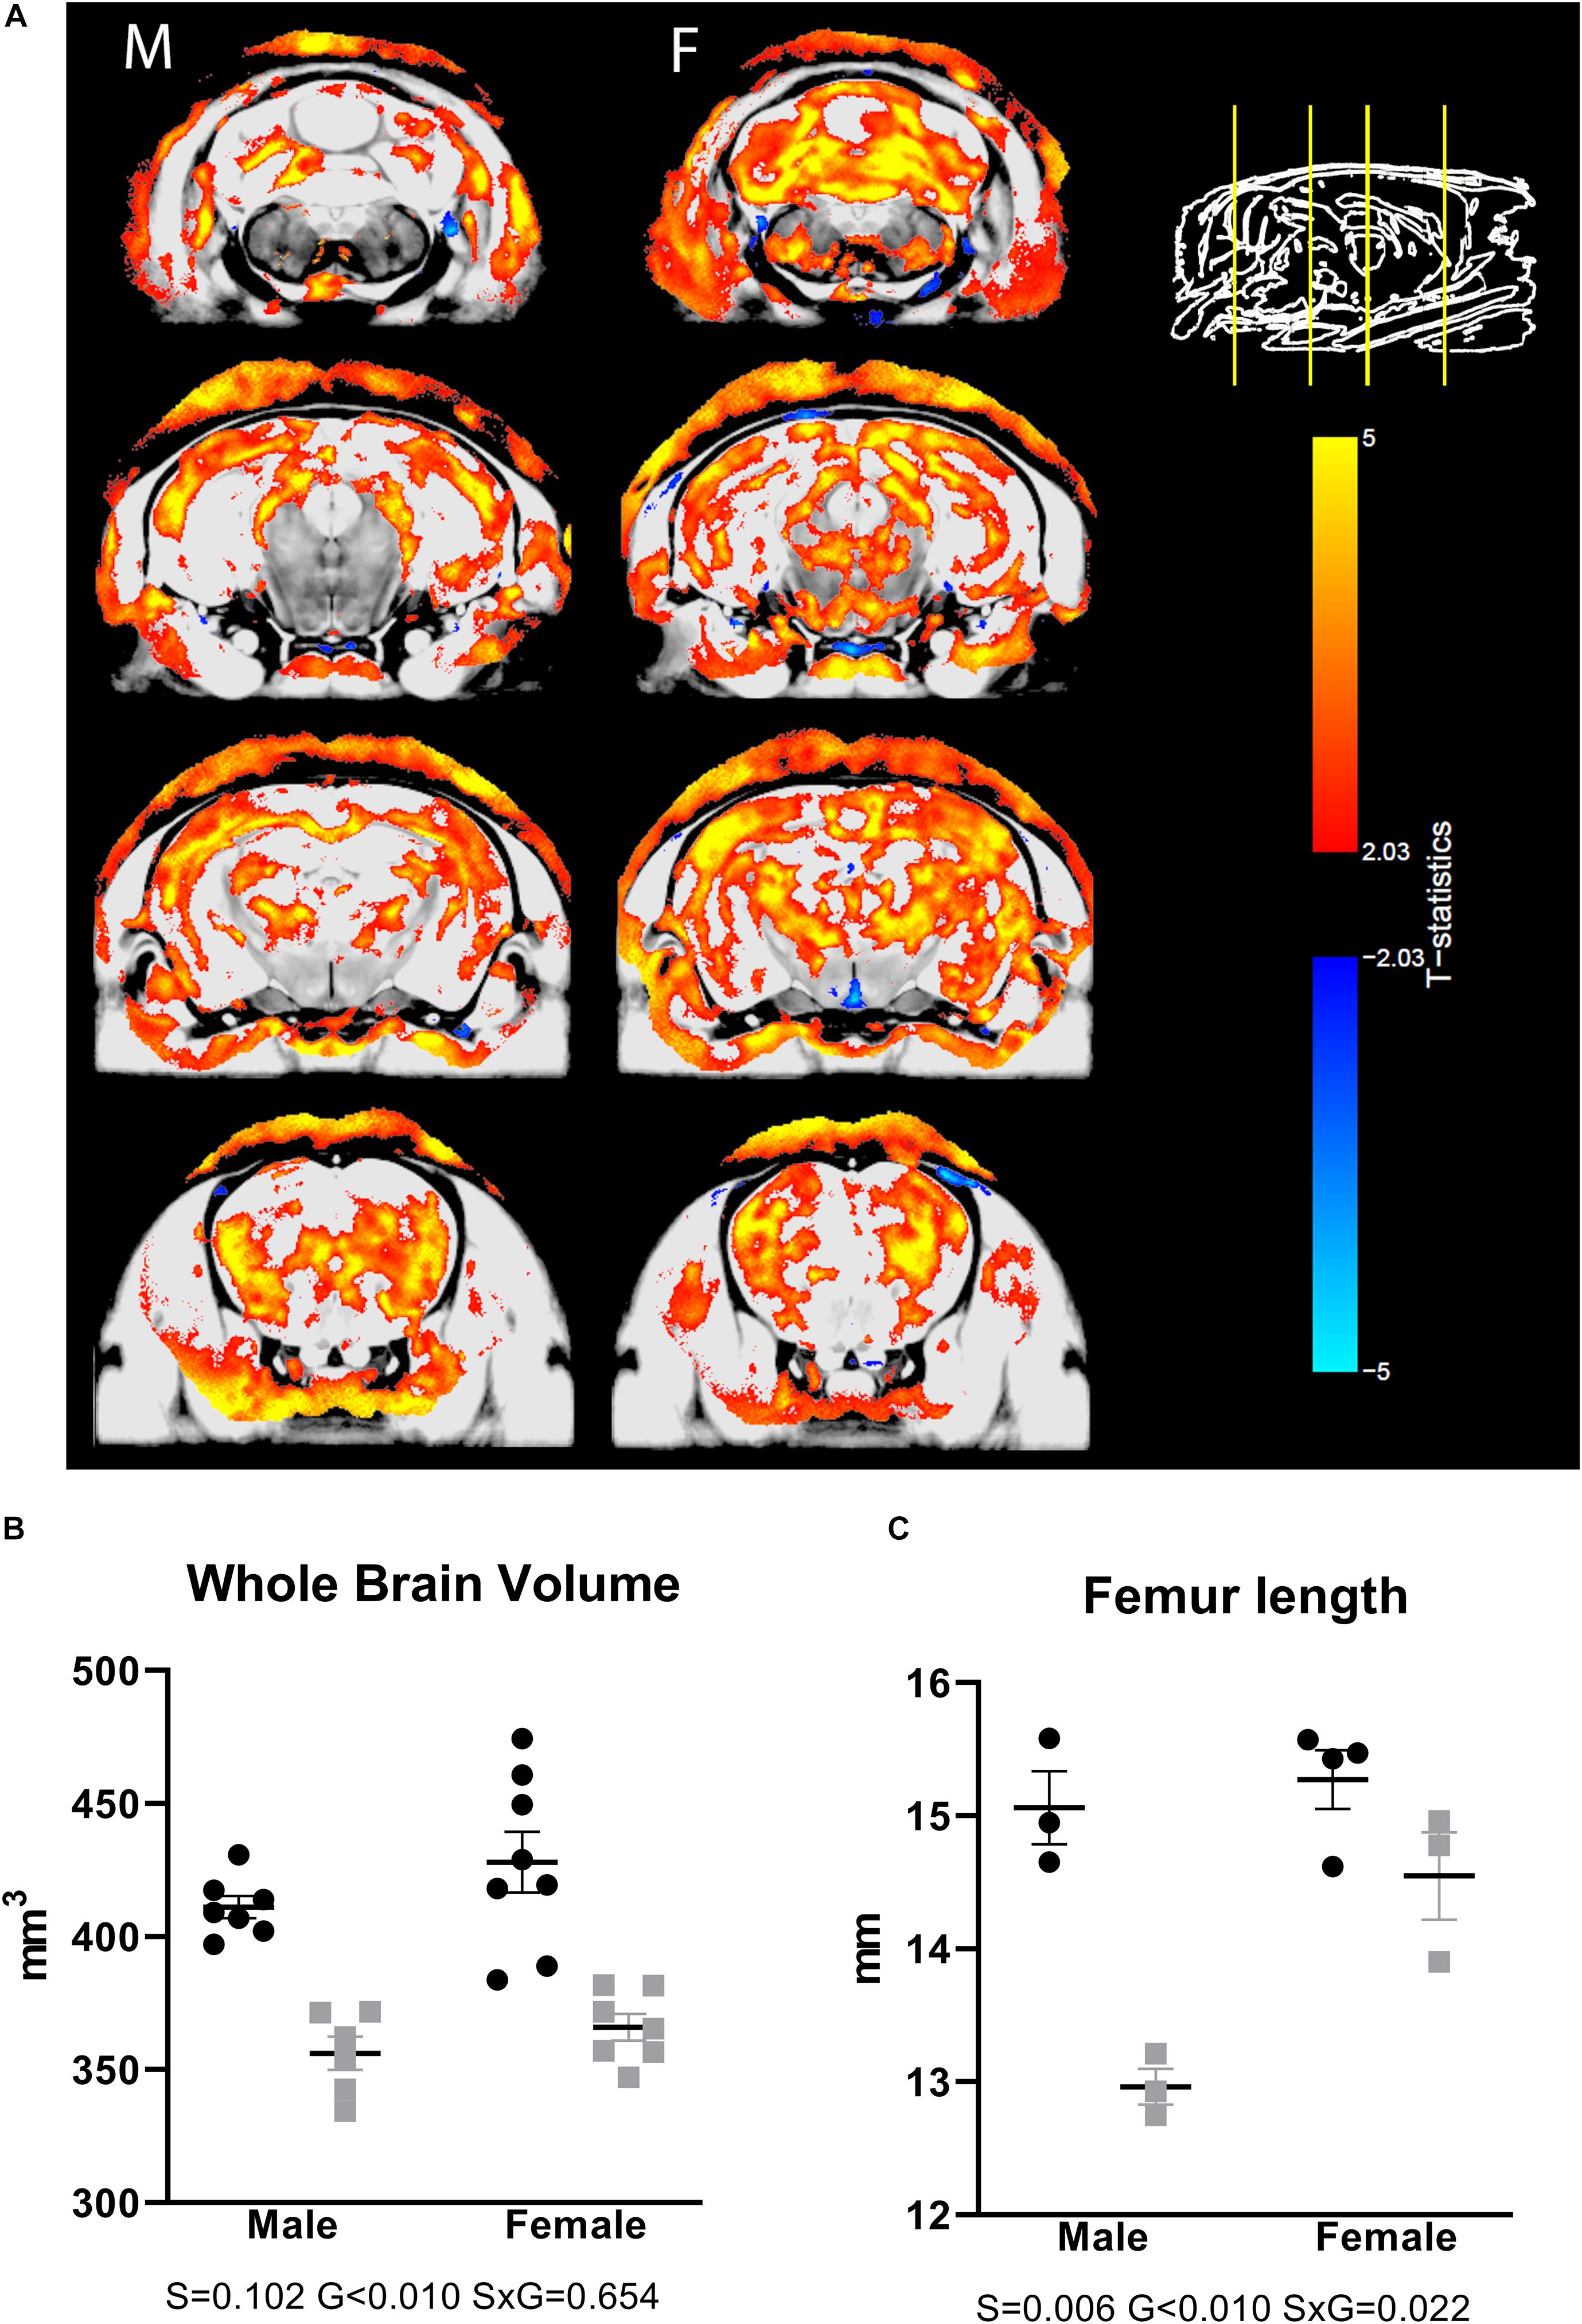
Figure 1. Differences in brain volumes in AdKO2.0 mice. (A) Coronal MRI slices showing significant differences (FDR 1%) in absolute volume between AdKO2.0 mice and age-matched controls. M: male, F: female. The images show coronal MRI slices with the level of significance superimposed. Positive t-statistics are shown in red and indicate absolute volume decreases in AdKO2.0 mice compared to controls. Negative values are shown in blue and indicate an increase of absolute volume compared to controls. (B) Absolute whole-brain volumes. (C) Femur lengths for a subgroup of mice. Black dots: wild type. Gray squares: AdKO2.0.
After FDR correction for multiple comparisons, the corpus callosum showed a robust significant difference in males, with a significantly smaller relative volume in AdKO2.0 males than in WT males (Figure 2A). Lower volumes were also observed in frontal cortical areas, independent of sex, as well as cerebellar white matter (Figures 2B–D). In contrast, the bed nucleus of the stria terminalis, hypothalamus, and medial amygdala were found to be larger in AdKO2.0 mice brain (Figures 2E–G). Finally, no hippocampal structures differed in relative volumes between genotypes; although the CA1 stratum radiatum appeared larger in male AdKO2.0 mice compared to WT male counterparts in the pairwise comparisons available in the MRI pipeline. However, subsequent two-way ANOVA showed no significant effects for factors sex and genotype or their interaction (Figure 2H).
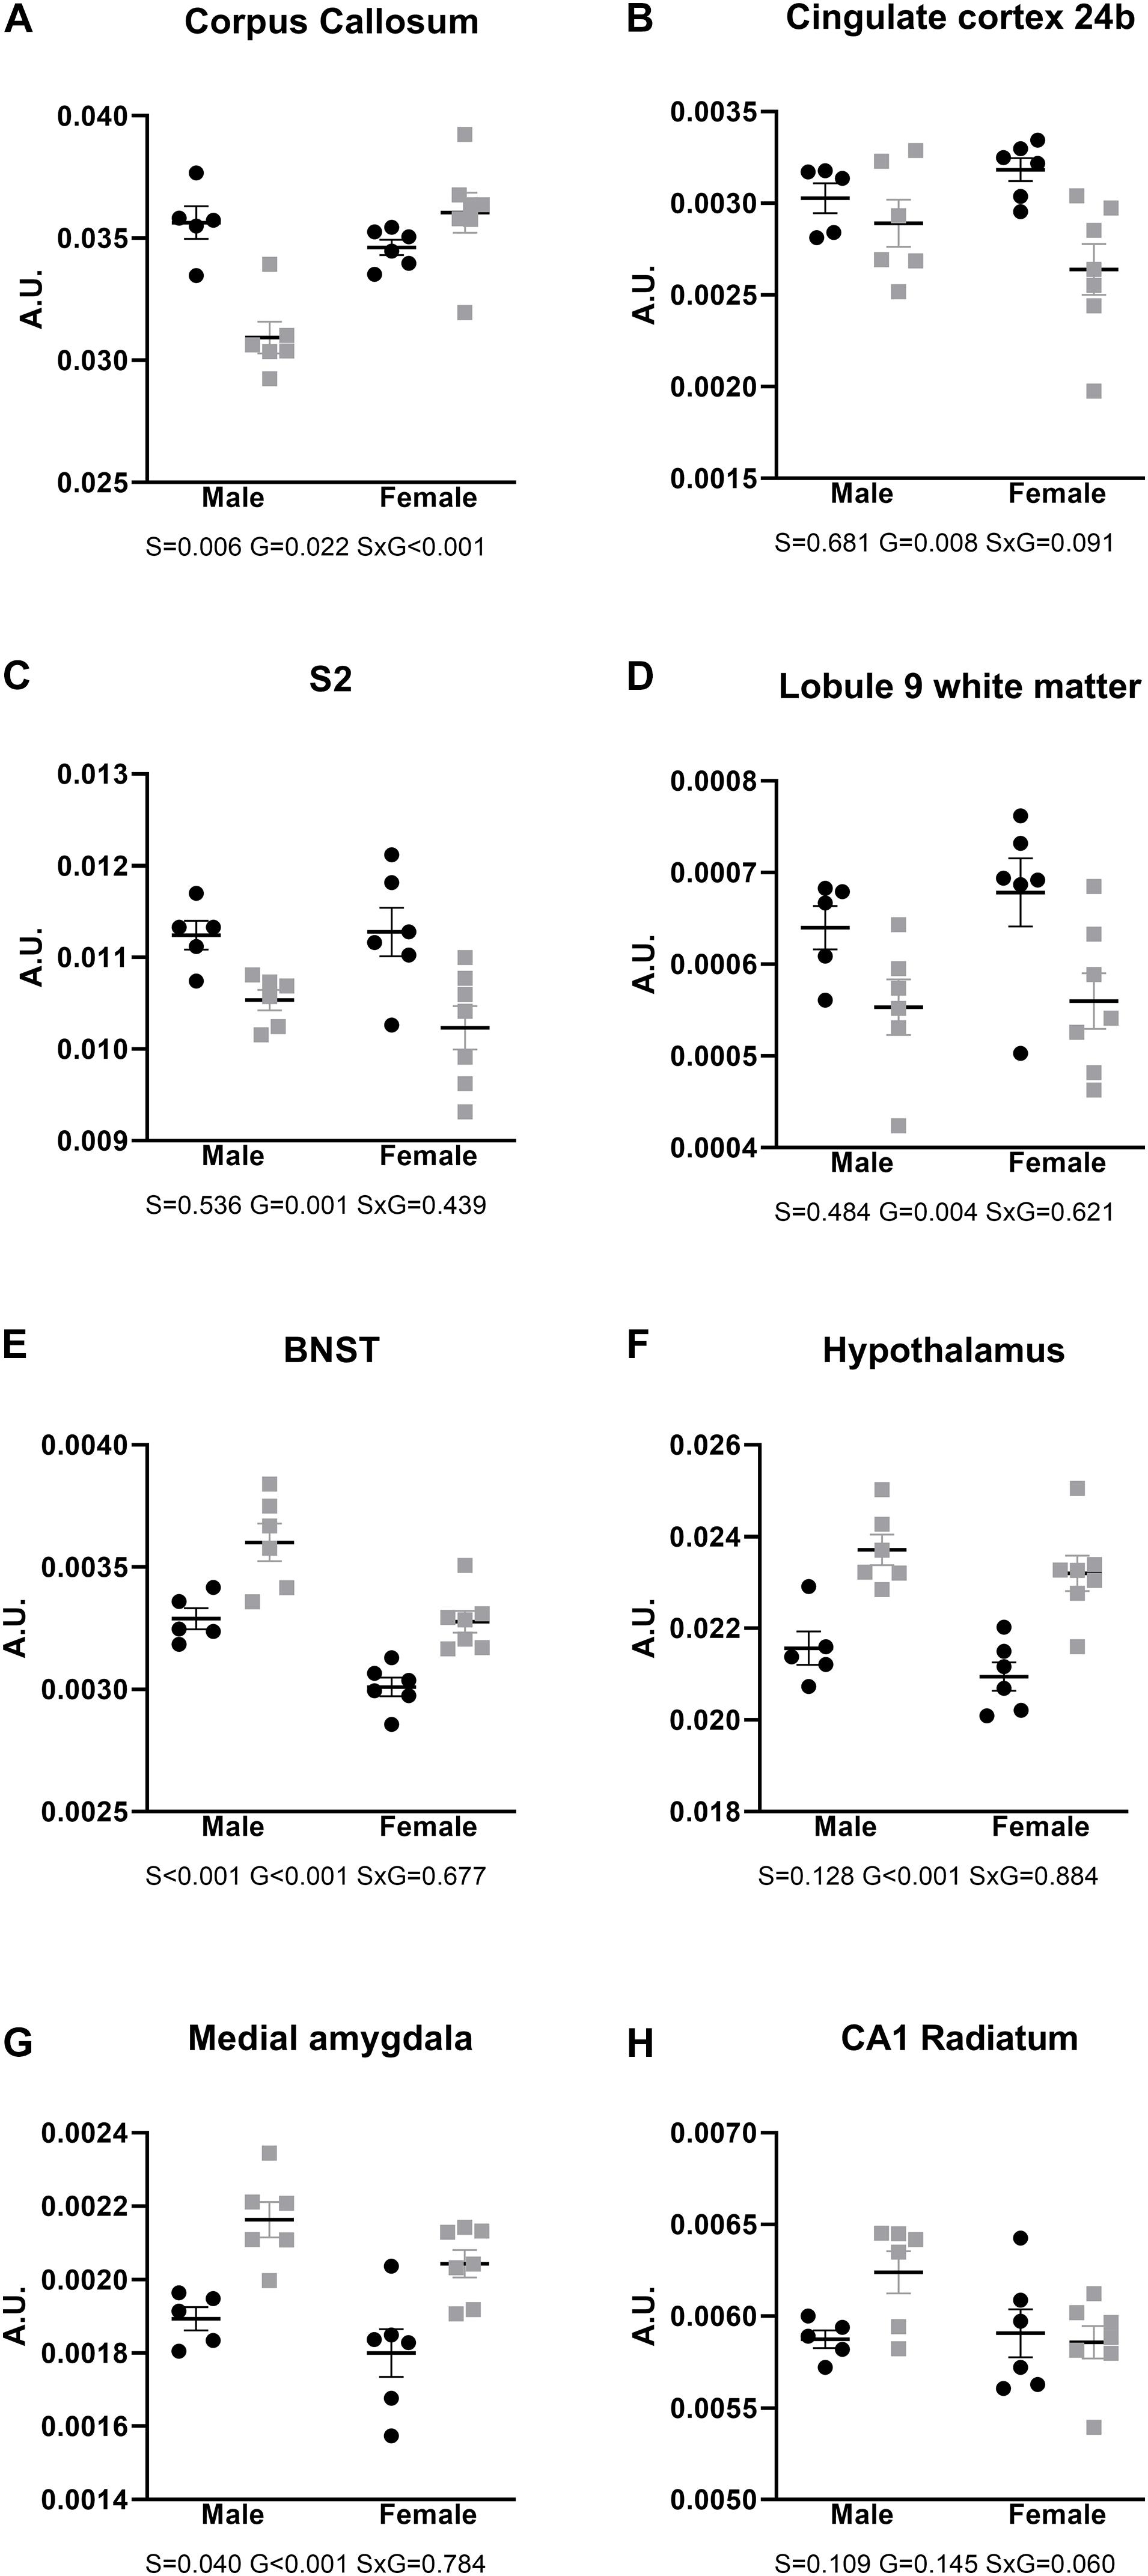
Figure 2. Relative volumes of brain areas and regions, compared with two-way ANOVA. (A–D) Areas with smaller relative brain volumes in the AdKO2.0 mice. (E–G) Areas with bigger relative brain volumes in the AdKO2.0 mice. (H) CA1 s. radiatum as representative for the hippocampus. S2: secondary somatosensory cortex; BNST: bed nucleus of the stria terminalis; CA1: cornu ammonis 1. S, G, and S × G: p value of the source of variation (sex, genotype, and interaction, respectively). Black dots: wild type. Gray squares: AdKO2.0. AU, arbitrary units.
Immunohistochemistry
Figures 2, 3 show the relative volumetric differences between the brain structures that were chosen for immunohistochemistry, selected on prior data in active disease (hippocampus) (Starkman et al., 1992, 1999; Burkhardt et al., 2015), long-lasting effects in CD patients (Cg) (Andela et al., 2013), and reduced volumes in the present MRI analysis (S2). As mentioned before, we obtained a high level of background in our preparations due to long-term immersion in fixative supplemented with contrast medium, which we corrected for by using our thresholding method. MBP as a marker for oligodendrocyte function showed a main effect for genotype in cingulate cortex areas (Cg1 p = 0.043, Cg2 p = 0.005), indicating increased immunoreactivity in the AdKO2.0 mice. For the Cg1 area, this effect was male specific (interaction effect p = 0.015). This interaction between sex and genotype was present at the trend level of the Cg2 area (p < 0.1) (Figure 4). At the hippocampal level, however, there was decreased MBP immunoreactivity in the CA1 and CA3 fields (CA1: s. oriens p = 0.005, s. pyramidalis p = 0.033, s. radiatum p = 0.014; CA3: s. lucidum p = 0.048, s. radiatum p = 0.012) (Figure 5). At this frontocaudal level, a decrease of MBP signal in AdKO2.0 mice was also observed in the S2 cortex (main effect p < 0.001) (Figure 5). MBP signal showed a main effect of sex in the hippocampal CA3 area (CA1: s. moleculare p = 0.047; CA3: s. radiatum p = 0.003, s. moleculare p = 0.001) and S2 cortical area (area 3 p = 0.023), reflecting higher immunoreactivity in female mice. Overall, at the hippocampal level and somatosensory cortex, MBP immunohistochemistry was reduced in AdKO2.0 mice, while in the cingulate cortex, there was a male-specific increase. All significant effects are listed in Supplementary Table 3A.
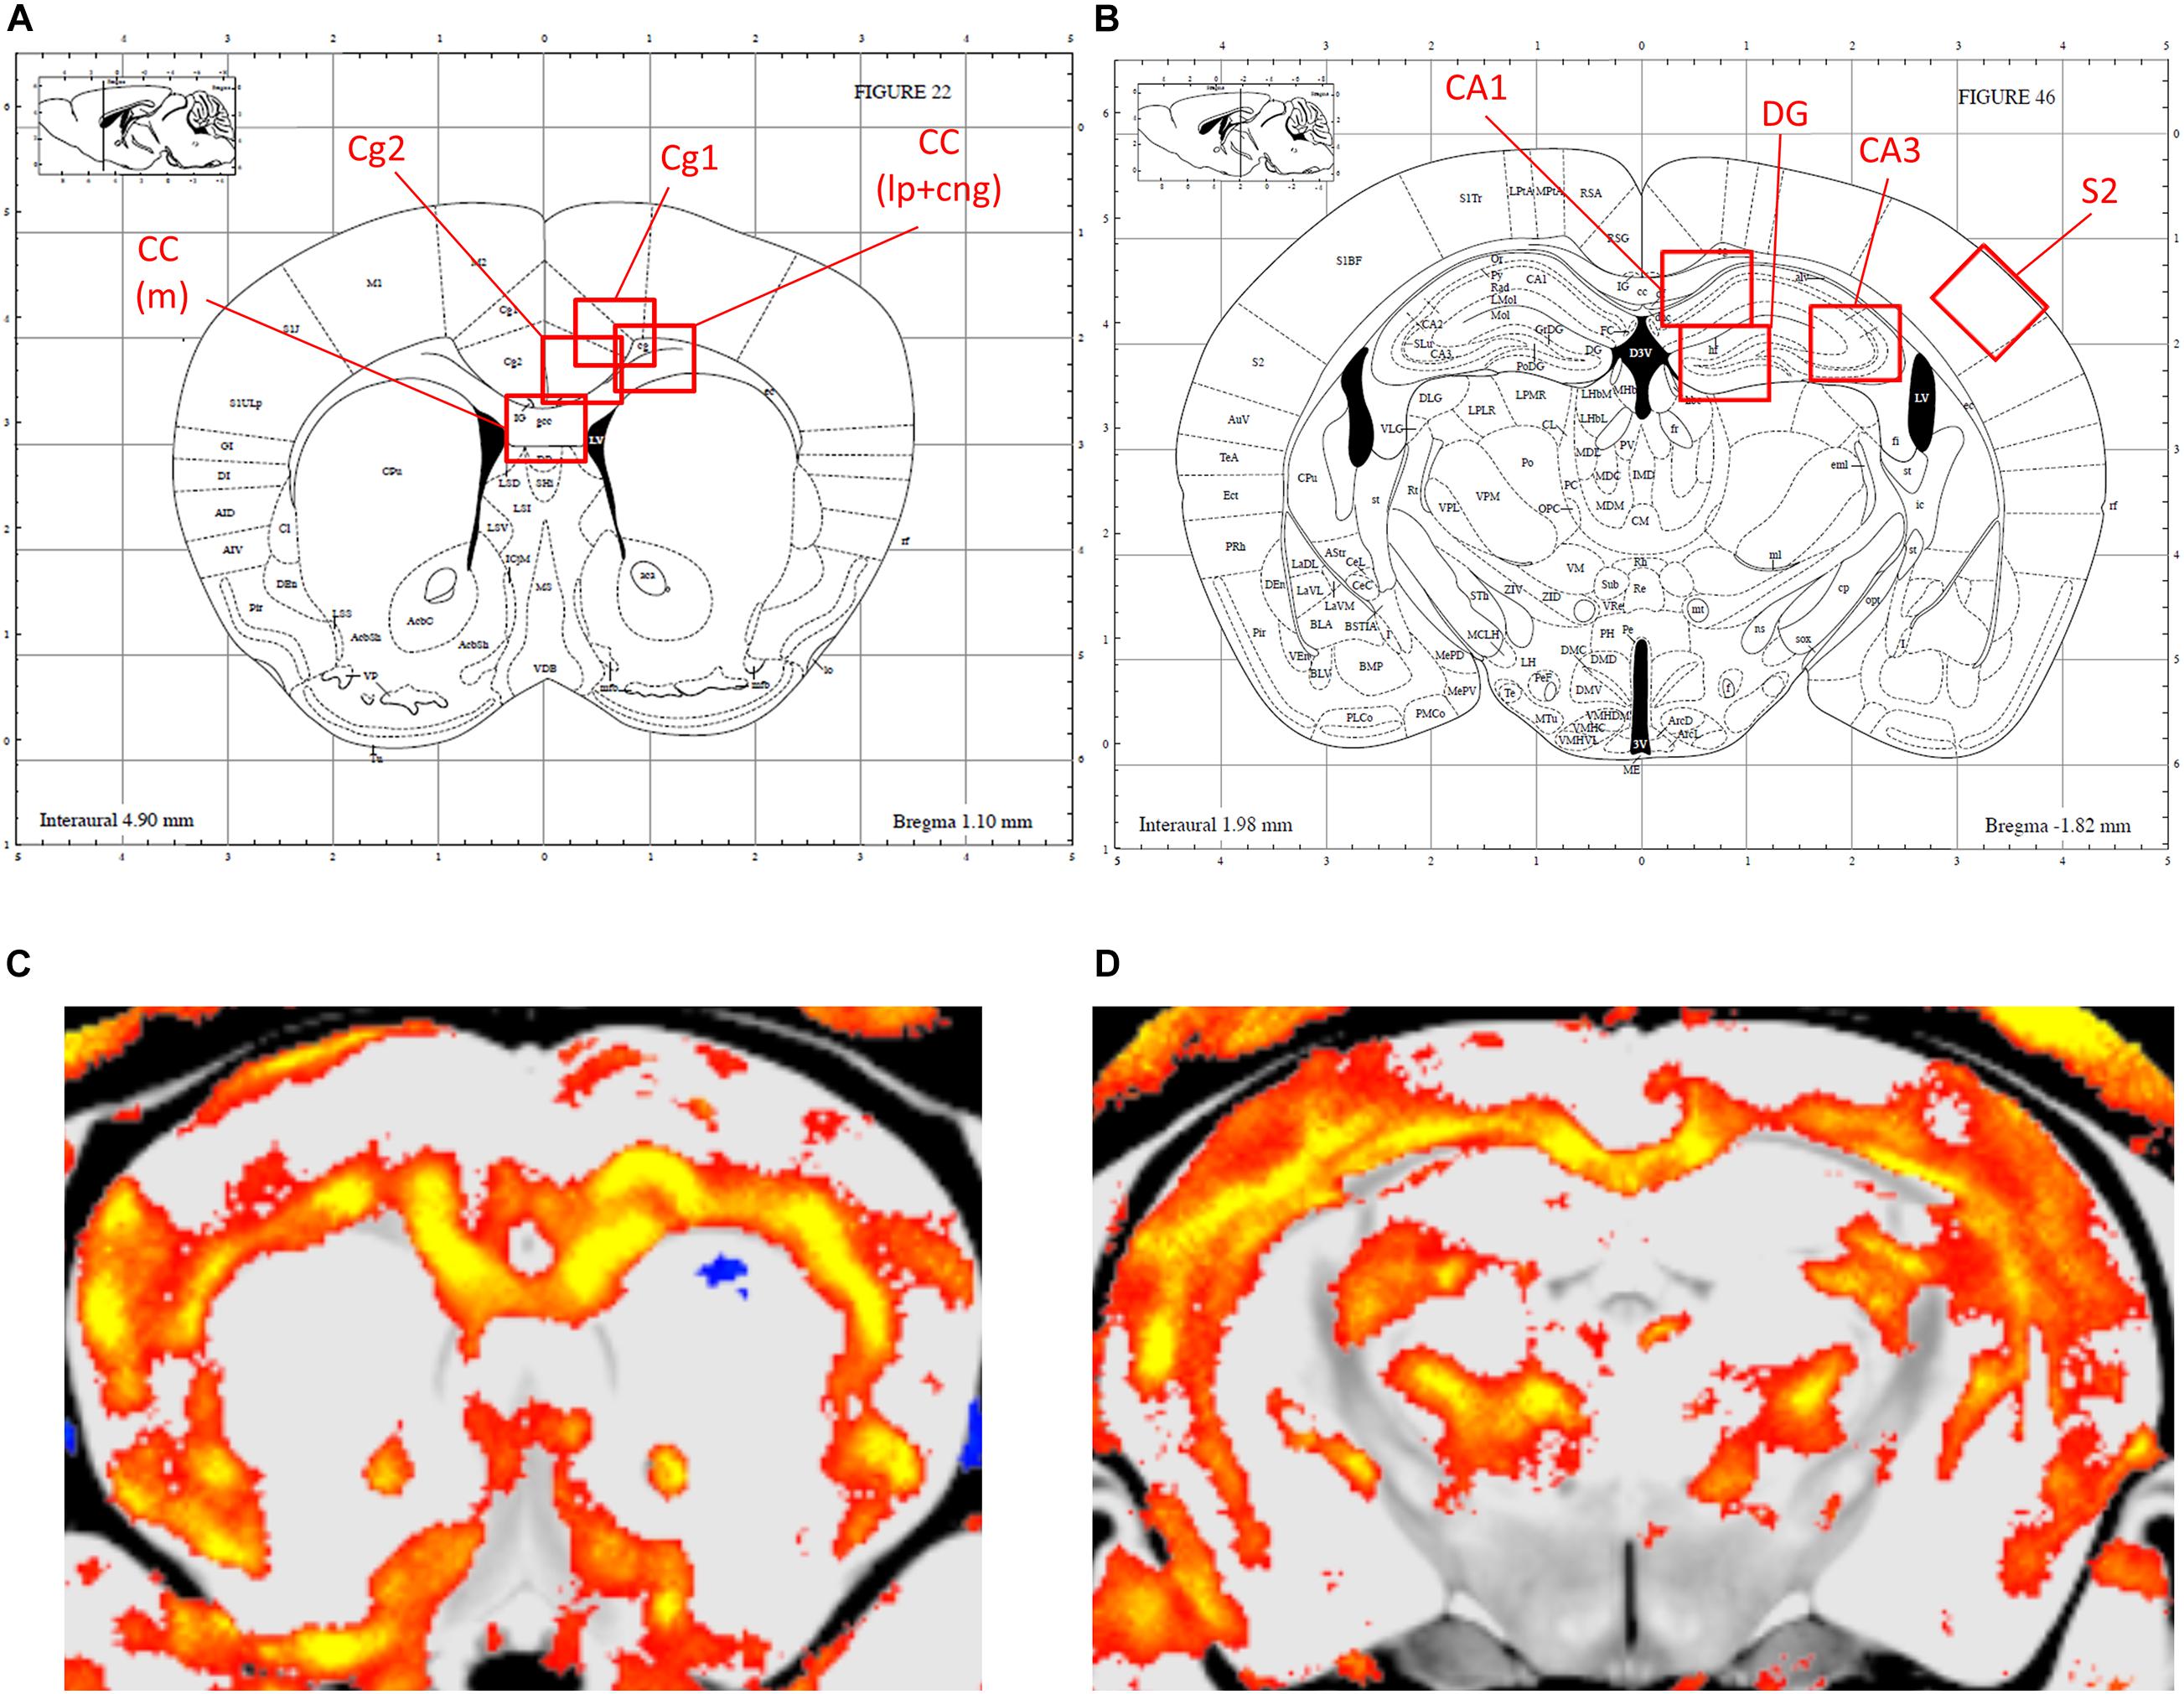
Figure 3. Localization of the areas that were analyzed for immunohistochemical staining. (A,B) Indications of the regions of interest (ROIs) in the corresponding levels of the Paxinos atlas for the anterior brain (Bregma 0.98–0.86 mm), and dorsal hippocampus (Bregma -1.82 to -1.94) (Reprinted with permission by Elsevier Ltd.). (C,D) orresponding MR images, with smaller volumes indicated in color. Cg1, cingulate cortex 1; Cg2, cingulate cortex 2; CC (lp), corpus callosum lateroproximal; CC (m), corpus callosum medial; S2, secondary somatosensory cortex; CA1, cornu ammonis 1; CA3, cornu ammonis 3.
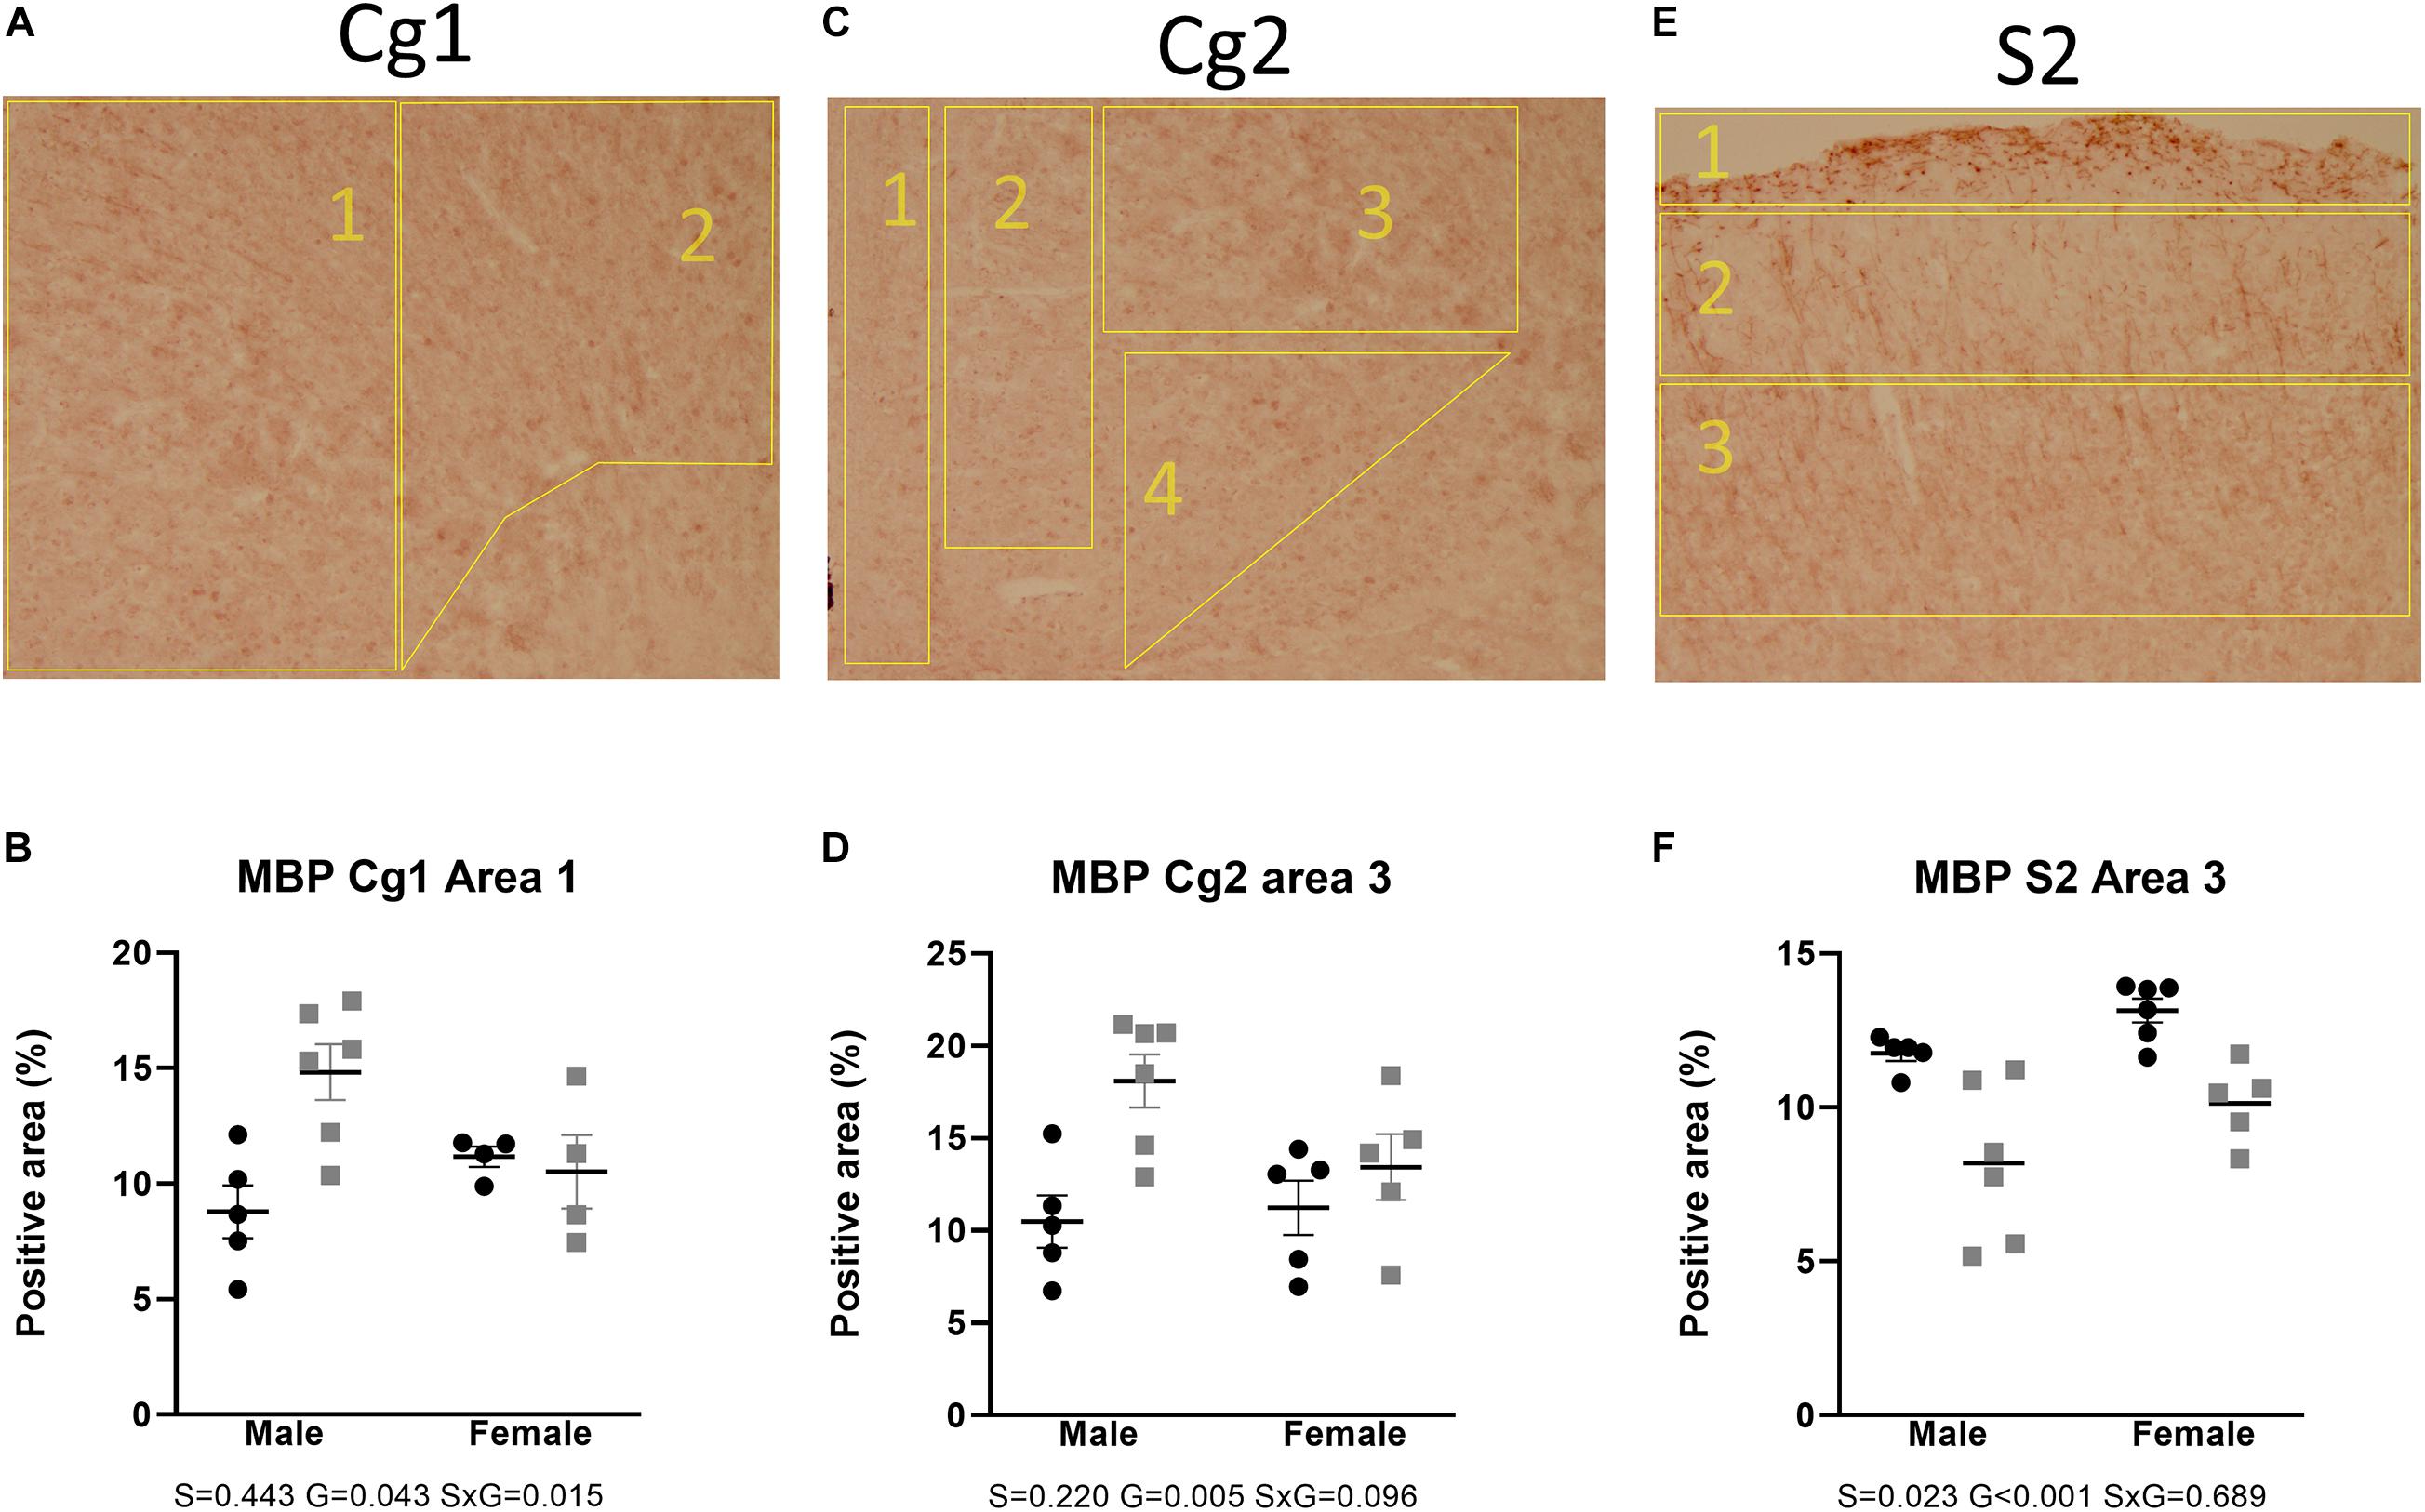
Figure 4. Staining and quantification of MBP at the anterior level. Numbered polygons in stained sections indicate neuroanatomical parcellations. (A–D) In the cingulate cortex (Cg), AdKO2.0 mice had a male-specific increase in MBP-positive area compared to WT mice. (E,F) In the somatosensory cortex (S2), there was a reduction in MBP-immunopositive area in AdKO2.0 mice of both sexes. S, G, and S × G: p value of the source of variation (sex, genotype, and interaction, respectively). Black dots: wild type. Gray squares: AdKO2.0.
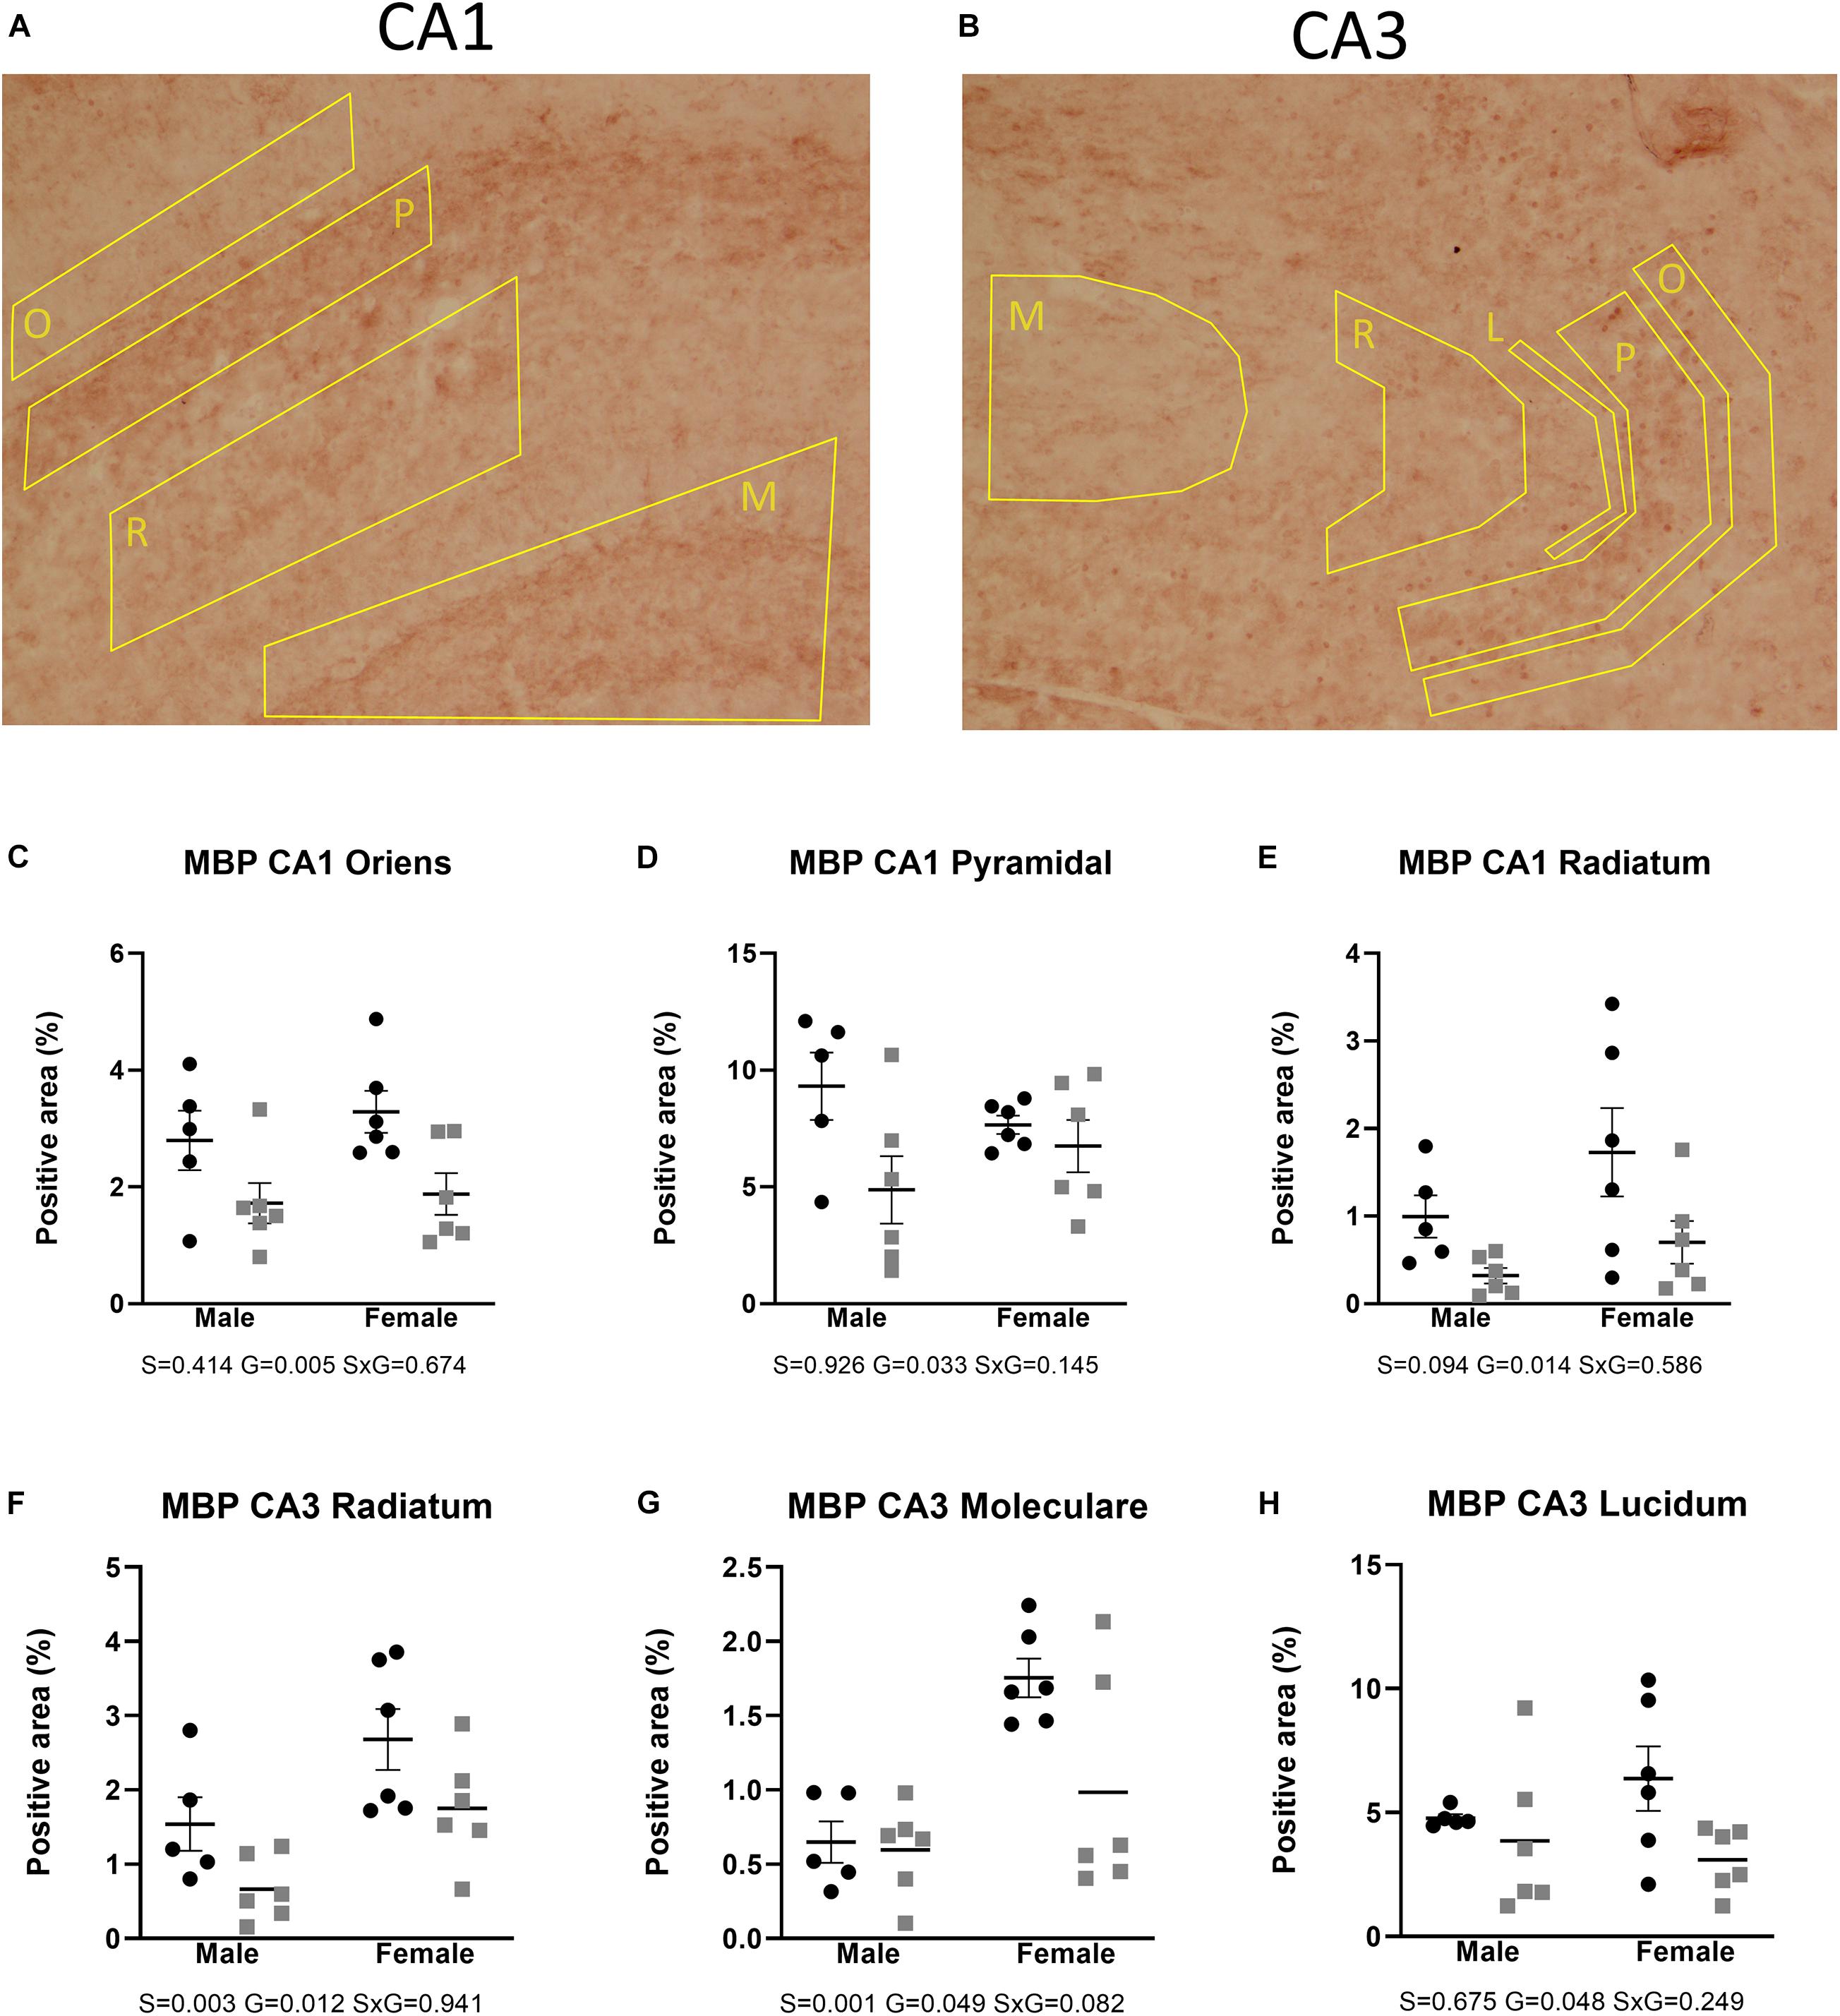
Figure 5. Expression of MBP in the dorsal hippocampus. Coded polygons in stained sections indicate neuroanatomical parcellations. (A,C–E) In CA1, AdKO2.0 mice showed a decrease in MBP-positive areas in both sexes in oriens (O) and radiatum (R) strata and a male-specific decrease in the pyramidal layer, compared to WT mice. (B,F) In CA3, AdKO2.0 mice showed a decrease compared to WT mice in expression in both sexes in the s. radiatum. (G,H) In the s. moleculare (M) and s. lucidum (L), a female-specific decrease was shown. S, G, and S × G: p value of the source of variation (sex, genotype, and interaction, respectively). Black dots: wild type. Gray squares: AdKO2.0.
GFAP immunohistochemistry was used as a reactive astrocytic marker. Two-way ANOVA tests showed a main effect of genotype, reflecting a decrease of immunoreactivity in the AdKO2.0 mice throughout the brain regions. This was found in the corpus callosum (p = 0.036) and in the hippocampal CA1 (s. radiatum p = 0.014) and dentate gyrus (DG; granular layer p = 0.015) (Figure 6). Also, a main effect of sex was found in CA1 (s. moleculare p < 0.001), CA3 (p = 0.030), and DG (granular layer p = 0.034), which indicates a higher expression in females. The number of GFAP-positive cells was not different between genotypes (Supplementary Table 4A). Overall, in both frontocaudal levels, GFAP staining was diminished in ADKO2.0 mice. All significant effects are listed in Supplementary Table 3B.
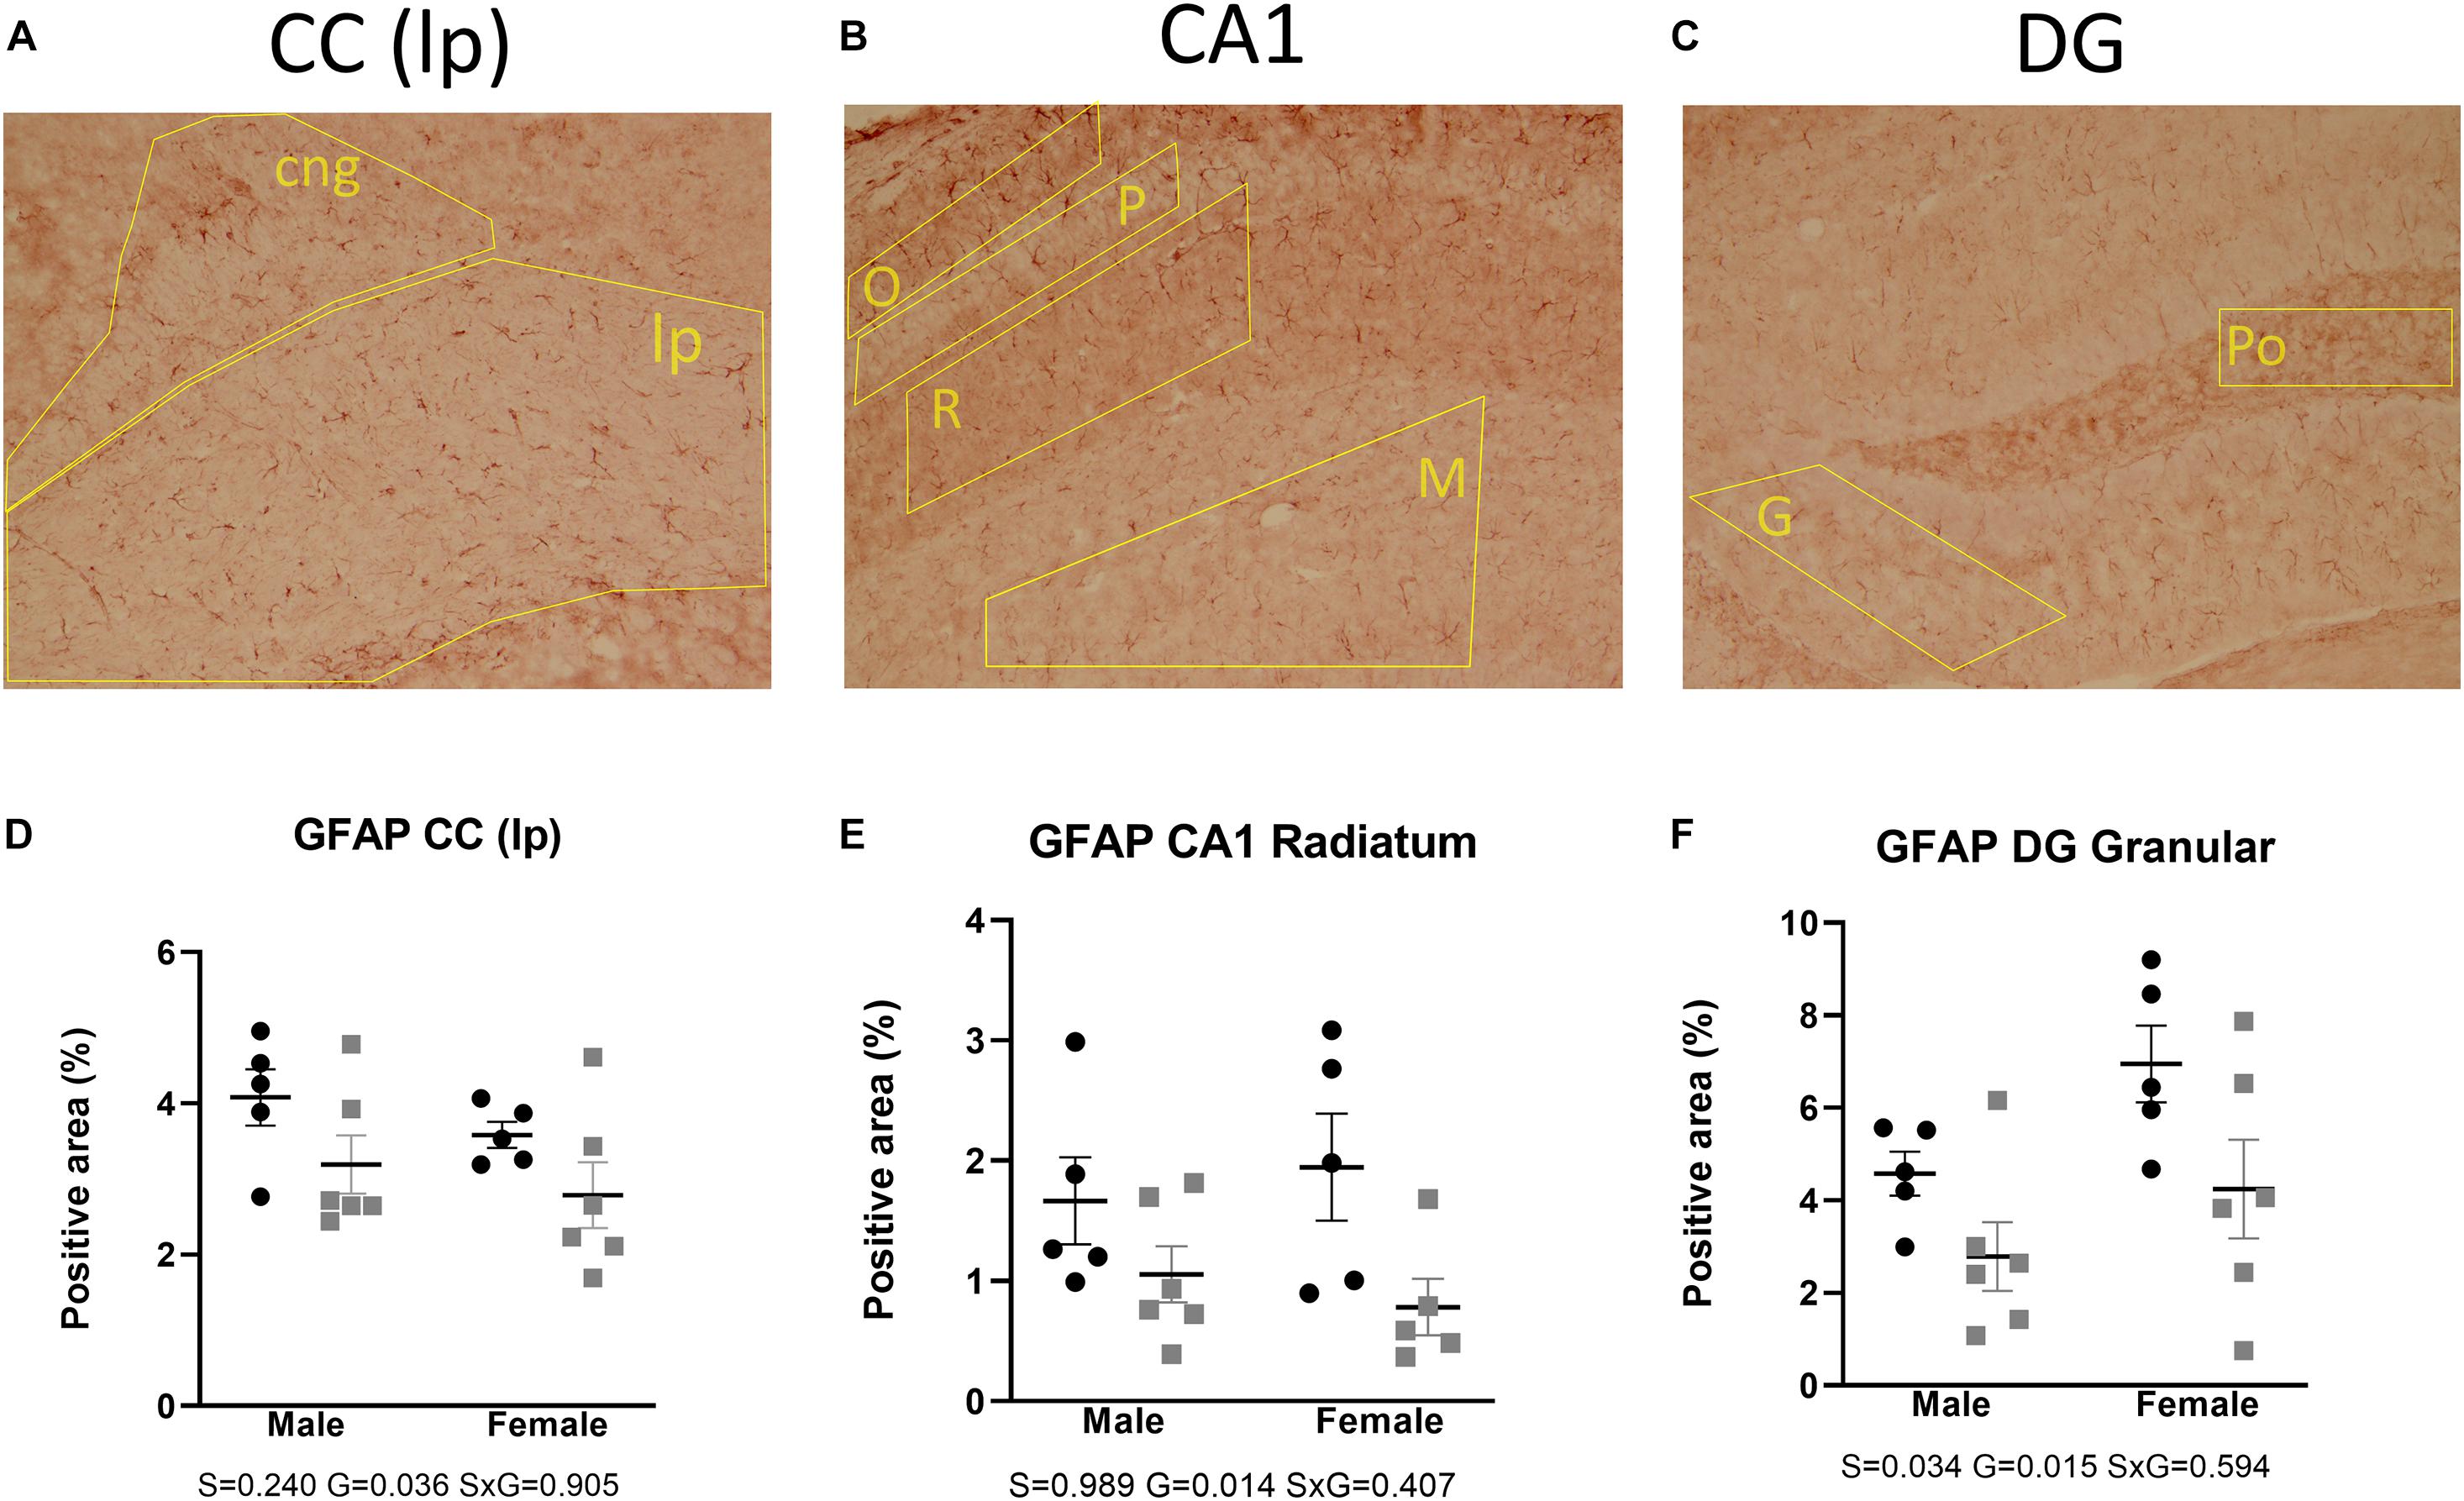
Figure 6. Expression of GFAP in the corpus callosum (A), hippocampal CA1 area (B), and DG (C). Coded polygons in stained sections indicate neuroanatomical parcellations. In the three regions, reduced immunostaining in the AdKO2.0 mice of both sexes was observed compared to that in WT mice (D–F). S, G, and S × G: p value of the source of variation (sex, genotype, and interaction, respectively). Black dots: wild type. Gray squares: AdKO2.0.
Microglial activity was assessed by means of Iba1 immunohistochemistry. Two-way ANOVA showed that Iba1 immunoreactivity in the anterior brain of the AdKO2.0 mice was significantly decreased in the corpus callosum (medial p = 0.001, lateroproximal p = 0.003, cingulate p = 0.017) (Figure 7). Likewise, at the hippocampal level, decreases were also observed in CA3 (s. moleculare p = 0.033) and DG (polymorph p = 0.040) (Figure 8) in AdKO2.0 mouse brains. There were no effects of sex or interaction. In the corpus callosum, we observed a reduced total number of Iba1-positive cells (Supplementary Table 4B). Overall, in both frontocaudal levels, Iba1 staining was diminished in ADKO2.0 mice. All significant effects are listed in Supplementary Table 3C.
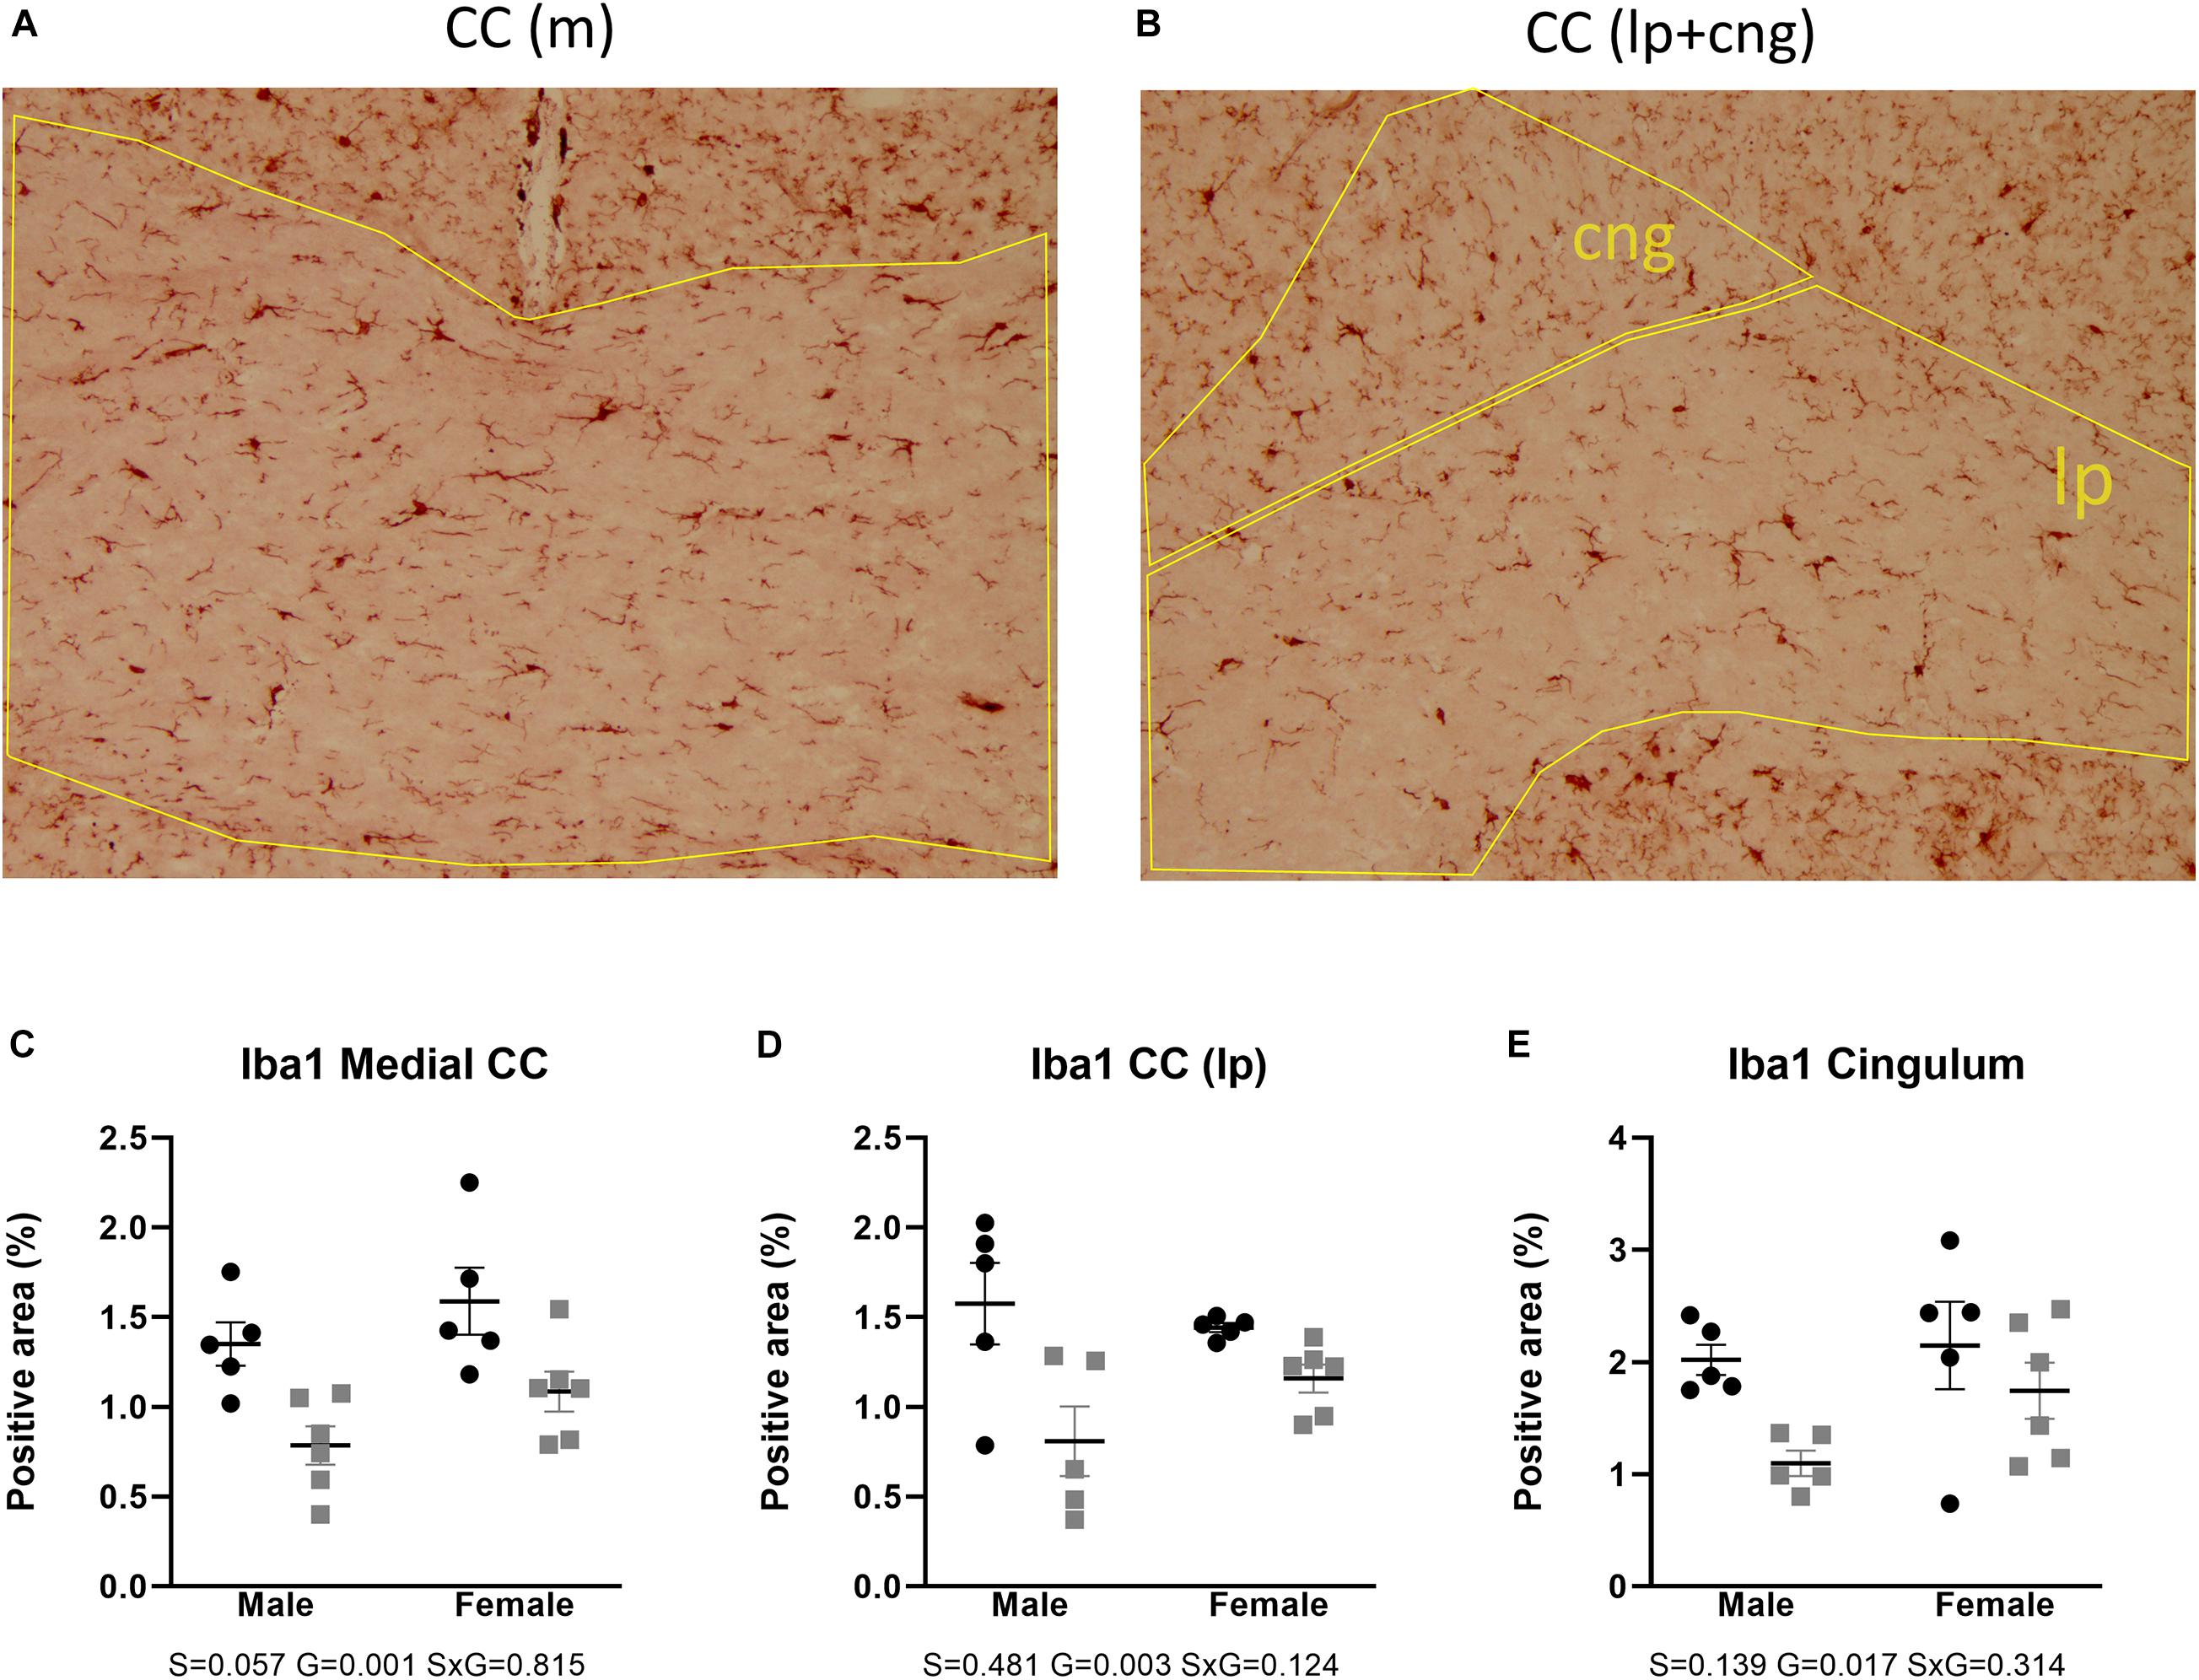
Figure 7. Expression of Iba1 in the corpus callosum (medial and lateroproximal) (A,B). Coded polygons in stained sections indicate neuroanatomical parcellations. In medial and lateroproximal (lp) areas, a decrease in expression in AdKO2.0 mice compared to that in WT mice was observed (C,D). In the cingulum (cng), there was a male-specific decrease in the AdKO2.0 mice (E). S, G, and S × G: p value of the source of variation (sex, genotype, and interaction, respectively). Black dots: wild type. Gray squares: AdKO2.0.
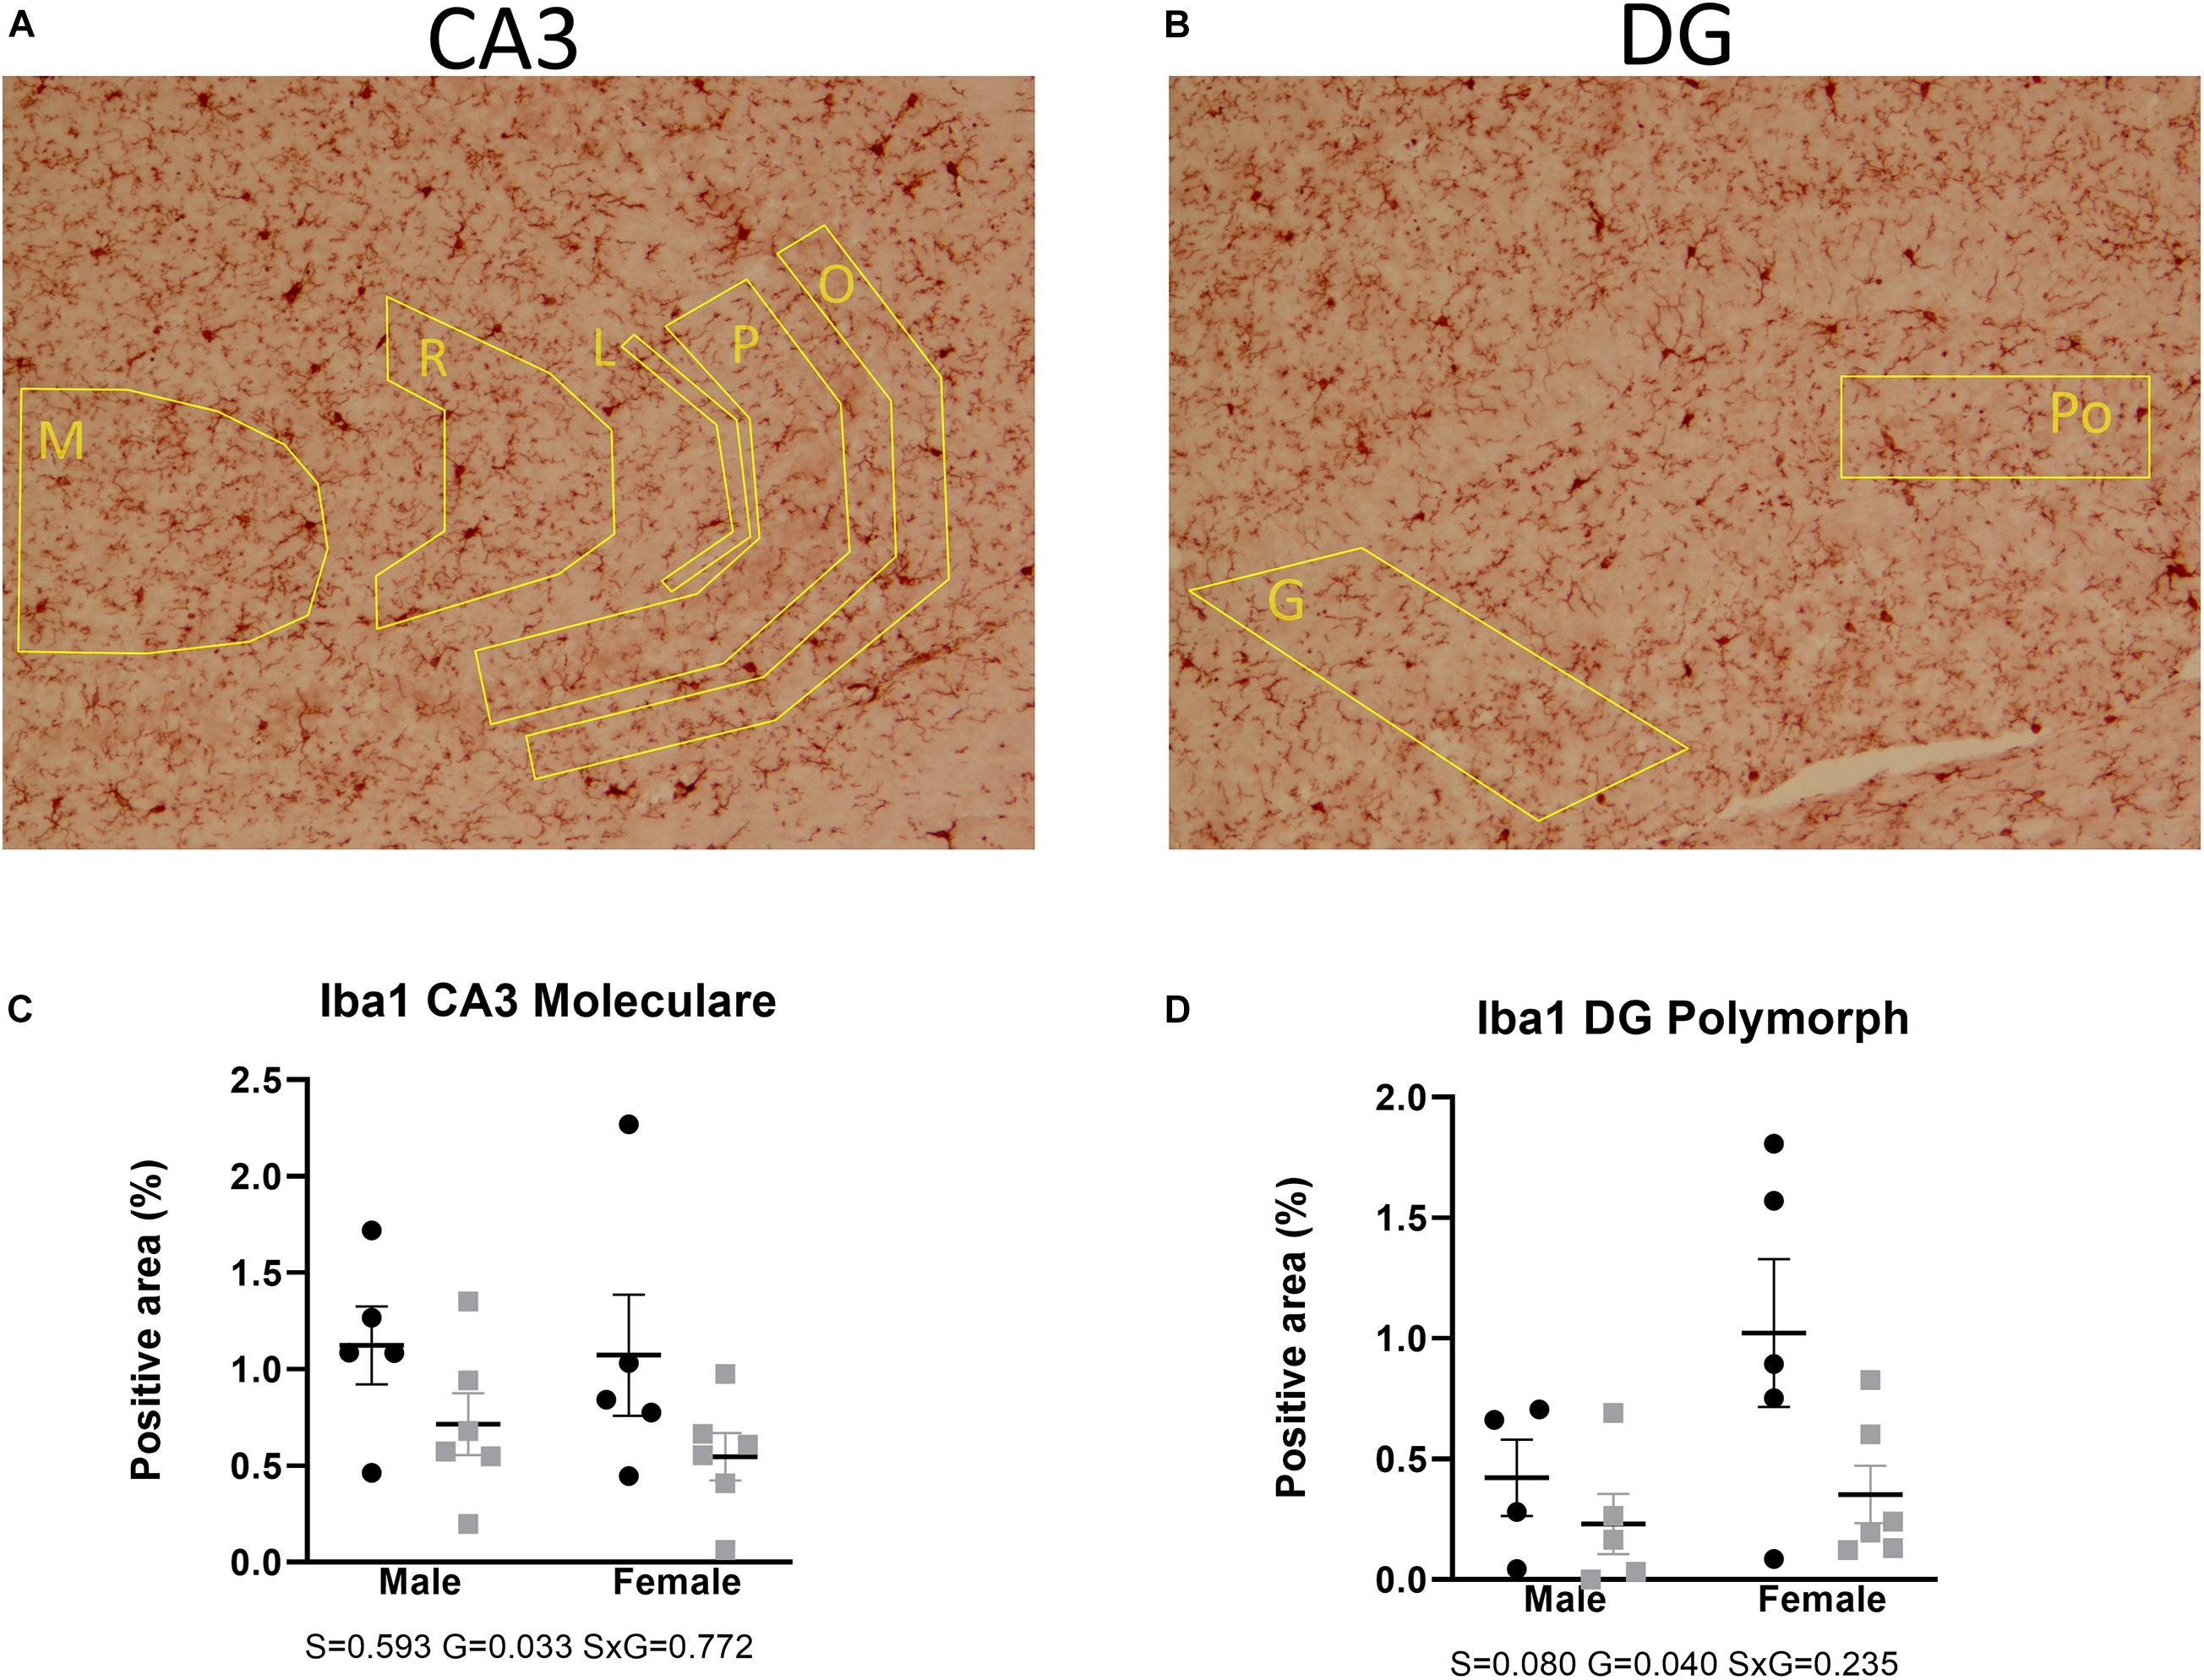
Figure 8. Expression of Iba1 in the hippocampal CA3 (A) and DG (B). Coded polygons in stained sections indicate neuroanatomical parcellations. In the stratum moleculare (M) of CA3, AdKO2.0 of both sexes showed a decrease in expression, compared to WT mice (C). In the polymorph (Po) layer of DG, there is a female-specific decrease in AdKO2.0 mice (D). Data were analyzed by two-way ANOVA, α: 0.05. S, G, and S × G: p value of the source of variation (sex, genotype, and interaction, respectively). Black dots: wild type. Gray squares: AdKO2.0.
Discussion
The present study used ADKO2.0 mice to study the consequences of long-term GC exposure for the brain. The AdKO2.0 mice had decreased relative volumes in a number of anterior cortical brain structures (cingulate cortex and somatosensory cortex) and in a number of white matter structures (corpus callosum, but also cerebellar white matter tracts). In contrast, we observed higher relative volumes in the medial amygdala, BNST, and hypothalamus. Markers for non-neuronal cell types showed that there were bidirectional effects on MBP, that is, a male-specific increase in immunoreactive area in the cingulate cortex and a sex-independent decrease in the somatosensory cortex and the hippocampus. Activated astrocyte and microglial markers GFAP and Iba1 were suppressed at both the anterior and hippocampal levels independent of sex.
Our analysis was based in one section per brain area per animal. This may increase technical variation, which would increase the chance of a false-negative result. For most markers, data provided clear indication of widespread changes, and we may underestimate the number of brain areas in which they might occur.
The volumetric changes found in the AdKO2.0 mouse brains were extensive and widespread. In principle, the whole-brain volume reduction reflects previous findings in human studies during active CS. Both pediatric and adult CS patients have a decrease of total brain volume (Bourdeau et al., 2002; Merke et al., 2005). In the analysis of individual brain areas, our results are in line with human studies that found changes in cerebellum and cortex volumes (including insular and cingulate regions) but found no effects when measuring the hippocampus or amygdala (Merke et al., 2005; Santos et al., 2014; Jiang et al., 2017a, b; Hou et al., 2020). However, other studies reported decreases in hippocampal volume (Starkman et al., 1992, 1999; Burkhardt et al., 2015), and this was also observed after chronic exogenous GC exposure (Zhang et al., 2015). In the AdKO2.0 brains, volumetric decreases were prominent in white matter areas, such as the corpus callosum and cingulate cingulum. In human studies, patients show smaller absolute volumes of white matter (Jiang et al., 2019; Tirosh et al., 2020), as well as reduced fractional anisotropy and increased mean diffusivity, which indicate white matter deterioration (Pires et al., 2015).
The overall parallels between the data from human imaging studies and ours indicated that the AdKO2.0 is an adequate model of CS effects on the brain and opened the opportunity to study the origins of such changes in further detail. It was particularly interesting that the corpus callosum was smaller than in wild-type mice, because this region has been described to still be affected in long-term remission (Andela et al., 2013; van der Werff et al., 2014). We decided therefore to focus our analyses on glial cells in areas that showed reduced relative volumes. We also included the hippocampus, given the extensive literature on its response to GCs.
We observed a decrease in MBP expression in the hippocampus, which may relate to the long-term loss of white matter integrity in remitted CS patients. We did not acquire diffusion tensor imaging (DTI) data in our mice; thus, a direct comparison is not possible. A body of literature suggests inhibiting effects of GCs on oligodendrocyte function and proliferation (Miguel-Hidalgo et al., 2019; hippocampus and pyriform cortex) and white matter (Dunlop et al., 1997; Alonso, 2000; Quinlivan et al., 2000). Work in multiple sclerosis models also supports negative effects of GCs on MBP expression and white matter (Sieve et al., 2004; Chari et al., 2006). The reduced MBP expression seems a logical correlation to the reduced white matter volume in the MRI data of our mice. However, the literature also reports protective effects of GCs, mainly in oligodendrocyte cultures (Kumar et al., 1989; Byravan and Campagnoni, 1994; Lee et al., 2008; Xu et al., 2009). A protective role was also observed in in vivo settings (Raschke et al., 2008; Sun et al., 2010). The contradictory literature on GC effects on MBP expression may reflect a biphasic effect, with low doses stimulating and high doses being detrimental (Almazan et al., 1986).
MBP immunoreactivity was higher in parts of the prefrontal cortex of AdKO2.0 mice, in apparent contrast with the lower volume observed in both active and remitted patients (Andela et al., 2013; Hou et al., 2020), as well as in our mice. The increased MBP immunoreactive surface area in conjunction with lower volume might be due to a different myelin organization, perhaps a more open myelin conformation (“loose myelin”). In fact, it has been observed that myelin lamellae fail to associate and compact after chronic GC treatment (7 days) in rats (Chari, 2014). Overall, our data suggest that in the mouse brain, this cingulate cortex has a particular sensitivity to long-term GC exposure.
The decrease in expression of GFAP is also in line with previous reports on the effects of GCs on astrocytes. It has been shown in other studies that GCs, e.g., corticosterone and dexamethasone, decreased cell viability and proliferation in astrocyte cultures and GFAP expression in vivo (Unemura et al., 2012; Guo et al., 2013; Zhang et al., 2015; Freitas et al., 2016). Similarly, chronic stress has been shown to decrease astrocytic cell size, count, and process length in the hippocampus and prelimbic cortex (Czeh et al., 2006; Banasr and Duman, 2008). Chronic stress also decreased expression of GFAP in the hippocampus and brainstem (Ye et al., 2011; Imbe et al., 2013; Lou et al., 2018). However, in some experimental settings, stressors and GCs led to increased astrocyte activation, in a GR-dependent manner (Revsin et al., 2009; Shields et al., 2012; Zia et al., 2015; Huet-Bello et al., 2017). It is well-known that GC effects can be context dependent (Meijer et al., 2019). Our data are in line with the notion that in the adult brain, in the absence of overt stressors or pathology, GCs suppress astrocyte activity.
Microglial immunoreactivity was clearly lower in the AdKO2.0 mice, an effect that is in line with a general immunosuppressive effects of chronically elevated GCs. In agreement with our data, previous works have described that microglia shrink and stop proliferating when corticosterone is added to microglial cultures (Tanaka et al., 1997; van Olst et al., 2018). Cell viability was compromised due to a cytotoxic effect of GCs, and this effect could be blocked by mifepristone (Nakatani et al., 2012; Cerqueira et al., 2013). Chronic corticosterone administration induces retraction of microglial processes in the hippocampus of mice (Park et al., 2011; Freitas et al., 2016), and adrenalectomy greatly increases microglial activation in the hippocampus and hypothalamus after acute stress; this response is ablated by exogenous corticosterone administration in rats (Sugama et al., 2013). In models of neuronal damage, the same trend has been observed for synthetic GCs (methylprednisolone and triamcinolone) (Schroter et al., 2009; Li et al., 2011).
A number of reports, however, described different effects. GCs may potentiate microglial responses via a priming mechanism, concomitant with an increase of Iba1 but suppression of cytokine production (Frank et al., 2014). Moreover, chronic restraint stress paradigms increased Iba1 immunoreactivity in various areas of the brain, including the anterior cingulate cortex and hippocampus (Tynan et al., 2010; Hinwood et al., 2012) and stimulated microglial process lengthening and branching out (Hinwood et al., 2013). However, this effect was observed only in large cells, and there might be a timing factor involved, as it has been also observed that induction of microglial proliferation by stress is time limited (Nair and Bonneau, 2006). The conflicting data may be resolved by taking time of exposure into account, since some studies showed stimulatory effect of short-term exposure but inhibitory effects of long-term exposure (Kreisel et al., 2014; Winkler et al., 2017). Our mutant mouse data are compatible with the latter, as they had been exposed to chronic hypercorticosteronemia (8–10 weeks).
The diversity of effects of GCs and stress on brain volume and on cell morphology might be related to age, duration of treatment, sex, stress context, or type of GC molecule, as synthetic GCs may differ from endogenous steroids in some of their effects (Meijer and de Kloet, 2017). Our model closely resembles the conditions of endogenous GC excess in humans in terms of physiological traits and, particularly, the time course of the endocrine imbalance. It remains to be determined to what extent the observed effects depend on direct activation of brain GRs and to what extent the context of, for example, changed metabolism-related factors contributes to the observed effects, as it is known that GR activity is also influenced by its association to (tissue-specific) coregulators and other transcription factors (Spaanderman et al., 2018; Viho et al., 2019). Thus, further studies are necessary to identify specific transcriptional changes that are associated with, and perhaps causal for, the changes in brain morphology that are apparent in these mice.
The present work is, to our knowledge, the first translational study to assess brain volumetric differences together with alterations in glial cell markers. In both aspects, we found significant changes in the selected brain regions. The hippocampus and prefrontal cortex are key regions in the brain for cognitive processing and integration, respectively. In human studies in CS patients both with active disease and in remission, various degrees of cognitive deficit are found. Cognitive performance has been related to myelin integrity, particularly in the hippocampus and prefrontal cortex (Nickel and Gu, 2018). In a similar manner, microglial morphological changes in the prefrontal cortex have been reported in obesity-related cognitive impaired rats (Bocarsly et al., 2015). We consider that our present results provide an opportunity to contribute to the study of participation of glial cells in cognition; thus, in the future, a number of neurobehavioral assays should be tested in the AdKO mice.
Data Availability Statement
The original contributions presented in the study are included in the article/Supplementary Material, further inquiries can be directed to the corresponding author/s.
Ethics Statement
The animal study was reviewed and approved by C2E2A (Comité d’Ethique pour l’Expérimentation Animale en Auvergne), Commission Nationale de Réflexion Ethique sur l’Expérimentation Animale, and Ministère français de l’Enseignement supérieur, de la Recherche et de l’Innovation. République Française.
Author Contributions
JA, LW, and OM designed experiment. IS-B, TD, and NM generated mouse models, managed mouse cohorts and tissues preparation for MRI, and histological analyses. GP and CK conducted MRI measurements. ES and LW analyzed MRI data. JA performed histological procedures and analyzed histological data. JA, LW, AP, AM, and OM prepared manuscript. LW, AM, and OM supervised the project. All authors contributed to the article and approved the submitted version.
Funding
This work was supported by CONACyT (440584), Initiative d’EXcellence-Initiative Science Innovation Territoires Economie (IDEX-ISITE) initiative 16-IDEX-0001 (CAP 20-25) and Agence Nationale pour la Recherche (ANR-14-CE12-0007-01; ANR-18-CE14-0012-02).
Conflict of Interest
The authors declare that the research was conducted in the absence of any commercial or financial relationships that could be construed as a potential conflict of interest.
Acknowledgments
We thank Matthijs van Eede and the Mouse Imaging Centre Toronto for their help with the image analysis pipeline.
Supplementary Material
The Supplementary Material for this article can be found online at: https://www.frontiersin.org/articles/10.3389/fnins.2021.604103/full#supplementary-material
Footnotes
References
Almazan, G., Honegger, P., Du Pasquier, P., and Matthieu, J. M. (1986). Dexamethasone stimulates the biochemical differentiation of fetal forebrain cells in reaggregating cultures. Dev. Neurosci. 8, 14–23. doi: 10.1159/000112237
Alonso, G. (2000). Prolonged corticosterone treatment of adult rats inhibits the proliferation of oligodendrocyte progenitors present throughout white and gray matter regions of the brain. Glia 31, 219–231. doi: 10.1002/1098-1136(200009)31
Andela, C. D., van der Werff, S. J., Pannekoek, J. N., van den Berg, S. M., Meijer, O. C., van Buchem, M. A., et al. (2013). Smaller grey matter volumes in the anterior cingulate cortex and greater cerebellar volumes in patients with long-term remission of Cushing’s disease: a case-control study. Eur. J. Endocrinol. 169, 811–819. doi: 10.1530/EJE-13-0471
Angeli, A., Osella, G., Ali, A., and Terzolo, M. (1997). Adrenal incidentaloma: an overview of clinical and epidemiological data from the National Italian Study Group. Horm. Res. 47, 279–283. doi: 10.1159/000185477
Avants, B. B., Epstein, C. L., Grossman, M., and Gee, J. C. (2008). Symmetric diffeomorphic image registration with cross-correlation: evaluating automated labeling of elderly and neurodegenerative brain. Med. Image Anal. 12, 26–41. doi: 10.1016/j.media.2007.06.004
Avants, B. B., Tustison, N. J., Song, G., Cook, P. A., Klein, A., and Gee, J. C. (2011). A reproducible evaluation of ANTs similarity metric performance in brain image registration. Neuroimage 54, 2033–2044. doi: 10.1016/j.neuroimage.2010.09.025
Banasr, M., and Duman, R. S. (2008). Glial loss in the prefrontal cortex is sufficient to induce depressive-like behaviors. Biol. Psych. 64, 863–870. doi: 10.1016/j.biopsych.2008.06.008
Bauduin, S., van der Pal, Z., Pereira, A. M., Meijer, O. C., Giltay, E. J., van der Wee, N. J. A., et al. (2020). Cortical thickness abnormalities in long-term remitted Cushing’s disease. Transl. Psych. 10:293. doi: 10.1038/s41398-020-00980-6
Bingham, N. C., Verma-Kurvari, S., Parada, L. F., and Parker, K. L. (2006). Development of a steroidogenic factor 1/Cre transgenic mouse line. Genesis 44, 419–424. doi: 10.1002/dvg.20231
Bocarsly, M. E., Fasolino, M., Kane, G. A., LaMarca, E. A., Kirschen, G. W., Karatsoreos, I. N., et al. (2015). Obesity diminishes synaptic markers, alters microglial morphology, and impairs cognitive function. Proc. Natl. Acad. Sci. U. S. A. 112, 15731–15736. doi: 10.1073/pnas.1511593112
Bourdeau, I., Bard, C., Noel, B., Leclerc, I., Cordeau, M. P., Belair, M., et al. (2002). Loss of brain volume in endogenous Cushing’s syndrome and its reversibility after correction of hypercortisolism. J. Clin. Endocrinol. Metab. 87, 1949–1954. doi: 10.1210/jcem.87.5.8493
Burkhardt, T., Ludecke, D., Spies, L., Wittmann, L., Westphal, M., and Flitsch, J. (2015). Hippocampal and cerebellar atrophy in patients with Cushing’s disease. Neurosurg. Focus. 39:E5. doi: 10.3171/2015.8.FOCUS15324
Byravan, S., and Campagnoni, A. T. (1994). Serum factors and hydrocortisone influence the synthesis of myelin basic proteins in mouse brain primary cultures. Int. J. Dev. Neurosci. 12, 343–351. doi: 10.1016/0736-5748(94)90084-1
Cerqueira, S. R., Oliveira, J. M., Silva, N. A., Leite-Almeida, H., Ribeiro-Samy, S., Almeida, A., et al. (2013). Microglia response and in vivo therapeutic potential of methylprednisolone-loaded dendrimer nanoparticles in spinal cord injury. Small 9, 738–749. doi: 10.1002/smll.201201888
Chari, D. M. (2014). How do corticosteroids influence myelin genesis in the central nervous system? Neural. Regen. Res. 9, 909–911. doi: 10.4103/1673-5374.133131
Chari, D. M., Zhao, C., Kotter, M. R., Blakemore, W. F., and Franklin, R. J. (2006). Corticosteroids delay remyelination of experimental demyelination in the rodent central nervous system. J. Neurosci. Res. 83, 594–605. doi: 10.1002/jnr.20763
Collins, D. L., Neelin, P., Peters, T. M., and Evans, A. C. (1994). Automatic 3D intersubject registration of MR volumetric data in standardized Talairach space. J. Comput. Assist. Tomogr. 18, 192–205.
Crespo, I., Esther, G. M., Santos, A., Valassi, E., Yolanda, V. G., De Juan-Delago, M., et al. (2014). Impaired decision-making and selective cortical frontal thinning in Cushing’s syndrome. Clin. Endocrinol. 81, 826–833. doi: 10.1111/cen.12564
Czeh, B., Simon, M., Schmelting, B., Hiemke, C., and Fuchs, E. (2006). Astroglial plasticity in the hippocampus is affected by chronic psychosocial stress and concomitant fluoxetine treatment. Neuropsychopharmacology 31, 1616–1626. doi: 10.1038/sj.npp.1300982
de Kloet, E. R., Joels, M., and Holsboer, F. (2005). Stress and the brain: from adaptation to disease. Nat. Rev. Neurosci. 6, 463–475. doi: 10.1038/nrn1683
Debono, M., Prema, A., Hughes, T. J., Bull, M., Ross, R. J., and Newell-Price, J. (2013). Visceral fat accumulation and postdexamethasone serum cortisol levels in patients with adrenal incidentaloma. J. Clin. Endocrinol. Metab. 98, 2383–2391. doi: 10.1210/jc.2012-4276
Dorr, A. E., Lerch, J. P., Spring, S., Kabani, N., and Henkelman, R. M. (2008). High resolution three-dimensional brain atlas using an average magnetic resonance image of 40 adult C57Bl/6J mice. Neuroimage 42, 60–69. doi: 10.1016/j.neuroimage.2008.03.037
Drelon, C., Berthon, A., Sahut-Barnola, I., Mathieu, M., Dumontet, T., Rodriguez, S., et al. (2016). PKA inhibits WNT signalling in adrenal cortex zonation and prevents malignant tumour development. Nat. Commun. 7:12751. doi: 10.1038/ncomms12751
Dumontet, T., Sahut-Barnola, I., Septier, A., Montanier, N., Plotton, I., Roucher-Boulez, F., et al. (2018). PKA signaling drives reticularis differentiation and sexually dimorphic adrenal cortex renewal. JCI. Insight 3:e98394. doi: 10.1172/jci.insight.98394
Dunlop, S. A., Archer, M. A., Quinlivan, J. A., Beazley, L. D., and Newnham, J. P. (1997). Repeated prenatal corticosteroids delay myelination in the ovine central nervous system. J. Matern. Fetal. Med. 6, 309–313. doi: 10.1002/(SICI)1520-6661(199711/12)6:6
Frank, M. G., Hershman, S. A., Weber, M. D., Watkins, L. R., and Maier, S. F. (2014). Chronic exposure to exogenous glucocorticoids primes microglia to pro-inflammatory stimuli and induces NLRP3 mRNA in the hippocampus. Psychoneuroendocrinology 40, 191–200. doi: 10.1016/j.psyneuen.2013.11.006
Freitas, A. E., Egea, J., Buendia, I., Gomez-Rangel, V., Parada, E., Navarro, E., et al. (2016). Agmatine, by Improving Neuroplasticity Markers and Inducing Nrf2, Prevents Corticosterone-Induced Depressive-Like Behavior in Mice. Mol. Neurobiol. 53, 3030–3045. doi: 10.1007/s12035-015-9182-6
Garrapa, G. G., Pantanetti, P., Arnaldi, G., Mantero, F., and Faloia, E. (2001). Body composition and metabolic features in women with adrenal incidentaloma or Cushing’s syndrome. J. Clin. Endocrinol. Metab. 86, 5301–5306. doi: 10.1210/jcem.86.11.8059
Genovese, C. R., Lazar, N. A., and Nichols, T. (2002). Thresholding of statistical maps in functional neuroimaging using the false discovery rate. Neuroimage 15, 870–878. doi: 10.1006/nimg.2001.1037
Guo, W. Z., Miao, Y. L., An, L. N., Wang, X. Y., Pan, N. L., Ma, Y. Q., et al. (2013). Midazolam provides cytoprotective effect during corticosterone-induced damages in rat astrocytes by stimulating steroidogenesis. Neurosci. Lett. 547, 53–58. doi: 10.1016/j.neulet.2013.05.014
Hinwood, M., Morandini, J., Day, T. A., and Walker, F. R. (2012). Evidence that microglia mediate the neurobiological effects of chronic psychological stress on the medial prefrontal cortex. Cereb. Cortex. 22, 1442–1454. doi: 10.1093/cercor/bhr229
Hinwood, M., Tynan, R. J., Charnley, J. L., Beynon, S. B., Day, T. A., and Walker, F. R. (2013). Chronic stress induced remodeling of the prefrontal cortex: structural re-organization of microglia and the inhibitory effect of minocycline. Cereb. Cortex. 23, 1784–1797. doi: 10.1093/cercor/bhs151
Hochberg, I., Harvey, I., Tran, Q. T., Stephenson, E. J., Barkan, A. L., Saltiel, A. R., et al. (2015). Gene expression changes in subcutaneous adipose tissue due to Cushing’s disease. J. Mol. Endocrinol. 55, 81–94. doi: 10.1530/JME-15-0119
Hou, B., Gao, L., Shi, L., Luo, Y., Guo, X., Young, G. S., et al. (2020). Reversibility of impaired brain structures after transsphenoidal surgery in Cushing’s disease: a longitudinal study based on an artificial intelligence-assisted tool. J. Neurosurg. 3, 1–10. doi: 10.3171/2019.10.JNS191400
Huet-Bello, O., Ruvalcaba-Delgadillo, Y., Feria-Velasco, A., Gonzalez-Castaneda, R. E., Garcia-Estrada, J., Macias-Islas, M. A., et al. (2017). Environmental noise exposure modifies astrocyte morphology in hippocampus of young male rats. Noise. Health 19, 239–244. doi: 10.4103/nah.NAH_97_16
Imbe, H., Kimura, A., Donishi, T., and Kaneoke, Y. (2013). Effects of restraint stress on glial activity in the rostral ventromedial medulla. Neuroscience 241, 10–21. doi: 10.1016/j.neuroscience.2013.03.008
Jiang, H., He, N. Y., Sun, Y. H., Jian, F. F., Bian, L. G., Shen, J. K., et al. (2017a). Altered gray and white matter microstructure in Cushing’s disease: A diffusional kurtosis imaging study. Brain Res. 1665, 80–87. doi: 10.1016/j.brainres.2017.04.007
Jiang, H., Liu, C., Pan, S. J., Ren, J., He, N. Y., Sun, Y. H., et al. (2019). Reversible and the irreversible structural alterations on brain after resolution of hypercortisolism in Cushing’s disease. Steroids 151:108457. doi: 10.1016/j.steroids.2019.108457
Jiang, H., Ren, J., He, N. Y., Liu, C., Sun, Y. H., Jian, F. F., et al. (2017b). Volumetric magnetic resonance imaging analysis in patients with short-term remission of Cushing’s disease. Clin. Endocrinol. 87, 367–374. doi: 10.1111/cen.13381
Kadmiel, M., and Cidlowski, J. A. (2013). Glucocorticoid receptor signaling in health and disease. Trends Pharmacol. Sci. 34, 518–530. doi: 10.1016/j.tips.2013.07.003
Kirschner, L. S., Kusewitt, D. F., Matyakhina, L., Towns, W. H. II, Carney, J. A., Westphal, H., et al. (2005). A mouse model for the Carney complex tumor syndrome develops neoplasia in cyclic AMP-responsive tissues. Cancer Res. 65, 4506–4514. doi: 10.1158/0008-5472.CAN-05-0580
Koorneef, L. L., Bogaards, M., Reinders, M. J. T., Meijer, O. C., and Mahfouz, A. (2018). How Metabolic State May Regulate Fear: Presence of Metabolic Receptors in the Fear Circuitry. Front. Neurosci. 12:594. doi: 10.3389/fnins.2018.00594
Kreisel, T., Frank, M. G., Licht, T., Reshef, R., Ben-Menachem-Zidon, O., Baratta, M. V., et al. (2014). Dynamic microglial alterations underlie stress-induced depressive-like behavior and suppressed neurogenesis. Mol. Psychiatry 19, 699–709. doi: 10.1038/mp.2013.155
Kumar, S., Cole, R., Chiappelli, F., and de Vellis, J. (1989). Differential regulation of oligodendrocyte markers by glucocorticoids: post-transcriptional regulation of both proteolipid protein and myelin basic protein and transcriptional regulation of glycerol phosphate dehydrogenase. Proc. Natl. Acad. Sci. U. S. A. 86, 6807–6811. doi: 10.1073/pnas.86.17.6807
Lee, J. M., Yan, P., Xiao, Q., Chen, S., Lee, K. Y., Hsu, C. Y., et al. (2008). Methylprednisolone protects oligodendrocytes but not neurons after spinal cord injury. J. Neurosci. 28, 3141–3149. doi: 10.1523/JNEUROSCI.5547-07.2008
Lerch, J., Hammill, C., van Eede, M., and Cassel, D. (2017). RMINC: Statistical Tools for Medical Imaging NetCDF (MINC) Files. R package version 1.5.2.1. http://mouse-imaging-centre.github.io/RMINC (accessed May 19, 2017).
Li, J. Y., Xie, W., Strong, J. A., Guo, Q. L., and Zhang, J. M. (2011). Mechanical hypersensitivity, sympathetic sprouting, and glial activation are attenuated by local injection of corticosteroid near the lumbar ganglion in a rat model of neuropathic pain. Reg. Anesth. Pain Med. 36, 56–62. doi: 10.1097/AAP.0b013e318203087f
Lou, Y. X., Li, J., Wang, Z. Z., Xia, C. Y., and Chen, N. H. (2018). Glucocorticoid receptor activation induces decrease of hippocampal astrocyte number in rats. Psychopharmacology 235, 2529–2540. doi: 10.1007/s00213-018-4936-2
McEwen, B. S., Bowles, N. P., Gray, J. D., Hill, M. N., Hunter, R. G., Karatsoreos, I. N., et al. (2015). Mechanisms of stress in the brain. Nat. Neurosci. 18, 1353–1363. doi: 10.1038/nn.4086
Meijer, O. C., and de Kloet, E. R. (2017). A Refill for the Brain Mineralocorticoid Receptor: The Benefit of Cortisol Add-On to Dexamethasone Therapy. Endocrinology 158, 448–454. doi: 10.1210/en.2016-1495
Meijer, O. C., Buurstede, J. C., and Schaaf, M. J. M. (2019). Corticosteroid Receptors in the Brain: Transcriptional Mechanisms for Specificity and Context-Dependent Effects. Cell Moll. Neurobiol. 39, 539–549. doi: 10.1007/s10571-018-0625-2
Merke, D. P., Giedd, J. N., Keil, M. F., Mehlinger, S. L., Wiggs, E. A., Holzer, S., et al. (2005). Children experience cognitive decline despite reversal of brain atrophy one year after resolution of Cushing syndrome. J. Clin. Endocrinol. Metab. 90, 2531–2536. doi: 10.1210/jc.2004-2488
Miguel-Hidalgo, J. J., Carter, K., Deloach, P. H., Sanders, L., and Pang, Y. (2019). Glucocorticoid-Induced Reductions of Myelination and Connexin 43 in Mixed Central Nervous System Cell Cultures Are Prevented by Mifepristone. Neuroscience 411, 255–269. doi: 10.1016/j.neuroscience.2019.05.050
Nair, A., and Bonneau, R. H. (2006). Stress-induced elevation of glucocorticoids increases microglia proliferation through NMDA receptor activation. J. Neuroimmunol. 171, 72–85. doi: 10.1016/j.jneuroim.2005.09.012
Nakatani, Y., Amano, T., Tsuji, M., and Takeda, H. (2012). Corticosterone suppresses the proliferation of BV2 microglia cells via glucocorticoid, but not mineralocorticoid receptor. Life Sci. 91, 761–770. doi: 10.1016/j.lfs.2012.08.019
Nickel, M., and Gu, C. (2018). Regulation of Central Nervous System Myelination in Higher Brain Functions. Neural. Plast 2018, 6436453. doi: 10.1155/2018/6436453
Nieman, B. J., Flenniken, A. M., Adamson, S. L., Henkelman, R. M., and Sled, J. G. (2006). Anatomical phenotyping in the brain and skull of a mutant mouse by magnetic resonance imaging and computed tomography. Physiol. Genom. 24, 154–162. doi: 10.1152/physiolgenomics.00217.2005
Park, J. H., Yoo, K. Y., Lee, C. H., Kim, I. H., Shin, B. N., Choi, J. H., et al. (2011). Comparison of glucocorticoid receptor and ionized calcium-binding adapter molecule 1 immunoreactivity in the adult and aged gerbil hippocampus following repeated restraint stress. Neurochem. Res. 36, 1037–1045. doi: 10.1007/s11064-011-0444-z
Paxinos, G., and Franklin, K. B. J. (2001). The Mouse Brain in Stereotaxic Coordinates. Second Edition. San Diego: Academic Press.
Pires, P., Santos, A., Vives-Gilabert, Y., Webb, S. M., Sainz-Ruiz, A., Resmini, E., et al. (2015). White matter alterations in the brains of patients with active, remitted, and cured cushing syndrome: a DTI study. AJNR Am. J. Neuroradiol. 36, 1043–1048. doi: 10.3174/ajnr.A4322
Pujols, L., Mullol, J., Roca-Ferrer, J., Torrego, A., Xaubet, A., Cidlowski, J. A., et al. (2002). Expression of glucocorticoid receptor alpha- and beta-isoforms in human cells and tissues. Am. J. Physiol. Cell Physiol. 283, C1324–C1331. doi: 10.1152/ajpcell.00363.2001
Quinlivan, J. A., Archer, M. A., Evans, S. F., Newnham, J. P., and Dunlop, S. A. (2000). Fetal sciatic nerve growth is delayed following repeated maternal injections of corticosteroid in sheep. J. Perinat. Med. 28, 26–33. doi: 10.1515/JPM.2000.004
Raschke, C., Schmidt, S., Schwab, M., and Jirikowski, G. (2008). Effects of betamethasone treatment on central myelination in fetal sheep: an electron microscopical study. Anat. Histol. Embryol. 37, 95–100. doi: 10.1111/j.1439-0264.2007.00807.x
Resmini, E., Santos, A., Gomez-Anson, B., Vives, Y., Pires, P., Crespo, I., et al. (2012). Verbal and visual memory performance and hippocampal volumes, measured by 3-Tesla magnetic resonance imaging, in patients with Cushing’s syndrome. J. Clin. Endocrinol. Metab. 97, 663–671. doi: 10.1210/jc.2011-2231
Revsin, Y., Rekers, N. V., Louwe, M. C., Saravia, F. E., De Nicola, A. F., de Kloet, E. R., et al. (2009). Glucocorticoid receptor blockade normalizes hippocampal alterations and cognitive impairment in streptozotocin-induced type 1 diabetes mice. Neuropsychopharmacology 34, 747–758. doi: 10.1038/npp.2008.136
Richards, K., Watson, C., Buckley, R. F., Kurniawan, N. D., Yang, Z., Keller, M. D., et al. (2011). Segmentation of the mouse hippocampal formation in magnetic resonance images. Neuroimage 58, 732–740. doi: 10.1016/j.neuroimage.2011.06.025
Sahut-Barnola, I., de Joussineau, C., Val, P., Lambert-Langlais, S., Damon, C., Lefrancois-Martinez, A. M., et al. (2010). Cushing’s syndrome and fetal features resurgence in adrenal cortex-specific Prkar1a knockout mice. PLoS Genet 6:e1000980. doi: 10.1371/journal.pgen.1000980
Santos, A., Resmini, E., Crespo, I., Pires, P., Vives-Gilabert, Y., Granell, E., et al. (2014). Small cerebellar cortex volume in patients with active Cushing’s syndrome. Eur. J. Endocrinol. 171, 461–469. doi: 10.1530/EJE-14-0371
Schroter, A., Lustenberger, R. M., Obermair, F. J., and Thallmair, M. (2009). High-dose corticosteroids after spinal cord injury reduce neural progenitor cell proliferation. Neuroscience 161, 753–763. doi: 10.1016/j.neuroscience.2009.04.016
Sharma, S. T., Nieman, L. K., and Feelders, R. A. (2015). Comorbidities in Cushing’s disease. Pituitary 18, 188–194. doi: 10.1007/s11102-015-0645-6
Shields, A., Thomson, M., Winter, V., Coalson, J., and Rees, S. (2012). Repeated courses of antenatal corticosteroids have adverse effects on aspects of brain development in naturally delivered baboon infants. Pediatr. Res. 71, 661–667. doi: 10.1038/pr.2012.18
Sieve, A. N., Steelman, A. J., Young, C. R., Storts, R., Welsh, T. H., Welsh, C. J., et al. (2004). Chronic restraint stress during early Theiler’s virus infection exacerbates the subsequent demyelinating disease in SJL mice. J. Neuroimmunol. 155, 103–118. doi: 10.1016/j.jneuroim.2004.06.006
Simmons, N. E., Do, H. M., Lipper, M. H., and Laws, E. R. Jr. (2000). Cerebral atrophy in Cushing’s disease. Surg. Neurol. 53, 72–76. doi: 10.1016/s0090-3019(99)00197-4
Smith, S. M., and Vale, W. W. (2006). The role of the hypothalamic-pituitary-adrenal axis in neuroendocrine responses to stress. Dial. Clin. Neurosci. 8, 383–395.
Spaanderman, D. C. E., Nixon, M., Buurstede, J. C., Sips, H. C., Schilperoort, M., Kuipers, E. N., et al. (2018). Androgens modulate glucocorticoid receptor activity in adipose tissue and liver. J. Endocrinol. 1, 18–0503.R. doi: 10.1530/JOE-18-0503
Starkman, M. N., Gebarski, S. S., Berent, S., and Schteingart, D. E. (1992). Hippocampal formation volume, memory dysfunction, and cortisol levels in patients with Cushing’s syndrome. Biol. Psychiatry 32, 756–765. doi: 10.1016/0006-3223(92)90079-f
Starkman, M. N., Giordani, B., Gebarski, S. S., Berent, S., Schork, M. A., and Schteingart, D. E. (1999). Decrease in cortisol reverses human hippocampal atrophy following treatment of Cushing’s disease. Biol. Psychiatry 46, 1595–1602. doi: 10.1016/s0006-3223(99)00203-6
Steadman, P. E., Ellegood, J., Szulc, K. U., Turnbull, D. H., Joyner, A. L., Henkelman, R. M., et al. (2014). Genetic effects on cerebellar structure across mouse models of autism using a magnetic resonance imaging atlas. Autism. Res. 7, 124–137. doi: 10.1002/aur.1344
Sugama, S., Takenouchi, T., Fujita, M., Kitani, H., Conti, B., and Hashimoto, M. (2013). Corticosteroids limit microglial activation occurring during acute stress. Neuroscience 232, 13–20. doi: 10.1016/j.neuroscience.2012.12.012
Sun, Y. Y., Wang, C. Y., Hsu, M. F., Juan, S. H., Chang, C. Y., Chou, C. M., et al. (2010). Glucocorticoid protection of oligodendrocytes against excitotoxin involving hypoxia-inducible factor-1alpha in a cell-type-specific manner. J. Neurosci. 30, 9621–9630. doi: 10.1523/JNEUROSCI.2295-10.2010
Tanaka, J., Fujita, H., Matsuda, S., Toku, K., Sakanaka, M., and Maeda, N. (1997). Glucocorticoid- and mineralocorticoid receptors in microglial cells: the two receptors mediate differential effects of corticosteroids. Glia 20, 23–37.
Tirosh, A., RaviPrakash, H., Papadakis, G. Z., Tatsi, C., Belyavskaya, E., Charalampos, L., et al. (2020). Computerized Analysis of Brain MRI Parameter Dynamics in Young Patients With Cushing Syndrome-A Case-Control Study. J. Clin. Endocrinol. Metab. 105, e2069–e2077. doi: 10.1210/clinem/dgz303
Tiryakioglu, O., Ugurlu, S., Yalin, S., Yirmibescik, S., Caglar, E., Yetkin, D. O., et al. (2010). Screening for Cushing’s syndrome in obese patients. Clinics 65, 9–13. doi: 10.1590/S1807-59322010000100003
Tynan, R. J., Naicker, S., Hinwood, M., Nalivaiko, E., Buller, K. M., Pow, D. V., et al. (2010). Chronic stress alters the density and morphology of microglia in a subset of stress-responsive brain regions. Brain Behav. Immun. 24, 1058–1068. doi: 10.1016/j.bbi.2010.02.001
Ullmann, J. F., Watson, C., Janke, A. L., Kurniawan, N. D., and Reutens, D. C. (2013). A segmentation protocol and MRI atlas of the C57BL/6J mouse neocortex. Neuroimage 78, 196–203. doi: 10.1016/j.neuroimage.2013.04.008
Unemura, K., Kume, T., Kondo, M., Maeda, Y., Izumi, Y., and Akaike, A. (2012). Glucocorticoids decrease astrocyte numbers by reducing glucocorticoid receptor expression in vitro and in vivo. J. Pharmacol. Sci. 119, 30–39. doi: 10.1254/jphs.12047fp
van der Werff, S. J., Andela, C. D., Nienke Pannekoek, J., Meijer, O. C., van Buchem, M. A., Rombouts, S. A., et al. (2014). Widespread reductions of white matter integrity in patients with long-term remission of Cushing’s disease. Neuroimage Clin. 4, 659–667. doi: 10.1016/j.nicl.2014.01.017
van Olst, L., Bielefeld, P., Fitzsimons, C. P., de Vries, H. E., and Schouten, M. (2018). Glucocorticoid-mediated modulation of morphological changes associated with aging in microglia. Aging Cell 17:e12790. doi: 10.1111/acel.12790
Viho, E. M. G., Buurstede, J. C., Mahfouz, A., Koorneef, L. L., van Weert, L., Houtman, R., et al. (2019). Corticosteroid Action in the Brain: The Potential of Selective Receptor Modulation. Neuroendocrinology 109, 266–276. doi: 10.1159/000499659
Winkler, Z., Kuti, D., Ferenczi, S., Gulyas, K., Polyak, A., and Kovacs, K. J. (2017). Impaired microglia fractalkine signaling affects stress reaction and coping style in mice. Behav. Brain Res. 334, 119–128. doi: 10.1016/j.bbr.2017.07.023
Xu, J., Chen, S., Chen, H., Xiao, Q., Hsu, C. Y., Michael, D., et al. (2009). STAT5 mediates antiapoptotic effects of methylprednisolone on oligodendrocytes. J. Neurosci. 29, 2022–2026. doi: 10.1523/JNEUROSCI.2621-08.2009
Ye, Y., Wang, G., Wang, H., and Wang, X. (2011). Brain-derived neurotrophic factor (BDNF) infusion restored astrocytic plasticity in the hippocampus of a rat model of depression. Neurosci. Lett. 503, 15–19. doi: 10.1016/j.neulet.2011.07.055
Zhang, H., Zhao, Y., and Wang, Z. (2015). Chronic corticosterone exposure reduces hippocampal astrocyte structural plasticity and induces hippocampal atrophy in mice. Neurosci. Lett. 592, 76–81. doi: 10.1016/j.neulet.2015.03.006
Zia, M. T., Vinukonda, G., Vose, L. R., Bhimavarapu, B. B., Iacobas, S., Pandey, N. K., et al. (2015). Postnatal glucocorticoid-induced hypomyelination, gliosis, and neurologic deficits are dose-dependent, preparation-specific, and reversible. Exp. Neurol. 263, 200–213. doi: 10.1016/j.expneurol.2014.09.013
Keywords: glucocorticoid, glia, myelin basic protein, glial fibrillary acidic protein, ionized calcium binding adaptor molecule 1
Citation: Amaya JM, Suidgeest E, Sahut-Barnola I, Dumontet T, Montanier N, Pagès G, Keller C, van der Weerd L, Pereira AM, Martinez A and Meijer OC (2021) Effects of Long-Term Endogenous Corticosteroid Exposure on Brain Volume and Glial Cells in the AdKO Mouse. Front. Neurosci. 15:604103. doi: 10.3389/fnins.2021.604103
Received: 08 September 2020; Accepted: 06 January 2021;
Published: 10 February 2021.
Edited by:
Gustavo Pacheco-Lopez, Autonomous Metropolitan University, MexicoReviewed by:
Alexander A. Sosunov, Columbia University, United StatesAxayacatl Morales, Autonomous Metropolitan University, Mexico
Copyright © 2021 Amaya, Suidgeest, Sahut-Barnola, Dumontet, Montanier, Pagès, Keller, van der Weerd, Pereira, Martinez and Meijer. This is an open-access article distributed under the terms of the Creative Commons Attribution License (CC BY). The use, distribution or reproduction in other forums is permitted, provided the original author(s) and the copyright owner(s) are credited and that the original publication in this journal is cited, in accordance with accepted academic practice. No use, distribution or reproduction is permitted which does not comply with these terms.
*Correspondence: Onno C. Meijer, Ty5DLk1laWplckBsdW1jLm5s