 Marie Sprengell
 Britta Kubera
 Achim Peters
- Center of Brain, Behavior and Metabolism (CBBM), University of Lübeck, Lübeck, Germany
The gluco-lipostatic theory and its modern variants assume that blood glucose and energy stores are controlled in closed-loop feedback processes. The Selfish Brain theory is based on the same assumptions, but additionally postulates that the brain, as an independent energy compartment, self-regulates its energy concentration with the highest priority. In some clinical situations these two theories make opposite predictions. To investigate one of these situations, namely caloric restriction, we formulated a hypothesis which, if confirmed, would match the predictions of the Selfish Brain theory—but not those of the gluco-lipostatic theory. Hypothesis: Calorie restriction causes minor mass (energy) changes in the brain as opposed to major changes in the body. We conducted a systematic review of caloric-restriction studies to test whether or not the evaluated studies confirmed this hypothesis. We identified 3,157 records, screened 2,804 works by title or abstract, and analyzed 232 by full text. According to strict selection criteria (set out in our PROSPERO preregistration, complying with PRISMA guidelines, and the pre-defined hypothesis-decision algorithm), 8 papers provided enough information to decide on the hypothesis: In animals, high-energy phosphates were measured by 31P-nuclear magnetic resonance, and organ and total body weights were measured by scales, while in humans organ sizes were determined by magnetic resonance imaging. All 8 decidable papers confirmed the hypothesis, none spoke against it. The evidence presented here clearly shows that the most accurate predictions are possible with a theory that regards the brain as independently self-regulating and as occupying a primary position in a hierarchically organized energy metabolism.
Introduction
In modern obesity research, most scientists support the theoretical notion that food intake is regulated by closed-loop feedback processes. Already in the 1950s, Mayer came up with the idea that blood glucose is the main regulated quantity in human energy metabolism (Mayer, 1953). Accordingly, a low blood glucose concentration stimulates food intake, which in turn restores a normal blood glucose level. Mayer's framework was called glucostatic theory. At the same time, Kennedy made a counterproposal (Kennedy, 1953). He believed that body weight was the regulated quantity. He postulated that a signal from the body energy stores controls food intake. Yet he could not name this signal. Kennedy's lipostatic theory gained momentum in the 1990s when leptin was identified as the substance from adipose tissue that he had suspected (Zhang et al., 1994).
From today's perspective, Mayer and Kennedy were essentially right, and there are many modern variants of the gluco-lipostatic theory (Chaput and Tremblay, 2009; Schwartz et al., 2017). All these variants have in common that the brain is regarded as passively supplied from the blood. Proponents of these variants see, from a control theory perspective, two factors causing obesity: first, a stimulatory input into the feedback loop, e.g., hedonic eating (Lowe and Butryn, 2007), or second, a disruption in the feedback loop, such as lack of appetite suppression due to leptin resistance, central insulin resistance or the failure of gastrointestinal hormones (Chaudhri et al., 2006; Myers et al., 2008; Kullmann et al., 2020).
At the beginning of the millennium a rival theory was formulated, the Selfish Brain theory (Peters et al., 2004). This framework expanded the gluco-lipostatic theory by a new compartment, the brain as an independent, self-regulating organ delimited by the blood-brain barrier. The theory postulated a primacy that in case of malnutrition or stress there is a vital ability of the human brain, namely to give priority to the own energy metabolism. The postulate was supported by evidence from the 1990s, which showed that when a neuron fires and needs more energy to do so, it pulls glucose from the blood via the astrocytes (Pellerin and Magistretti, 1994). Against this background, the brain turns into an active part in energy metabolism according to the principle of “energy on demand” (Magistretti et al., 1999). The Selfish Brain theory took into account additional—previously unnamed—causes of obesity, such as the brain needing less energy and demanding less energy from the body (e.g., by stress habituation or central suppressant drugs)—so that energy accumulates in the body (Peters and McEwen, 2015; Kuzawa and Blair, 2019). As in economic supply chains, where goods stay on the shelves when customers don't buy, energy accumulates in adipose tissue when the brain demands less energy (Peters and Langemann, 2009).
From an epistemological point of view, however, the introduction of an entity such as the selfish brain also has downsides. Because a good theory should be as simple as possible and make the most accurate predictions (Gilad-Bachrach et al., 2003). Such an extension with the brain as an independent self-regulated compartment makes the Selfish Brain theory more complex than the gluco-lipostatic theory.
Given its higher complexity, the Selfish Brain theory has to face the question whether it can actually make more accurate predictions than the gluco-lipostatic theory. To our knowledge, both theoretical approaches can explain most of the available experimental data. However, in one crucial point the two theories make opposite predictions. On this point, we formulated a hypothesis which, in case of its confirmation, would match the predictions of the Selfish Brain theory—but not those of the simpler gluco-lipostatic theory:
Hypothesis: Calorie restriction causes minor mass (energy) changes in the brain as opposed to major changes in the body.
To this end, we conducted a systematic review to test whether the caloric restriction studies found actually confirm this hypothesis or not.
Materials and Methods
Prior to our work on this systematic review, our protocol was registered on Prospero on 30th of January 2020, and an updated version was published on 28th of September 2020 (International prospective register of systematic reviews; CRD42020156816). We complied with the PRISMA (preferred reporting items for systematic reviews and meta-analyses) guidelines for systematic reviews of interventions (Moher et al., 2009).
Search Strategies
We conducted a systematic search of the literature to identify studies in humans and other mammals that focused clearly on how energy restriction affects energy states in the brain and body. The search strategies were developed by one reviewer and discussed with two other reviewers. The databases of MEDLINE and BIOSIS Previews were searched from their inception to 30 March 2020, using a combination of keywords and in case of the first database MeSH terms. Thereby, keywords were identified based on previous knowledge, initial research, and a thesaurus. The full MEDLINE and BIOSIS search strategies are provided in the Supplementary Information. Briefly, the search strategies included terms relating to the intervention (caloric restriction), to outcomes (brain and peripheral energy states) and to methodical approach (experimental study), combined by the Boolean operator AND. Synonyms for terms were combined with the operator OR.
Study Selection
The following criteria were used to include or exclude articles for our systematic review. Only studies published in English or German were included. Only original full research paper were included. Regarding humans, interventional studies were included, either clinical randomized controlled trials (with a non-exposed control group) or standardized laboratory experiments (within-subject-design or between-subject-design). Regarding animals, interventional studies as standardized laboratory experiments (with a non-exposed control group) were included (within-subject-design or between-subject-design). We included studies with healthy humans or other mammalian species, regardless of gender or physical phenotype, with subjects who have neither a known disease nor a drug regimen proven to interfere with energy metabolism (see Supplementary Information for details). We did not include trials in pregnant individuals or fetuses, nor in ovariectomized or genetically modified individuals with altered energy metabolism. We have not included studies in which caloric restriction was induced by an increase in litter size, nor those in which more than one intervention was performed. Particular attention is paid to the distinction between the central and peripheral energy states. Only studies that map both compartments allow us to make comparisons and draw conclusions about the energy distribution between brain and body. Therefore, we only included studies that examined the brain as a whole, or at least most of it (and not just specific regions, such as the hippocampus). And we only included studies that provided information about both central and peripheral energy states.
The selection of the articles was performed in two steps. At each step, reasons for excluding articles were reported (Figure 1). First, one reviewer screened the article titles or abstracts against the inclusion and exclusion criteria. This first step of article selection was checked by another reviewer. When a discrepancy occurred regarding the inclusion or exclusion of an article, the two reviewers discussed it until agreement was reached. Otherwise, disagreements were resolved by consulting the third reviewer. Second, two reviewers independently selected the remaining articles by analyzing the full text. Again, disagreements regarding the inclusion or exclusion of an article were resolved by discussion among each other or, if necessary, by consultation with the third reviewer. In this step of full text analysis, most studies (n = 188) were excluded since these studies provided outcomes of only the central nervous energy state or only the peripheral energy state, but not both.
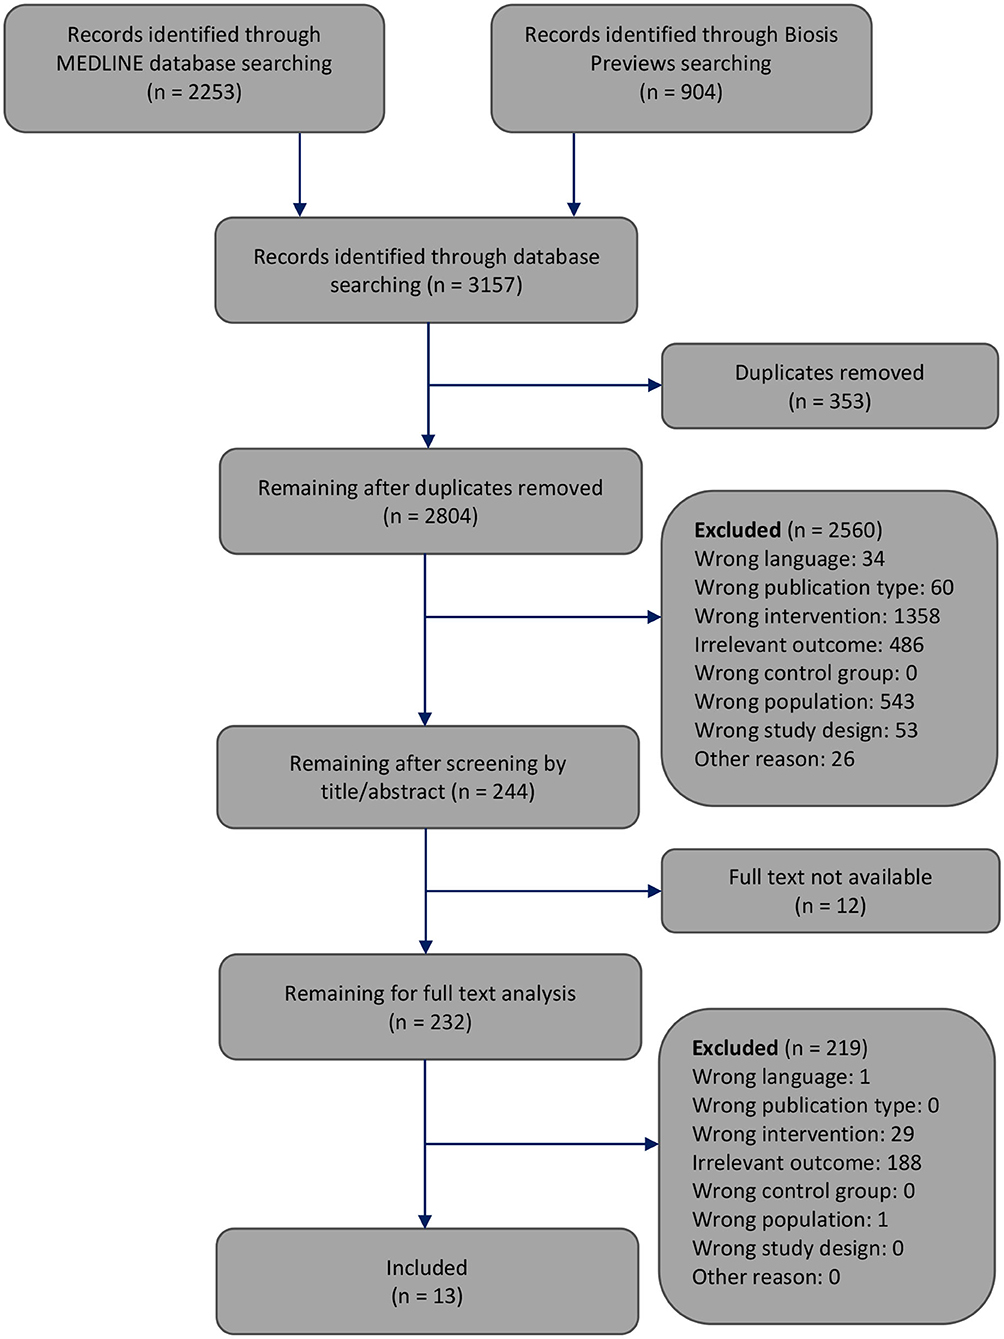
Figure 1. Flowchart through different phases of the systematic review modified according to Moher's publication (Moher et al., 2009).
Data Extraction
Data from all of the 13 included studies were extracted by one reviewer, independently checked by two other reviewers, and tabulated alphabetically. Where results were reported for subgroups within the same article, we extracted the data separately for these subgroups. We recorded the population, sample size, kind of intervention and duration, statistical test applied, as well as kind of body and brain outcomes (i.e., ATP or mass). Whenever possible (which was the case in 10 of 13 papers), we also calculated the percentage changes in body and brain induced by the intervention.
Risk of Bias Assessment
One reviewer assessed the risk of bias of the included studies using the SYRCLE‘s tool for non-human studies (Hooijmans et al., 2014) or the Cochrane Collaboration's tool updated in 2011 (Higgins et al., 2011) for studies conducted in humans. The results were independently checked by two other reviewers. All differences were clarified by discussion.
Hypothesis Decision
We have predefined the following algorithm (Figure 2) for later use in the review process, when the step of hypothesis decision is due. This algorithm included all combinations of brain and body findings and their statistical analysis. We used the algorithm to clarify whether a study allows a hypothesis decision (decidable study) or not (undecidable study). If decidable, we used the algorithm to check whether the study favors the hypothesis or the alternative hypothesis. Hypothesis decision was conducted by two reviewers independently and agreed by a third reviewer.
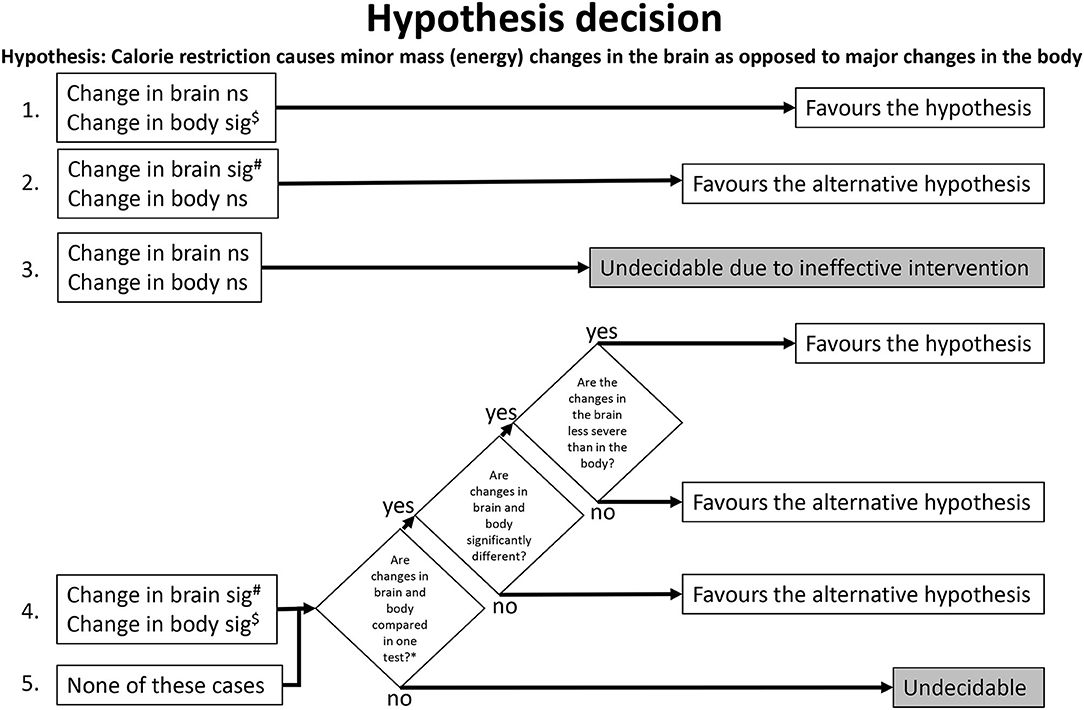
Figure 2. Algorithm for hypothesis decision. The numbers on the left indicate where the algorithm path begins for a given study. $Overriding exception (unlikely to occur): A significant (sig) increase in the body favors the alternative hypothesis. #Overriding exception (unlikely to occur): A significant increase in the brain favors the hypothesis. *e.g., testing relative brain changes (like change of brain mass/body mass). ns, not significant.
Results
The systematic search of the literature generated 3,157 articles, which were processed as summarized in Figure 1. Two thousand eight hundred four works were screened by title or abstract, and 232 articles were analyzed by full text. We identified 13 studies that met all inclusion criteria and focused on how energy restriction affects the central and peripheral energy states (Schärer, 1977; Villeneuve et al., 1977; Goodman and Ruderman, 1980; Harris et al., 1984; Ocken and Grunewald, 1988; Bodoky et al., 1995; Wolff et al., 1999; Dubnov et al., 2000; Greenberg and Boozer, 2000; Ostrowski et al., 2006; Peters et al., 2011; Hisatomi et al., 2013; Ryzhavskii et al., 2019).
Characteristics of Included Studies
Table 1 provides details of the 13 included studies. Eight studies examined rats (Schärer, 1977; Villeneuve et al., 1977; Goodman and Ruderman, 1980; Harris et al., 1984; Ocken and Grunewald, 1988; Bodoky et al., 1995; Greenberg and Boozer, 2000; Ryzhavskii et al., 2019) and three studies investigated mice (Wolff et al., 1999; Dubnov et al., 2000; Hisatomi et al., 2013). One study was conducted in sand gazelles (Ostrowski et al., 2006). Only one study reported on humans, women in particular (Peters et al., 2011). The sample sizes varied between 10 and 150.
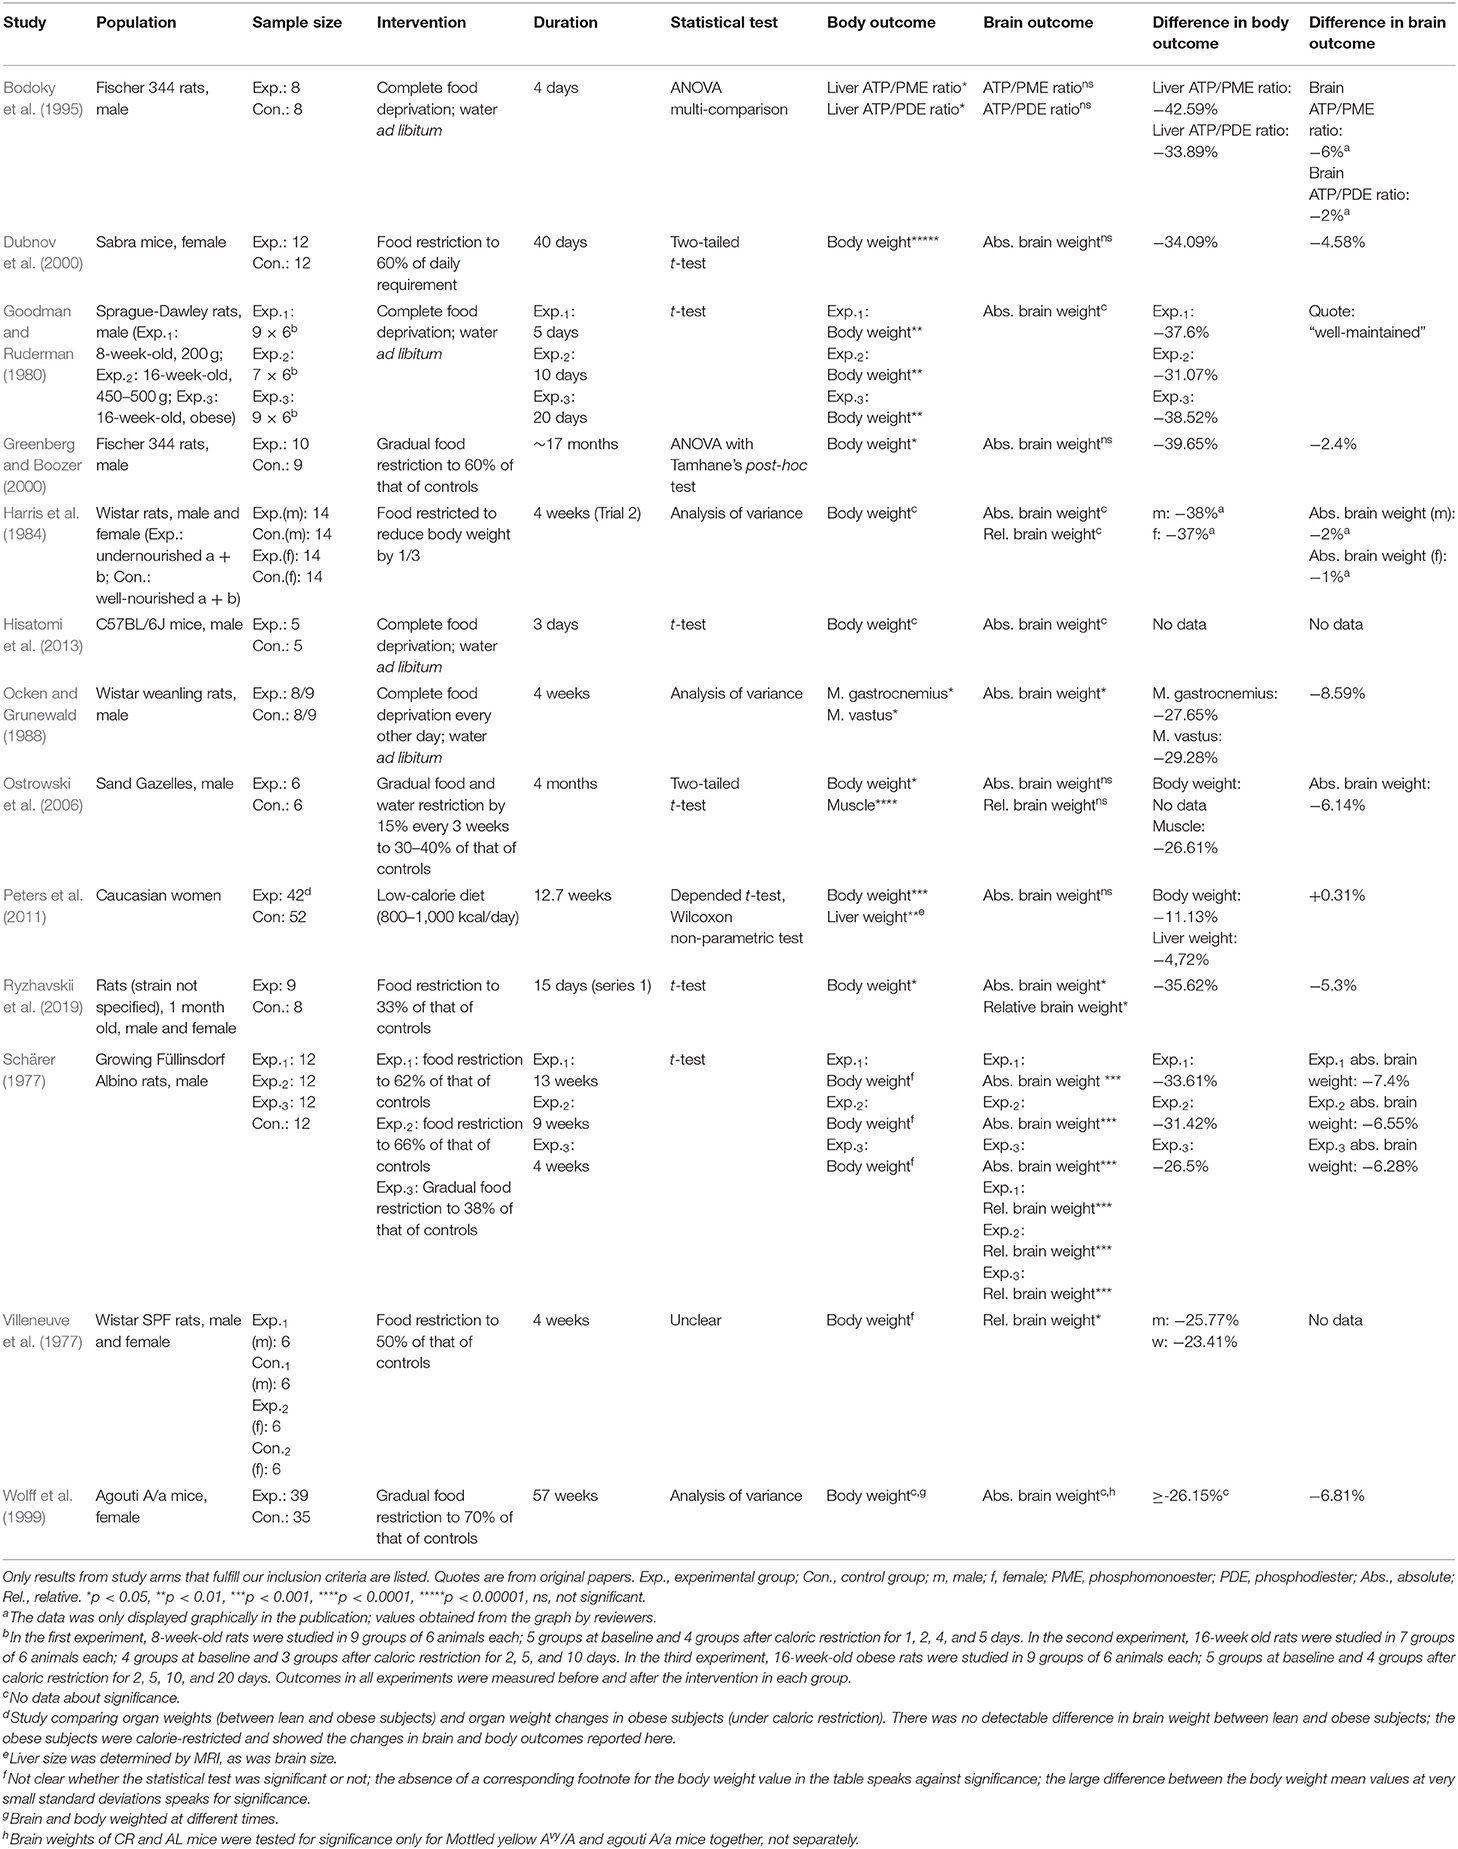
Table 1. Characteristics and results of included studies.
All 13 included studies provided details on how the calorie restriction was implemented. A considerable spectrum was found: The duration of the calorie restriction ranged from 3 days to 17 months. Three studies used complete food deprivation (Goodman and Ruderman, 1980; Bodoky et al., 1995; Hisatomi et al., 2013), others used an intermittent fasting regimen (Ocken and Grunewald, 1988). Food was restricted to about 30–40% (Ostrowski et al., 2006; Ryzhavskii et al., 2019), to 50% (Villeneuve et al., 1977), to 60% (Greenberg and Boozer, 2000), and to about 70% of that of controls (Wolff et al., 1999). In other studies, food was restricted to reduce body weight by 33% (Harris et al., 1984), or to reduce it to 60% of daily requirements (Dubnov et al., 2000). In a further study, experiments were conducted with a food restriction at 60–70% of the controls, compared to a gradual food restriction to 38% (Schärer, 1977). The only study conducted in humans used a low-calorie diet (800–1,000 kcal/day) (Peters et al., 2011).
All animal studies used autopsies to assess brain and body outcomes. The human study bypassed autopsy by measuring organ sizes by magnetic resonance imaging (MRI) (Peters et al., 2011). Most studies reported intervention-induced changes in body weight and absolute brain weight (Goodman and Ruderman, 1980; Wolff et al., 1999; Dubnov et al., 2000; Greenberg and Boozer, 2000; Peters et al., 2011; Hisatomi et al., 2013). Four studies additionally reported the relative brain weight (Schärer, 1977; Harris et al., 1984; Ostrowski et al., 2006; Ryzhavskii et al., 2019). Others reported muscle weight and absolute brain weight (Ocken and Grunewald, 1988), or the combination of body weight and relative brain weight (Villeneuve et al., 1977). One study reported on high energy phosphates, i.e., the ratio of ATP/PDE (adenosine triphosphate/phosphodiester) in liver and brain (Bodoky et al., 1995). Four of the 13 included studies provided incomplete data or statistical information on their results (Goodman and Ruderman, 1980; Harris et al., 1984; Wolff et al., 1999, Hisatomi et al., 2013).
In the thirteen included studies, the changes in brain mass or energy concentration ranged from +0.3 to −8.6%, while the changes in body mass or rather energy ranged from −11.1 to −40.0%.
Risk of Bias Assessment
To assess the risk of bias of non-human studies the SYRCLE‘s tool was used (Hooijmans et al., 2014). To assess the risk of bias of human studies the Cochrane Collaboration's tool updated in 2011 was used (Higgins et al., 2011). The seven items of the latter tool were integrated in the abovementioned tool. Table 2 provides the risk of bias assessment for all 13 included studies. Five studies (41.7% of the included studies) reported randomization. In all included studies, the baseline characteristics of the intervention and control groups were similar, indicating a low risk of bias. Blinding of outcome assessors was not possible in animal studies, since restricted food supply, weight changes and altered behavior (starvation-induced locomotion) was openly visible to animal keepers. In the human study, where brain size was assessed by MRI, blinding of the outcome assessor was theoretically possible, but not explicitly reported in the publication (Peters et al., 2011). All studies were classified as low risk for attrition bias. Ten studies (76.9%) were rated low risk for reporting bias. Only one study was rated high risk of other sources of bias as the conditions in which animals were kept differed between experimental and control groups; moreover, in this study, body mass was measured earlier than indicated in the protocol (Wolff et al., 1999).
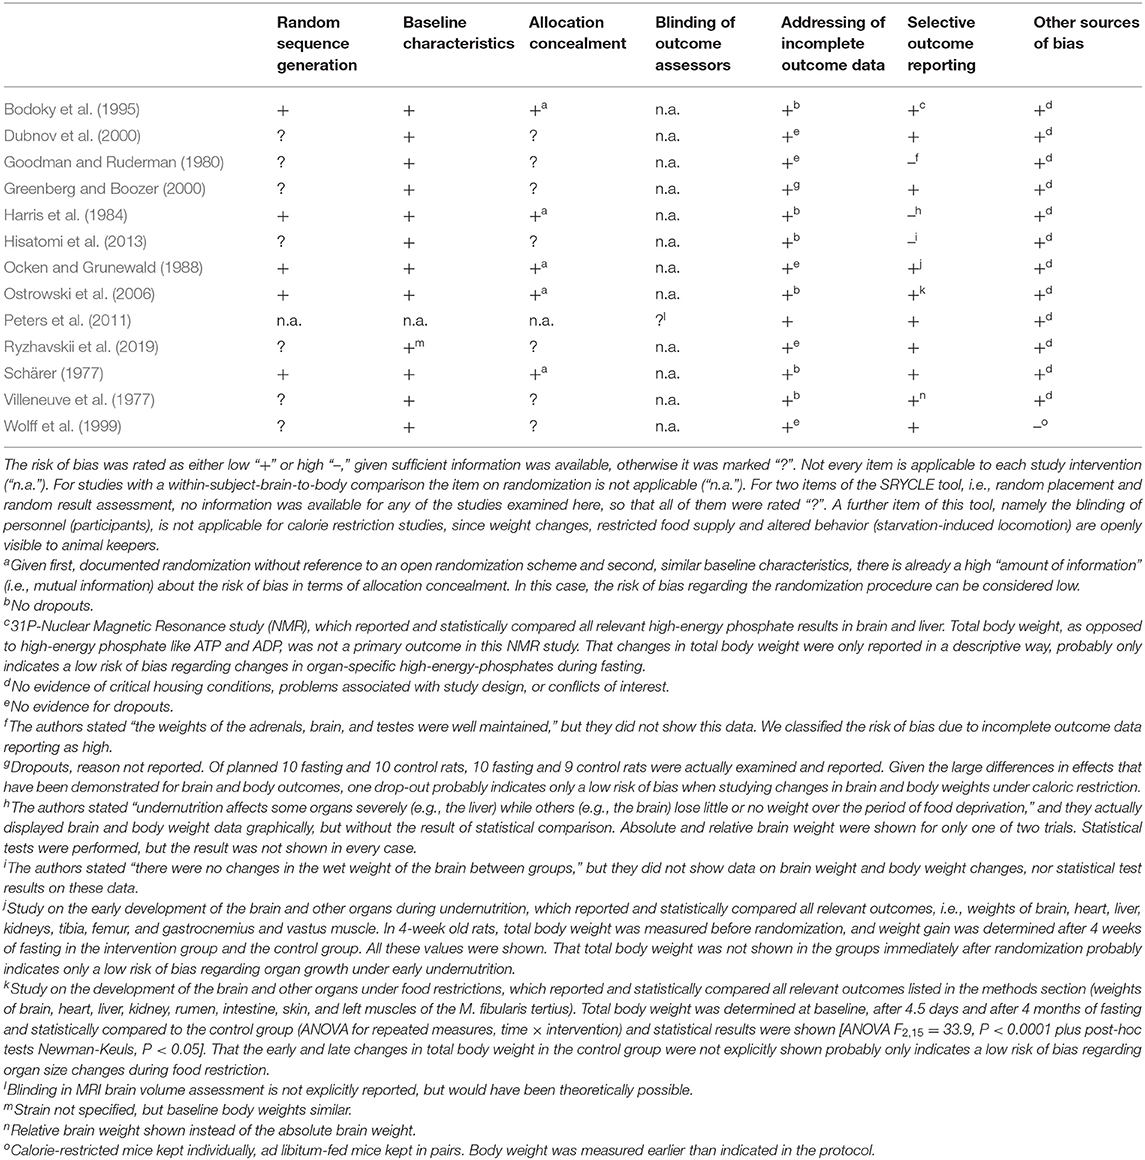
Table 2. Risk of bias assessment.
Hypothesis Decision
Here we used the predefined hypothesis-decision algorithm described in the Methods section (Figure 2). The algorithm indicated that out of the 13 included studies, 8 studies were decision-ready, and 5 were undecidable. Of the 8 studies where the decision was pending, 8 supported the hypothesis and none supported the alternative hypothesis (Table 3).
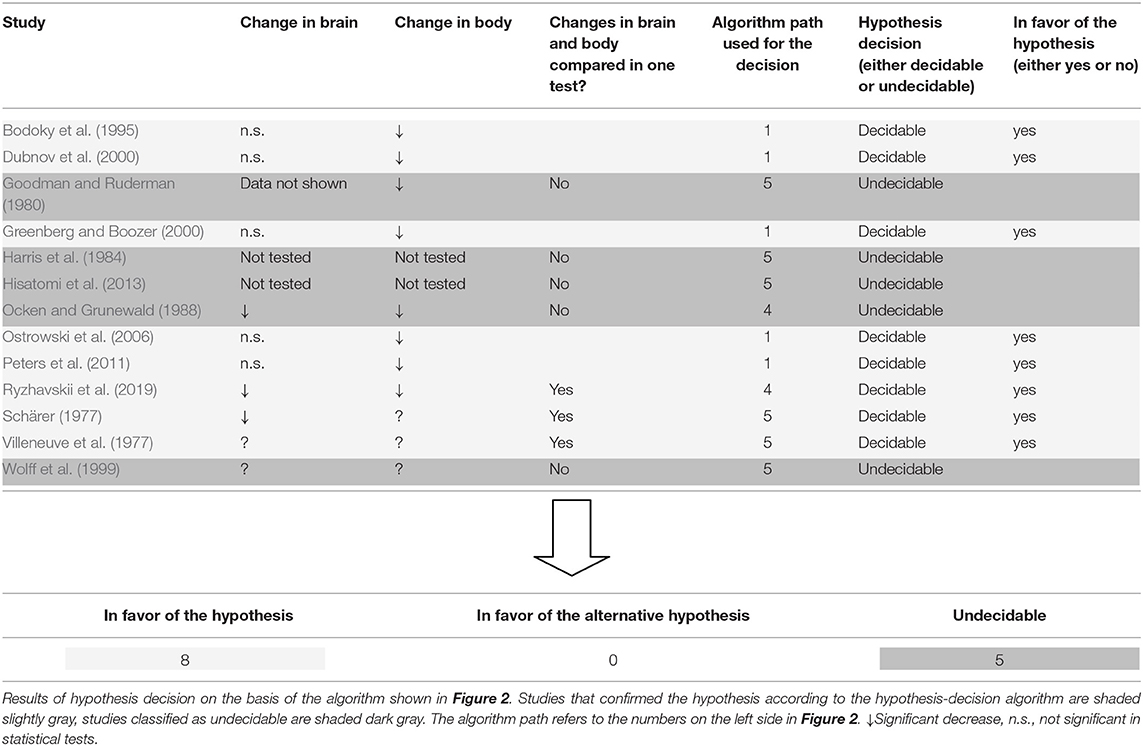
Table 3. Hypothesis decision.
Descriptive Data Analysis
Figure 3 shows the percentage changes of brain and body outcomes taken from Table 1. For the inclusion in the graph it was irrelevant whether the hypothesis was decidable or not in a certain study, what was necessary was the availability of sufficient data to calculate the percentage changes. This was the case in 10 studies. In this graphical representation, all 10 studies descriptively showed that the percentage changes in the brain were smaller than the changes in the body.
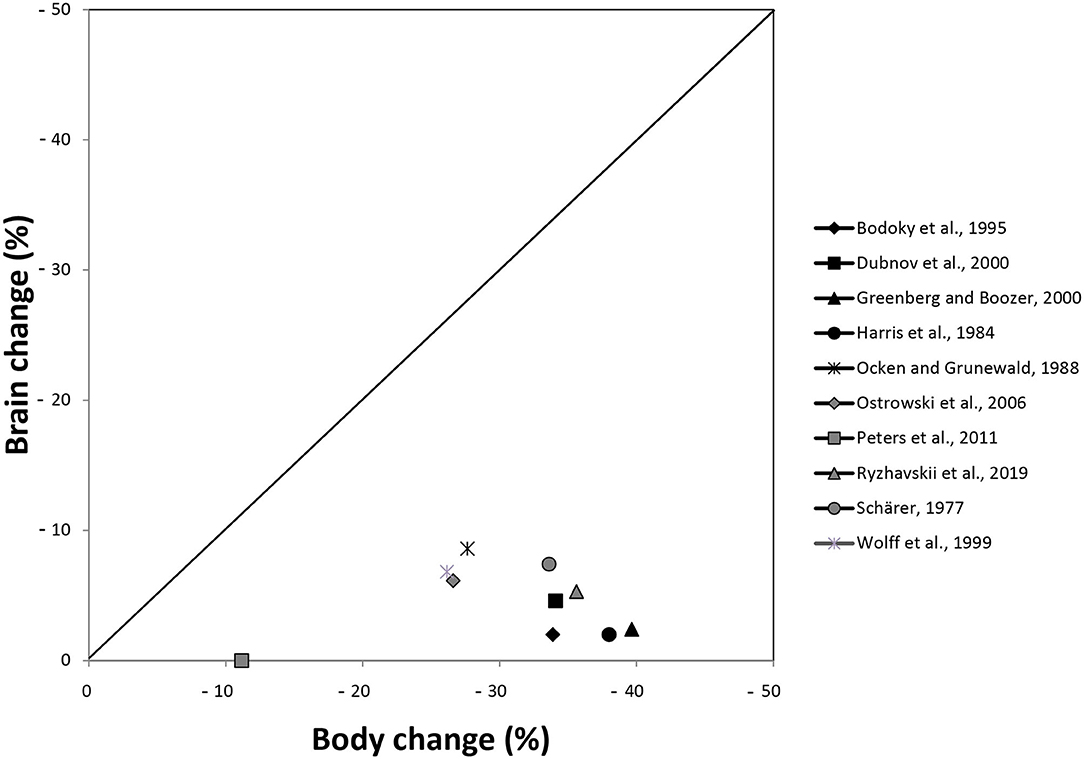
Figure 3. Presentation of percentage changes in brain and body outcomes extracted from Table 1. Harris et al. (1984) conducted their experiment in females and males; here, the data of males are presented. Schärer (1977) conducted three experiments; here, the data of experiment 1 are shown.
The 10 studies, which allowed us to calculate percent changes, used interventions ranging from short-term food deprivation to long-term moderate caloric restriction. Because short-term and long-term caloric restriction are known to lead to different physiological pathways (Anderson et al., 2009; Redman and Ravussin, 2009), we asked whether the interventional differences between the 10 studies mattered for brain and body outcomes. Additional descriptive analysis (see Supplementary Information C) does not suggest any pattern according to which the ratio of brain change to body change varies with the duration or intensity of caloric restriction.
Discussion
A total of 2,804 works was screened by title and abstract, and 232 were analyzed in full text. According to strict selection criteria defined in our PROSPERO pre-announcement and complying with PRISMA guidelines and the predefined hypothesis-decision algorithm, 8 papers were informative enough to decide on the hypothesis (Table 3). All of these 8 decidable papers confirmed the hypothesis, none of them spoke against it, clearly indicating that calorie restriction causes minor mass (energy) changes in the brain as opposed to major changes in the body.
The 8 decidable (and also confirmatory) studies represent a spectrum of diverse experiments which can be summarized as follows. All 8 experiments analyzed here were published between 1977 and 2019, were performed on mice, rats, gazelles, and humans, and the calorie restriction lasted from 4 days to more than 1 year. In animals, ATP and other high-energy phosphates were measured by 31P-phosphate-nuclear magnetic resonance (NMR) (Bodoky et al., 1995). Organ weights and total body weight were measured with scales (Schärer, 1977; Villeneuve et al., 1977; Dubnov et al., 2000; Greenberg and Boozer, 2000; Ostrowski et al., 2006; Ryzhavskii et al., 2019). In humans, organ sizes were measured by MRI (Peters et al., 2011). Therefore, in each of these studies, at least one method (NMR, MRI, or scale) was used to measure both brain and body outcomes, allowing for comparison as these outcomes were measured with almost equal precision. Especially for these 8 papers the risk of bias could be rated as low. In the 8 decidable (and confirmatory) studies, brain mass (energy) changes ranged from +0.3 to −7.4%, while body mass (energy) changes ranged from −11.1 to −40.0%.
Multiple redundant mechanisms for safeguarding energy concentrations in the brain have been identified so far. These mechanisms procure the brain with additional fuel when needed: e.g., by increasing heart rate (Jones et al., 2011), visceral fat lipolysis and hepatic ketogenesis (Kubera et al., 2014), muscular lactate release (Qvisth et al., 2008), and by suppressing beta-cell insulin secretion (Hitze et al., 2010). Neuronal ATP can slightly decrease when the brain is undersupplied (e.g., due to lack of food) or when the brain needs more energy (e.g., due to arousal during stress; Madsen et al., 1995). Particularly in the amygdala (Zhou et al., 2010) and in the ventromedial hypothalamus (VMH) (Miki et al., 2001), reductions in neuronal ATP concentrations are detected by intraneuronal energy sensors (Spanswick et al., 1997; Routh et al., 2014; Toda et al., 2016). Even a small decrease of neuronal ATP, leads to depolarization of VMH neurons through GABAergic disinhibition (Chan et al., 2007), and via glutamatergic mechanisms these VMH neurons activate the sympathoadrenal system (Tong et al., 2007; Lindberg et al., 2013). VMH activation increases blood glucose concentrations and lowers insulin concentrations (Meek et al., 2016; Stanley et al., 2016). These VMH effects on glucose and insulin concentrations are mediated by the SNS and HPA axis, which have been found to vigorously suppress insulin secretion from pancreatic beta-cells (Woods and Porte, 1974; Billaudel and Sutter, 1982; Ahren, 2000; Hitze et al., 2010). At low insulin concentrations, blood glucose can hardly be stored in muscle and fat tissue via the insulin-dependent glucose transporters GLUT-4. Blood glucose can pass the blood-brain barrier more easily via the insulin-independent GLUT-1. The brain needs virtually no insulin to take up glucose (Hom et al., 1984; Hasselbalch et al., 1999; Seaquist et al., 2001). The here described brain protective mechanism is one of the most important and is called cerebral insulin suppression (CIS). In conclusion, GLUT-1 glucose uptake safeguards basal energy supply of vital organs, like brain and immune cells (Deng et al., 2014), while GLUT-4 allows the storage of surplus energy in muscle and fat cells (Shepherd and Kahn, 1999). Thus, cerebral insulin suppression allocates energy to the brain in order to maintain cerebral energy concentrations.
The clinical hallmark of CIS is an inadequate low insulin concentration at a given blood glucose concentration. CIS has been observed in critical conditions like starvation (Byrne et al., 1995), psychological stress (Hitze et al., 2010), myocardial infarction (Taylor et al., 1969), and stroke (Harada et al., 2009). Thus, in cases of food shortage or psychological stress, mechanisms like CIS help to control the intraneuronal ATP concentration within narrow limits (Peters and McEwen, 2015).
Our results fully agree with the predictions of the Selfish Brain theory, but violate the predictions of the gluco-lipostatic theory, of all its variants, and of all other theories that assume a passively supplied brain. We must concede, however, that the more accurate predictions of the Selfish Brain theory come at an increased complexity cost. For more accurate predictions, an energy metabolic model needs to include additional mechanisms such as CIS, which guarantee cerebral energy homeostasis. In this respect we are dealing with a trade-off between the model's accuracy and complexity costs (Gilad-Bachrach et al., 2003).
The evidence presented here may surprise one or the other, leaving them with two options: explain away the evidence or update the basic tenets of energy metabolism. Such an update might replace a brain that is only passively supplied with energy, with a brain that regulates its energy concentrations independently and takes a primary position in a hierarchically organized energy metabolism.
One direction for future systematic reviews could be to investigate whether ischemic stroke, due to interrupted blood-to-brain energy flow, causes major changes in the body. Given that the brain regulates its own energy content, body changes as hyperglycemia or weight loss are predicted. The subsequent question would be whether these changes are large enough to be clinically relevant. Another direction for further development could be to study the outcomes for brain and body when the energy flow from blood to muscle or fat is interrupted. This is the case with untreated diabetes mellitus type 1. Given that the brain self-regulates its energy content with highest priority, it is predicted that the severe hyperglycemia in untreated type 1 diabetes mellitus affects the brain high-energy-phosphate concentrations only to a limited extent.
Data Availability Statement
The data analyzed in this study is subject to the following licenses/restrictions: systematic review. Requests to access these datasets should be directed to Achim Peters, YWNoaW0ucGV0ZXJzQHVrc2guZGU=.
Author Contributions
MS developed the search strategies that BK and AP approved. MS screened the article titles or abstracts against the inclusion and exclusion criteria. BK checked this step and disagreements were resolved where necessary by consulting the third reviewer AP. MS and BK independently analyzed the full text and disagreements were resolved where necessary by consultation with the third reviewer AP. MS extracted the data, which BK and AP independently checked. MS assessed the risk of bias, which BK and AP independently checked and approved. AP developed the hypothesis-decision algorithm, which MS and BK agreed upon. MS and BK independently conducted the hypothesis decision, which AP approved. BK and AP wrote the manuscript. All authors contributed to manuscript revision, read, and approved the submitted version.
Conflict of Interest
The authors declare that the research was conducted in the absence of any commercial or financial relationships that could be construed as a potential conflict of interest.
Acknowledgments
Our special thanks go to Thomas Kohlmann, Professor for Methods of Community Medicine, for discussions on the design of the hypothesis-decision algorithm and on the descriptive data analysis. We thank Sabine Wittnebel for expert assistance in the retrieval and acquisition of full reports.
Supplementary Material
The Supplementary Material for this article can be found online at: https://www.frontiersin.org/articles/10.3389/fnins.2021.639617/full#supplementary-material
References
Ahren, B. (2000). Autonomic regulation of islet hormone secretion-implications for health and disease. Diabetologia 43, 393–410. doi: 10.1007/s001250051322
Anderson, R. M., Shanmuganayagam, D., and Weindruch, R. (2009). Caloric restriction and aging: studies in mice and monkeys. Toxicol. Pathol. 37, 47–51. doi: 10.1177/0192623308329476
Billaudel, B., and Sutter, B. C. (1982). Immediate in-vivo effect of corticosterone on glucose-induced insulin secretion in the rat. J. Endocrinol. 95, 315–320. doi: 10.1677/joe.0.0950315
Bodoky, G., Yang, Z. J., Meguid, M. M., Laviano, A., and Szeverenyi, N. (1995). Effects of fasting, intermittent feeding, or continuous parenteral nutrition on rat liver and brain energy metabolism as assessed by 31P-NMR. Physiol. Behav. 58, 521–527. doi: 10.1016/0031-9384(95)00078-W
Byrne, M. M., Sturis, J., and Polonsky, K. S. (1995). Insulin secretion and clearance during low-dose graded glucose infusion. Am. J. Physiol. 268, E21–E27. doi: 10.1152/ajpendo.1995.268.1.E21
Chan, O., Lawson, M., Zhu, W., Beverly, J. L., and Sherwin, R. S. (2007). ATP-sensitive K(+) channels regulate the release of GABA in the ventromedial hypothalamus during hypoglycemia. Diabetes 56, 1120–1126. doi: 10.2337/db06-1102
Chaput, J. P., and Tremblay, A. (2009). The glucostatic theory of appetite control and the risk of obesity and diabetes. Int. J. Obes. 33, 46–53. doi: 10.1038/ijo.2008.221
Chaudhri, O., Small, C., and Bloom, S. (2006). Gastrointestinal hormones regulating appetite. Philos. Trans. R. Soc. Lond., B., Biol. Sci 361, 1187–1209. doi: 10.1098/rstb.2006.1856
Deng, D., Xu, C., Sun, P., Wu, J., Yan, C., Hu, M., et al. (2014). Crystal structure of the human glucose transporter GLUT1. Nature 510, 121–125. doi: 10.1038/nature13306
Dubnov, G., Kohen, R., and Berry, E. M. (2000). Diet restriction in mice causes differential tissue responses in total reducing power and antioxidant compounds. Eur. J. Nutr. 39, 18–30. doi: 10.1007/s003940050072
Gilad-Bachrach, R., Navot, A., and Tishby, N. (2003). An information theoretic tradeoff between complexity and accuracy. Lect. Notes Artif. Int. 2777, 595–609. doi: 10.1007/978-3-540-45167-9_43
Goodman, M. N., and Ruderman, N. B. (1980). Starvation in the rat. I. Effect of age and obesity on organ weights, RNA, DNA, and protein. Am. J. Physiol. 239, E269–E276. doi: 10.1152/ajpendo.1980.239.4.E269
Greenberg, J. A., and Boozer, C. N. (2000). Metabolic mass, metabolic rate, caloric restriction, and aging in male Fischer 344 rats. Mech. Ageing Dev. 113, 37–48. doi: 10.1016/S0047-6374(99)00094-9
Harada, S., Fujita, W. H., Shichi, K., and Tokuyama, S. (2009). The development of glucose intolerance after focal cerebral ischemia participates in subsequent neuronal damage. Brain Res. 1279, 174–181. doi: 10.1016/j.brainres.2009.05.014
Harris, P. M., Hodgson, D. F., and Broadhurst, R. B. (1984). Response of male and female rats to undernutrition. 1. Changes in energy utilization, body composition and tissue turnover during undernutrition. Br. J. Nutr. 52, 289–306. doi: 10.1079/BJN19840096
Hasselbalch, S. G., Knudsen, G. M., Videbaek, C., Pinborg, L. H., Schmidt, J. F., Holm, S., et al. (1999). No effect of insulin on glucose blood-brain barrier transport and cerebral metabolism in humans. Diabetes 48, 1915–1921. doi: 10.2337/diabetes.48.10.1915
Higgins, J. P., Altman, D. G., Gotzsche, P. C., Juni, P., Moher, D., Oxman, A. D., et al. (2011). The Cochrane collaboration's tool for assessing risk of bias in randomised trials. BMJ 343:d5928. doi: 10.1136/bmj.d5928
Hisatomi, Y., Asakura, K., Kugino, K., Kurokawa, M., Asakura, T., and Nakata, K. (2013). Changes in brain tissue and behavior patterns induced by single short-term fasting in mice. PLoS ONE 8:e80085. doi: 10.1371/journal.pone.0080085
Hitze, B., Hubold, C., van Dyken, R., Schlichting, K., Lehnert, H., Entringer, S., et al. (2010). How the selfish brain organizes its 'supply and demand'. Front. Neuroenerg. 2:7. doi: 10.3389/fnene.2010.00007
Hom, F. G., Goodner, C. J., and Berrie, M. A. (1984). A [3H]2-deoxyglucose method for comparing rates of glucose metabolism and insulin responses among rat tissues in vivo. Validation of the model and the absence of an insulin effect on brain. Diabetes 33, 141–152. doi: 10.2337/diab.33.2.141
Hooijmans, C. R., Rovers, M. M., de Vries, R. B., Leenaars, M., Ritskes-Hoitinga, M., and Langendam, M. W. (2014). SYRCLE's risk of bias tool for animal studies. BMC Med. Res. Methodol. 14:43. doi: 10.1186/1471-2288-14-43
Jones, A., Steeden, J. A., Pruessner, J. C., Deanfield, J. E., Taylor, A. M., and Muthurangu, V. (2011). Detailed assessment of the hemodynamic response to psychosocial stress using real-time MRI. J. Magn. Reson. Imaging 33, 448–454. doi: 10.1002/jmri.22438
Kennedy, G. C. (1953). The role of depot fat in the hypothalamic control of food intake in the rat. Proc. R. Soc. Lond. Ser. 140, 578–592. doi: 10.1098/rspb.1953.0009
Kubera, B., Hubold, C., Wischnath, H., Zug, S., and Peters, A. (2014). Rise of ketone bodies with psychosocial stress in normal weight men. Psychoneuroendocrinology 45, 43–48. doi: 10.1016/j.psyneuen.2014.03.008
Kullmann, S., Kleinridders, A., Small, D. M., Fritsche, A., Haring, H. U., Preissl, H., et al. (2020). Central nervous pathways of insulin action in the control of metabolism and food intake. Lancet Diabetes Endocrinol. 8, 524–534. doi: 10.1016/S2213-8587(20)30113-3
Kuzawa, C. W., and Blair, C. (2019). A hypothesis linking the energy demand of the brain to obesity risk. Proc. Natl. Acad. Sci. U.S.A. 116, 13266–13275. doi: 10.1073/pnas.1816908116
Lindberg, D., Chen, P., and Li, C. (2013). Conditional viral tracing reveals that steroidogenic factor 1-positive neurons of the dorsomedial subdivision of the ventromedial hypothalamus project to autonomic centers of the hypothalamus and hindbrain. J. Comp. Neurol. 521, 3167–3190. doi: 10.1002/cne.23338
Lowe, M. R., and Butryn, M. L. (2007). Hedonic hunger: a new dimension of appetite? Physiol. Behav. 91, 432–439. doi: 10.1016/j.physbeh.2007.04.006
Madsen, P. L., Hasselbalch, S. G., Hagemann, L. P., Olsen, K. S., Bulow, J., Holm, S., et al. (1995). Persistent resetting of the cerebral oxygen/glucose uptake ratio by brain activation: evidence obtained with the Kety-Schmidt technique. J. Cereb. Blood Flow Metab. 15, 485–491. doi: 10.1038/jcbfm.1995.60
Magistretti, P. J., Pellerin, L., Rothman, D. L., and Shulman, R. G. (1999). Energy on demand. Science 283, 496–497. doi: 10.1126/science.283.5401.496
Mayer, J. (1953). Glucostatic mechanism of regulation of food intake. N. Engl. J. Med. 249, 13–16. doi: 10.1056/NEJM195307022490104
Meek, T. H., Nelson, J. T., Matsen, M. E., Dorfman, M. D., Guyenet, S. J., Damian, V., et al. (2016). Functional identification of a neurocircuit regulating blood glucose. Proc. Natl. Acad. Sci. U.S.A. 113, E2073–E2082. doi: 10.1073/pnas.1521160113
Miki, T., Liss, B., Minami, K., Shiuchi, T., Saraya, A., Kashima, Y., et al. (2001). ATP-sensitive K+ channels in the hypothalamus are essential for the maintenance of glucose homeostasis. Nat. Neurosci. 4, 507–512. doi: 10.1038/87455
Moher, D., Liberati, A., Tetzlaff, J., Altman, D. G., and PRISMA Group (2009). Preferred reporting items for systematic reviews and meta-analyses: the PRISMA statement. PLoS Med. 6:e1000097. doi: 10.1371/journal.pmed.1000097
Myers, M. G., Cowley, M. A., and Munzberg, H. (2008). Mechanisms of leptin action and leptin resistance. Annu. Rev. Physiol. 70, 537–556. doi: 10.1146/annurev.physiol.70.113006.100707
Ocken, D. A., and Grunewald, K. K. (1988). The effects of exercise on catch-up growth of rats recovering from early undernutrition. J. Nutr. 118, 1410–1416. doi: 10.1093/jn/118.11.1410
Ostrowski, S., Mesochina, P., and Williams, J. B. (2006). Physiological adjustments of sand gazelles (Gazella subgutturosa) to a boom-or-bust economy: standard fasting metabolic rate, total evaporative water loss, and changes in the sizes of organs during food and water restriction. Physiol. Biochem. Zool. 79, 810–819. doi: 10.1086/504614
Pellerin, L., and Magistretti, P. J. (1994). Glutamate uptake into astrocytes stimulates aerobic glycolysis: a mechanism coupling neuronal activity to glucose utilization. Proc. Natl. Acad. Sci. U.S.A. 91, 10625–10629. doi: 10.1073/pnas.91.22.10625
Peters, A., Bosy-Westphal, A., Kubera, B., Langemann, D., Goele, K., Later, W., et al. (2011). Why doesn't the brain lose weight, when obese people diet? Obes. Facts 4, 151–157. doi: 10.1159/000327676
Peters, A., and Langemann, D. (2009). Build-ups in the supply chain of the brain: on the neuroenergetic cause of obesity and type 2 diabetes mellitus. Front. Neuroenerg. 1:2. doi: 10.3389/neuro.14.002.2009
Peters, A., and McEwen, B. S. (2015). Stress habituation, body shape and cardiovascular mortality. Neurosci. Biobehav. Rev. 56, 139–150. doi: 10.1016/j.neubiorev.2015.07.001
Peters, A., Schweiger, U., Pellerin, L., Hubold, C., Oltmanns, K. M., Conrad, M., et al. (2004). The selfish brain: competition for energy resources. Neurosci. Biobehav. Rev. 28, 143–180. doi: 10.1016/j.neubiorev.2004.03.002
Qvisth, V., Hagstrom-Toft, E., Enoksson, S., and Bolinder, J. (2008). Catecholamine regulation of local lactate production in vivo in skeletal muscle and adipose tissue: role of -adrenoreceptor subtypes. J. Clin. Endocrinol. Metab. 93, 240–246. doi: 10.1210/jc.2007-1313
Redman, L. M., and Ravussin, E. (2009). Endocrine alterations in response to calorie restriction in humans. Mol. Cell. Endocrinol. 299, 129–136. doi: 10.1016/j.mce.2008.10.014
Routh, V. H., Hao, L., Santiago, A. M., Sheng, Z., and Zhou, C. (2014). Hypothalamic glucose sensing: making ends meet. Front. Syst. Neurosci. 8:236. doi: 10.3389/fnsys.2014.00236
Ryzhavskii, B. Y., Lebed'ko, O. A., and Lazinskaya, O. V. (2019). Immediate and delayed effects of food restriction on some parameters of brain development in rats. Bull. Exp. Biol. Med. 167, 104–110. doi: 10.1007/s10517-019-04471-7
Schärer, K. (1977). The effect of chronic underfeeding on organ weights of rats. How to interpret organ weight changes in cases of marked growth retardation in toxicity tests? Toxicology 7, 45–56. doi: 10.1016/0300-483X(77)90037-3
Schwartz, M. W., Seeley, R. J., Zeltser, L. M., Drewnowski, A., Ravussin, E., Redman, L. M., et al. (2017). Obesity pathogenesis: an endocrine society scientific statement. Endocr. Rev. 38, 267–296. doi: 10.1210/er.2017-00111
Seaquist, E. R., Damberg, G. S., Tkac, I., and Gruetter, R. (2001). The effect of insulin on in vivo cerebral glucose concentrations and rates of glucose transport/metabolism in humans. Diabetes 50, 2203–2209. doi: 10.2337/diabetes.50.10.2203
Shepherd, P. R., and Kahn, B. B. (1999). Glucose transporters and insulin action-implications for insulin resistance and diabetes mellitus. N. Engl. J. Med. 341, 248–257. doi: 10.1056/NEJM199907223410406
Spanswick, D., Smith, M. A., Groppi, V. E., Logan, S. D., and Ashford, M. L. (1997). Leptin inhibits hypothalamic neurons by activation of ATP-sensitive potassium channels. Nature 390, 521–525. doi: 10.1038/37379
Stanley, S. A., Kelly, L., Latcha, K. N., Schmidt, S. F., Yu, X., Nectow, A. R., et al. (2016). Bidirectional electromagnetic control of the hypothalamus regulates feeding and metabolism. Nature 531, 647–650. doi: 10.1038/nature17183
Taylor, S. H., Saxton, C., Majid, P. A., Dykes, J. R., Ghosh, P., and Stoker, J. B. (1969). Insulin secretion following myocardial infarction with particular respect to the pathogenesis of cardiogenic shock. Lancet 2, 1373–1378. doi: 10.1016/S0140-6736(69)90928-3
Toda, C., Kim, J. D., Impellizzeri, D., Cuzzocrea, S., Liu, Z. W., and Diano, S. (2016). UCP2 regulates mitochondrial fission and ventromedial nucleus control of glucose responsiveness. Cell 164, 872–883. doi: 10.1016/j.cell.2016.02.010
Tong, Q., Ye, C., McCrimmon, R. J., Dhillon, H., Choi, B., Kramer, M. D., et al. (2007). Synaptic glutamate release by ventromedial hypothalamic neurons is part of the neurocircuitry that prevents hypoglycemia. Cell Metab. 5, 383–393. doi: 10.1016/j.cmet.2007.04.001
Villeneuve, D. C., van Logten, M. J., den Tonkelaar, E. M., Greve, P. A., Vos, J. G., Speijers, G. J., et al. (1977). Effect of food deprivation on low level hexachlorobenzene exposure in rats. Sci. Total Environ. 8, 179–186. doi: 10.1016/0048-9697(77)90076-6
Wolff, G. L., Kodell, R. L., Kaput, J. A., and Visek, W. J. (1999). Caloric restriction abolishes enhanced metabolic efficiency induced by ectopic agouti protein in yellow mice. Proc. Soc. Exp. Biol. Med. 221, 99–104. doi: 10.3181/00379727-221-44390
Woods, S. C., and Porte, D. Jr. (1974). Neural control of the endocrine pancreas. Physiol. Rev. 54, 596–619. doi: 10.1152/physrev.1974.54.3.596
Zhang, Y., Proenca, R., Maffei, M., Barone, M., Leopold, L., and Friedman, J. M. (1994). Positional cloning of the mouse obese gene and its human homologue. Nature 372, 425–432. doi: 10.1038/372425a0
Keywords: brain energy metabolism, body weight, caloric restriction, high-energy phosphates, selfish brain theory, systematic review
Citation: Sprengell M, Kubera B and Peters A (2021) Brain More Resistant to Energy Restriction Than Body: A Systematic Review. Front. Neurosci. 15:639617. doi: 10.3389/fnins.2021.639617
Received: 09 December 2020; Accepted: 07 January 2021;
Published: 09 February 2021.
Edited by:
Avital Schurr, University of Louisville, United StatesReviewed by:
Fabien Pifferi, UMR 7179 CNRS - Muséum National d'Histoire Naturelle (MNHN), FranceRicki Colman, University of Wisconsin-Madison, United States
Copyright © 2021 Sprengell, Kubera and Peters. This is an open-access article distributed under the terms of the Creative Commons Attribution License (CC BY). The use, distribution or reproduction in other forums is permitted, provided the original author(s) and the copyright owner(s) are credited and that the original publication in this journal is cited, in accordance with accepted academic practice. No use, distribution or reproduction is permitted which does not comply with these terms.
*Correspondence: Achim Peters, YWNoaW0ucGV0ZXJzQHVrc2guZGU=
†These authors have contributed equally to this work and share first authorship