 Yi Gu
Yi Gu Lei Hua
- School of Artificial Intelligence and Computer Science, Jiangnan University, Wuxi, China
The brain is the central nervous system that governs human activities. However, in modern society, more and more diseases threaten the health of the brain and nerves and spinal cord, making the human brain unable to conduct normal information interaction with the outside world. The rehabilitation training of the brain-computer interface can promote the nerve repair of the sensorimotor cortex in patients with brain diseases. Therefore, the research of brain-computer interface for motor imaging is of great significance for patients with brain diseases to restore motor function. Due to the characteristics of non-stationary, nonlinear, and individual differences of EEG signals, there are still many difficulties in the analysis and classification of EEG signals at this stage. In this study, the Extreme Learning Machine (ELM) model was used to classify motor-imaging EEG signals, identify the user’s intention, and control external devices. Considering that single-modal features cannot represent the core information, this study uses a fusion feature that combines temporal and spatial features as the final feature data. The fusion features are input to the trained ELM classifier, and the final classification result is obtained. Two sets of BCI competition data in the BCI competition public database are used to verify the validity of the model. The experimental results show that the ELM model has achieved a classification accuracy of 0.7832 in the classification task of Data Sets IIb, which is higher than other comparison algorithms, and shows universal applicability among different subjects. In addition, the average recognition rate of this model in the Data Sets IIIa classification task reaches 0.8347, which has obvious advantages compared with the comparative classification algorithm. The classification effect is smaller than the classification effect obtained by the champion algorithm of the same project, which has certain reference value.
Introduction
The brain is the central nervous system that governs human activities. However, in modern society, more and more diseases threaten the health of the brain and nerves and spinal cord, making the human brain unable to conduct normal information interaction with the outside world. In recent years, with the rapid development of computer science and people’s continuous in-depth exploration of brain science, brain-computer interface (BCI) technology has been attracting attention as a new type of human-computer interaction system that directly interacts between brain nerves and peripheral devices. The BCI system collects EEG by placing sensors on the surface of the user’s scalp or inside the skin. The EEG signal is decoded to determine the intention, and then complete a series of operations such as controlling external equipment. Using BCI technology can help patients with movement disorders caused by nerve damage regain the ability to move independently and smoothly interact with the outside world. This technology will significantly improve the quality of life of patients and reduce the burden on families and society. The first international BCI conference held in 1999 clearly defined the brain-computer interface, that is, “BCI is a communication control system for direct communication between the brain and external devices, and does not rely on brain nerves and peripheral muscle tissue” (Wolpaw et al., 2000). Nowadays, BCI technology is developing rapidly at a rapid pace. In the fields of military aviation, rehabilitation and medical treatment, cognitive enhancement, games and entertainment, and intelligence are bursting with strong vitality, the research and application of brain-computer interface has become a hot spot in the field of scientific research (Van Dokkum et al., 2015; Qiu et al., 2017; Hammer et al., 2018).
Motor Imagery (MI) EEG has the characteristics of flexibility, non-invasiveness, low environmental requirements, and high resolution. Therefore, MI is one of the widely used forms of BCI. The frequency band power of the EEG signal during the motion imaging process will vary with the content of the MI task, which is called event related synchronization/desychronization (ERS/ERD). The generation of ERS/ERD is related to internal or external events. When one side of the human limb exercises or performs motor imagination, the energy of μ rhythm and β rhythm in the sensory motor area on the opposite side of the brain decreases, and the energy of μ rhythm and β rhythm in the ipsilateral motor sensory area increases. This rule makes it possible for ERS/ERD to control external equipment or perform motor imagination intention recognition (Lisi et al., 2014). Motor Imagery Brain-Computer Interface (MI-BCI) is used as a branch of the brain-computer interface. The patient’s brain imagines and simulates actions, but there is no actual action output. MI-BCI is mainly based on the analysis and recognition of sensorimotor rhythms, which decodes the signals and converts them into machine instructions. It can establish information channels between humans and machines, and realize the control of devices such as wheelchairs, exoskeletons, and prostheses. According to the theory of neuroplasticity, it also helps to activate nerve cells in a specific area of activity, helping to repair and regenerate damaged nerves.
In 1973, the American Jacques Vidal team put forward the concept of brain-computer interface technology for the first time in a paper, and pointed out that it is an interdisciplinary technology covering various disciplines, including biomedicine, neuroscience, cognitive science, computer science and other fields (Vidal, 1973). However, due to the immaturity of various corresponding technologies at that time, the research of brain-computer interface has always been stagnated at the conceptual and theoretical stage. The scientific research team led by Professor Pfurtscheller in Austria is the pioneer and leader of BCI technology research. The team conducted a lot of research on the BCI system based on the EEG signal of motor imagery, and proposed the concepts of ERD and ERS for the first time (Pfurtscheller, 1992). In 2000, the team developed the Graz-BCI system based on the left and right hand motor imagery EEG signals and the motor sensory region mu and beta rhythm signals, and successfully realized the control of the cursor and the robotic arm (Pfurtscheller et al., 2002). Matsunaga et al. developed a wheelchair control system based on the EEG signal of motion imagination, which can perform basic movement and control operations (Tanaka et al., 2005). In 2008, the research team of the University of Tokyo in Japan used VR technology to conduct feedback training on subjects for the first time, which greatly improved the recognition rate of the subjects’ motor imagination EEG signals (Fujisawa et al., 2008). The Birbaumer laboratory in Germany designed an SCP-based mind converter system. The user can use the EEG signal to control the input of characters, so as to achieve communication with the outside world (Birbaumer et al., 2003). In 2011, a research team from the Technical University of Berlin, Germany, developed a vehicle emergency brake assist system based on EEG signals. This system is 130 ms faster than manual operation and effectively shortens the braking distance (Haufe et al., 2011). In 2015, the Wadsworth Research Center in the United States and Karlsruhe Technical Research Institute in Germany jointly developed the “Brain-to-text” system (Herff et al., 2015). The system uses automatic speech recognition technology to convert human brain activity into corresponding text when speaking. This confirms the possibility of human-computer interaction based on natural speech-related cortical activity. In 2019, the team of Professor Bin He from Carnegie Mellon University in the United States and the University of Minnesota successfully developed the first “non-invasive mind control robotic arm” in history (Edelman et al., 2019). This is a non-invasively connected brain-computer interface system. Users can control the robotic arm to quickly track the randomly moving computer cursor through their mind and imagination. The system has achieved a nearly 60% improvement in learning performance, and the academic performance has also increased by more than five times compared with the previous one. In March 2020, Professor Edward Chang used Recursive Neural Network technology to learn neural features of EEG signals generated by epilepsy patients when they read aloud, and decode them into text sentences. The study achieved 97% accuracy (Makin et al., 2020).
Although China’s sports imagination BCI technology started late, it has also made some progress. The BCI team led by Professor Gao Shangkai of Tsinghua University developed a BCI system in 2007 that uses left and right hand and foot motion imaginary EEG signals to control robotic dogs to complete football kicks (Wang et al., 2007). In 2010, the BCI team of South China University of Technology developed a hybrid BCI system that combined P300 and Mu/Beta rhythms to control the movement of a two-dimensional cursor (Li et al., 2010). In addition, the team used the same method to implement a wheelchair control BCI system in 2012 (Long et al., 2012). In 2015, Xu Baoguo and others from Southeast University developed an online robot control system based on MI-BCI (Xu et al., 2015). On this platform, the feature extraction and classification of the EEG signal of hand movement imagination are realized, and the average classification accuracy rate reaches 91.5%. In 2016, Tang Zhichuan of Zhejiang University and others developed an exoskeleton upper limb rehabilitation robot based on brain control of motor imagination (Tang et al., 2016). The research achieved the highest online classification accuracy rate of 84.29 ± 2.11%. As an effective method to control the exoskeleton of the upper limbs, this research provides a non-invasive brain-controlled active upper limb rehabilitation strategy for clinical applications.
Many experts and scholars have achieved excellent results in the research of brain-computer interface systems and various analysis methods for EEG signals, which has also made a huge promotion for the scientific and effective analysis of EEG signals. Juneja et al. proposed an EEG classification method based on the ELM model, which is characterized by extracting the individual and mutual features of the data set (Juneja and Rana, 2019). Tan et al. proposed an improved ELM model for the classification of synchronous EEG (Tan et al., 2017). Zhang et al. used the differential entropy and attention model to classify EEG, so as to realize the automatic recognition of epilepsy (Zhang et al., 2020). However, the following problems still exist in the practicality of the brain-computer interface. First, the research on the classification of EEG signals for motor imaging mainly focuses on the two-classification problem, which is not enough to meet the actual needs. Second, the algorithm runs for a long time, and it is difficult to meet the user’s requirements for timeliness. Third, the recognition rate needs to be further improved to improve the accuracy of issuing instructions. In response to these problems, this article intends to propose a motor imagery EEG classification method based on ELM algorithm. The main work of this paper is summarized as follows:
(1) The structure and operation process of the MI-BCI system are introduced. The system mainly includes three modules: preprocessing, feature extraction, and classification and recognition. The preprocessing steps in this article include data interception and band-pass filtering. Data interception refers to excluding the preparation and rest phases from the original EEG signal data segment, and only retains the motor imagination phase. Feature extraction includes lead selection, Local Characteristic-scale Decomposition (LCD) feature extraction, and Common Spatial Pattern (CSP) feature extraction. The classification recognition method is the ELM regression model, and the classification is performed by the regression method.
(2) A feature fusion method is used in the feature extraction module. The time domain features obtained based on the LCD feature extraction method and the spatial domain features obtained based on the CSP feature extraction method are combined in series to obtain a fusion feature.
(3) The classic ELM model is used for classification and recognition. The input weight matrix and hidden neuron bias matrix of ELM’s hidden layer is randomly generated and obey any continuous probability distribution, so only the output weight matrix is required to be solved, and the input weight and hidden layer bias need not be adjusted iteratively. Therefore, the calculation amount and time complexity of the algorithm will be much smaller, and the training speed will be much faster. Recognition based on this model is more suitable for tasks that require high response time.
MI-BCI System Structure
The MI-BCI system has different practical applications in different fields and scenarios, but a complete MI-BCI system is basically composed of five parts as shown in Figure 1.
(1) EEG signal acquisition. EEG signal acquisition is mainly responsible for EEG signal acquisition and storage. EEG signal acquisition methods can be divided into two types: non-implantable and implantable. In actual research, non-implantable acquisition methods are used in most cases, that is, the acquisition electrode is directly placed on the corresponding position of the subject’s scalp to record the EEG signal. At the same time, the collected EEG signal is amplified and processed and A/D converted, and the processed result is stored.
(2) Pretreatment. The signal-to-noise ratio of the EEG signal is very low, and it is easily affected by external noise and other biological signals. It is very necessary to preprocess the EEG signal before analyzing and processing it, so as to reduce the artifact interference in the signal and improve the signal quality.
(3) Feature extraction. Feature extraction is one of the most important links in the MI-BCI system. Its purpose is to learn distinguishing features from the preprocessed EEG data, which is the feature that best reflects the true thinking activity of the brain. The commonly used methods include short-time Fourier transform, wavelet packet transform, common space mode algorithm, etc. (Cheng et al., 2019; Hu et al., 2019; Liu et al., 2020; Wang et al., 2020).
(4) Classification and identification. The classification and recognition of EEG signals is one of the key links that determines the performance of the BCI system. The role of this link is to integrate the extracted features and build a classification model. The classification model can establish a mapping relationship between the signal features and the subjects’ real consciousness activities, so as to realize the feature classification of EEG signals. For EEG signals with different characteristics, commonly used classifiers include Fisher discriminant classifier, support vector machine, neural network algorithm, etc. (Rozza et al., 2012; Rubén et al., 2019; Dib et al., 2020; Ghonchi et al., 2020; Luo et al., 2020; Srirangan et al., 2020).
(5) Equipment control system. The function realized by the equipment control system is to convert the classification and recognition results of EEG signals into control commands for peripheral equipment. Common peripheral devices include character input systems, smart wheelchairs, robotic arms, etc.
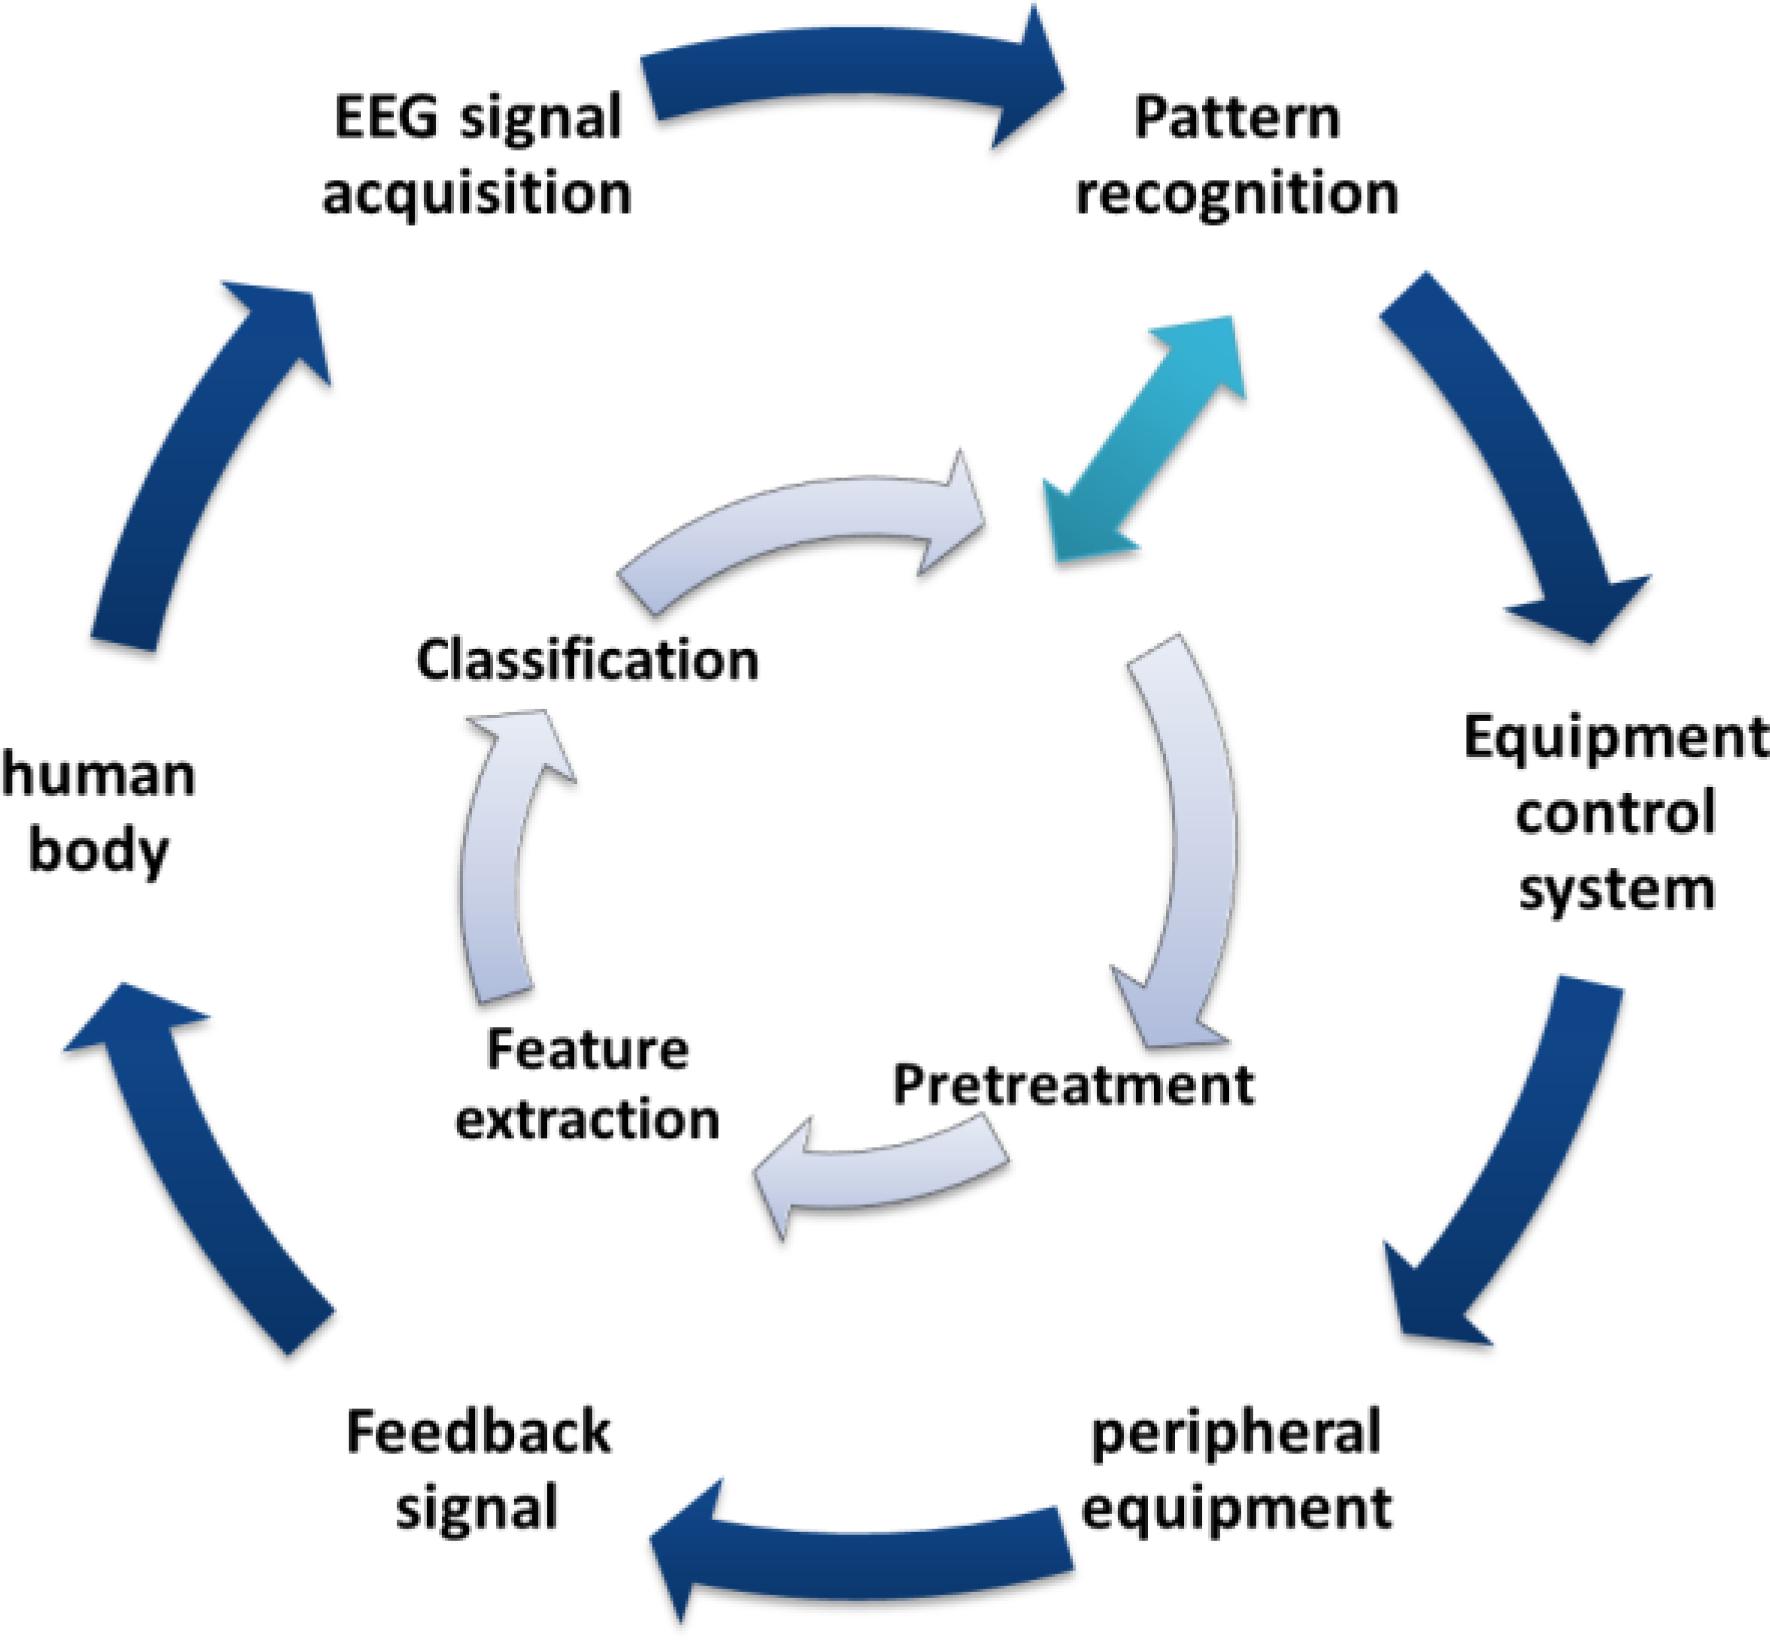
Figure 1. MI-BCI system structure.
ELM-Based Motor Image Recognition Method
Identification Process
The identification process is shown in Figure 2. First, preprocess the collected motor imaging EEG signals. The preprocessing methods include data interception and band-pass filtering. Data interception removes the original EEG signal data segment from the preparation and rest phases, and only retains the motor imagination phase. Band-pass filtering retains the effective components of the EEG signal in the frequency range of 0.5–30 Hz, and removes irrelevant EMG and ECG components. Second, feature extraction. The time-frequency energy feature and spatial domain feature of EEG signal are extracted, and the features are fused. Third, the extracted features are input into the trained ELM model to obtain the classification result. Fourth, the device is controlled by the mapping relationship between the classification result and the control instruction.
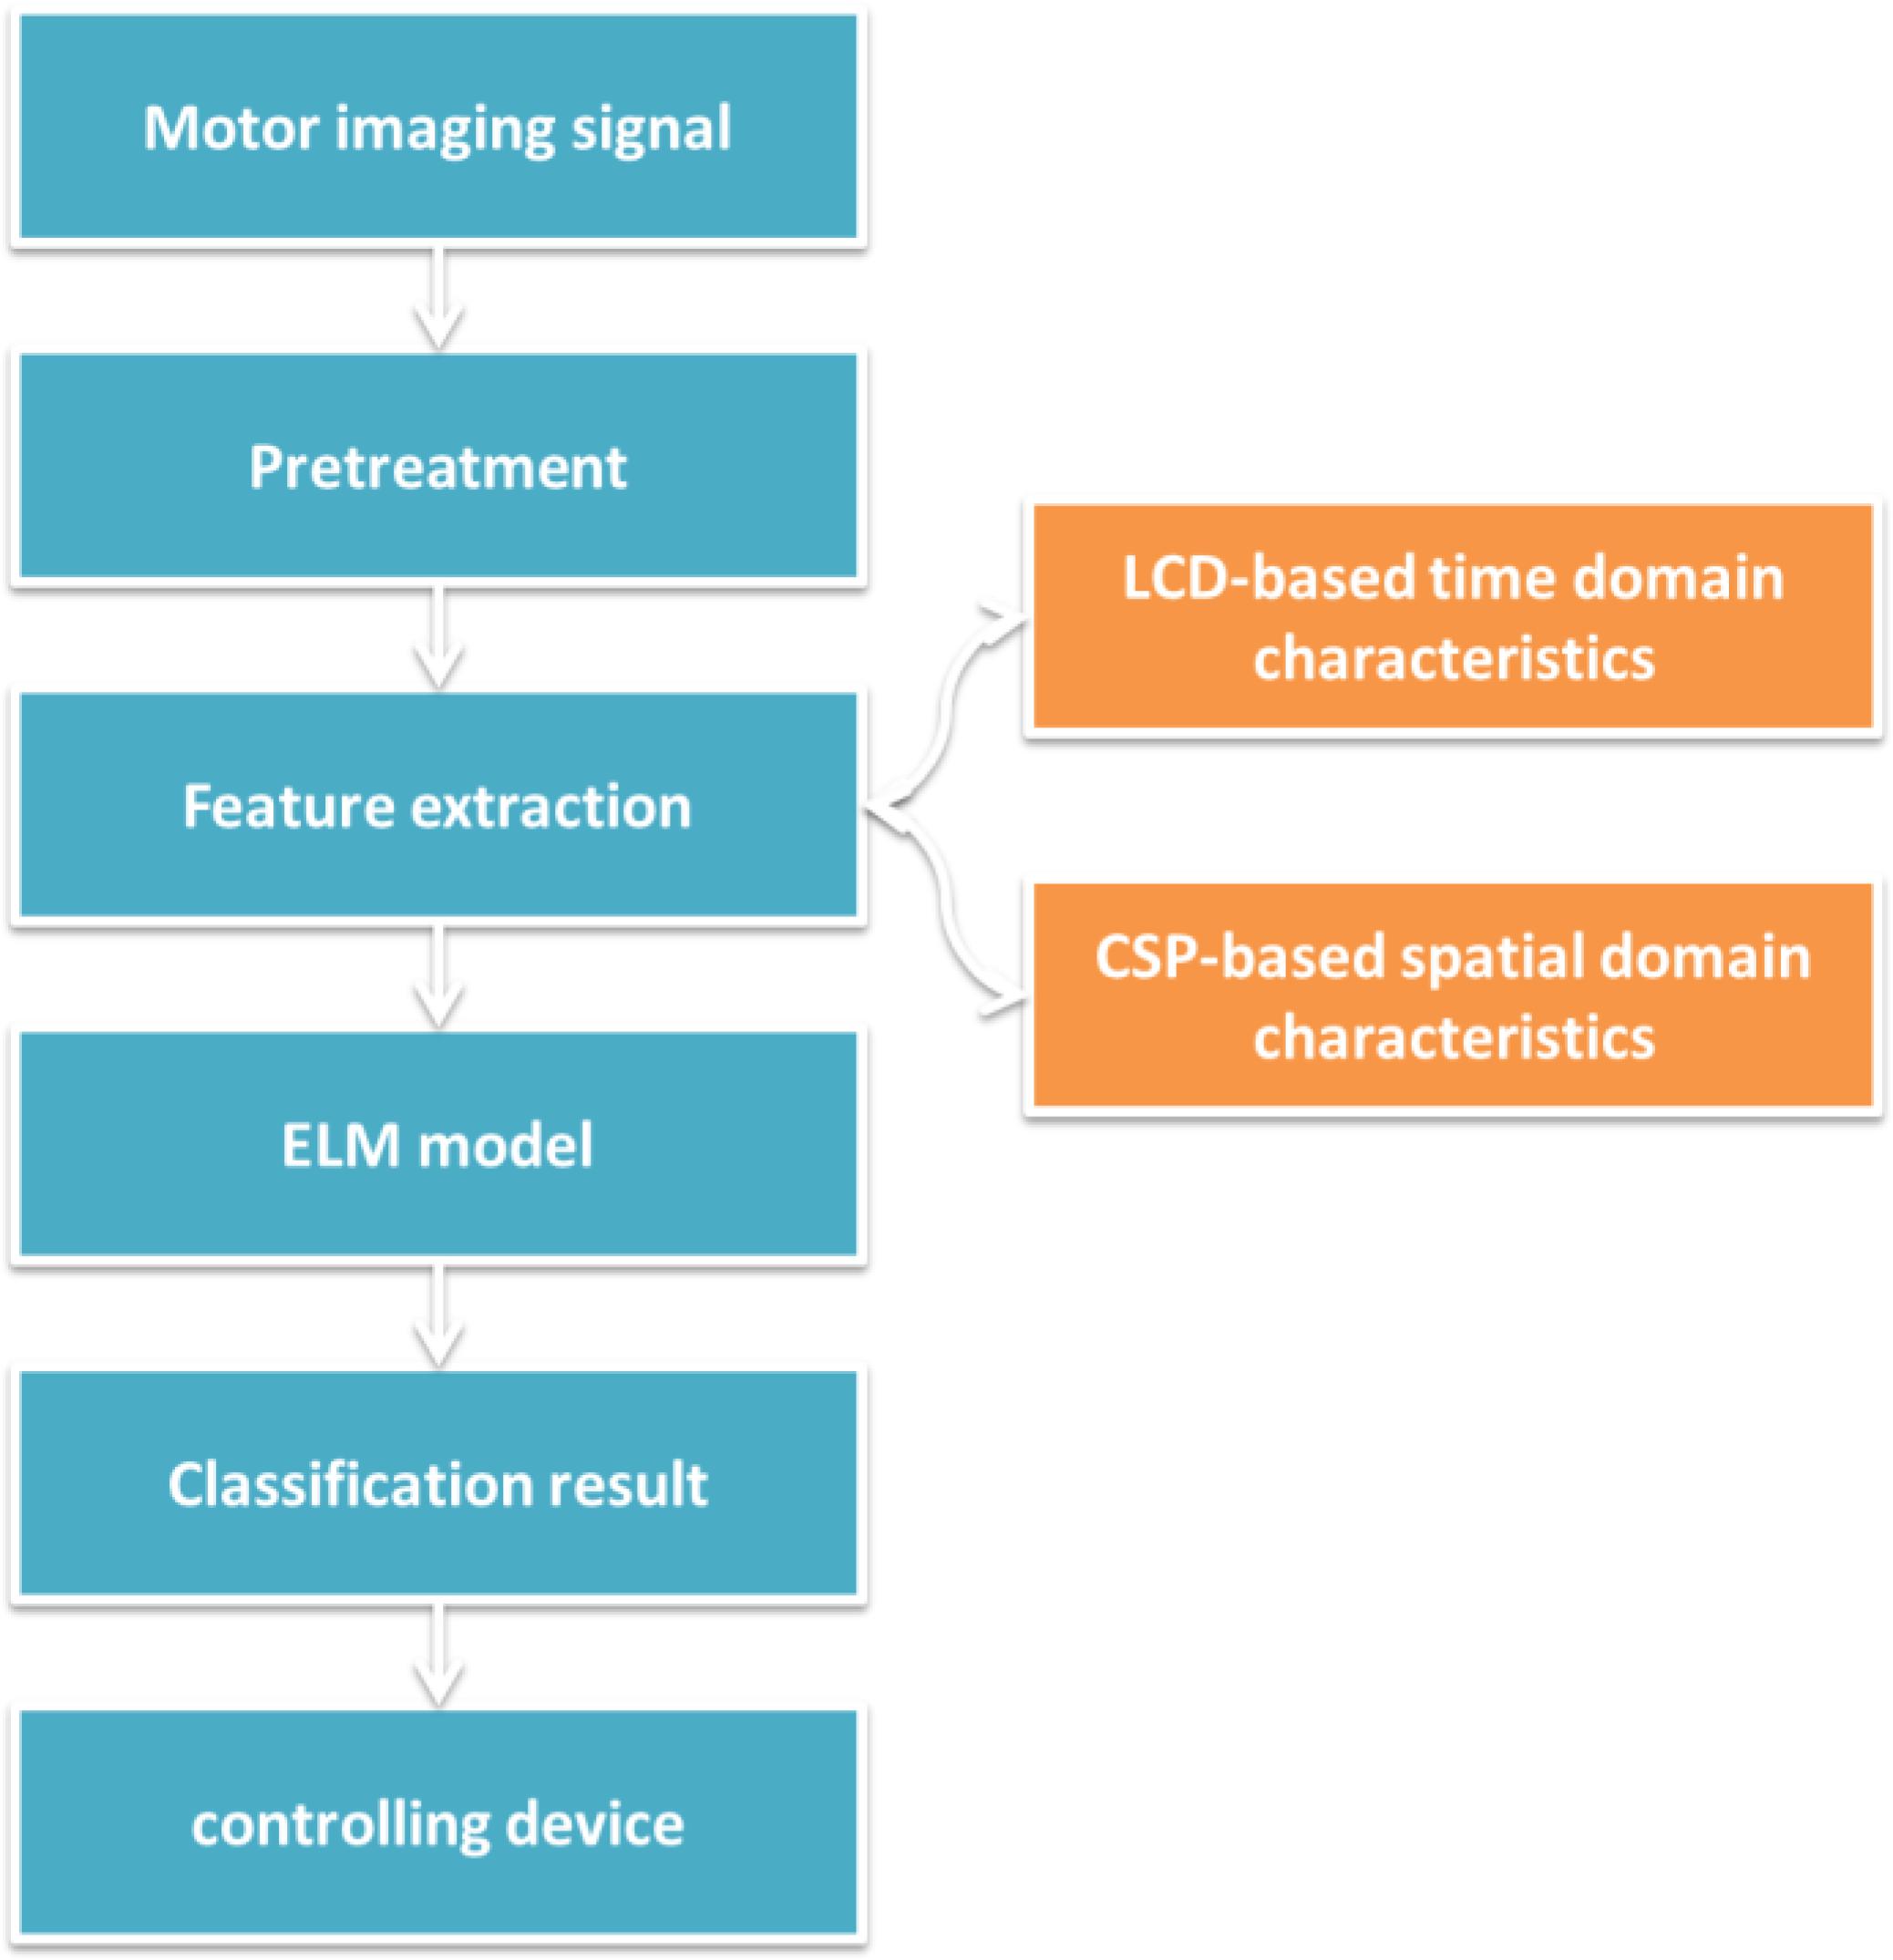
Figure 2. Motion image recognition process based on ELM.
Feature Extraction
It is necessary to select the lead before feature extraction. The pre-processed signals are calculated and sorted by the contribution rate, and the four leads with the highest information validity are distinguished from the remaining 18 leads. LCD (Yang et al., 2012) is used to decompose four lead EEG signals, 12 intrinsic scale components (ISC) are obtained, and the time-frequency energy feature vector V1 is obtained. To obtain the time-frequency energy of 12 ISC components, the expression of the time-frequency energy is as follows
ISCij(t) refers to the first three layers of ISC components with length N obtained by decomposing each lead. Through the above processing, the time-frequency domain feature vector group V1 = [H11,…,H13,…,H43] is obtained. CSP (Dornhege et al., 2004) decomposes the remaining 18 leads EEG signals to obtain the spatial domain feature vector V2. A series fusion strategy is adopted to connect V1 and V2. The multiple features are normalized first, and then concatenated end to end. The mathematical expression is as follows:
ELM Classification Model
Single hidden layer feed-forward neural networks (SLFN) has been widely used because of its very strong nonlinear approximation ability. The latest research progress on SLFN learning is the Extreme Learning Machine (ELM) algorithm (Tamura and Tateishi, 1997; Huang, 2003; Huang et al., 2004, 2006). ELM is a single-layer feed forward network with fast training. There are only three layers in the network: The Input Layer, the Hidden Layer and the Output Layer. Figure 3 shows the three-tier structure of the network.
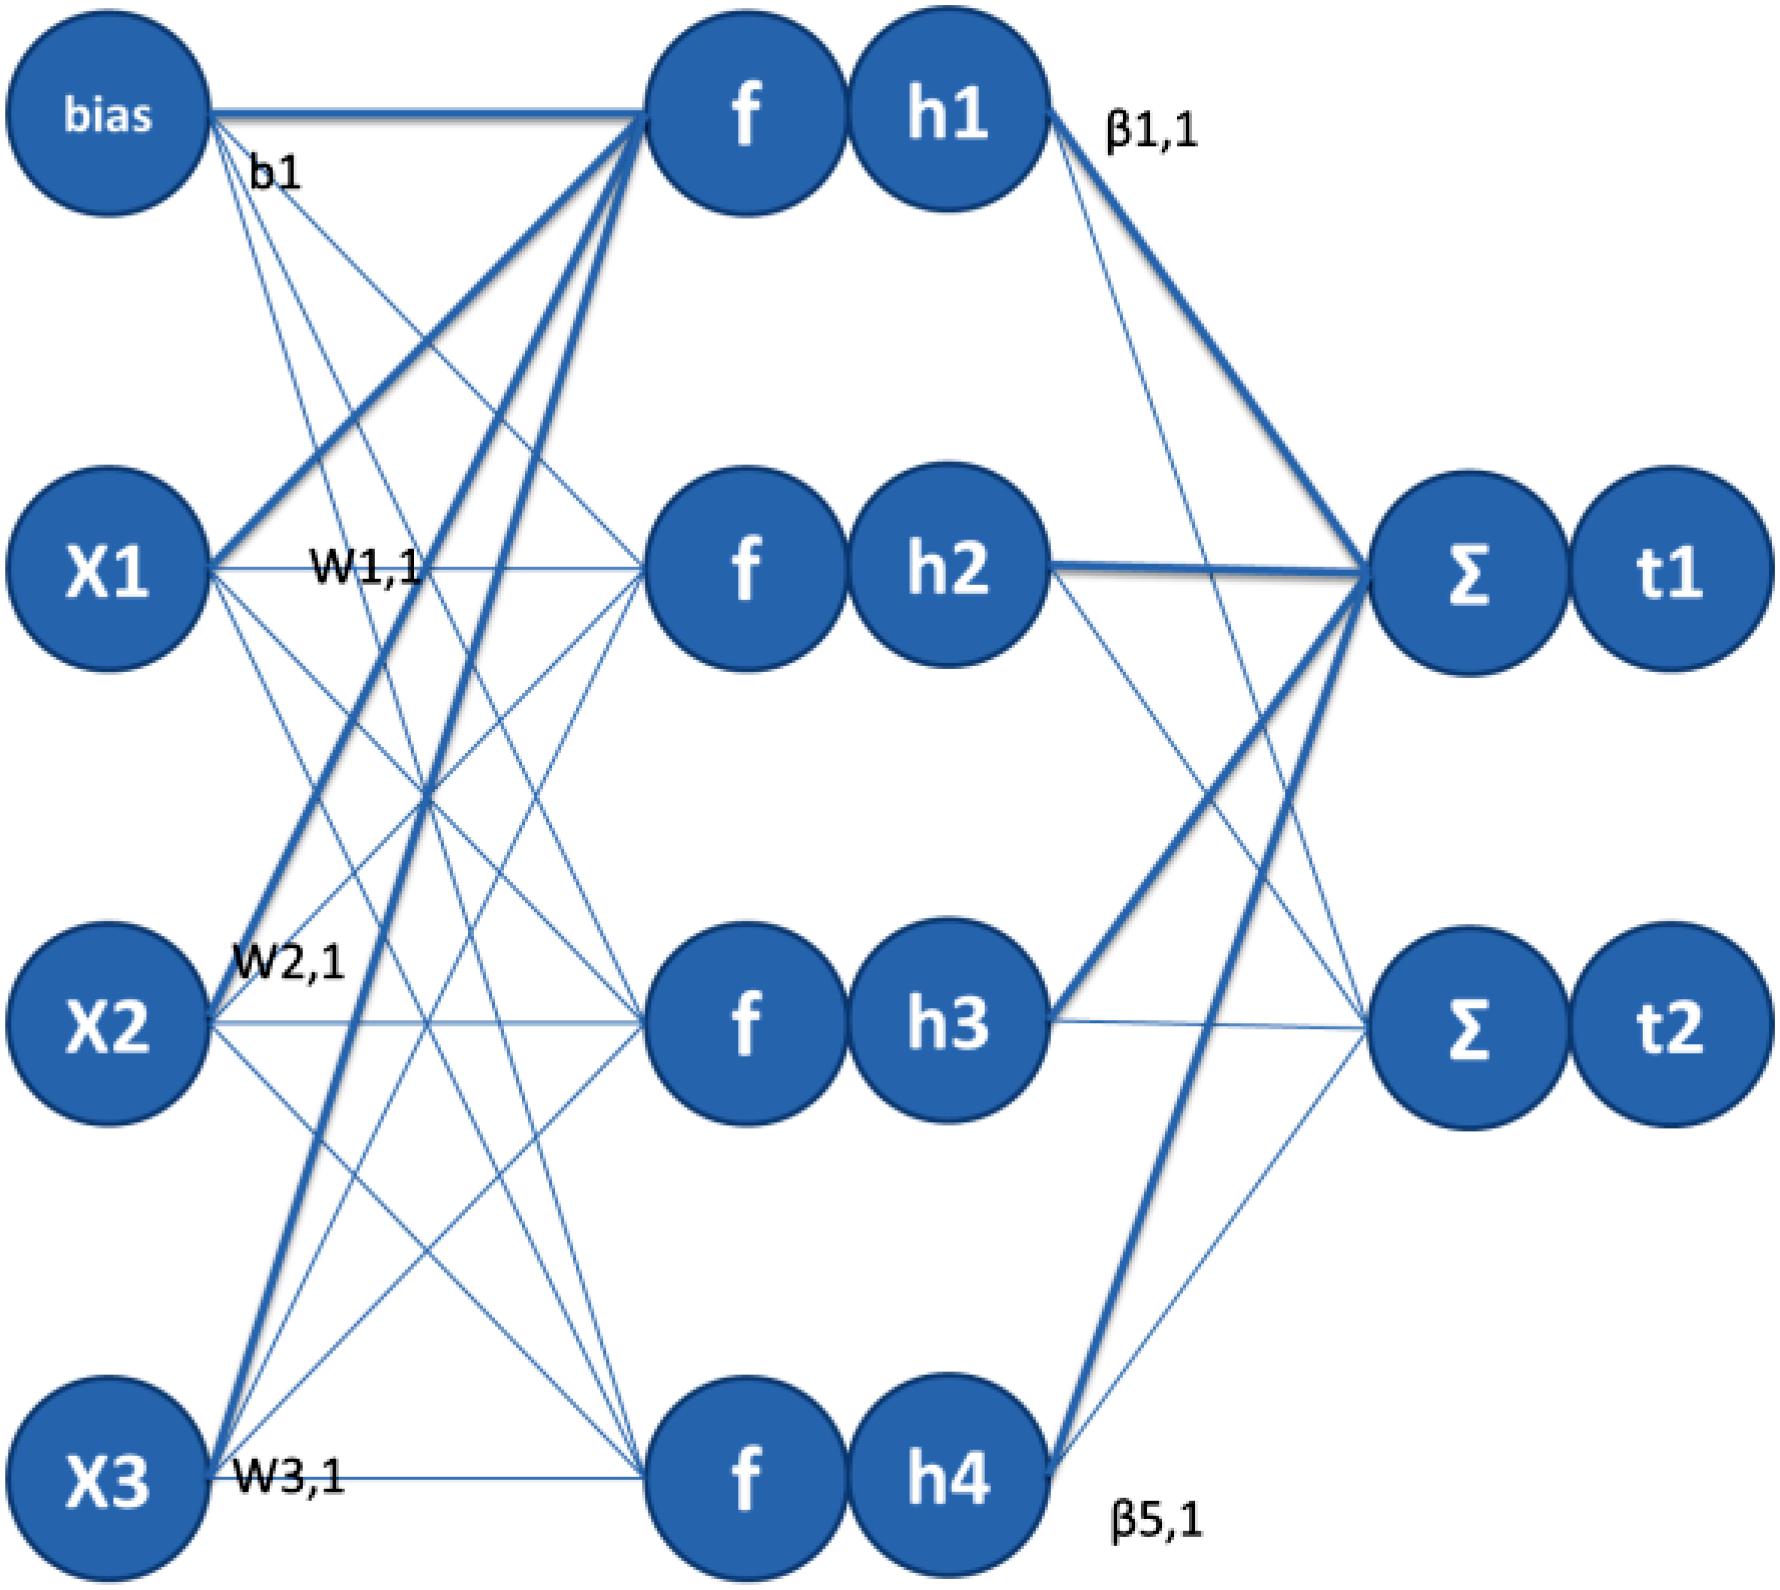
Figure 3. Motion image recognition process based on ELM.
In the Input Layer, each sample of each training set will have a corresponding weight and offset. There are two ways in ELM: one is to manually enter these weights and offsets, and the other is to automatically generate weights and offsets through ELM toolbox. Random generation is based on the size of the original data and the sigmoid neuron function. For a linear Output Layer, randomly generated weights can better reflect the performance advantages of ELM. ELM is a regression model, but it is also suitable for classification. If the different categories are separate and independent, create a target for each category separately. The target of the class that can be matched is set to 1, and the target of the unmatched class is set to 0. This encoding creates a unit-length vector for each category. This vector is orthogonal to all other classes of vectors. The distance between the target vectors of different categories is the same, so the independence of the categories can be maintained. The prediction category is assigned based on the target with the largest ELM output.
Literature (Huang et al., 2006) pointed out and proved that if the activation function g(x) is infinitely differentiable, then, for a given arbitrarily small approximation error, the input layer weights and hidden layer thresholds arbitrarily select the number of hidden nodes N′≤N, where N is the number of training samples. According to the above theory, when the activation function g(x) is infinitely differentiable, all network parameters do not need to be adjusted. The input weight wi and the hidden layer threshold bi can be randomly assigned during training, and they are fixed during the training process. For the selected sample data, the hidden layer output matrix is fixed. Therefore, the parameter training of ELM is transformed into solving the following linear regression problem:
Here, β can be obtained by solving the least squares solution of the linear system Hβ = T. For the multiple-input single-output data set D = {(xn,tn)|xn∈Rp,tn∈R,n = 1,2,…,N.}, the following optimization problems can be solved:
where is the hidden output matrix. β = [β1,β2,…,βN′]T is the output node, T = [t1,t2,⋅⋅⋅,tN]T is the hidden layer connection weight vector. The least square solution of Eq. (3) is
where H+ is the Moore-Penrose generalized inverse of the hidden output matrix H. The optimal solution A has the following important characteristics (1) The smallest training error can be obtained through this solution; (2) The weight vector of the smallest normal form is obtained; (3) The least squares solution of the paradigm is unique, so the algorithm will not produce a local optimal solution.
Experimental Process and Results Analysis
Experimental Data Set
The data set used in this article is the BCI competition data set provided by Graz University. The description of the experimental data is shown in Table 1.

Table 1. Data set introduction.
Experimental Setup
To verify the effectiveness of the method used in this paper, the selected contrast classifiers include support vector machine SVM (Shahyad et al., 2019), Bayesian classifier (Bayesian) (Zhang et al., 2016), Takagi–Sugeno–Kang (TSK) (Gu et al., 2017). To verify the superiority of the fusion features, the individual time-frequency features and spatial domain features were compared with the fusion features of the two in the experiment process. This paper uses the classification accuracy rate acc and the kappa coefficient to measure the classification accuracy to evaluate the classification performance of the model. The larger the kappa coefficient, the better the algorithm performance. The mathematical expression of the kappa coefficient is as follows:
where acc represents the classification accuracy rate, and N represents the number of categories. The value range of kappa is [0,1]. The larger the value, the stronger the consistency and the higher the classification accuracy. During the experiment, the data set was divided into training set and test set. The training set is used to build the classifier model, and the test set is used to evaluate the accuracy of the model for predictive classification of unknown samples. To scientifically test the classification accuracy rate and avoid misleading the experimental results caused by a single classification result, this article adopts fivefold cross validation. Each time, the data set is divided into five parts, and four of them are used as training data to obtain the model completely randomly. The remaining one is classified as test data. The trained classifier model is used to classify the test set. From the classification results, the accuracy rate acci (i = 1, 2,…, 5) and the Kappa coefficient Ki (i = 1, 2,…, 5) can be obtained. The above process is repeated five times, and the average value of five times is used as the final accuracy of the algorithm. The final calculation formula of the experimental results is as follows, where F is 5.
Discussion of Experimental Results
(1) Data Sets IIb
In order to demonstrate the effectiveness of the method in this paper, this paper compares feature extraction and classifier performance. The experimental results on the Data Sets IIb data set are shown in Tables 2, 3. Figures 4, 5 show the classification accuracy and Kappa coefficient obtained by each classification model on the Data Sets IIb data set. The classification on this data set is a binary classification problem.
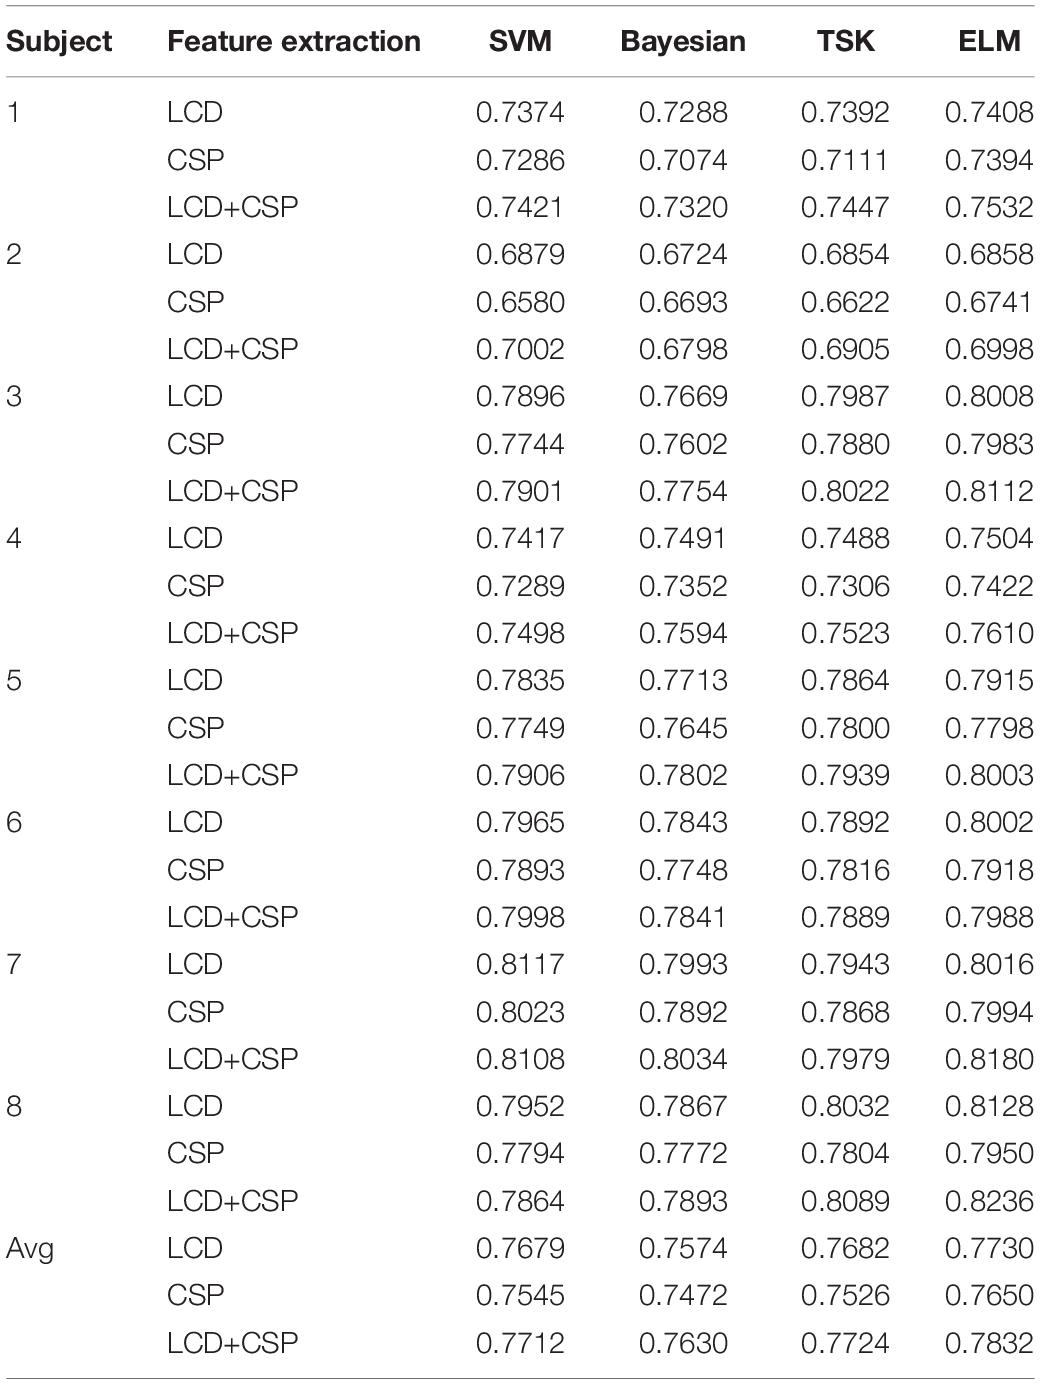
Table 2. Classification accuracy of data sets IIb.
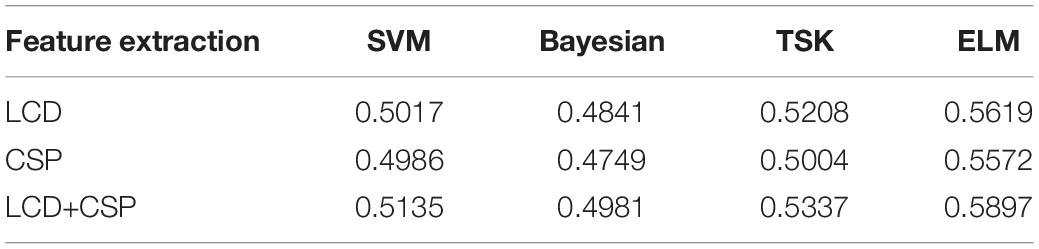
Table 3. Kappa coefficient of Data Sets IIb.
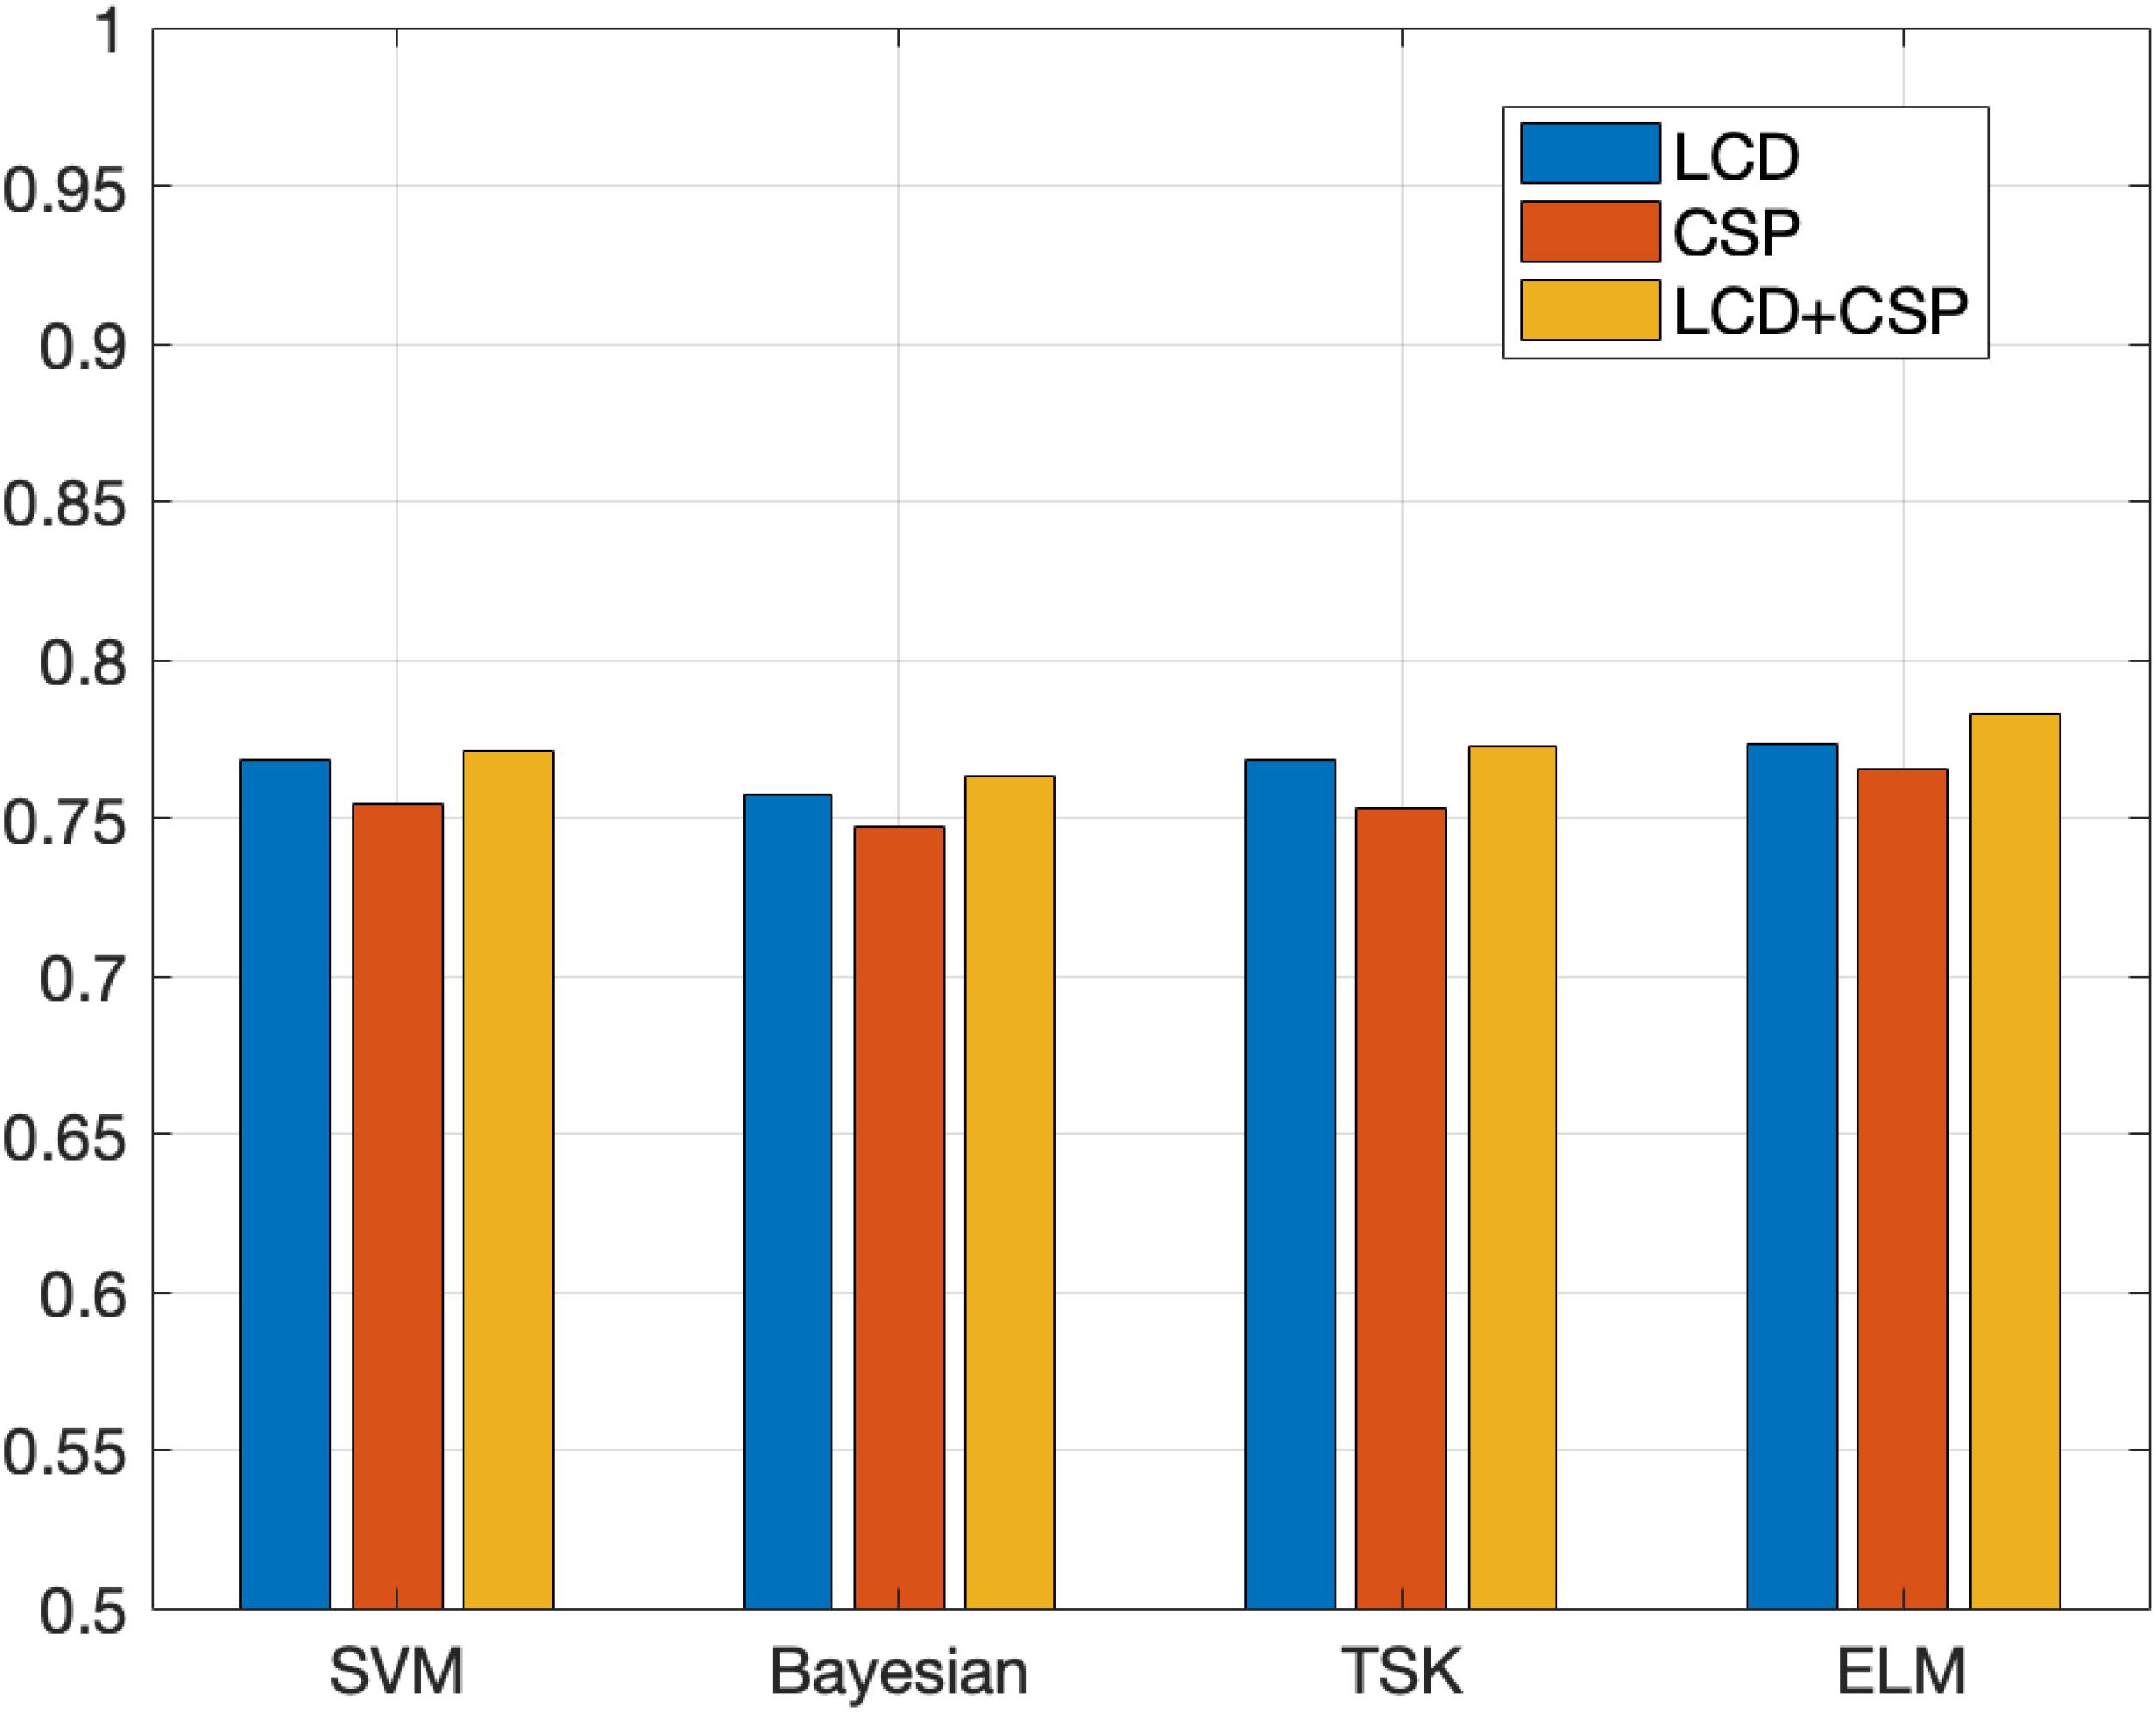
Figure 4. Classification accuracy obtained by each classification model on the Data Sets IIb.
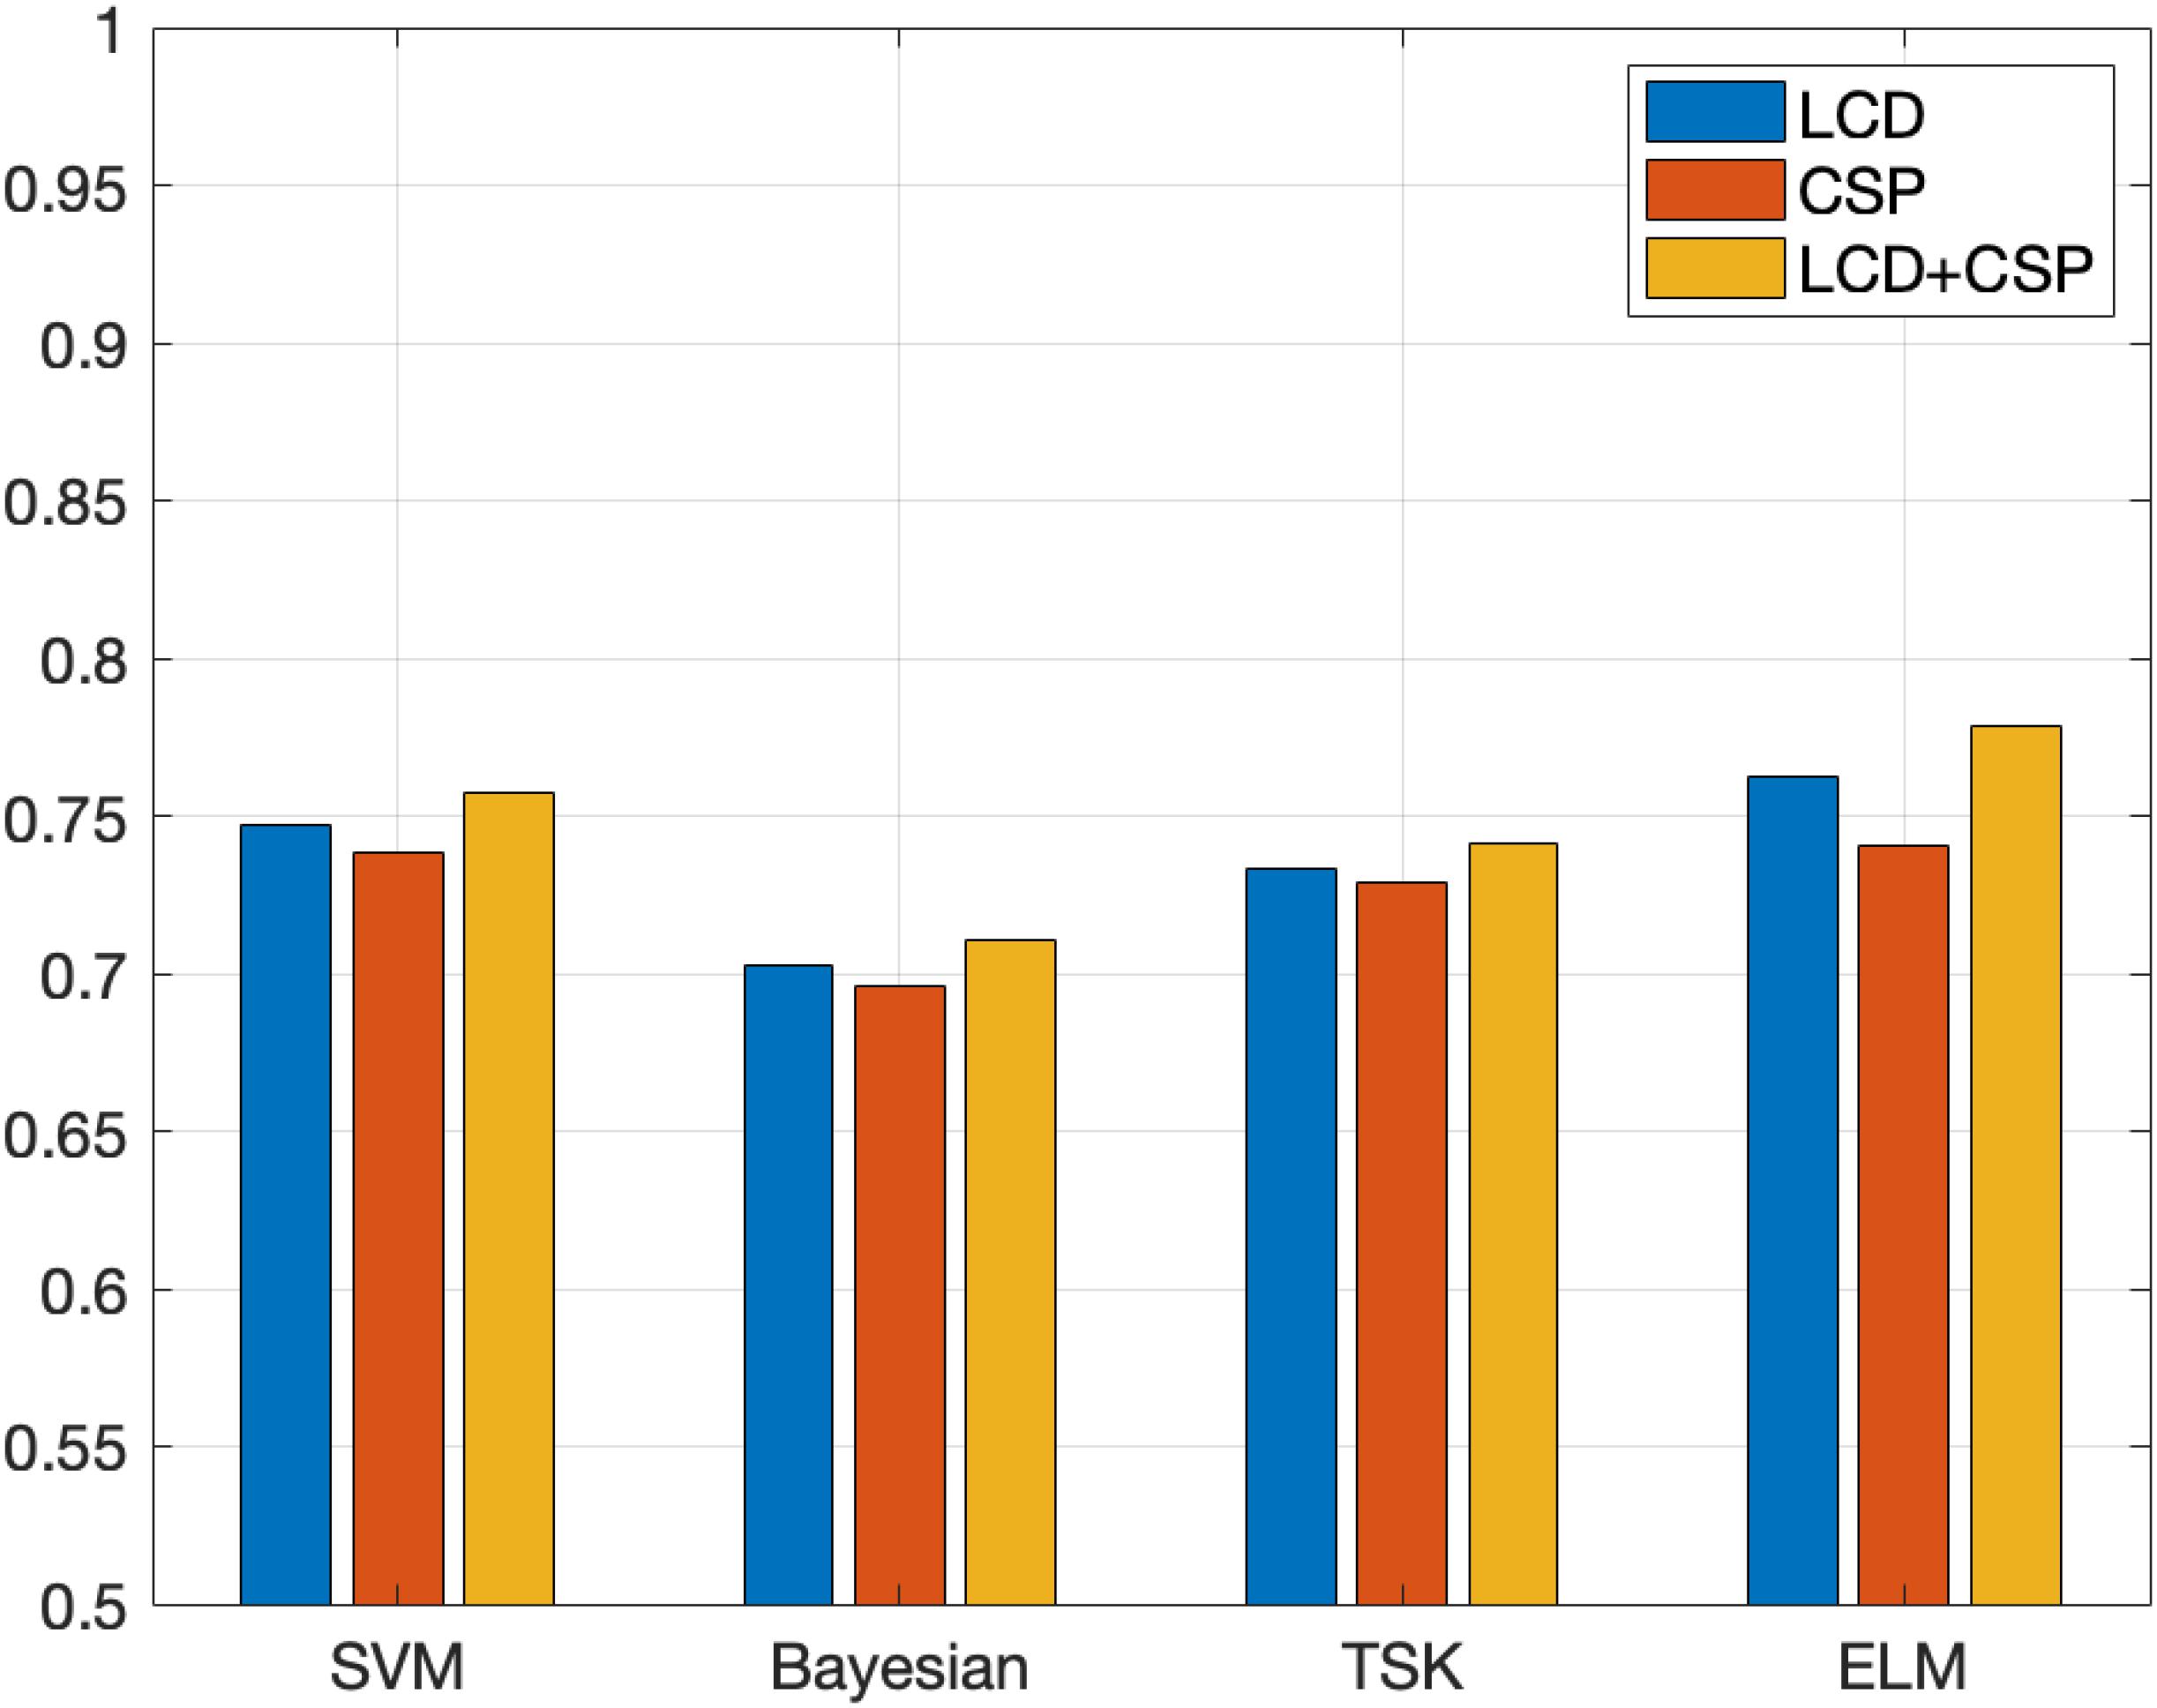
Figure 5. Kappa coefficient obtained by each classification model on the Data Sets IIb.
The experimental results on Data Sets II give two feedback points. (1) The three features are the time domain features based on the LCD feature extraction method, the spatial domain features based on the CSP feature extraction method, and the fusion feature obtained by combining the time domain feature and the spatial domain feature. The classification results obtained based on the above three features show that the classification effect obtained by fusing the features is the best. Different feature extraction methods perform basically the same on the four classification algorithms. For each classifier, the classification effect based on fusion features is the best. This shows that the information of fusion features is richer and more comprehensive, which is more conducive to classification tasks. In most classification algorithms, the classification effect based on the LCD feature extraction method is better than the classification effect based on the CSP feature extraction method. This shows that time domain features have higher information value than spatial domain features. (2) Comparing the four classification algorithms, the ELM algorithm used in this article has the best performance, followed by TSK, third is SVM, and the worst is Bayesian. For other types of classification algorithms, ELM can initialize the input weights and biases randomly to get the corresponding output weights. This algorithm can be faster than traditional learning algorithms under the premise of ensuring learning accuracy. This is the reason why this algorithm is chosen as the classification model in this article.
(2) Data Sets IIIa
The classification results on the Data Sets IIIa data set are shown in Tables 4, 5. Figures 6, 7 show the classification accuracy and Kappa coefficient obtained by each classification model on the Data Sets IIIa data set. The classification of this data set belongs to four classifications.

Table 4. Classification accuracy of data sets IIIa.

Table 5. Kappa coefficient of data sets IIIa.
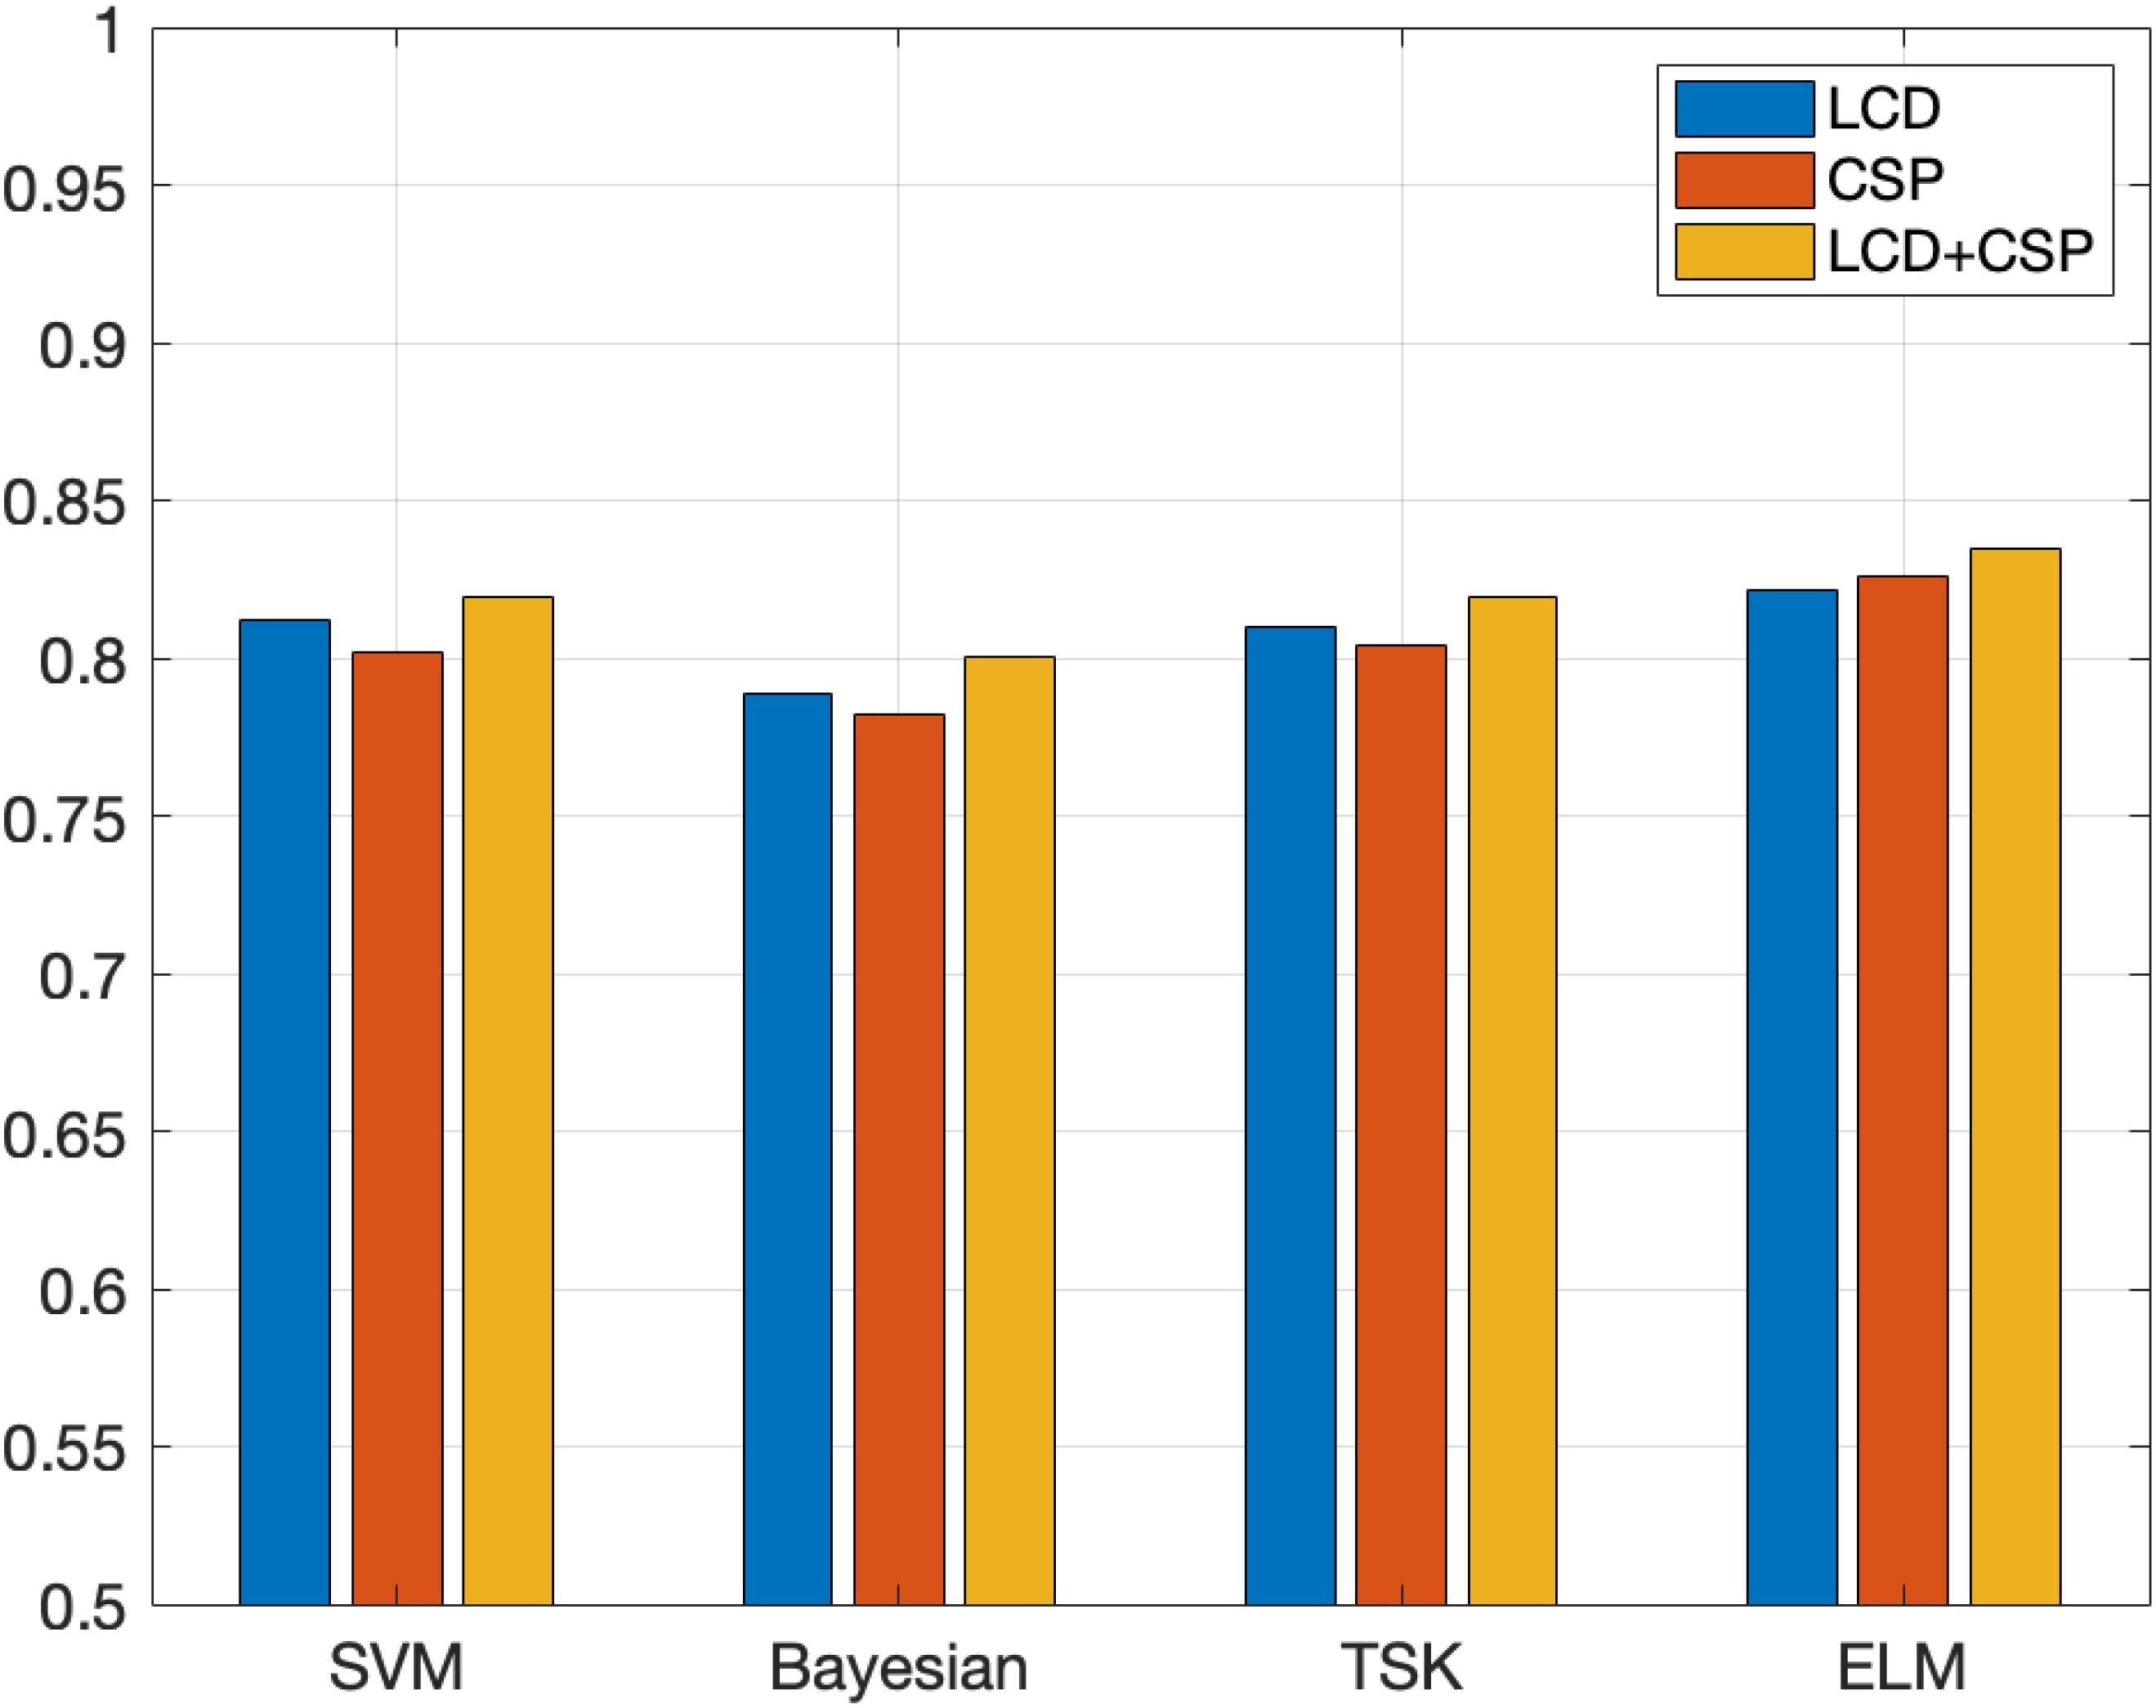
Figure 6. Classification accuracy obtained by each classification model on the Data Sets IIIa.
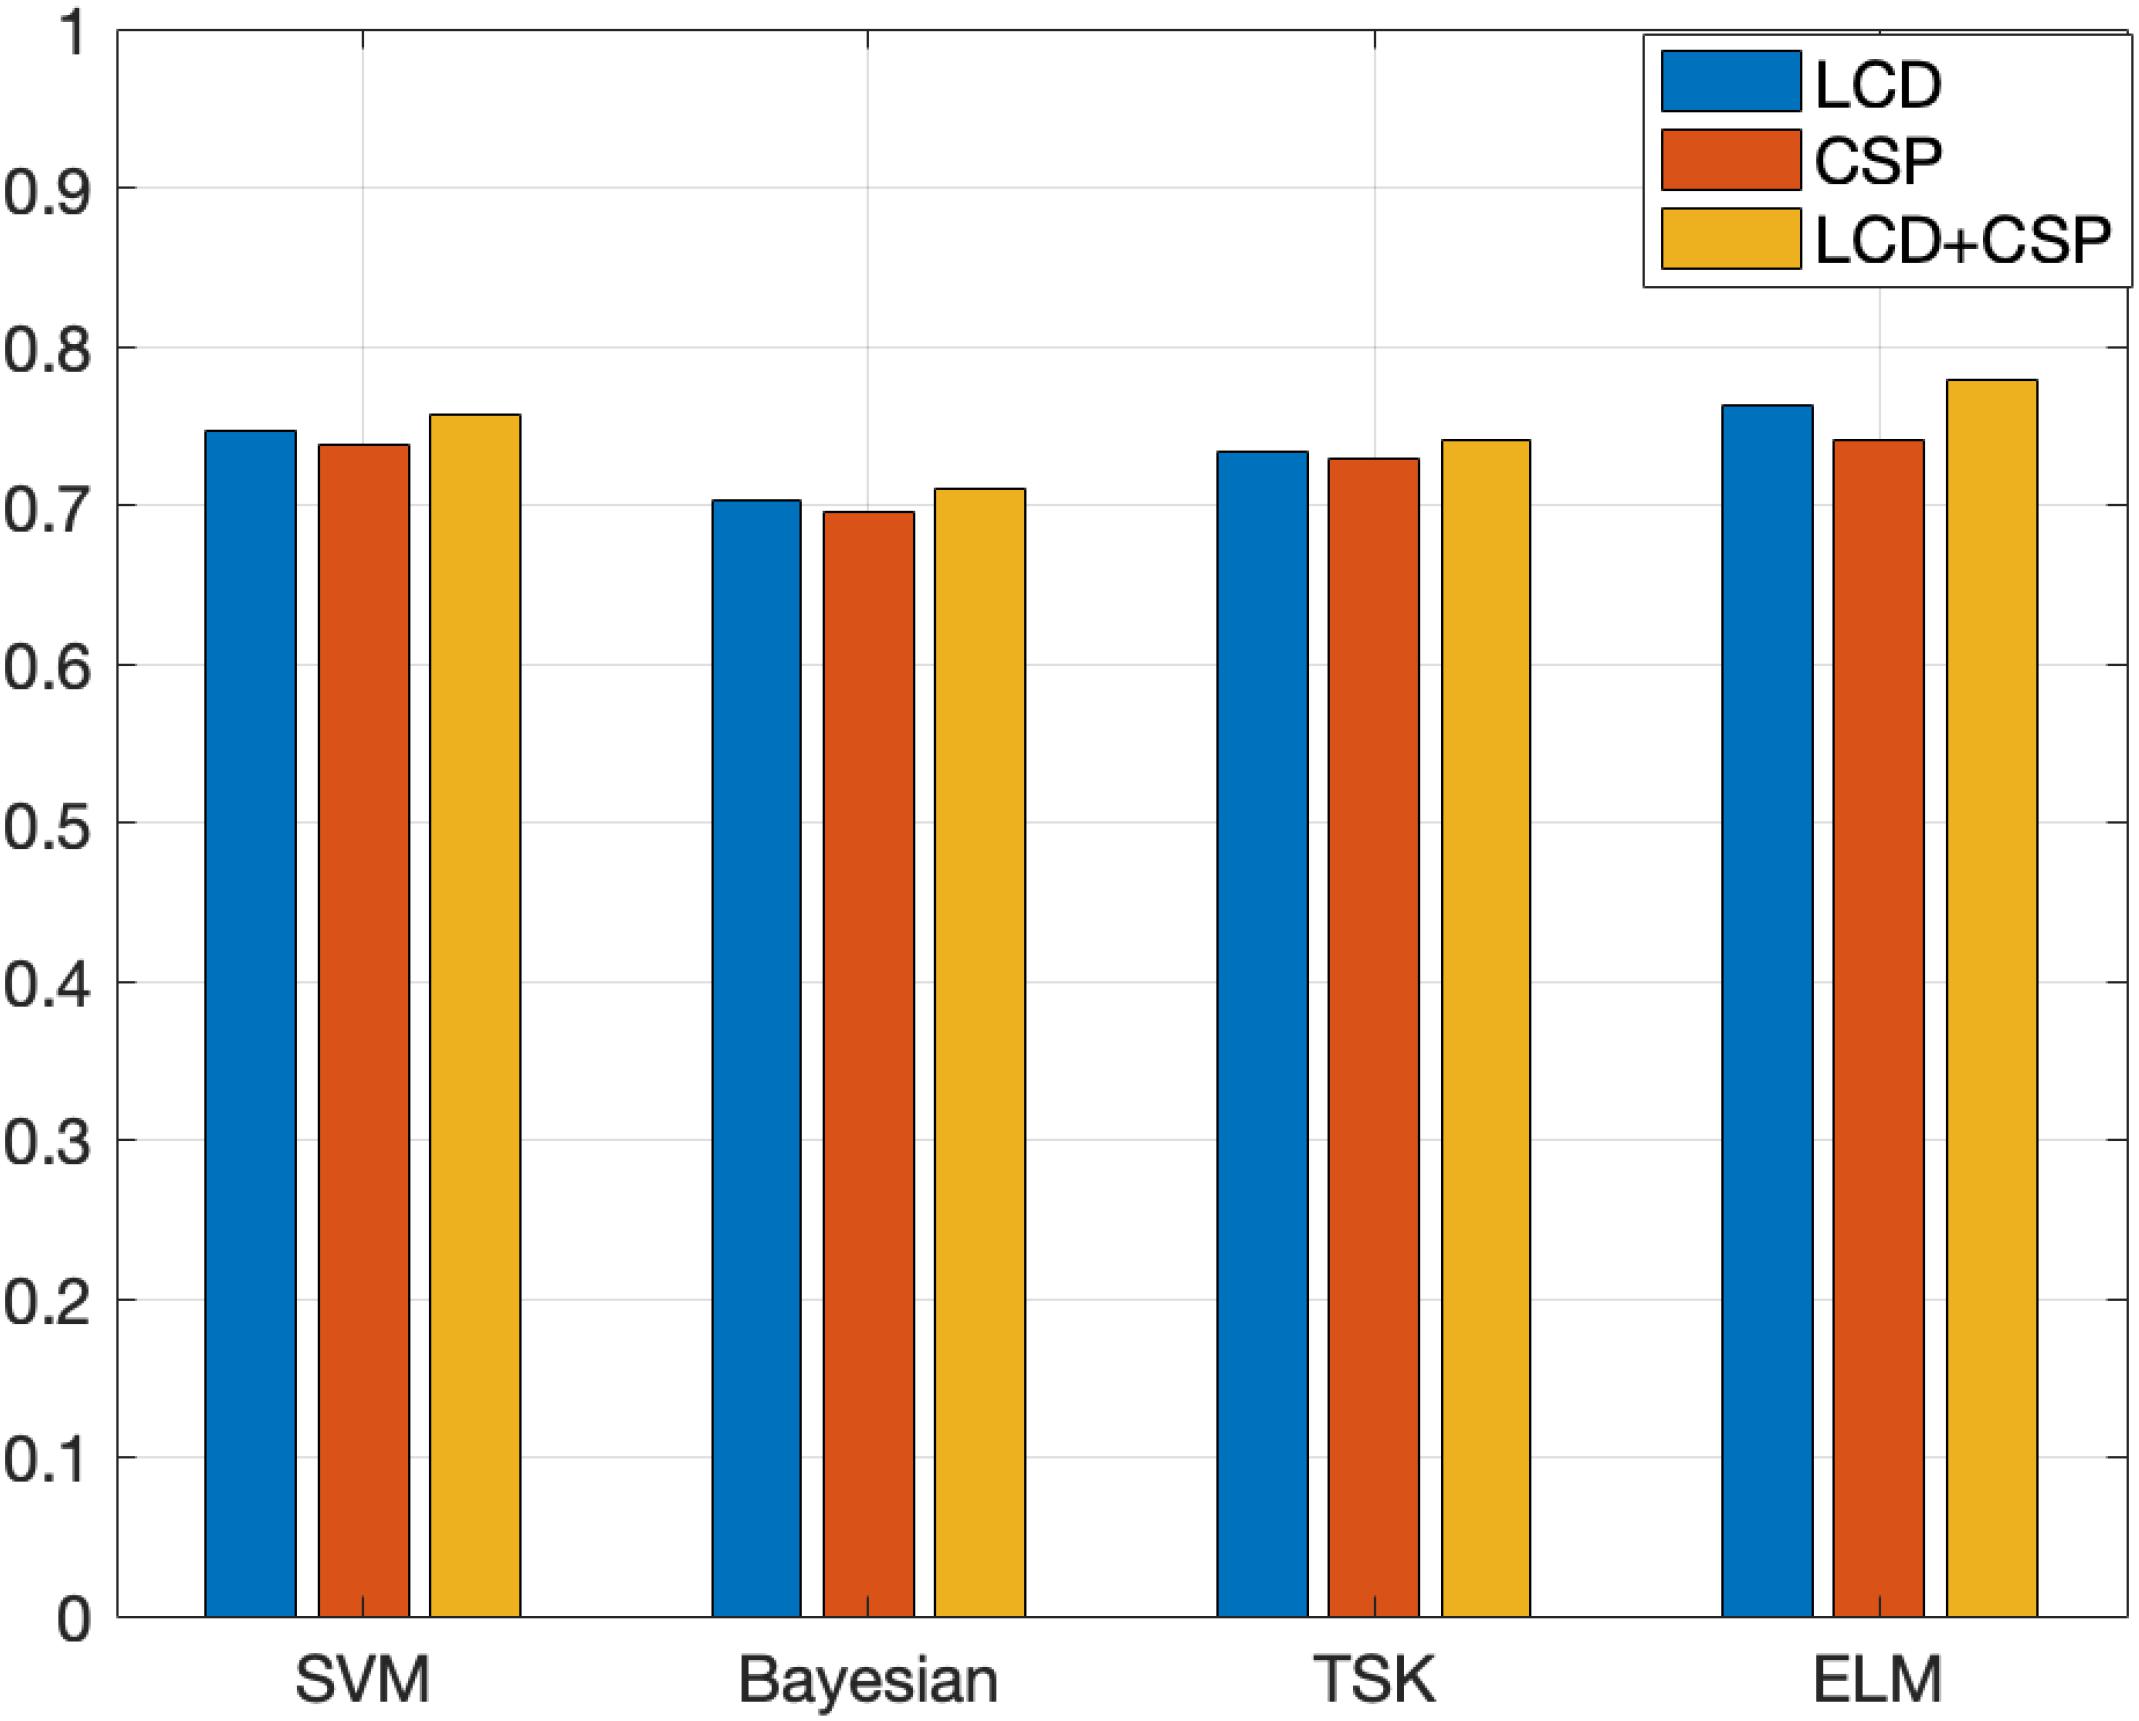
Figure 7. Kappa coefficient obtained by each classification model on the Data Sets IIIa.
The data set on Data Sets IIIa is classified into four categories, and the experimental results obtained are somewhat different from the experimental results on Data Sets II. By analyzing the experimental data in Tables 4, 5, the following conclusions are obtained. (1) The fusion feature extraction method among the three feature extraction methods has the best classification effect. On this data set, the classification effect based on the LCD feature extraction method is better than the classification effect based on the CSP feature extraction method, but the gap in classification accuracy is not very large. (2) The classification effect of the ELM algorithm is still the best, followed by SVM, TSK third, and Bayesian the worst. Compared with the experimental results obtained from the Data Sets II data set, the position of the best classification effect of ELM has not changed, but the classification effect of SVM classifier surpasses TSK. This fully demonstrates the feasibility and superiority of selecting ELM as the classification algorithm in this paper. Compared with other classification algorithms, the classification performance of the ELM algorithm is more stable and the advantages are more obvious.
Conclusion
A novel smart motor imagery intention human-computer interaction model using extreme learning machine and EEG signals is proposed. Aiming at the problems of low recognition accuracy, large individual differences, and feature redundancy in the current multi-classification problem of motor imagery EEG, this paper deeply studies the signal recognition methods of different limb motor imagery to improve the application of BCI system. The main work of this paper is summarized as follows: (1) A multi-feature fusion extraction method, namely the feature extraction method of LCD+CSP, is used. This method can extract the time-frequency domain and spatial domain features of the data set. The experimental results show that the classification result obtained by a single feature is not as good as the classification result obtained by the fusion feature. (2) The selected ELM algorithm is a mature and widely used classification algorithm with relatively high classification accuracy and fast running speed. ELM can initialize the input weights and biases randomly to get the corresponding output weights. This algorithm can be faster than traditional learning algorithms under the premise of ensuring learning accuracy. The experimental results verify that the ELM algorithm has certain classification advantages. The motion image intention recognition effect based on the method in this paper is close to the champion algorithm of BCI competition. Therefore, the human-computer interaction model designed based on the recognition results of this method is feasible to help patients recover. However, the data set used in this article is relatively simple, and they are all data sets in the BCI competition. In the follow-up, this research plans to use richer data sets for experimental research to verify the universality of the algorithm in this paper. The key to the effectiveness of the ELM model is whether it is necessary to extract features from the data. If feature extraction is meaningless, ELM can come in handy. If it is for the original data set, and feature extraction is very important, the classification effect of ELM is not ideal. In addition, ELM sacrifices too many meaningful patterns in data for speed. Therefore, how to improve ELM to determine the balance between classification accuracy and speed is a future research work.
Data Availability Statement
Publicly available datasets were analyzed in this study. This data can be found here: http://www.bbci.de/competition/iv/ and http://www.bbci.de/competition/iii/.
Author Contributions
YG developed the theoretical framework and model in this work and drafted the manuscript. YG and LH implemented the algorithm and performed experiments and result analysis. Both authors contributed to the article and approved the submitted version.
Funding
This work was supported in part by the National Natural Science Foundation of China under Grant Nos. 61772241 and 61873321 and in part by the 2018 Six Talent Peaks Project of Jiangsu Province under Grant No. XYDXX-127.
Conflict of Interest
The authors declare that the research was conducted in the absence of any commercial or financial relationships that could be construed as a potential conflict of interest.
References
Birbaumer, N., Hinterberger, T., and Kubler, A. (2003). The thought-translation device (ttd):neurobehavioral mechanisms and clinical outcome. IEEE Trans. Neural Syst. Rehabil. Eng. 11, 120–123. doi: 10.1109/tnsre.2003.814439
Cheng, L., Li, D., Li, X., and Yu, S. (2019). The optimal wavelet basis function selection in feature extraction of motor imagery electroencephalogram based on wavelet packet transformation. IEEE Access 7, 174465–174481. doi: 10.1109/access.2019.2953972
Dib, N., Radhwane, B., and Fethi, B. R. (2020). Epileptic seizure recognition using EEG wavelet decomposition based on nonlinear and statistical features with support vector machine classification. Biomed. Eng. 65, 133–148. doi: 10.1515/bmt-2018-0246
Dornhege, G., Blankertz, B., Curio, G., and Mller, K. R. (2004). Increase information transfer rates in BCI by CSP extension to multi-class. Adv. Neual Inf. Process. Syst. 2004, 733–740.
Edelman, B. J., Meng, J., Suma, D., Zurn, C., Nagarajan, E., Baxter, B. S., et al. (2019). Noninvasive neuroimaging enhances continuous neural tracking for robotic device control. Sci. Robot. 4:6844. doi: 10.1126/scirobotics.aaw6844
Fujisawa, J., Touyama, H., and Hirose, M. (2008). EEG-based navigation of immersing virtual environment using common spatial patterns. IEEE Virtual Real. Conf. 2008, 251–252.
Ghonchi, H., Fateh, M., Abolghasemi, V., Ferdowsi, S., and Rezvani, M. (2020). Deep recurrent-convolutional neural network for classification of simultaneous EEG-fNIRS signals. IET Signal Process. 14, 142–153. doi: 10.1049/iet-spr.2019.0297
Gu, X., Chung, F. L., and Wang, S. (2017). Bayesian Takagi–Sugeno–Kang Fuzzy Classifier. IEEE Trans. Fuzzy Syst. 99, 1655–1671. doi: 10.1109/tfuzz.2016.2617377
Hammer, E. M., Halder, S., Kleih, S. C., and Kübler, A. (2018). Psychological predictors of visual and auditory P300 brain-computer interface performance. Front. Neurosci. 12:307. doi: 10.3389/fnins.2018.00307
Haufe, S., Treder, M. S., and Gugler, M. F. (2011). EEG potentials predict upcoming emergency brakings during simulated driving. J. Neural Eng. 8, 1741–1746. doi: 10.1088/1741-2560/8/5/056001
Herff, C., Heger, D., and Pesters, A. D. (2015). Brain-to-text: decoding spoken phrases from phone representations in the brain. Front. Neurosci. 9:217. doi: 10.3389/fnins.2015.00217
Hu, J., Luo, Y., Zhang, Q., Liu, X., and Qu, X. (2019). Micro-motion feature extraction of space targets based on sinusoidal frequency modulation Fourier transform. J. Eng. 2019, 8076–8079. doi: 10.1049/joe.2019.0650
Huang, G. B. (2003). Learning capability and storage capacity of two-hidden-layer feed-forward networks. IEEE Trans. Neural Netw. 14, 274–281. doi: 10.1109/tnn.2003.809401
Huang, G. B., Zhu, Q. Y., and Siew, C. K. (2004). “Extreme learning machine: a new learning scheme of feed-forward neural networks,” in Proceedings of IEEE International Joint Conference on Neural Networks, (Piscalaway, NJ: IEEE Press), 985–990. doi: 10.1007/s10916-017-0867-4
Huang, G. B., Zhu, Q. Y., and Siew, C. K. (2006). Extreme learning machine: theory and applications. Neurocomputing 70, 489–501. doi: 10.1016/j.neucom.2005.12.126
Juneja, K., and Rana, C. (2019). Individual and mutual feature processed ELM model for EEG signal based brain activity classification. Wirel. Pers. Commun. 108, 659–681. doi: 10.1007/s11277-019-06423-w
Li, Y., Long, J., and Yu, T. (2010). An EEG-based BCI system for 2-D cursor control by combining Mu/Beta rhythm and P300 potential. IEEE Trans. Biomed. Eng. 57, 2495–2505. doi: 10.1109/tbme.2010.2055564
Lisi, G., Noda, T., and Morimoto, J. (2014). Decoding the ERD/ERS: influence of afferent input induced by a leg assistive robot. Front. Syst. Neurosci. 8:85. doi: 10.3389/fnsys.2014.00085
Liu, C., Shi, D., and Wang, Z. (2020). Acoustic emission damage feature extraction of refractories based on wavelet packet transform and independent component analysis. Naihuo Cailiao Refractories 54, 185–190.
Long, J., Li, Y., and Wang, H. (2012). A hybrid brain computer interface to control the direction and speed of a simulated or real wheelchair. IEEE Trans. Neural Syst. Rehabil. Eng. 20, 720–729. doi: 10.1109/tnsre.2012.2197221
Luo, Y., Fu, Q., Xie, J., Qin, Y., Wu, G., Liu, J., et al. (2020). EEG-based emotion classification using spiking neural networks. IEEE Access 8, 46007–46016. doi: 10.1109/access.2020.2978163
Makin, J. G., Moses, D. A., and Chang, E. F. (2020). Machine translation of cortical activity to text with an encoder–decoder framework. Nat. Neurosci. 23, 575–582. doi: 10.1038/s41593-020-0608-8
Michael, T., Müller, K. R., and Ad, A. (2012). Review of the BCI Competition IV. Front. Neurosci. 6:55. doi: 10.3389/fnins.2012.00055
Pfurtscheller, G. (1992). Event-related synchronization (ERS): an electrophysiological correlate of cortical areas at rest. Electroencephalogr. Clin. Neurophysiol. 83, 62–69. doi: 10.1016/0013-4694(92)90133-3
Pfurtscheller, G., Neuper, C., and Guger, C. (2002). Current trends in Graz brain-computer interface (BCI) research. IEEE Trans. Rehabil. Eng. 8, 216–219. doi: 10.1109/86.847821
Qiu, Z., Allison, B. Z., and Jin, J. (2017). Optimized motor imagery paradigm based on imagining Chinese characters writing movement. IEEE Trans. Neural Syst. Rehabil. Eng. 25, 1009–1017. doi: 10.1109/tnsre.2017.2655542
Rozza, A., Lombardi, G., and Casiraghi, E. (2012). Novel Fisher discriminant classifiers. Pattern Recogn. 45, 3725–3737. doi: 10.1016/j.patcog.2012.03.021
Rubén, S. S., Manuel, G. M., Luis Fernando, D. E., and José, M. P. (2019). Classification of epileptic EEG recordings using signal transforms and convolutional neural networks. Comput. Biol. Med. 109, 148–158. doi: 10.1016/j.compbiomed.2019.04.031
Schlögl, A., Lee, F., and Bischof, H. (2005). Characterization of four-class motor imagery EEG data for the BCI-competition 2005. journal of neural engineering 2, L14. doi: 10.1088/1741-2560/2/4/L02
Shahyad, S., Hatef, B., Khosrowabadi, R., Mohammadi, A., and Lotfan, S. (2019). Support vector machine classification of brain states exposed to social stress test using EEG-based brain network measures. Biocybern. Biomed. Eng. 39, 199–213. doi: 10.1016/j.bbe.2018.10.008
Srirangan, M., Rajesh, K. T., and Ram, B. P. (2020). Time-frequency domain deep convolutional neural network for the classification of focal and non-focal EEG signals. IEEE Sensors J. 20, 3078–3086. doi: 10.1109/jsen.2019.2956072
Tamura, S., and Tateishi, M. (1997). Capability of four-layered neural network: four layers versus three. IEEE Trans. Neural Netw. 8, 251–255. doi: 10.1109/72.557662
Tan, P., Tan, G. Z., Cai, Z. X., Sa, W. P., and Zou, Y. Q. (2017). Using ELM-based weighted probabilistic model in the classification of synchronous EEG BCI. Med. Biol. Eng. Comput. 55, 33–43. doi: 10.1007/s11517-016-1493-x
Tanaka, K., Matsunaga, K., and Wang, H. O. (2005). Electroencephalogram-based control of an electric wheelchair. IEEE Trans. Robot. 21, 762–766. doi: 10.1109/tro.2004.842350
Tang, Z., Sun, S., Zhang, S., Chen, Y., and Li, C. (2016). A brain-machine interface based on ERD/ERS for an upper-limb exoskeleton control. Sensors 16:2050. doi: 10.3390/s16122050
Van Dokkum, L. E. H., Ward, T., and Laffont, I. (2015). Brain computer interfaces for neurorehabilitation-its current status as a rehabilitation strategy post-stroke. Ann. Phys. Rehabil. Med. 58, 3–8. doi: 10.1016/j.rehab.2014.09.016
Vidal, J. J. (1973). Toward direct brain-computer communication. Annu. Rev. Biophys. Bioeng. 2, 157–180. doi: 10.1146/annurev.bb.02.060173.001105
Wang, W., Sun, L., Wang, B., and Yu, M. (2020). Partial discharge feature extraction based on synchrosqueezed windowed Fourier transform and multi-scale dispersion entropy. Meas. Control 53, 1078–1087. doi: 10.1177/0020294020932346
Wang, Y., Hong, B., and Gao, X. (2007). “Implementation of a brain-computer interface based on three states of motor imagery,” in Proceedings of the 29th Annual International Conference of the IEEE Engineering in Medicine & Biology Society, (Lyon: IEEE), 5059–5062.
Wolpaw, J. R., Birbaumer, N., and Heetderks, W. J. (2000). Brain-computer interface technology: a review of the first international meeting. IEEE Trans. Rehabil. Eng. 8, 164–173. doi: 10.1109/tre.2000.847807
Xu, B., Song, A., Zhao, G., Xu, G., Pan, L., Yang, R., et al. (2015). Design and evaluation of a motor imagery electroencephalogram-controlled robot system. Adv. Mech. Eng. 7, 8132–8140.
Yang, Y., Zeng, M., and Cheng, J. S. (2012). Research on local characteristic-scale decomposition and its capacities. J. Vib. Eng. 25, 602–609.
Zhang, Y., Zhou, G. X., Jin, J., Zhao, Q. B., Wang, X. Y., and Cichocki, A. (2016). Sparse Bayesian Classification of EEG for brain–computer interface. IEEE Trans. Neural Netw. Learn. Syst. 27, 2256–2267. doi: 10.1109/tnnls.2015.2476656
Keywords: human-computer interaction model, ELM, motor imagery, EEG signals, BCI data set
Citation: Gu Y and Hua L (2021) A Novel Smart Motor Imagery Intention Human-Computer Interaction Model Using Extreme Learning Machine and EEG Signals. Front. Neurosci. 15:685119. doi: 10.3389/fnins.2021.685119
Received: 24 March 2021; Accepted: 08 April 2021;
Published: 06 May 2021.
Edited by:
Yuanpeng Zhang, Nantong University, ChinaCopyright © 2021 Gu and Hua. This is an open-access article distributed under the terms of the Creative Commons Attribution License (CC BY). The use, distribution or reproduction in other forums is permitted, provided the original author(s) and the copyright owner(s) are credited and that the original publication in this journal is cited, in accordance with accepted academic practice. No use, distribution or reproduction is permitted which does not comply with these terms.
*Correspondence: Yi Gu, ODIwMjEwMTQzN0BqaWFuZ25hbi5lZHUuY24=