 Jian Chen1†
 Haiping Zhao2†
 Yuyou Huang2
 Yuqian Li2Junfen Fan2Rongliang Wang2
 Ziping Han2Zhenhong Yang2
 Longfei Wu1Di Wu2
 Yumin Luo3*
 Xunming Ji3*
- 1Department of Neurosurgery, Institute of Cerebrovascular Diseases Research, Xuanwu Hospital, Capital Medical University, Beijing, China
- 2National Clinical Research Center for Geriatric Disorders, Beijing, China
- 3Beijing Institute for Brain Disorders, Beijing, China
Despite the recent interest in plasma microRNA (miRNA) biomarkers in acute ischemic stroke patients, there is limited knowledge about the miRNAs directly related to stroke itself due to the multiple complications in patients, which has hindered the research progress of biomarkers and therapeutic targets of ischemic stroke. Therefore, in this study, we compared the differentially expressed miRNA profiles in the plasma of three rhesus monkeys pre- and post-cerebral ischemia. After cerebral ischemia, Rfam sequence category revealed increased ribosomic RNA (rRNA) and decreased transfer RNAs (tRNAs) in plasma. Of the 2049 miRNAs detected after cerebral ischemia, 36 were upregulated, and 76 were downregulated (fold change ≥2.0, P < 0.05). For example, mml-miR-191-5p, miR-421, miR-409-5p, and let-7g-5p were found to be significantly overexpressed, whereas mml-miR-128a-5p_R − 2, miR-431_R − 1, and let-7g-3p_1ss22CT were significantly downregulated. Gene Ontology and Kyoto Encyclopedia of Genes and Genomes pathway analyses revealed that these differentially expressed miRNAs were implicated in the regulation of ubiquitin-mediated proteolysis and signaling pathways in cancer, glioma, chronic myeloid leukemia, and chemokine signaling. miRNA clustering analysis showed that mml-let-7g-5p and let-7g-3p_1ss22CT, which share three target genes [RB1-inducible coiled-coil 1 (RB1CC1), G-protein subunit γ 5 (GNG5), and chemokine (C-X-C motif) receptor 4 (CXCR4)], belong to one cluster, were altered in opposite directions following ischemia. These data suggest that circulating mml-let-7g may serve as a therapeutic target for ischemic stroke.
Introduction
Circulating microRNAs (miRNAs) might be useful as surrogate biomarkers for the diagnosis or prognosis of pathological conditions such as acute stroke; finding early blood miRNA biomarkers to diagnose this disease, for instance, could drastically reduce treatment delays. In addition, emerging RNA therapeutics targeting mRNAs have already been approved by the Food and Drug Administration for clinical research (Erdos et al., 2021) and have gained attention in cerebrovascular research. For example, RNA-targeted therapies to lower Lipoprotein(a) are in clinical development. Currently, there are approximately 7680 patients with a history of myocardial infarction, ischemic stroke, and symptomatic peripheral arterial disease (Tsimikas et al., 2021); this number helps estimate the potential therapeutic relevance of miRNAs for the treatment of ischemic stroke.
Ischemic stroke is a complex disease with several risk factors. Despite the increasing focus on plasma miRNA biomarkers in acute ischemic stroke patients (Singh et al., 2021), there is limited knowledge about the differentially expressed miRNAs directly related to stroke itself, which has hindered biomarker development and the definition of therapeutic targets. In this study, we compared the differences in circulating miRNAs in non-human primates, namely rhesus monkeys, before and after cerebral ischemia to identify the miRNAs directly related to ischemic stroke. The results of this research could help bridge the gap between in vivo rodent models and human patients, leading to therapeutic applications and valuable and accurate information for early detection of ischemic stroke.
Materials and Methods
Animals
This study was approved by the Animal Use and Care Board of the Institute of Laboratory Animal Sciences, Capital Medical University. All experiments were performed in compliance with national guidelines and in accordance with the Guide for the Care and Use of Laboratory Animals. Three adult male rhesus monkeys (Macaca mulatta), aged 7–11 years and weighing 7.2–10.6 kg, were used in this study.
Anesthesia
Animals were fasted for 12 h prior to the induction of anesthesia. Anesthesia was induced with ketamine (10 mg/kg, IM) and maintained intravenously with propofol (300 μg/kg/min). Eighteen-gage peripheral venous catheters were placed. Ventilation was controlled (Aridyne 3600; Graham, NC, United States). Intermittent positive pressure ventilation was performed for monkeys with a fixed respiratory rate. Non-invasive blood pressure, electrocardiogram, heart rate, oxygen saturation, blood gas, and rectal temperature were monitored (Wu et al., 2020a,b,c).
Endovascular Surgery
As described previously by us in NHPs models, a Prowler-10 micro-catheter (Codman) with a SilverSpeedTM-10 Hydrophilic micro-wire was introduced into the guiding catheter and navigated to the distal end of M1 segment of the right MCA. Next, the clot was transferred into micro-catheter and flushed into the end of M1 segment with 2 mL saline. Based on cerebral angiography at 3 h post ischemia, we only included 3 monkeys with a still occluded M1-segment of MCA. Blood samples were drawn from the saphenous vein at baseline and 3 h after stroke onset (Wang et al., 2016; Wu et al., 2021). MRI scanning was performed on a Magnetom Trio MRI Scanner (3.0 T; Siemens AG, Siemens Medical Solutions, Erlangen, Germany). MRI sequences and parameters were reported in our previous study (Wang et al., 2016; Wu et al., 2021). Based on recent reports, DWI images obtained 1 day after ischemia were defined as “originally abnormal region” (Nagaraja et al., 2020).
Small RNA Sequencing
Circulating miRNA was isolated using 500 μl of plasma. The experimental process was carried out according to the standard steps provided by Illumina (Hangzhou Lianchuan Biological Technology Co., Ltd., China), including library preparation and sequencing experiments. A Truseq small RNA sample prep kit (Illumina, San Diego, CA, United States) was used to prepare the small RNA sequencing library. After library preparation, the constructed library was sequenced using Illumina HiSeq 2000/2500, and the reading length was 1 × 50 bp. We determined the transcript profile for the plasma by RNA-seq with a median sequencing depth of 10 million mapped reads per sample (n = 3). The miRNA data analysis software provided by Lianchuan Biology was ACGT101-miR (LC Sciences, Houston, TX, United States). The analysis process was as follows: (1) quality filtering: the raw reads obtained by sequencing contain low-quality reads with adapters. In order to ensure the quality of information analysis, the raw reads must be processed to obtain clean reads. The data processing steps are as follows: (a) remove N (N means that the base information cannot be determined) is greater than 10% of reads; (b) remove the reads contaminated with the 5′ connector; (c) remove reads without 3′ linker sequence and insert; (d) remove polyA/T/G/C reads (most of the continuous polyA/T/G/C may be due to sequencing errors, and the information entropy is low, so analysis is not necessary). Linker information for Small RNA sequencing: 5′ connector: 5′-GTTCAGAGTTCTACAGTCCGACGATC-3′, 3′ connector: 5′-TGGAATTCTCG GGTGCCAAGG-3′; here we removed the data with very low expression levels from the differential miRNA expression (including the case where three samples are all zero or two are zero), which is only shown in Supplementary Data; (2) length screening: retain 18–26 nucleotide (nt) base length sequences; (3) RNA database alignment analysis: Rfam is a non-coding RNA (ncRNA) family database, including ribosomic RNA (rRNA), transfer RNA (tRNA), snoRNA, snRNA, miRNA, and other ncRNAs. We select the Rfam database to annotate the small RNA sequences obtained by sequencing, and find and remove the possible rRNA, snoRNA, snRNA, tRNA, and other non-miRNA sequences as far as possible; (4) miRNA identification: after effective data were obtained, the precursor and genome were compared for miRNA identification; the t-test test was used in this analysis. For the analysis of samples with biological duplicates, the threshold of P ≤ 0.05 was used to screen differentially expressed genes (Han et al., 2019; Jeon et al., 2019; Li et al., 2019); (5) identification of differentially expressed miRNAs; and (6) prediction of differential miRNA target genes. The data presented in the study are deposited in the GEO respository (https://www.ncbi.nlm.nih.gov/geo/query/acc.cgi?acc=GSE182429).
Target Gene Prediction of Differential miRNAs
TargetScan (V5.0) and Miranda (v3.3a) were used to predict the target genes of significantly different miRNAs. The target genes predicted by the two software programs were screened according to the scoring criteria in each software program. In the TargetScan algorithm, target genes with a context score percentage <50 are removed, while in the Miranda algorithm, target genes whose maximum energy is ≥10 are removed (score ≥50, Miranda energy = 10). Finally, the intersection data of the two software packages was considered as the final target genes of the differential miRNAs, providing the Gene ontology (GO) and Kyoto Encyclopedia of Genes and Genomes (KEGG) annotation information.
Enrichment Analysis of Differential miRNA Target Genes
Enrichment analysis mainly included two parts: GO function and KEGG path function annotation. First, the number of target genes corresponding to all selected miRNAs corresponding to each function or pathway annotation was counted, and then a hypergeometric test was applied to determine the mRNA of target genes corresponding to all selected miRNAs and GO/KEGG in the annotation library, and compared with the number of genes in the pathway (all genes with functional annotation, or all miRNA target genes with functional annotation). A P-value ≤ 0.05 was used as threshold for significance, and the function meeting this condition was defined as a function with significant enrichment in miRNA–mRNA relationship pairs. The main biological functions of miRNA–mRNA pairs can be determined by functional significance enrichment analysis. The significant enrichment analysis of pathways uses the KEGG pathway as a unit and applies a hypergeometric test to determine significantly enriched paths in the significant differentially expressed genes compared with the whole genomic background.
Conservation of the Identified miRNA With Other Species
MicroRNAs is highly conserved among species. To identify the conserved rhesus monkeys miRNAs, we first collected the miRNA sequences from miRBase release 20.0 for selected species: Age, Archangium gephyra; aja, Amycolatopsis japonica; bta, Bos taurus (cattle); cfa, Canis lupus familiaris (dog); cgr, Campylobacter jejuni RM1221; chi, Chlamydia psittaci 02DC15; cja, Cellvibrio japonicus; cpo, Coprothermobacter proteolyticus; dma, Desulfovibrio magneticus; dno, Dichelobacter nodosus; eca, Pectobacterium atrosepticum SCRI1043; efu, Enterococcus faecium DO; ggo, Gorilla gorilla gorilla (western lowland gorilla); has, Homo sapiens; lca, Lactobacillus paracasei ATCC 334; lla, Lactococcus lactis subsp. lactis Il1403; mdo, Monodelphis domestica (opossum); mml, M. mulatta (rhesus monkey); mmr, Maricaulis maris; mmu: Mus musculus (house mouse); mne, Mycobacterium neoaurum; nle, Nomascus leucogenys (northern white-cheeked gibbon); oan, Ornithorhynchus anatinus (platypus); oar, Octadecabacter arcticus; ocu, Oryctolagus cuniculus (rabbit); oga, pal, pbl, Paracoccidioides lutzii Pb01; pha, Pseudoalteromonas haloplanktis; ppa, Pan paniscus (pygmy chimpanzee); ppy, Pongo abelii (Sumatran orangutan) (Pongo pygmaeus abelii); ptr, Pan troglodytes (chimpanzee); rno, Rattus norvegicus (rat); sbo, Shigella boydii Sb227; sha, Staphylococcus haemolyticus JCSC1435; sla, Serpula lacrymans; ssc, Sus scrofa (pig); ssy, Sphingobium sp. SYK-6; tch, and Chlamydia trachomatis F/11-96. The BLASTN program was used to compare the distributions of the miRNAs across the species. We further analyzed the conservation of miRNAs in selected species, and counted the frequency of miRNAs reported in this species in other species, and explored the existence of miRNA family in other species.
Seed-Sequence-Based miRNA Families
In animals, miRNA and target genes inhibit mRNA expression mainly through incomplete complementary pairing. The Watson Crick pairing between the so-called seed sequence (second-7 nt) at the 5′ end of miRNA and the 3′ UTR of target gene is the most important factor for all miRNA target gene prediction.
Results
Biological Replication and Rfam Sequence Category of Rhesus Monkey Plasma miRNAs Libraries Before and After Cerebral Ischemia
To evaluate the success of MCAO models, we found notable infarct sizes in the middle cerebral artery-supplied regions based on DWI images at 1 day after ischemia (Figure 1A). Principal component analysis using three principal components, which describe 78.79% of the variance, showed miRNAs to be significantly altered across the two groups (Figures 1A,B). Pearson correlation coefficients between samples showed that b_MCAO_1 (before ischemia) was similar to b_MCAO_2 (r = 0.966), and a_MCAO_1 (after ischemia) to a_MCAO_3 (r = 0.963) prior to a_MCAO_2 (r = 0.797) (Figure 1C). The length distribution of the filtered valid data was calculated based on the original sequencing data. Most reads were 18- to 26-nt long with a peak around 22 nt, demonstrating that the small RNA libraries were highly enriched in mature miRNAs. The length distribution of the identified miRNAs was consistent with the canonical size range of mammalian miRNAs, confirming the reliability of our small RNA-seq results. Genomic mapping of these reads showed that the predominant RNA species (based on read counts) in both libraries were miRNAs. Rfam classification among the other ncRNA (e.g., rRNAs, tRNAs, snRNAs, and snoRNAs), comprising <2% of total reads, rRNA was increased, and tRNA decreased after cerebral ischemia (P < 0.05, Figure 1D).
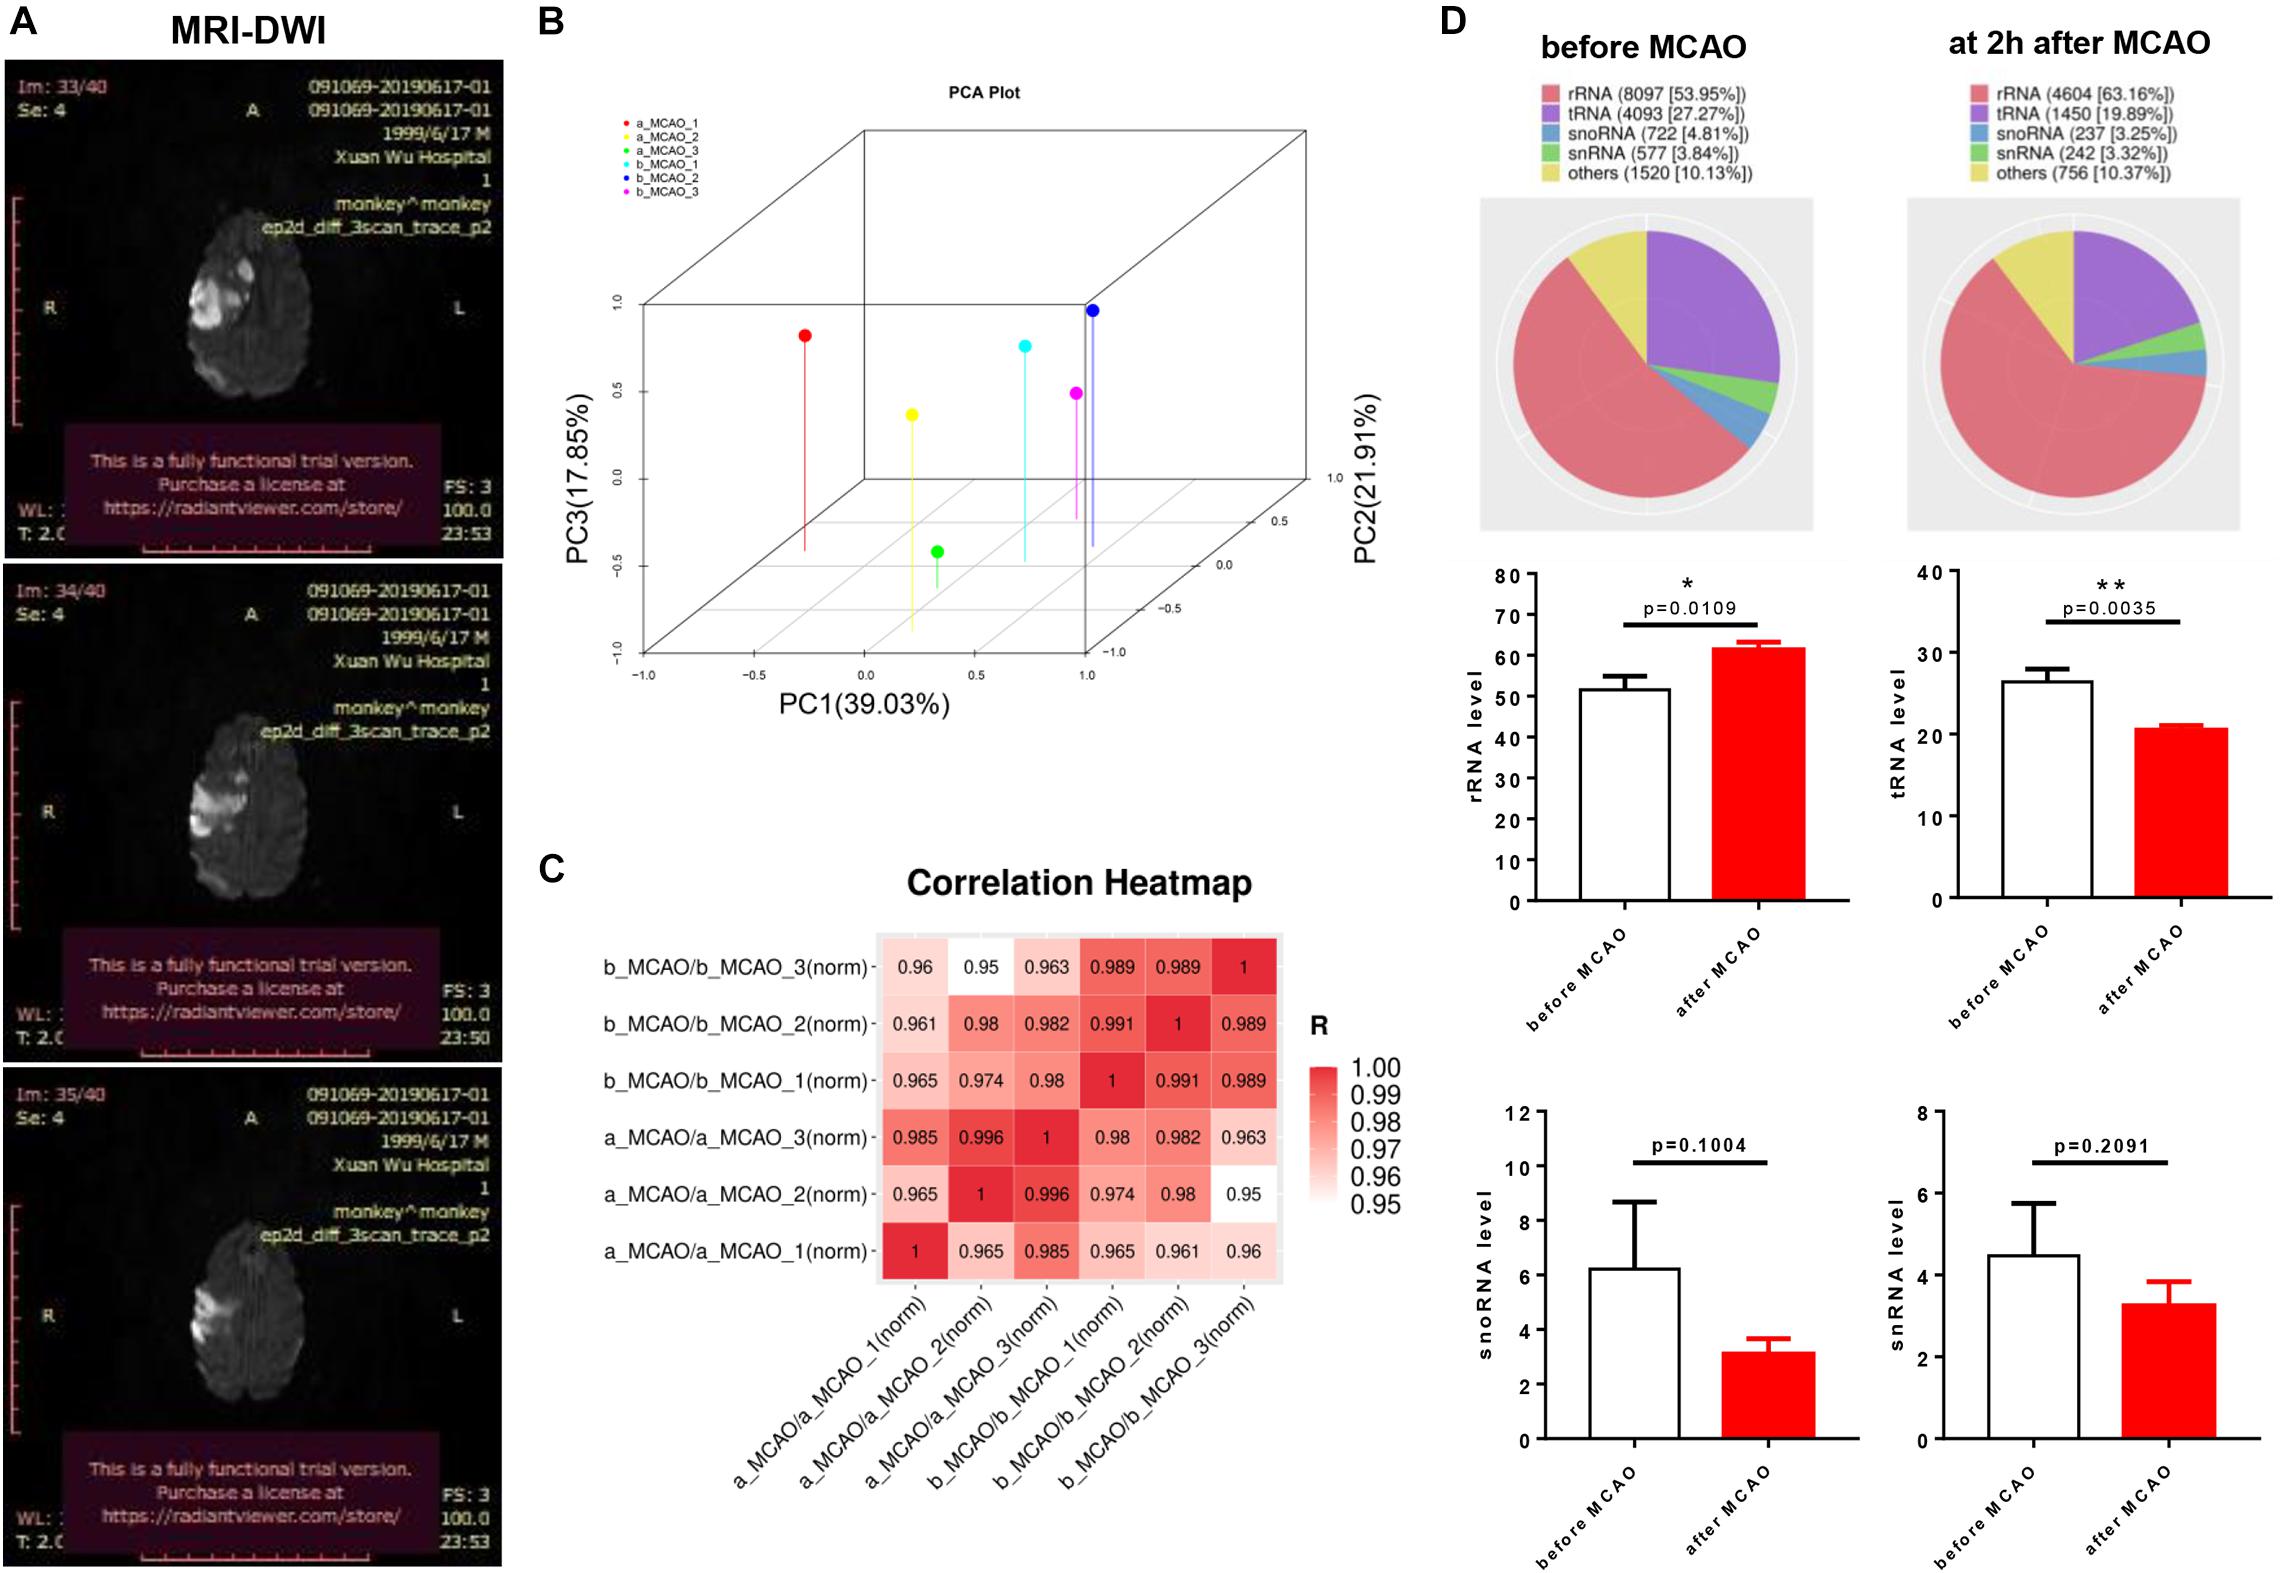
Figure 1. Biological replication and Rfam sequence category of plasma miRNAs libraries of rhesus monkey before and after cerebral ischemia. (A) Magnetic resonance imaging with diffusion-weighted imaging (MRI-DWI) (1 day) identified infarct site in models. (B) Principle component analysis (PCA) of plasma of rhesus monkey before cerebral ischemia compared with after cerebral ischemia. (C) Pearson correlation coefficients between samples using genes of P < 0.05. (D) Rfam classification among the other non-coding RNAs (e.g., rRNAs, tRNAs, snRNAs, and snoRNAs). b_MCAO_1-3, before ischemia; a_MCAO_1-3, after ischemia. N = 3. *p < 0.05 and **p < 0.01.
Differentially Expressed Rhesus Monkey Plasma miRNAs Before and After Cerebral Ischemia
The frequency of differentially expressed genes was determined pre- and post-cerebral ischemia. Of the 2049 miRNAs detected, 36 were upregulated (Table 1) and 76 downregulated (Table 2) after cerebral ischemia (fold change ≥2.0, P < 0.05) (Figure 2A). The overall distribution of differentially expressed miRNAs is presented in Figure 2B. Hierarchical clustering of upregulated and downregulated miRNAs showed differences before and after cerebral ischemia (Pang et al., 2019; Zhang L. et al., 2019; Figure 2C). mml-miR-191-5p, mml-miR-421, mml-miR-409-5p, and mml-let-7g-5p were significantly upregulated, whereas mml-miR-128a-5p_R − 2, mml-miR-431_R − 1, and mml-let-7g-3p_1ss22CT were significantly downregulated in rhesus monkeys following cerebral ischemia.
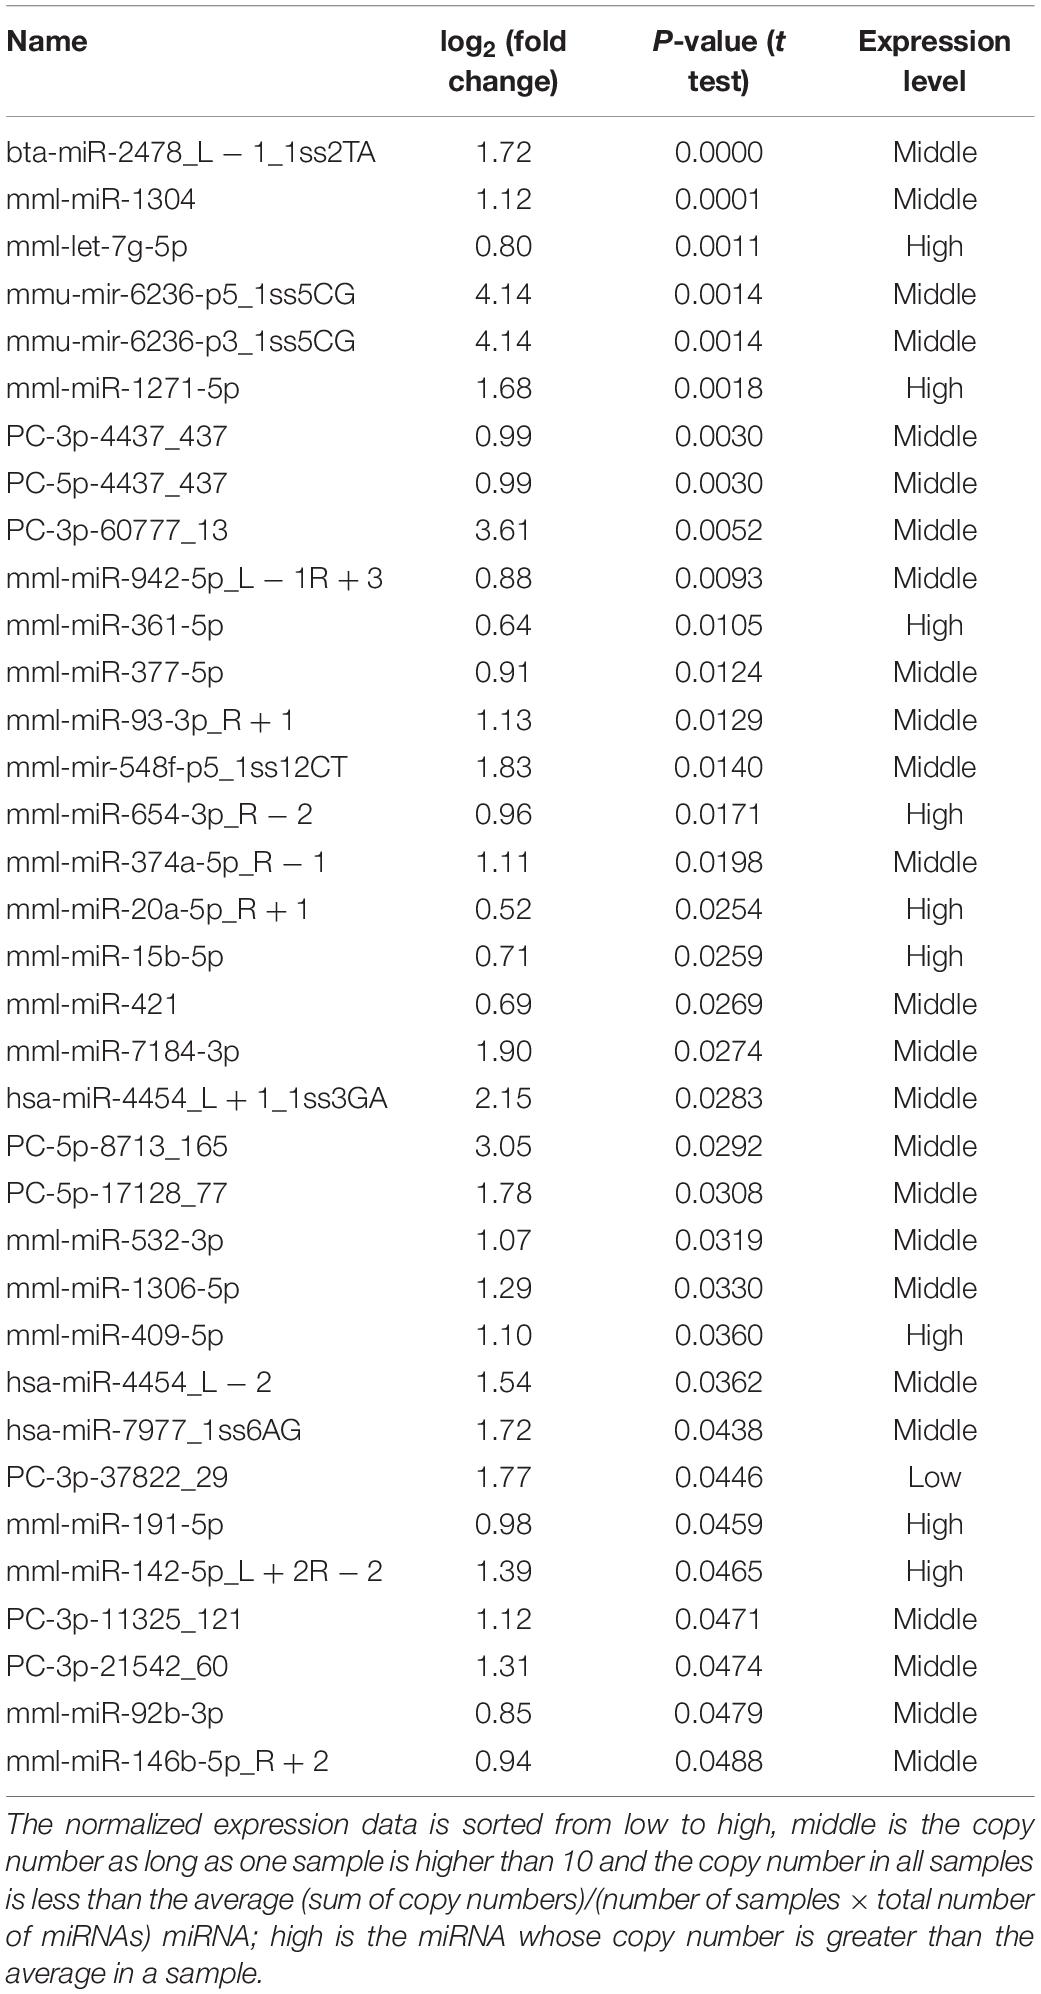
Table 1. Summary information of upregulated miRs.
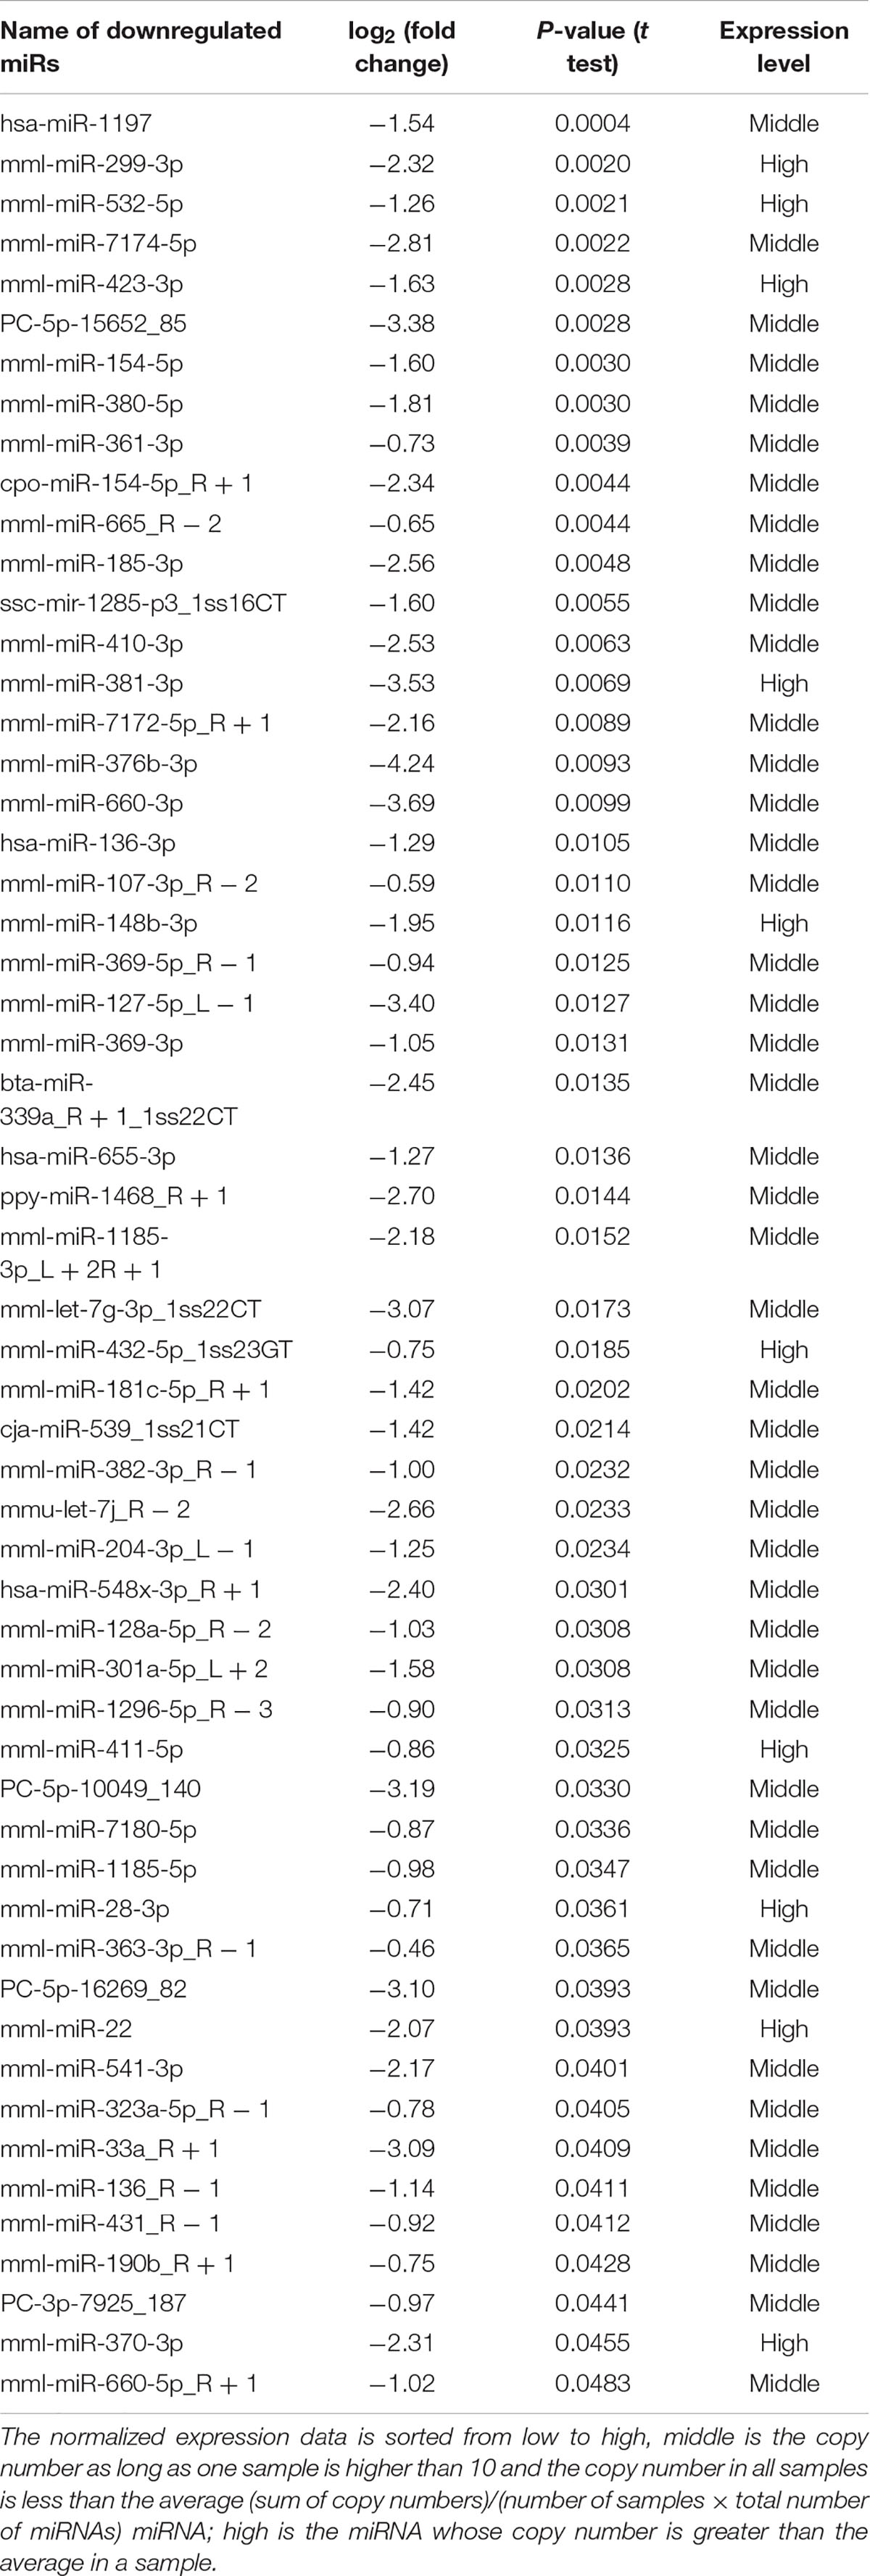
Table 2. Summary information of downregulated miRs.
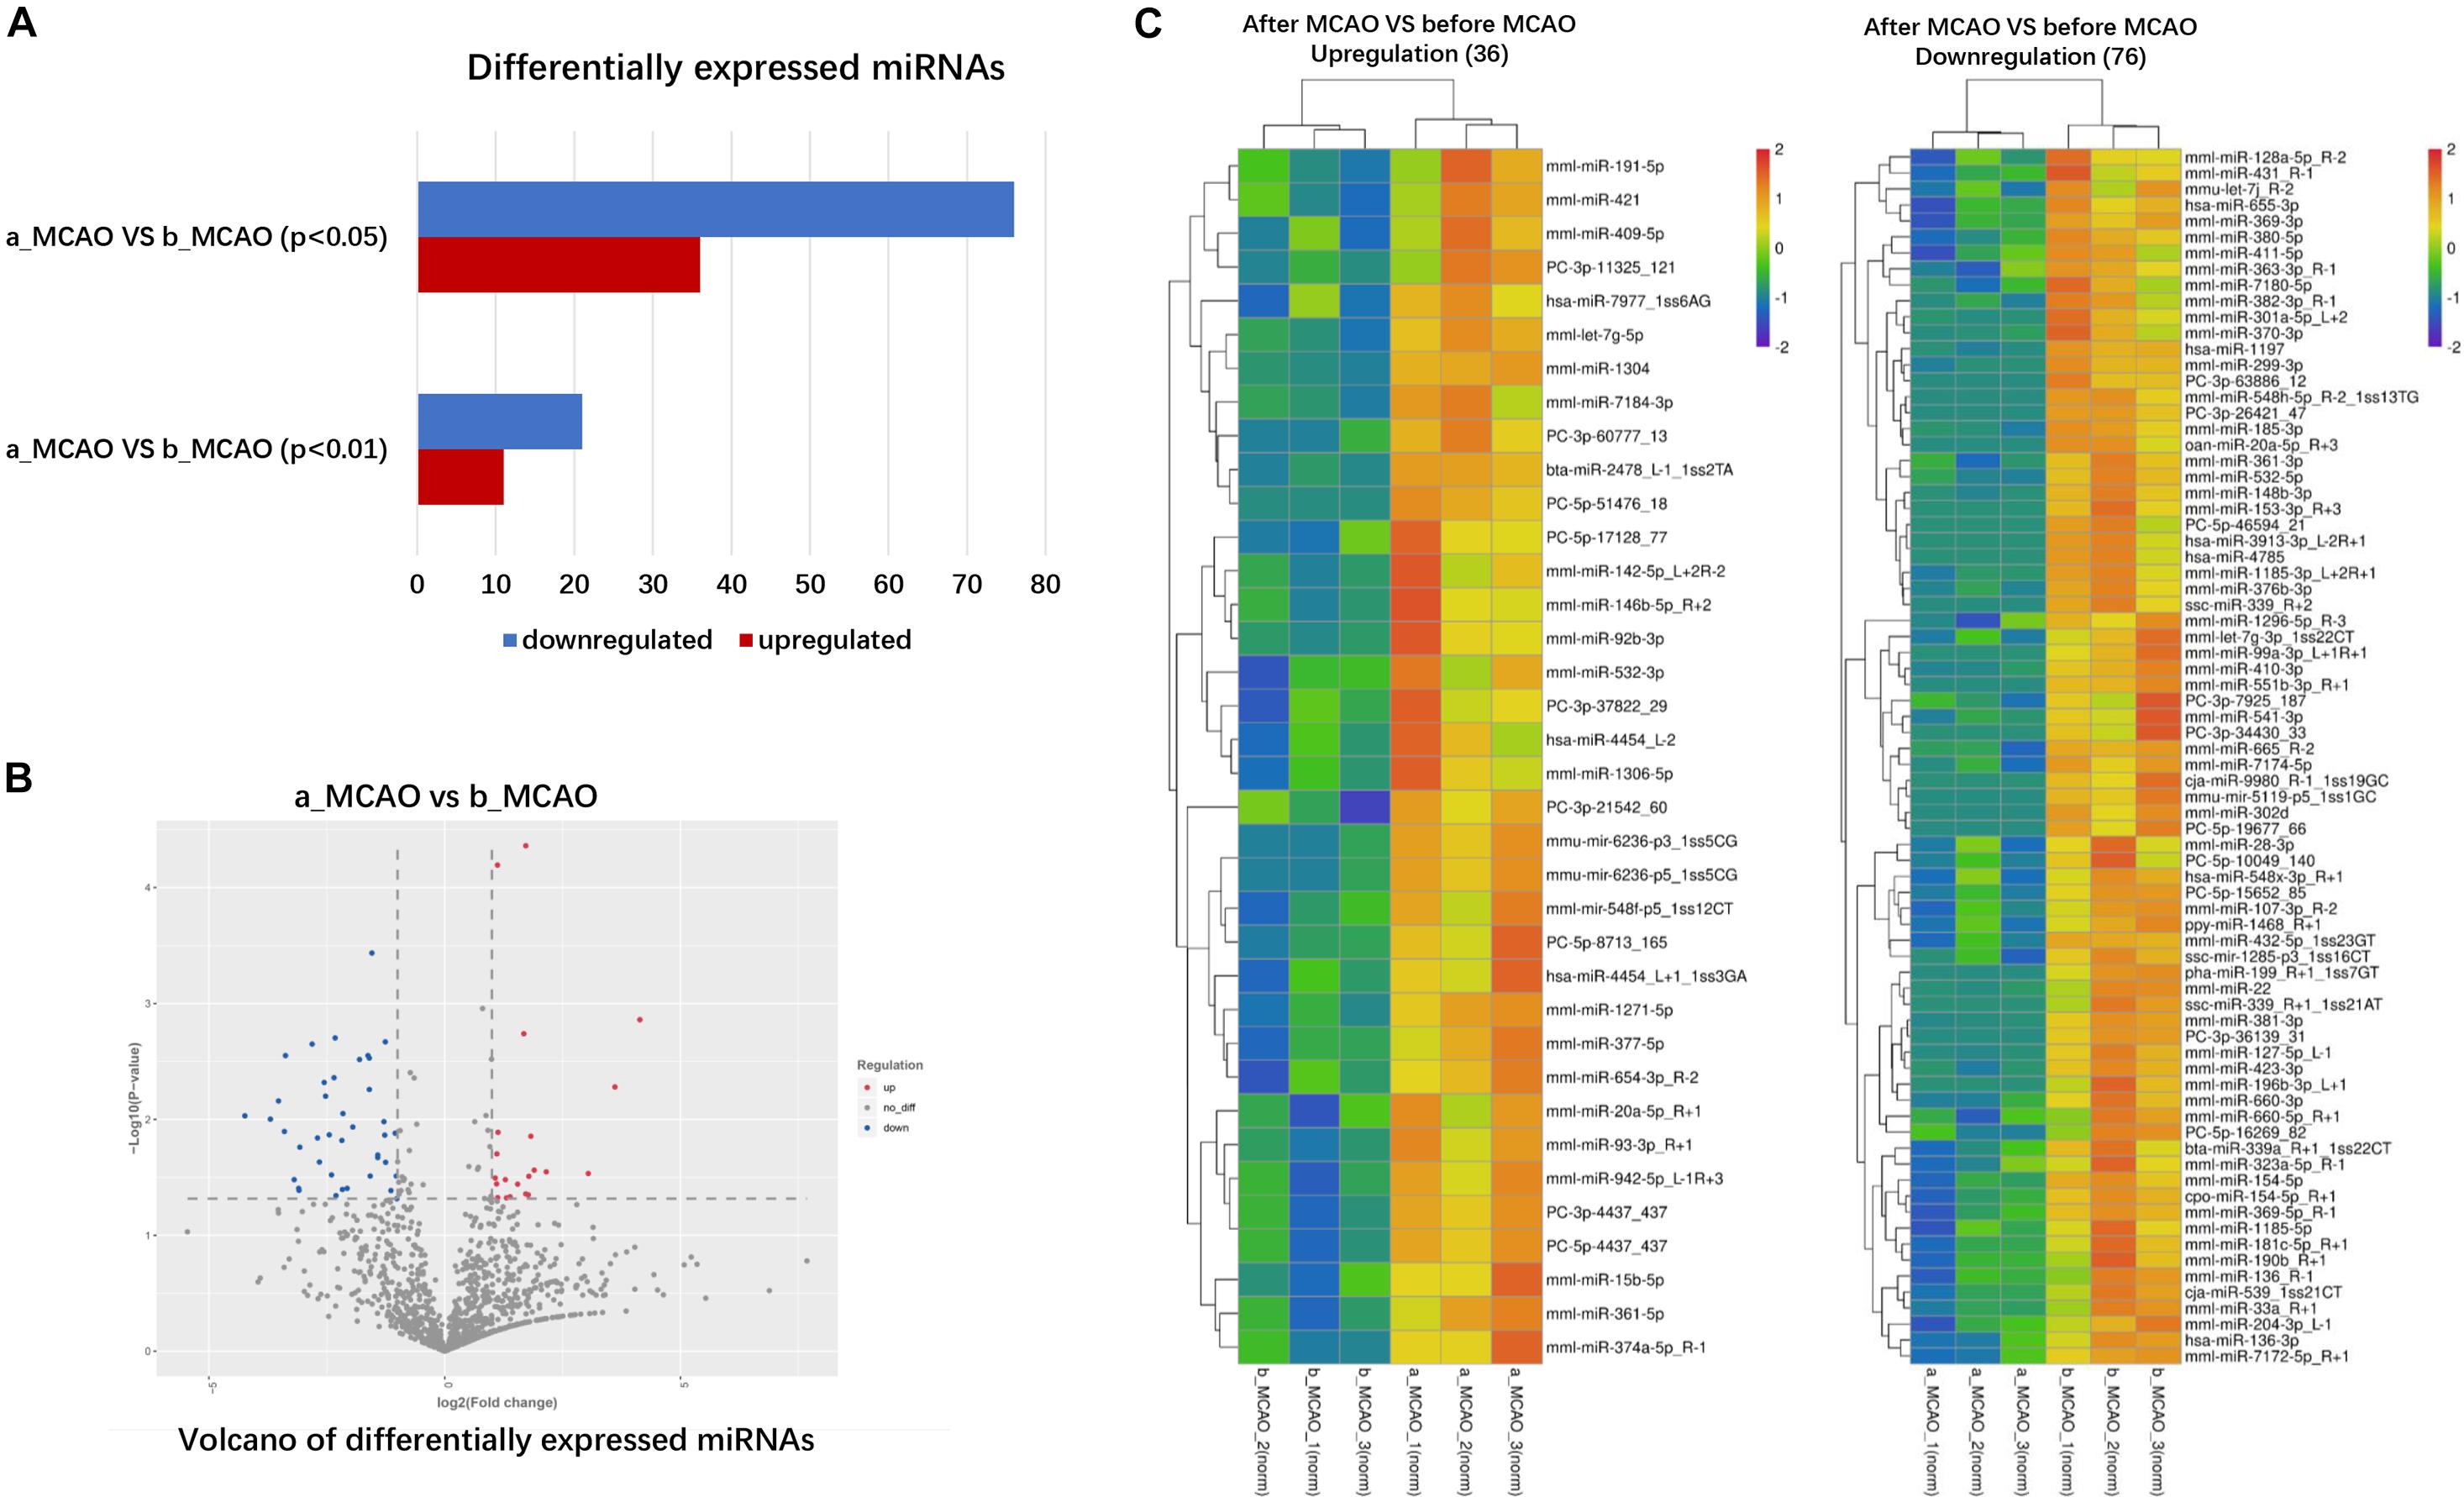
Figure 2. Differentially expressed plasma miRNAs of rhesus monkey before and after cerebral ischemia. (A) The blue represents down–down miRNA, and the number represents up–down miRNA. (B) Volcano plot analysis showing differentially expressed miRNAs, using log2 (fold change) as abscissa and –log10 (P-value) as ordinate. The red and blue dot represent the up-regulated or down-regulated differential expression genes, and the gray dot represents the non-significant differential expression genes. (C) Hierarchical clustering heatmap analysis of upregulated and downregulated miRNAs detected in plasma of rhesus monkey before and after cerebral ischemia. Red indicates high expression genes and blue indicates low expression genes. b_MCAO_1-3, before ischemia; a_MCAO_1-3, after ischemia. N = 3.
Enrichment Analysis of GO and KEGG Pathways According to the Target Genes of Differentially Expressed miRNAs
In all the differentially expressed miRNA target genes, we annotated the GO terms of these genes according to molecular function, cellular components, and biological processes, and the GO functions in each category were ranked from high to low according to the number of target genes. Regulation of transcription, DNA-templated, membrane, and metal ion binding was the most changed number of genes, respectively, in biological processes, cellular components, and molecular function (Figure 3A). GO enrichment analysis where the rich factor represents the number of GO differential genes/the total number of GO genes, revealed that differentially expressed miRNAs were significantly involved in the regulation of signaling pathways, including those involving the nucleus, extracellular exosome, and cytoplasm (P < 0.001, Figure 3B). The results of KEGG enrichment analysis by ggplot2 are shown by scatter plot: rich factor represents the number of different genes located in the KEGG/the total number of genes located in the KEGG, revealed that differentially expressed miRNAs were significantly involved in the regulation of signaling pathways including pathways in cancer, and chronic myeloid leukemia pathways; and chemokine signaling pathways (P < 0.001, Figure 3C).
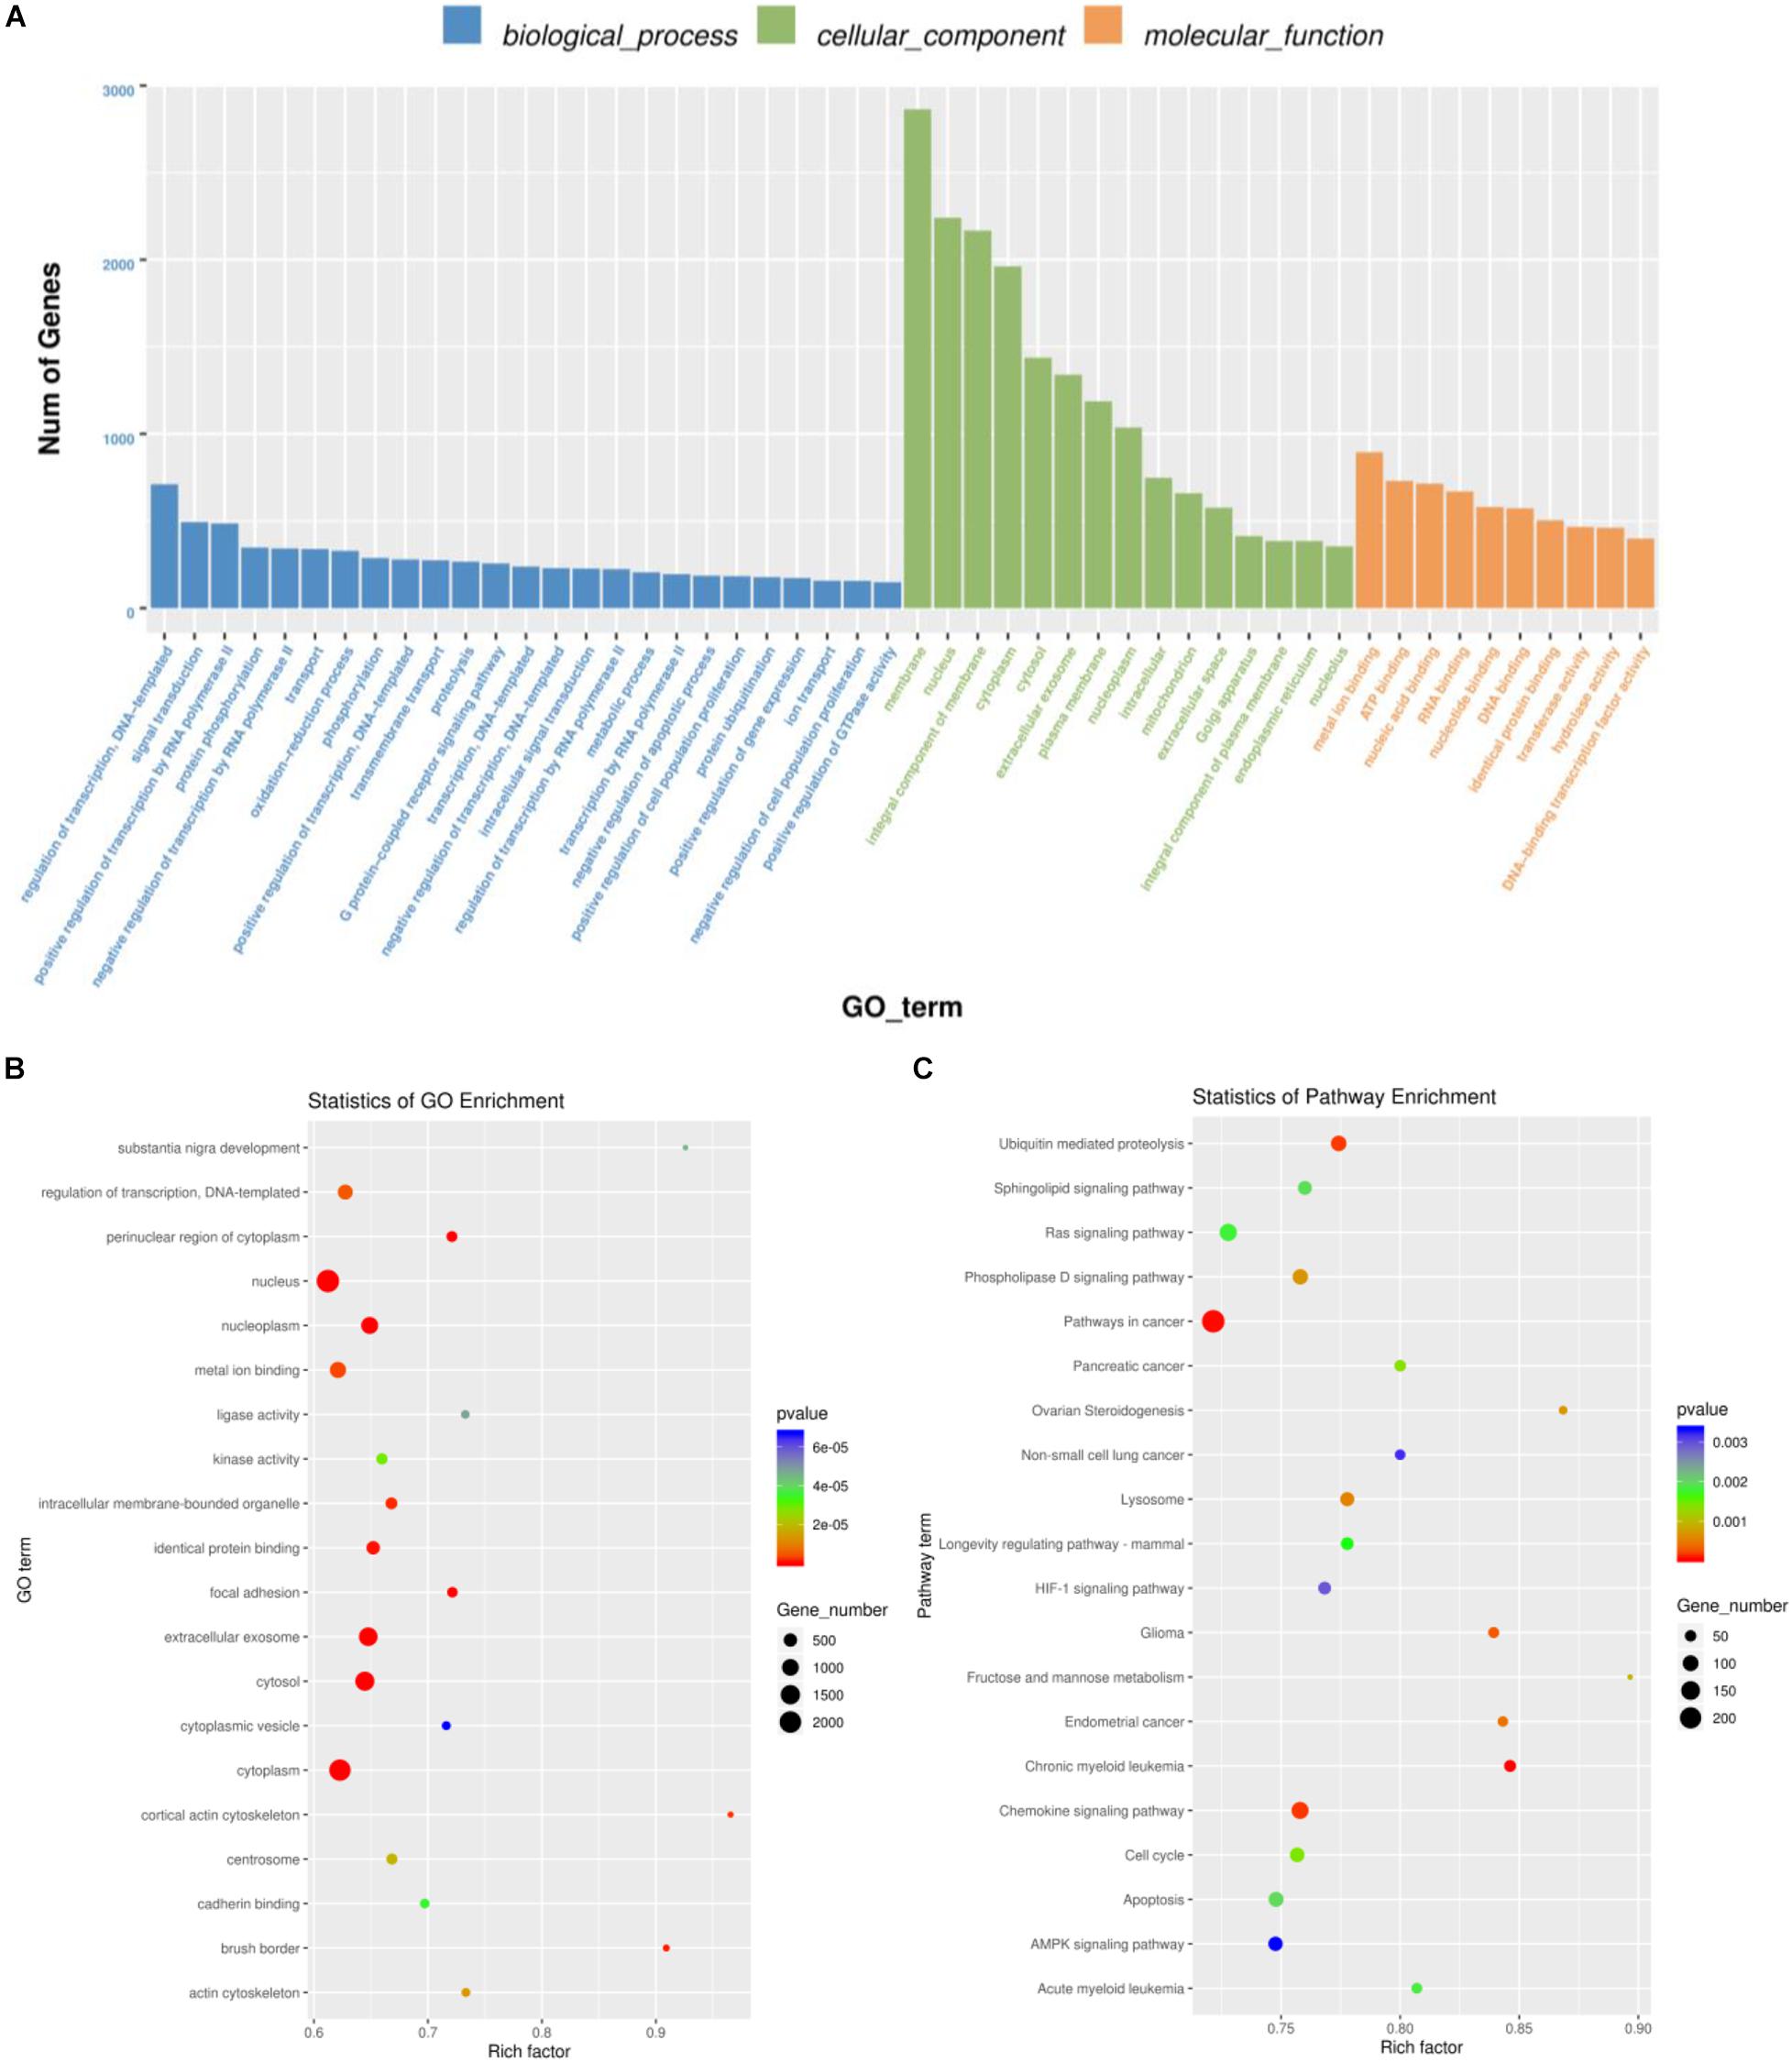
Figure 3. Enrichment analysis of GO and KEGG pathways according to the target genes of differentially expressed miRNAs. (A) Top enriched terms of biological process, cellular component, and molecular function category in Gene Ontology enrichment analysis. The abscissa is the classification of GO, and the ordinate is the percentage of target genes. (B) Top 20 significantly enriched GO pathways of differentially expressed miRNAs-targeted genes. (C) Top 20 significantly enriched KEGG pathways of differentially expressed miRNAs-targeted genes. GO, Gene ontology; KEGG, Kyoto Encyclopedia of Genes and Genomes database.
Clustering Analysis of miRNA Expression
Some miRNAs were clustered within the genome; as they are transcribed into a polycistron structure, it results in functional synergy. This synergy is indispensable in a complex cellular signaling regulatory network and more effective than a single miRNA. Due to the different regulation of post-transcriptional miRNAs during the maturation process, the expression levels of mature clustered miRNAs differ. By cluster miRNA analysis, we observed that mml-let-7g-5p and mml-let-7g-3p_1ss22CT belonged to one cluster (Table 1 and Figures 4A,B), and that following ischemia their regulation was the opposite: mml-let-7g-5p had high copy numbers in the genome and was upregulated, while mml-let-7g-3p_1ss22CT had low copy numbers and was downregulated after ischemia in the same monkey (Figure 4C). Cytoscape software was used to draw the network diagram of the most significant miRNA: mRNA pairs focusing on mml-let-7g-5p and mml-let-7g-3p_1ss22CT. It has been reported that clustered miRNAs are coordinately transcribed and exhibit similar functions by regulating the same targets (Jiao et al., 2021). Through miRNA-gene-KEGG pathway analysis, we found that mml-let-7g-5p and mml-let-7g-3p_1ss22CT share the same target genes, such as RB1-inducible coiled-coil 1 (RB1CC1), G-protein subunit γ 5 (GNG5), and chemokine (C-X-C motif) receptor 4 (CXCR4), involved in the chemokine signaling pathway, AMPK signaling pathway, longevity regulating pathway, ubiquitin-mediated proteolysis, and fructose, and mannose metabolism (Figure 4D).
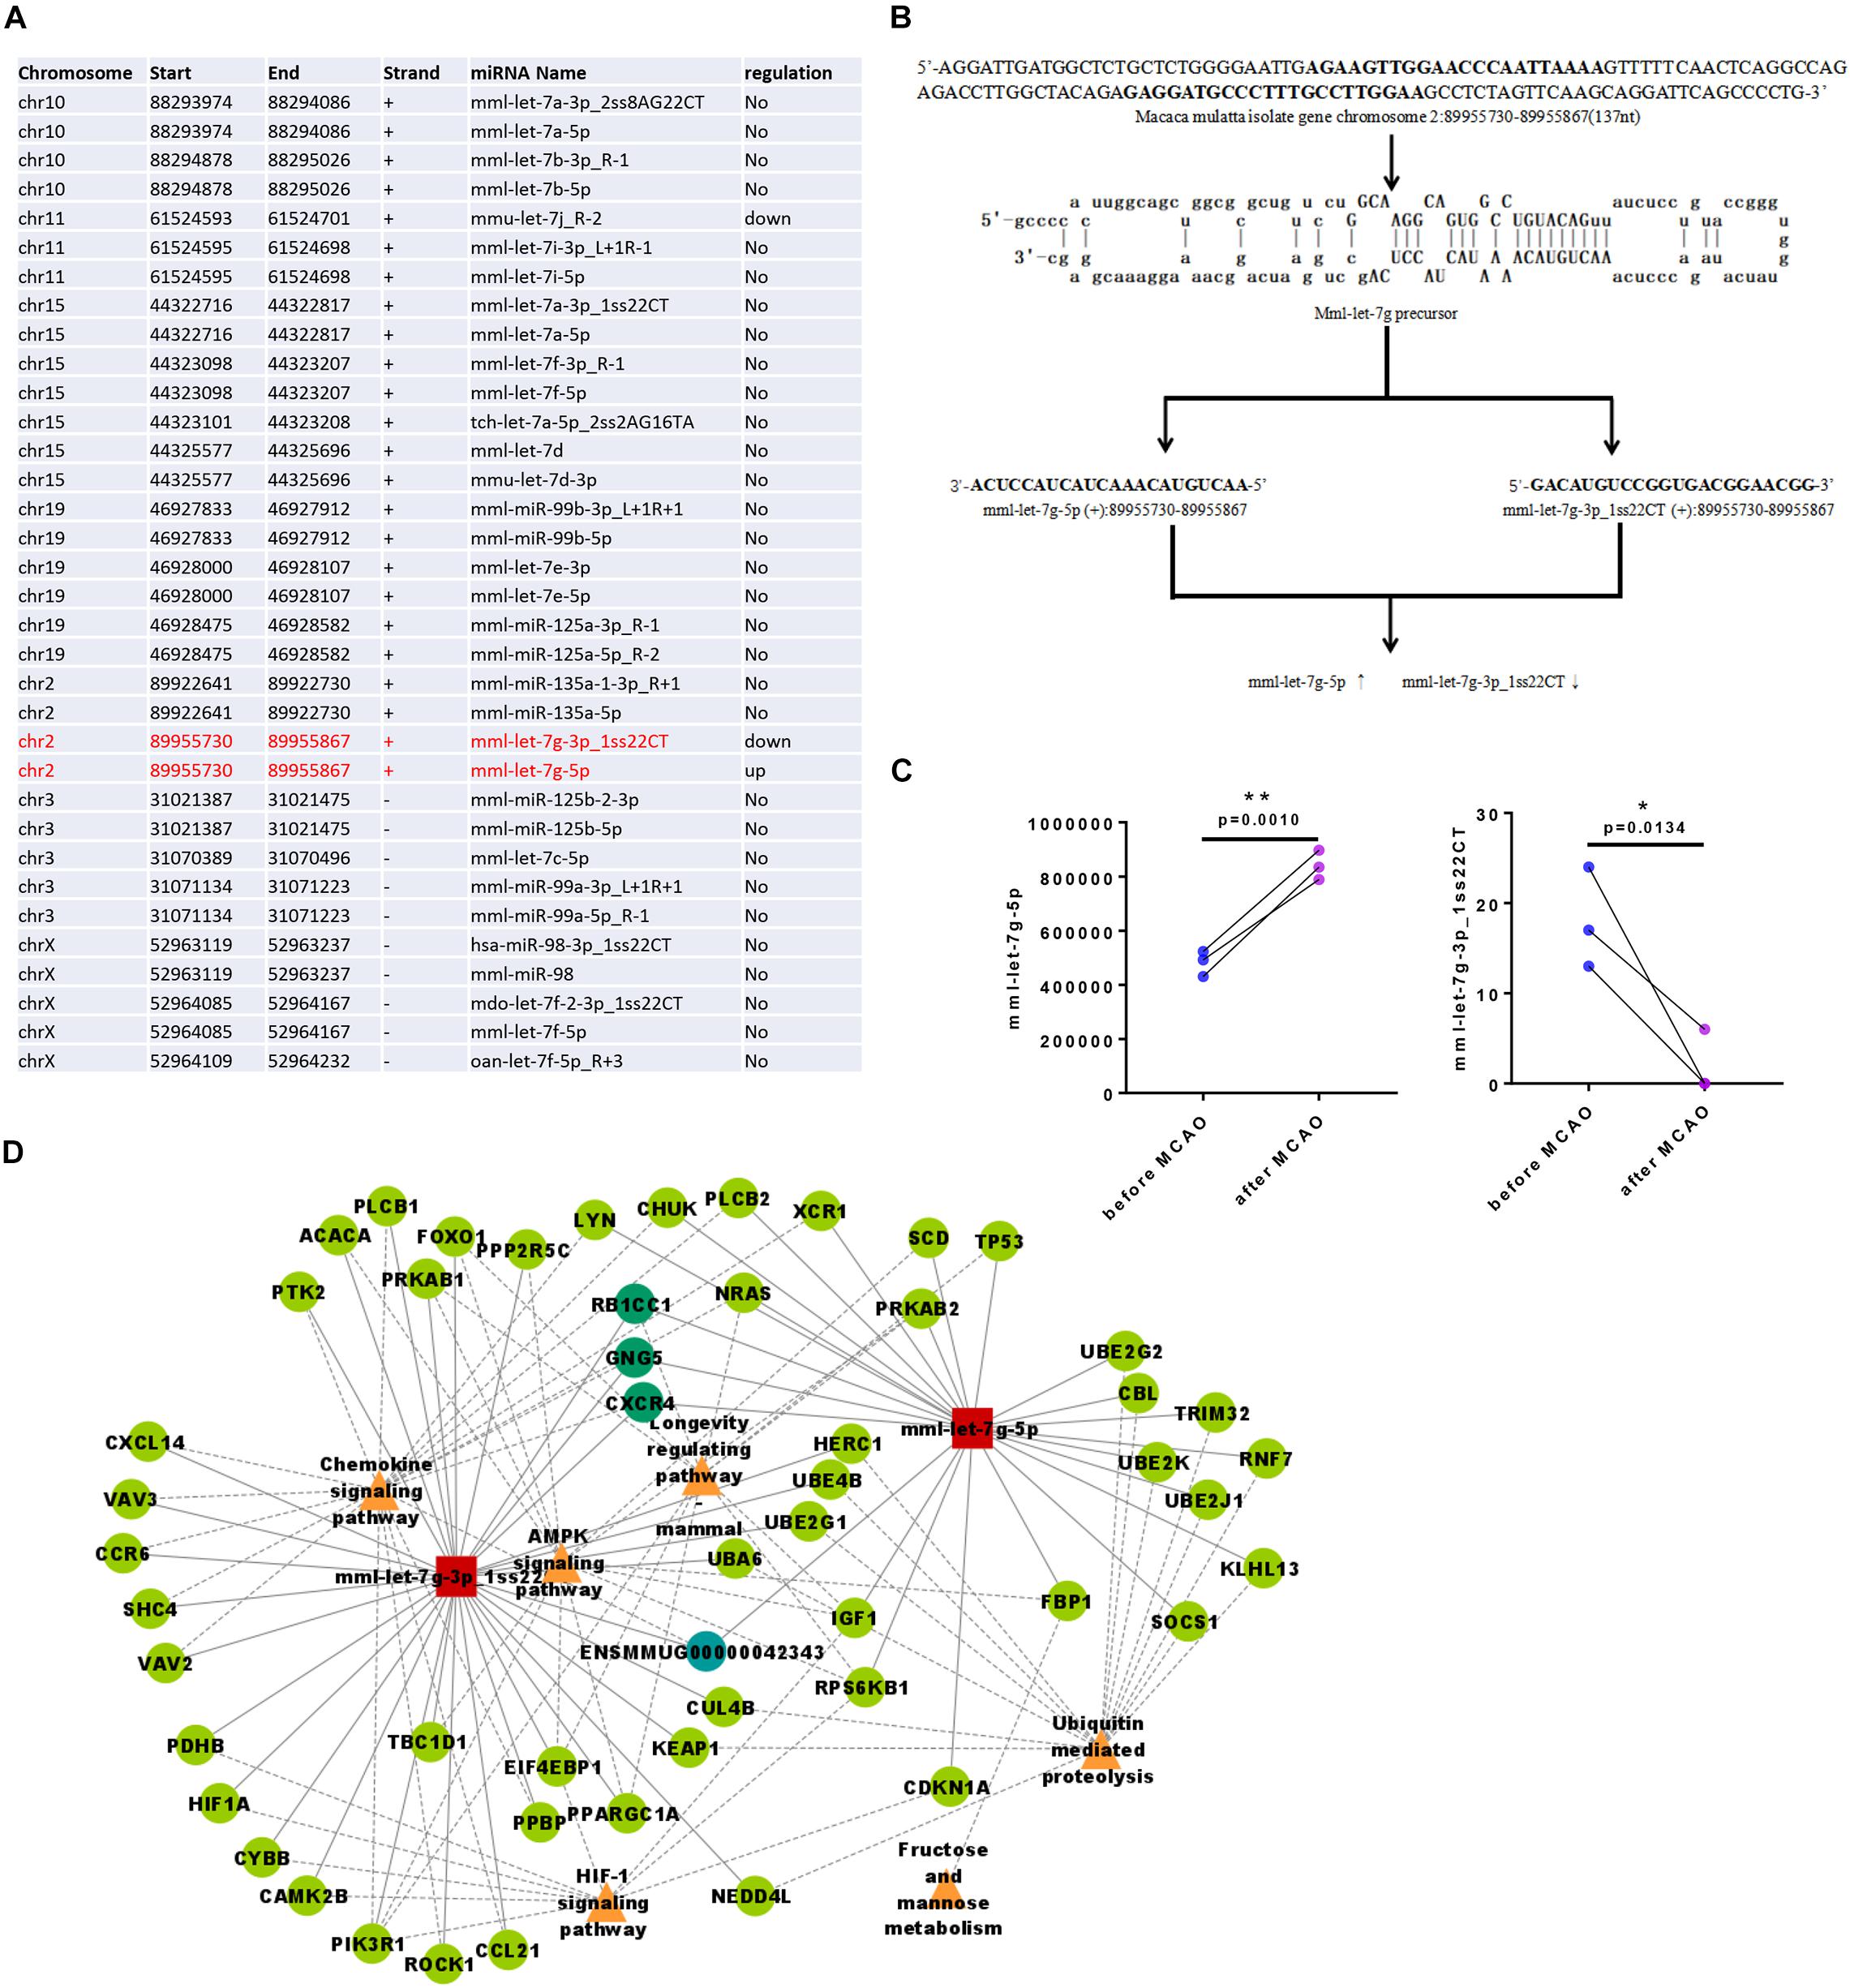
Figure 4. Clustering analysis of miRNA expression of rhesus monkey. (A) mml-let-7g-5p and mml-let-7g-3p_1ss22CT belongs to one cluster. (B) The stem-loop structures of the two pre-miRNAs that can yield mature miRNA sequences (mml-let-7g-5p and mml-let-7g-3p_1ss22CT). (C) mml-let-7g-5p and mml-let-7g-3p_1ss22CT were reversely changed following ischemia. (D) Through miRNA-gene-KEGG pathway analysis, mml-let-7g-5p, and mml-let-7g-3p_1ss22CT which share three same target genes such as RB1-inducible coiled-coil 1 (RB1CC1), G-protein subunit γ 5 (GNG5), and chemokine (C-X-C motif) receptor 4 (CXCR4), which was involved in chemokine signaling pathway, AMPK signaling pathway, longevity regulating pathway, ubiquitin mediated proteolysis, fructose, and mannose metabolism.
Evolutionary Conservation Analysis of miRNA Sequences and Seed mml-let-7g Sequence
Based on the analysis of the detected miRNAs, we further analyzed miRNA conservation and performed a statistical analysis of the frequency of these miRNAs in other species. The results showed that miRNAs are highly conserved among species (Figure 5A). Evolutionarily conserved miRNAs usually appear in high copy numbers (Lian et al., 2021). mml-let-7g-5p had high copy numbers, whereas mml-let-7g-3p_1ss22CT had low copy numbers in the rhesus monkey genome, indicating that mml-let-7g-5p is more conserved miRNA than mml-let-7g-3p_1ss22CT.
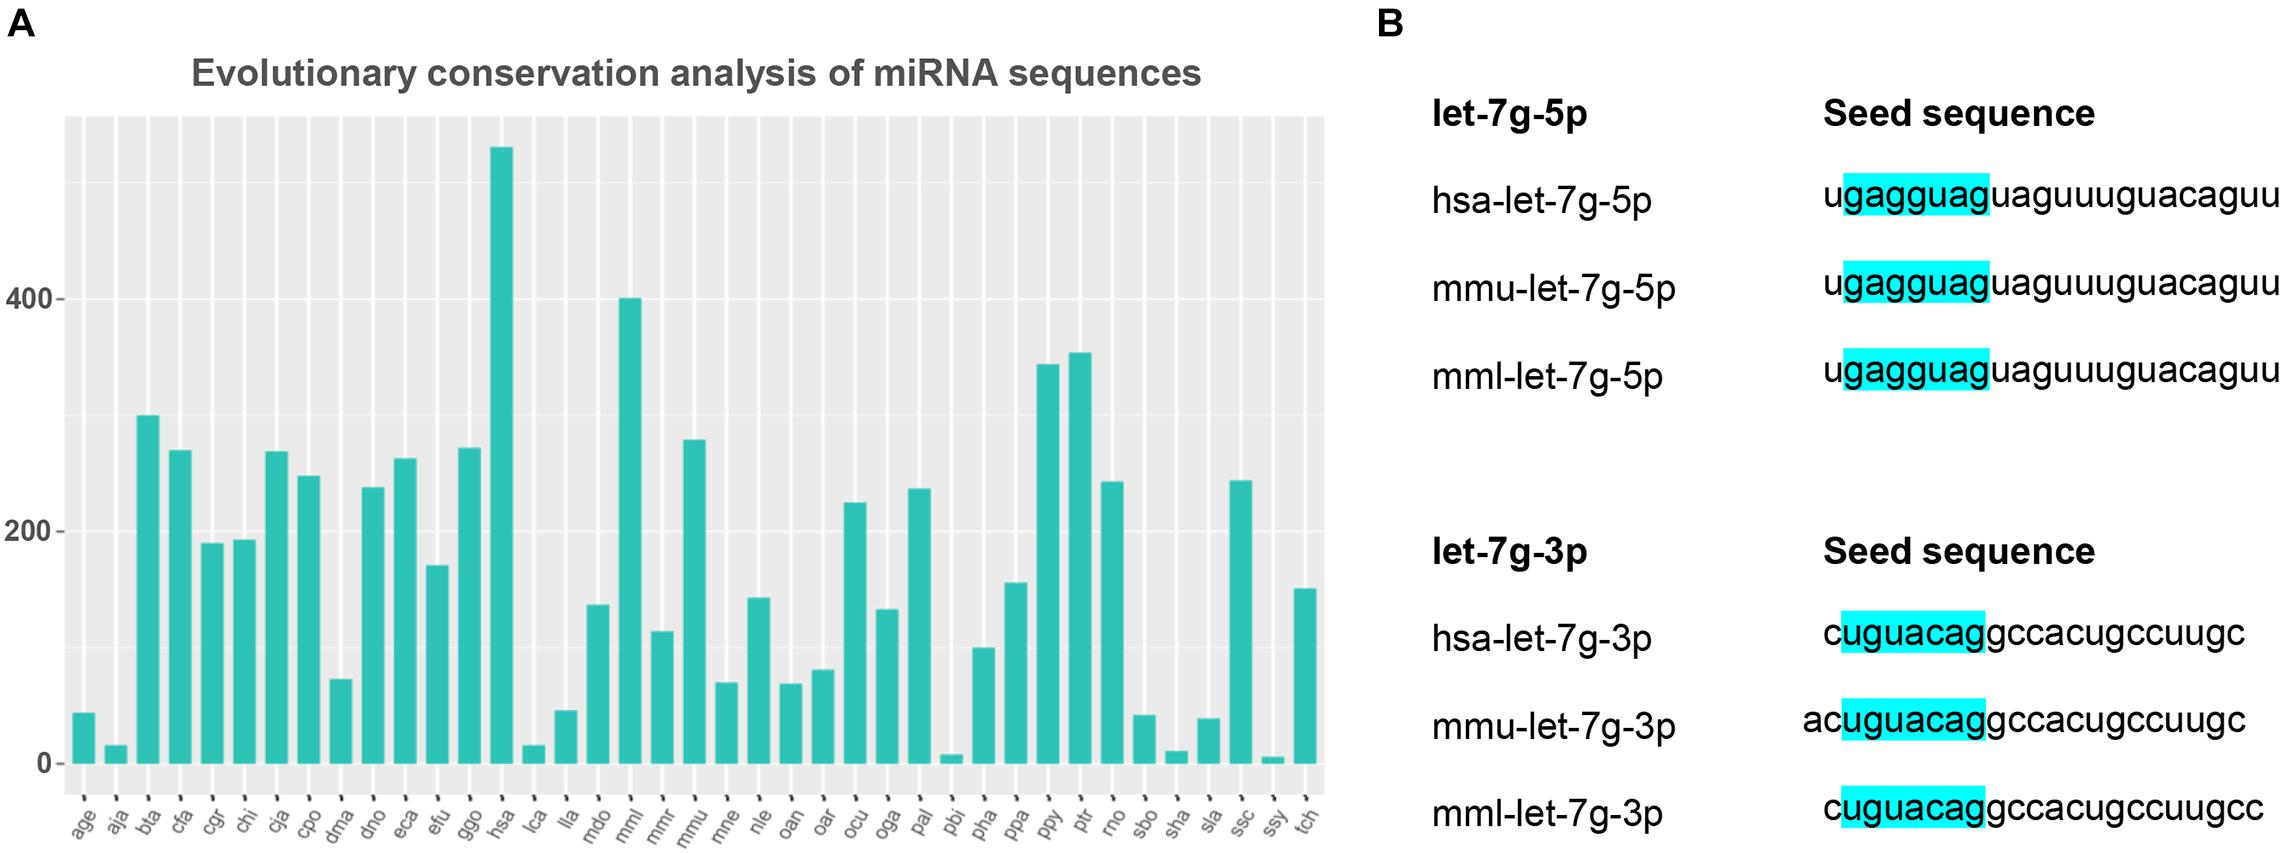
Figure 5. Evolutionary conservation analysis of miRNA sequences and seed mml-let-7g sequence. (A) The conservation of miRNA in different species. The horizontal coordinates above represent different species, and the ordinate indicates the number of times the precursor appears in the species. (B) The seed sequence of mml-let-7g-5p and mml-let-7g-3p_1ss22CT in human, rhesus monkey, and mouse, which is highlighted in blue.
In animals, miRNA inhibits mRNA expression mainly through incomplete complementary pairing with its target gene. The Watson Crick pairing between the so-called seed sequence (second-7 nt) at the 5′ end of miRNA and the 3′-UTR of the target gene is the most important factor for all miRNA target gene prediction. Twenty-one miRNAs in the let-7 family shared the seed sequence “GAGGTAG.” Human, rhesus monkey, and mouse mml-let-7g-5p share the seed sequence “GAGGTAG,” while the seed sequence of mml-let-7g-3p_1ss22 was “TGTACAG,” indicating that both mml-let-7g-5p and mml-let-7g-3p_1ss22CT were evolutionarily conserved miRNAs (Figure 5B).
Discussion
This study compared differentially expressed miRNA profiles in the plasma of three rhesus monkeys before and after cerebral ischemia. Of the 2049 miRNAs found, 36 were upregulated, and 76 were downregulated after cerebral ischemia. Further analysis revealed that differentially expressed miRNAs were involved in the regulation of various signaling pathways, including ubiquitin-mediated proteolysis, pathways in cancer, glioma, chronic myeloid leukemia, and chemokine signaling pathways. Through miRNA clustering analysis, we found that mml-let-7g-5p and let-7g-3p_1ss22CT belong to a single cluster and share three target genes: RB1CC1, GNG5, and CXCR4; further, they showed opposite changes following ischemia. These data suggest that clusters of circulating miRNAs of the mml-let-7g family may serve as a therapeutic target for ischemic stroke.
Totally, 112 miRNAs had significantly differential expressions before and after cerebral ischemia, which together with heatmap of DEmiRNAs suggested their potential as biomarkers to distinguish ischemic stroke and provided clues for us to further explore the complex regulatory mechanisms underlying ischemic stroke. To have a general understanding of functions of differentially expressed genes in following cerebral ischemia, we perform GO and KEGG pathway analysis on 112 DEmiRNAs. The enriched GO terms of BP, CC, and MF category referred to nucleus, extracellular exosome, cytoplasm, focal adhesion, and metal ion binding, ATP binding, etc. KEGG analysis showed that genes were significantly enriched in several crucial pathophysiological processes in stroke, such as ubiquitin-mediated proteolysis and signaling pathways in cancer, glioma, chronic myeloid leukemia, and chemokine signaling, etc.
Rfam revealed that rRNA was increased while tRNA was decreased in the plasma of three rhesus monkeys after cerebral ischemia. As it was recently reported that circulating tRNA fragments are a novel biomarker class to distinguish acute stroke subtypes (Nguyen et al., 2020), this topic is worthy of further study. However, the present study focused on miRNA. Many miRNAs are not randomly distributed but linked as a cluster on chromosomes and transcribed as a single polycistronic transcript from genomic DNA. These clustered miRNAs largely appear in metazoan genomes and play pivotal roles in the co-regulation of multiple biological processes. An miRNA gene cluster is composed of two or more related miRNA genes that may target specific mRNAs in the regulatory network. An miRNA duplex contains two “arms,” and the dominant one is the one which usually forms the mature miRNA; the other usually tends to be degraded, and is known as miRNA∗ (Medley et al., 2021). In recent years, studies have found that miRNAs and miRNAs∗ can co-exist under certain circumstances (Correia de Sousa et al., 2019; Dong et al., 2019; Zhang Z. et al., 2019). However, there is a lack of relevant research on the relationship between them and their functions. Recently, two studies proposed that the two arms of miRNA have synergistic (Dong et al., 2019) or antagonistic functions in various situations (Zhang Z. et al., 2019). Two miRNAs from the same precursor, miR-574-5p and miR-574-3p, were reported to show a special expression pattern, that is, the expression of miR-574-5p was upregulated while that of miR-574-3p was downregulated in the same patient, and this conversion was significantly correlated with the clinical malignancy of the gastric cancer, suggesting that it may be important for the development of gastric cancer (Zhang Z. et al., 2019). As an important regulatory molecule of gene expression, miRNA has been widely studied as a biomarker and therapeutic target in cerebral ischemia (Bulygin et al., 2020; Holmes et al., 2020). However, due to the different species and models used, different miRNAs are often screened out from high-throughput data. However, let-7 family is a common miRNA in these high-throughput data, indicating its core mechanism of ischemic stroke (Bernstein and Rom, 2020; Chen et al., 2020). In our study, we found that two miRNAs from the same precursor, mml-let-7g-5p and mml-let-7g-3p_1ss22CT, had a special expression pattern and similar to the “miR-574 arm transition.” That is, the expression of mml-let-7g-5p was upregulated while that of mml-let-7g-3p_1ss22CT was downregulated in the same monkey. It was previously shown that let-7 family regulate neuroinflammation in various pathologies, including spinal cord injury, multiple sclerosis, ischemic stroke, and Alzheimer’s disease (Gaudet et al., 2018). Let-7g∗ reduces the stroke-induced production of proinflammatory cytokines in the mouse brain (Bernstein and Rom, 2020) and protects the blood–brain barrier under neuroinflammatory conditions (Rom et al., 2015), while Let-7g counteracts endothelial dysfunction and ameliorates neurological functions in a mouse ischemia/reperfusion stroke model (Bernstein et al., 2020). Furthermore, whether this conversion was significantly correlated with clinical ischemic stroke and the so-called “mml-let-7g arm transition” was involved in the pathological process needs further study.
In our analysis, mml-let-7g-5p and mml-let-7g-3p_1ss22CT shared the same target genes, such as CXCR4, RB1CC1, and GNG5. CXCR4 is essential for an innate immune system-mediated defense response after cerebral ischemia. CXCR4 distinguishes hematopoietic stem cell-derived monocytes from microglia and reveals monocyte immune responses to experimental stroke (Werner et al., 2020). CXCR4 mimic acts as a soluble chemokine receptor that blocks atherogenic inflammation (Kontos et al., 2020). In addition, CXCR4 and stromal cell-derived factor-1 are regulators of neuronal migration (Shan et al., 2021). Another target, RB1CC1 is essential for autophagy induction, RB1CC1 insufficiency causes neuronal atrophy and is involved in the pathology of Alzheimer’s disease (Chano et al., 2007). Ablation of RB1CC1 results in a progressive loss of neural stem cells and impairment of neuronal differentiation, specifically in the postnatal brain in mice (Wang et al., 2013). Additionally, animals with a dendritic cell-specific deficiency in RB1CC1/Fip200 were protected against encephalomyelitis (Yang et al., 2021). Moreover, knockout of RB1CC1 can make tumor cells more easily killed by T cells and improve the therapeutic effect of immune checkpoint inhibitors in mice. Another target gene, GNG5, controls the number of apical and basal progenitors and alters neuronal migration during cortical development (Ayo-Martin et al., 2020). These data suggest that clusters of circulating miRNAs of the mml-let-7g family may serve as a therapeutic target for ischemic stroke which might target both central nervous system as well as immune system.
The present study aimed to identify miRNAs directly related to ischemic stroke. Thirty-six miRNAs were upregulated and 76 downregulated after cerebral ischemia. Through miRNA clustering analysis we found that mml-let-7g-5p and let-7g-3p_1ss22CT belong to a single cluster, and were conversely regulated following ischemia, and target signaling pathways such as the chemokine signaling, AMPK signaling, and longevity regulating pathways, as well as ubiquitin mediated proteolysis, and fructose and mannose metabolism. They further share three target genes, CXCR4, RB1CC1, and GNG5. These data suggest that circulating mml-let-7g may serve as a therapeutic target for ischemic stroke. This study has several limitations. First, this study is limited with small sample sizes, and is hampered by potential biases. Second, we did not prove mml-let-7g-5p was upregulated while that of mml-let-7g-3p_1ss22CT was downregulated by large sample data. Third, we didn’t identify the targets predicted by these software. Therefore, further studies are needed to determine the mechanism of action of the miRNA candidates involved in ischemic stroke.
Data Availability Statement
The data presented in the study are deposited in the GEO repository (https://www.ncbi.nlm.nih.gov/geo/query/acc.cgi?acc=GSE182429), accession number (GSE182429).
Ethics Statement
The animal study was reviewed and approved by Animal Use and Care Board of the Institute of Laboratory Animal Sciences, Capital Medical University.
Author Contributions
JC, YL, and XJ designed the experiments for the study. HZ, YH, YL, and JF wrote the manuscript. RW, ZH, DW, ZY, and LW performed the experiments and analyzed the data. All authors have read and agreed to the published version of the manuscript.
Funding
The study was supported by National Natural Science Foundation of China (81771260, 81971222, and 82071314).
Conflict of Interest
The authors declare that the research was conducted in the absence of any commercial or financial relationships that could be construed as a potential conflict of interest.
Publisher’s Note
All claims expressed in this article are solely those of the authors and do not necessarily represent those of their affiliated organizations, or those of the publisher, the editors and the reviewers. Any product that may be evaluated in this article, or claim that may be made by its manufacturer, is not guaranteed or endorsed by the publisher.
Supplementary Material
The Supplementary Material for this article can be found online at: https://www.frontiersin.org/articles/10.3389/fnins.2021.738576/full#supplementary-material
References
Ayo-Martin, A. C., Kyrousi, C., Di Giaimo, R., and Cappello, S. (2020). GNG5 controls the number of apical and basal progenitors and alters neuronal migration during cortical development. Front. Mol. Biosci. 7:578137. doi: 10.3389/fmolb.2020.578137
Bernstein, D. L., Gajghate, S., Reichenbach, N. L., Winfield, M., Persidsky, Y., Heldt, N. A., et al. (2020). let-7g counteracts endothelial dysfunction and ameliorating neurological functions in mouse ischemia/reperfusion stroke model. Brain Behav. Immun. 87, 543–555. doi: 10.1016/j.bbi.2020.01.026
Bernstein, D. L., and Rom, S. (2020). Let-7g∗ and miR-98 reduce stroke-induced production of proinflammatory cytokines in mouse brain. Front. Cell Dev. Biol. 8:632. doi: 10.3389/fcell.2020.00632
Bulygin, K. V., Beeraka, N. M., Saitgareeva, A. R., Nikolenko, V. N., Gareev, I., Beylerli, O., et al. (2020). Can miRNAs be considered as diagnostic and therapeutic molecules in ischemic stroke pathogenesis?-Current Status. Int. J. Mol. Sci. 21:6728. doi: 10.3390/ijms21186728
Chano, T., Okabe, H., and Hulette, C. M. (2007). RB1CC1 insufficiency causes neuronal atrophy through mTOR signaling alteration and involved in the pathology of Alzheimer’s diseases. Brain Res. 1168, 97–105. doi: 10.1016/j.brainres.2007.06.075
Chen, D., Li, L., Wang, Y., Xu, R., Peng, S., Zhou, L., et al. (2020). Ischemia-reperfusion injury of brain induces endothelial-mesenchymal transition and vascular fibrosis via activating let-7i/TGF-betaR1 double-negative feedback loop. FASEB J. 34, 7178–7191. doi: 10.1096/fj.202000201R
Correia de Sousa, M., Gjorgjieva, M., Dolicka, D., Sobolewski, C., and Foti, M. (2019). Deciphering miRNAs’ action through miRNA editing. Int. J. Mol. Sci. 20:6249. doi: 10.3390/ijms20246249
Dong, L., Zhang, Z., Xu, J., Wang, F., Ma, Y., Li, F., et al. (2019). Consistency analysis of microRNA-arm expression reveals microRNA-369-5p/3p as tumor suppressors in gastric cancer. Mol. Oncol. 13, 1605–1620. doi: 10.1002/1878-0261.12527
Erdos, M. R., Cabral, W. A., Tavarez, U. L., Cao, K., Gvozdenovic-Jeremic, J., Narisu, N., et al. (2021). A targeted antisense therapeutic approach for Hutchinson-Gilford progeria syndrome. Nat. Med. 27, 536–545. doi: 10.1038/s41591-021-01274-0
Gaudet, A. D., Fonken, L. K., Watkins, L. R., Nelson, R. J., and Popovich, P. G. (2018). MicroRNAs: roles in regulating neuroinflammation. Neuroscientist 24, 221–245. doi: 10.1177/1073858417721150
Han, S., Wang, T., Chen, Y., Han, Z., Guo, L., Wu, Z., et al. (2019). High CCL7 expression is associated with migration, invasion and bone metastasis of non-small cell lung cancer cells. Am. J. Transl. Res. 11, 442–452.
Holmes, A., Xu, Y., Lee, J., Maniskas, M. E., Zhu, L., McCullough, L. D., et al. (2020). Post-stroke social isolation reduces cell proliferation in the dentate Gyrus and Alters miRNA Profiles in the Aged Female Mice Brain. Int. J. Mol. Sci. 22:99. doi: 10.3390/ijms22010099
Jeon, O. H., Wilson, D. R., Clement, C. C., Rathod, S., Cherry, C., Powell, B., et al. (2019). Senescence cell-associated extracellular vesicles serve as osteoarthritis disease and therapeutic markers. JCI Insight 4, e125019. doi: 10.1172/jci.insight.125019
Jiao, D., Jiang, C., Zhu, L., Zheng, J., Liu, X., Liu, X., et al. (2021). miR-1/133a and miR-206/133b clusters overcome HGF induced gefitinib resistance in non-small cell lung cancers with EGFR sensitive mutations. J. Drug Target. doi: 10.1080/1061186X.2021.1927054 [Epub ahead of print].
Kontos, C., El Bounkari, O., Krammer, C., Sinitski, D., Hille, K., Zan, C., et al. (2020). Designed CXCR4 mimic acts as a soluble chemokine receptor that blocks atherogenic inflammation by agonist-specific targeting. Nat. Commun. 11:5981. doi: 10.1038/s41467-020-19764-z
Li, J., Yang, X., Liu, F., Song, Y., and Liu, Y. (2019). Evaluation of differentially expressed microRNAs in vitrified oocytes by next generation sequencing. Int. J. Biochem. Cell Biol. 112, 134–140. doi: 10.1016/j.biocel.2019.05.006
Lian, H., Wang, L., Ma, N., Zhou, C. M., Han, L., Zhang, T. Q., et al. (2021). Redundant and specific roles of individual MIR172 genes in plant development. PLoS Biol. 19:e3001044. doi: 10.1371/journal.pbio.3001044
Medley, J. C., Panzade, G., and Zinovyeva, A. Y. (2021). microRNA strand selection: unwinding the rules. Wiley Interdiscip. Rev. RNA 12:e1627. doi: 10.1002/wrna.1627
Nagaraja, N., Forder, J. R., Warach, S., and Merino, J. G. (2020). Reversible diffusion-weighted imaging lesions in acute ischemic stroke: a systematic review. Neurology 94, 571–587. doi: 10.1212/WNL.0000000000009173
Nguyen, T. T. M., van der Bent, M. L., Wermer, M. J. H., van den Wijngaard, I. R., van Zwet, E. W., de Groot, B., et al. (2020). Circulating tRNA fragments as a novel biomarker class to distinguish acute stroke subtypes. Int. J. Mol. Sci. 22:135. doi: 10.3390/ijms22010135
Pang, F., Zhang, M., Yang, X., Li, G., Zhu, S., Nie, X., et al. (2019). Genome-wide analysis of circular RNAs in goat skin fibroblast cells in response to Orf virus infection. PeerJ 7:e6267. doi: 10.7717/peerj.6267
Rom, S., Dykstra, H., Zuluaga-Ramirez, V., Reichenbach, N. L., and Persidsky, Y. (2015). miR-98 and let-7g∗ protect the blood-brain barrier under neuroinflammatory conditions. J. Cereb. Blood Flow Metab. 35, 1957–1965. doi: 10.1038/jcbfm.2015.154
Shan, Y., Farmer, S. M., and Wray, S. (2021). Drebrin regulates cytoskeleton dynamics in migrating neurons through interaction with CXCR4. Proc. Natl. Acad. Sci. U.S.A. 118:e2009493118. doi: 10.1073/pnas.2009493118
Singh, S., de Ronde, M. W. J., Creemers, E. E., Van der Made, I., Meijering, R., Chan, M. Y., et al. (2021). Low miR-19b-1-5p expression is related to aspirin resistance and major adverse cardio- cerebrovascular events in patients with acute coronary syndrome. J. Am. Heart Assoc. 10:e017120. doi: 10.1161/JAHA.120.017120
Tsimikas, S., Moriarty, P. M., and Stroes, E. S. (2021). Emerging RNA therapeutics to lower blood levels of Lp(a): JACC Focus Seminar 2/4. J. Am. Coll. Cardiol. 77, 1576–1589. doi: 10.1016/j.jacc.2021.01.051
Wang, B., Wu, D., Dornbos Iii, D., Shi, J., Ma, Y., Zhang, M., et al. (2016). Local cerebral hypothermia induced by selective infusion of cold lactated ringer’s: a feasibility study in rhesus monkeys. Neurol. Res. 38, 545–552. doi: 10.1080/01616412.2016.1187827
Wang, C., Liang, C. C., Bian, Z. C., Zhu, Y., and Guan, J. L. (2013). FIP200 is required for maintenance and differentiation of postnatal neural stem cells. Nat. Neurosci. 16, 532–542. doi: 10.1038/nn.3365
Werner, Y., Mass, E., Ashok Kumar, P., Ulas, T., Handler, K., Horne, A., et al. (2020). Cxcr4 distinguishes HSC-derived monocytes from microglia and reveals monocyte immune responses to experimental stroke. Nat. Neurosci. 23, 351–362. doi: 10.1038/s41593-020-0585-y
Wu, D., Chen, J., Hussain, M., Wu, L., Shi, J., Wu, C., et al. (2020a). Selective intra-arterial brain cooling improves long-term outcomes in a non-human primate model of embolic stroke: efficacy depending on reperfusion status. J. Cereb. Blood Flow Metab. 40, 1415–1426. doi: 10.1177/0271678X20903697
Wu, D., Fu, Y., Wu, L., Huber, M., Chen, J., Yao, T., et al. (2020b). Reperfusion plus selective intra-arterial cooling (SI-AC) improve recovery in a nonhuman primate model of stroke. Neurotherapeutics 17, 1931–1939. doi: 10.1007/s13311-020-00895-6
Wu, D., Wu, L., Chen, J., Huber, M., He, X., Li, S., et al. (2020c). Primate version of modified Rankin scale for classifying dysfunction in rhesus monkeys. Stroke 51, 1620–1623. doi: 10.1161/STROKEAHA.119.028108
Wu, L., Wu, D., Chen, J., Chen, C., Yao, T., He, X., et al. (2021). Intranasal salvinorin A improves neurological outcome in rhesus monkey ischemic stroke model using autologous blood clot. J. Cereb. Blood Flow Metab. 41, 723–730. doi: 10.1177/0271678X20938137
Yang, G., Postoak, J. L., Song, W., Martinez, J., Zhang, J., Wu, L., et al. (2021). Dendritic cell PIK3C3/VPS34 controls the pathogenicity of CNS autoimmunity independently of LC3-associated phagocytosis. Autophagy. doi: 10.1080/15548627.2021.1922051 [Epub ahead pf print].
Zhang, L., Liang, R., Zhang, G., Zhai, Z., Deng, Y., Li, J., et al. (2019). Analysis of the microRNA expression profiles in feline kidney cell line infected with feline panleukopenia virus. Infect. Genet. Evol. 75:103945. doi: 10.1016/j.meegid.2019.103945
Keywords: cerebral ischemia, rhesus monkeys, let-7g-5p, let-7g-3p_1ss22CT, plasma
Citation: Chen J, Zhao H, Huang Y, Li Y, Fan J, Wang R, Han Z, Yang Z, Wu L, Wu D, Luo Y and Ji X (2021) Dysregulation of Principal Circulating miRNAs in Non-human Primates Following Ischemic Stroke. Front. Neurosci. 15:738576. doi: 10.3389/fnins.2021.738576
Received: 09 July 2021; Accepted: 13 August 2021;
Published: 01 September 2021.
Edited by:
Mingshu Mo, Guangzhou Medical University, ChinaReviewed by:
Guoyuan Yang, Shanghai Jiao Tong University, ChinaEric Alsop, Translational Genomics Research Institute (TGen), United States
Copyright © 2021 Chen, Zhao, Huang, Li, Fan, Wang, Han, Yang, Wu, Wu, Luo and Ji. This is an open-access article distributed under the terms of the Creative Commons Attribution License (CC BY). The use, distribution or reproduction in other forums is permitted, provided the original author(s) and the copyright owner(s) are credited and that the original publication in this journal is cited, in accordance with accepted academic practice. No use, distribution or reproduction is permitted which does not comply with these terms.
*Correspondence: Yumin Luo, eXVtaW4xMTFAY2NtdS5lZHUuY24=; Xunming Ji, aml4bUBjY211LmVkdS5jbg==
†These authors have contributed equally to this work