 Evie C. Landry1,2,3
 Mirre Scholte4
 Matthew P. Su2,3
 Yvette Horstink4
 Rishi Mandavia2,3Maroeska M. Rovers4
 Anne G. M. Schilder2,3*
- 1Division of Otolaryngology-Head and Neck Surgery, St. Paul’s Hospital, BC Rotary Hearing and Balance Centre, University of British Columbia, Vancouver, BC, Canada
- 2National Institute for Health Research University College London Hospitals Biomedical Research Centre Hearing Theme, London, United Kingdom
- 3evidENT, Ear Institute, University College London, London, United Kingdom
- 4Department of Operating Rooms, Radboud University Medical Center, Nijmegen, Netherlands
Background: Health systems face challenges to accelerate access to innovations that add value and avoid those unlikely to do so. This is very timely to the field of age-related sensorineural hearing loss (ARHL), where a significant unmet market need has been identified and sizeable investments made to promote the development of novel hearing therapeutics (NT). This study aims to apply health economic modeling to inform the development of cost-effective NT.
Methods: We developed a decision-analytic model to assess the potential costs and effects of using regenerative NT in patients ≥50 with ARHL. This was compared to the current standard of care including hearing aids and cochlear implants. Input data was collected from systematic literature searches and expert opinion. A UK NHS healthcare perspective was adopted. Three different but related analyses were performed using probabilistic modeling: (1) headroom analysis, (2) scenario analyses, and (3) threshold analyses.
Results: The headroom analysis shows an incremental net monetary benefit (iNMB) of £20,017[£11,299–£28,737] compared to the standard of care due to quality-adjusted life-years (QALY) gains and cost savings. Higher therapeutic efficacy and access for patients with all degrees of hearing loss yields higher iNMBs. Threshold analyses shows that the ceiling price of the therapeutic increases with more severe degrees of hearing loss.
Conclusion: NT for ARHL are potentially cost-effective under current willingness-to-pay (WTP) thresholds with considerable room for improvement in the current standard of care pathway. Our model can be used to help decision makers decide which therapeutics represent value for money and are worth commissioning, thereby paving the way for urgently needed NT.
Introduction
Hearing loss currently affects almost 500 million people worldwide and this number is anticipated to rise to 900 million by 2050 as the world’s population ages and the number of individuals with age-related hearing loss (ARHL) increases (Blevins, 2018; WHO, 2018). This type of hearing loss is characterized by a decline in auditory function predominantly due to progressive loss of inner ear sensory hair cells and their synapses to auditory neurons (Yamasoba et al., 2013). Irrespective of its cause and severity, hearing loss can affect people socially, mentally, and physically. Importantly, hearing loss acquired in mid-life has been identified as a major risk factor for dementia (Lin and Albert, 2014). The global economic burden of hearing loss has been estimated at over 750 billion US dollars annually in direct medical costs and productivity losses (WHO, 2018).
The mainstay of treatment for ARHL includes hearing aids for those with mild to moderate hearing loss and cochlear implants for those with severe to profound deafness (WHO, 2018). Although these technologies have improved significantly in recent years, they often fail to meet the needs of those who need them most as they perform poorly in noisy environments and are limited in their ability to improve sound clarity. Therefore, many people choose not to use them (McCormack and Fortnum, 2013). Above all, they do not treat the underlying causes of ARHL or halt progression (McCormack and Fortnum, 2013).
Biotechnology and pharmaceutical companies have identified this unmet market need and have dedicated sizeable effort and investments in the development of novel approaches to treat ARHL (Li, 2017). A better understanding of the genetic and molecular mechanisms underlying hair cell and synaptic loss and their regeneration in preclinical models has led to the discovery of potential therapeutic targets, and the development of a variety of small molecule pharmaceuticals and advanced therapies (Schilder et al., 2018). Some of these novel therapeutics are already at the stage of clinical testing in humans (Schilder et al., 2018).
Because these therapeutics have the potential to drastically change hearing care pathways in the next 5 years, it is crucial to start planning for their implementation (Schilder et al., 2019). Early health economic modeling is an important tool in this process. By providing a better understanding of the likely cost-effectiveness of the novel hearing therapeutics, healthcare systems can use these models to prepare for their adoption while they are still in development and thus optimize patient access and minimize inefficiencies. At the same time, these models can support industry by informing product development, market access, pricing, and can also act as frameworks that can be tailored with data from clinical trials as it becomes available (IJzerman and Steuten, 2011).
This study applies these principles and uses early health economic modeling to assess the potential added value of novel regenerative therapeutics in ARHL compared to the current standard of care.
Materials and Methods
Ethical Considerations
Ethics approval was granted by the University College London Research Ethics Committee 12241/001. Informed consent was obtained from all participants.
Model Overview and Assumptions
A state-transition model, following the ISPOR-SMDM Best Practice Guidelines, was created using Microsoft Excel (Redmond, Wash) to assess the potential costs and effects of using novel regenerative hearing therapeutics in adults, 50 or older, with ARHL (Roberts et al., 2012). This was compared to the current standard of care, including hearing aids and cochlear implants. Figure 1 shows a representation of the patient’s pathway modeled in the study. Supplemental Digital Content (SDC) 1 contains an in-depth description of hearing loss classification using pure-tone averages (PTA) (Mathers et al., 2000).
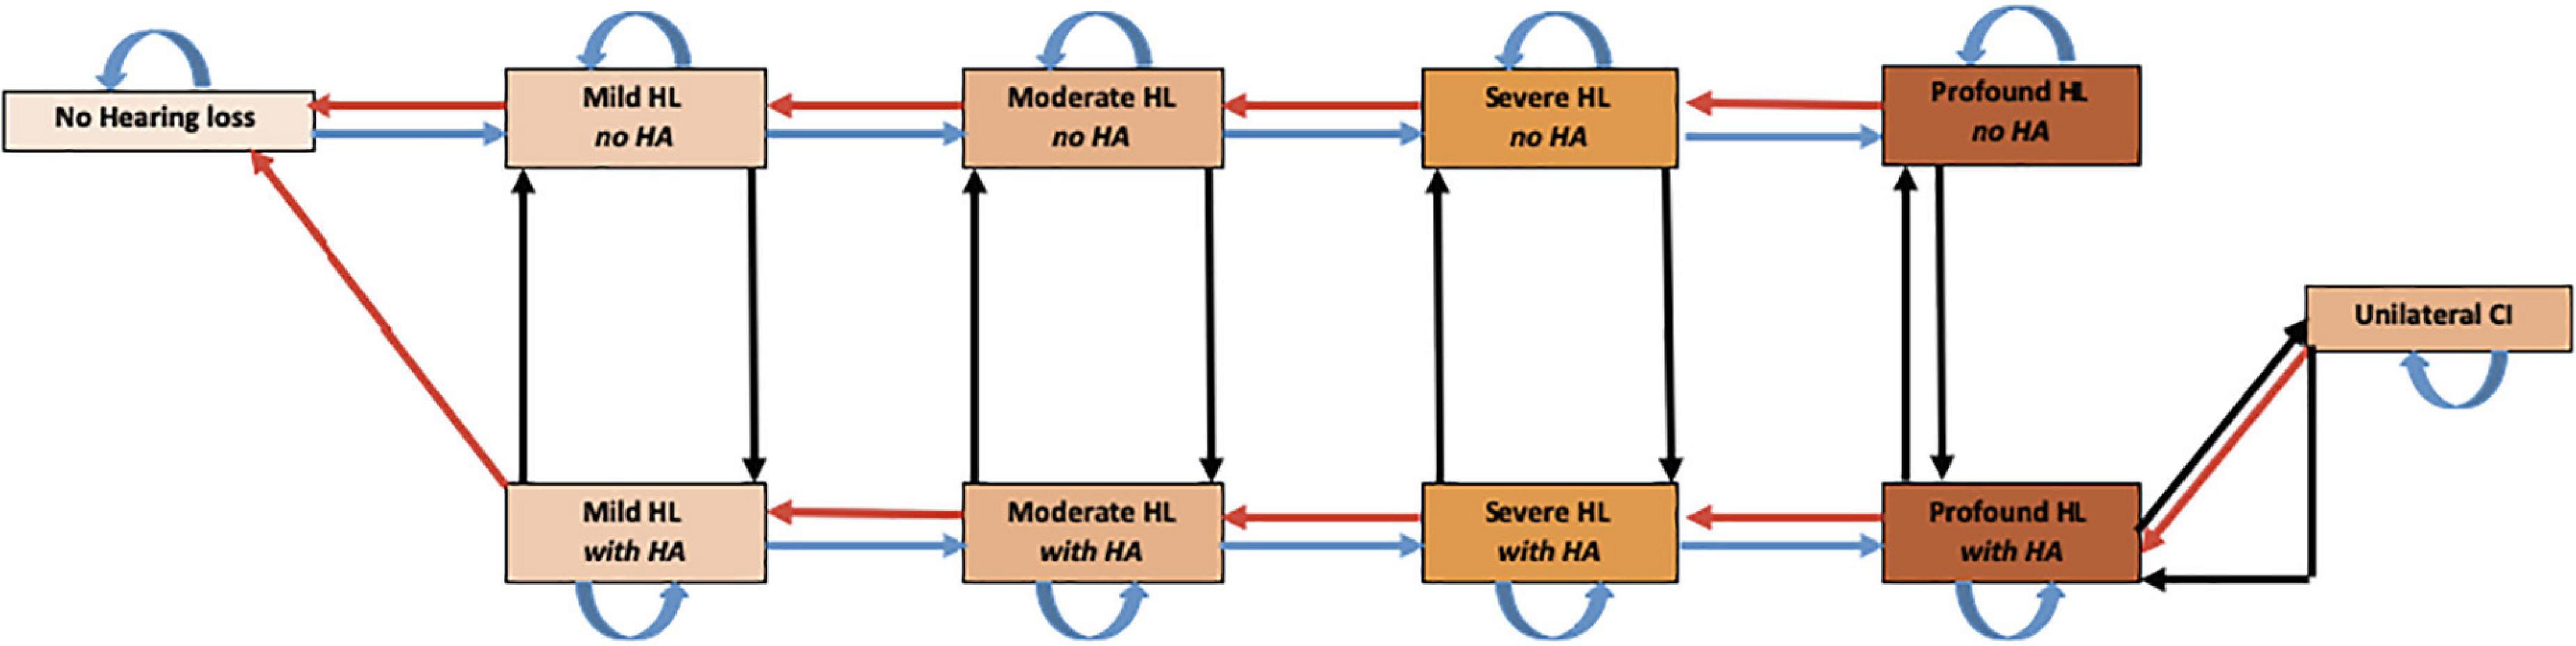
Figure 1. Markov Model of health states used to assess regenerative hearing loss therapeutics. The model starts with a cohort of 50-year-old patients with various degrees of HL. Every cycle subjects could progress to 1 of 11 mutually exclusive disease states including death. Though movement is possible between every state, natural death and all arrows not depicted for simplicity. HL, hearing loss; HA, hearing aid; CI, cochlear implant.
The model adopts a cycle length of 1 year and spans the patient’s lifetime until death given the life-long costs and effects of hearing loss. The model is constructed from a healthcare perspective of the National Health Service (NHS) in the United Kingdom and evaluates direct medical costs. A willingness to pay threshold of £20,000 per quality-adjusted life year (QALY) is used to assess the cost-effectiveness (CE) of the intervention (NICE, 2017). Both costs and outcomes are discounted at a 3.5% per annum rate to comply with NICE guidelines (National Institute for Health and Clinical Excellence, 2008). NICE stands for the National Institute for Health and Care Excellence. It is an independent organization which evaluates and provides recommendations of which drugs and treatments are available on the NHS in England. Other key model assumptions can be found in SDC 2. See SDC 3 for a complete list of abbreviations used in the text along with verbal descriptors.
Model Validation
The model was validated using the AdViSHE validation assessment tool (Vemer et al., 2016). The conceptual model, input data, and model outcomes were tested on face and operational validity by consulting professional stakeholders (n = 24) from the pharmaceutical and biotechnology industry, national hearing charities, otolaryngology, audiology, discovery science, and research funding bodies. The model outcomes were cross validated with relevant literature. No other health economic models on ARHL were found for cross-validation. Additionally, the model was verified for inconsistencies by two independent modeling experts.
Novel Hearing Therapy Pathway
With no regenerative therapeutic for ARHL having been approved for clinical use, we used a hypothetical regenerative therapy to model different efficacy scenarios. Our model focused primarily on regenerative therapeutics and was not targeted toward a specific gene, cell, molecular therapy or method of delivery. In order to estimate the maximum potential benefit of the therapeutic (headroom), the base case scenario assumed a 100% adherence, uptake and efficacy of the therapy with zero costs. This meant that patients with any form of hearing loss recovered to normal hearing after therapy administration. It also assumed that rates of hearing loss progression in subsequent years were unaffected, meaning that patients could once again develop age-related hearing loss. The model assumed that all patients were eligible for both existing and novel strategies and could receive either a hearing aid, a cochlear implant, or the novel therapy as they developed hearing loss in the model.
Model Parameters
Transition Probabilities
Transition probabilities were derived from published literature and expert opinion (Tables 1A,B). The model population included five different age groups: 50−59, 60−69, 70−79, 80−89, and 90 and over, with different transition probabilities for progression of age-related sensorineural hearing loss (Table 1A). Age-varying all-cause mortality rates were also incorporated in the model using data from the UK Office for National Statistics (2018b). Although several papers suggested an association between HL in older adults and increased mortality rates, it was felt the evidence was incomplete and it was therefore not incorporated into our model (Fisher et al., 2014; Contrera et al., 2015; Schubert et al., 2016).
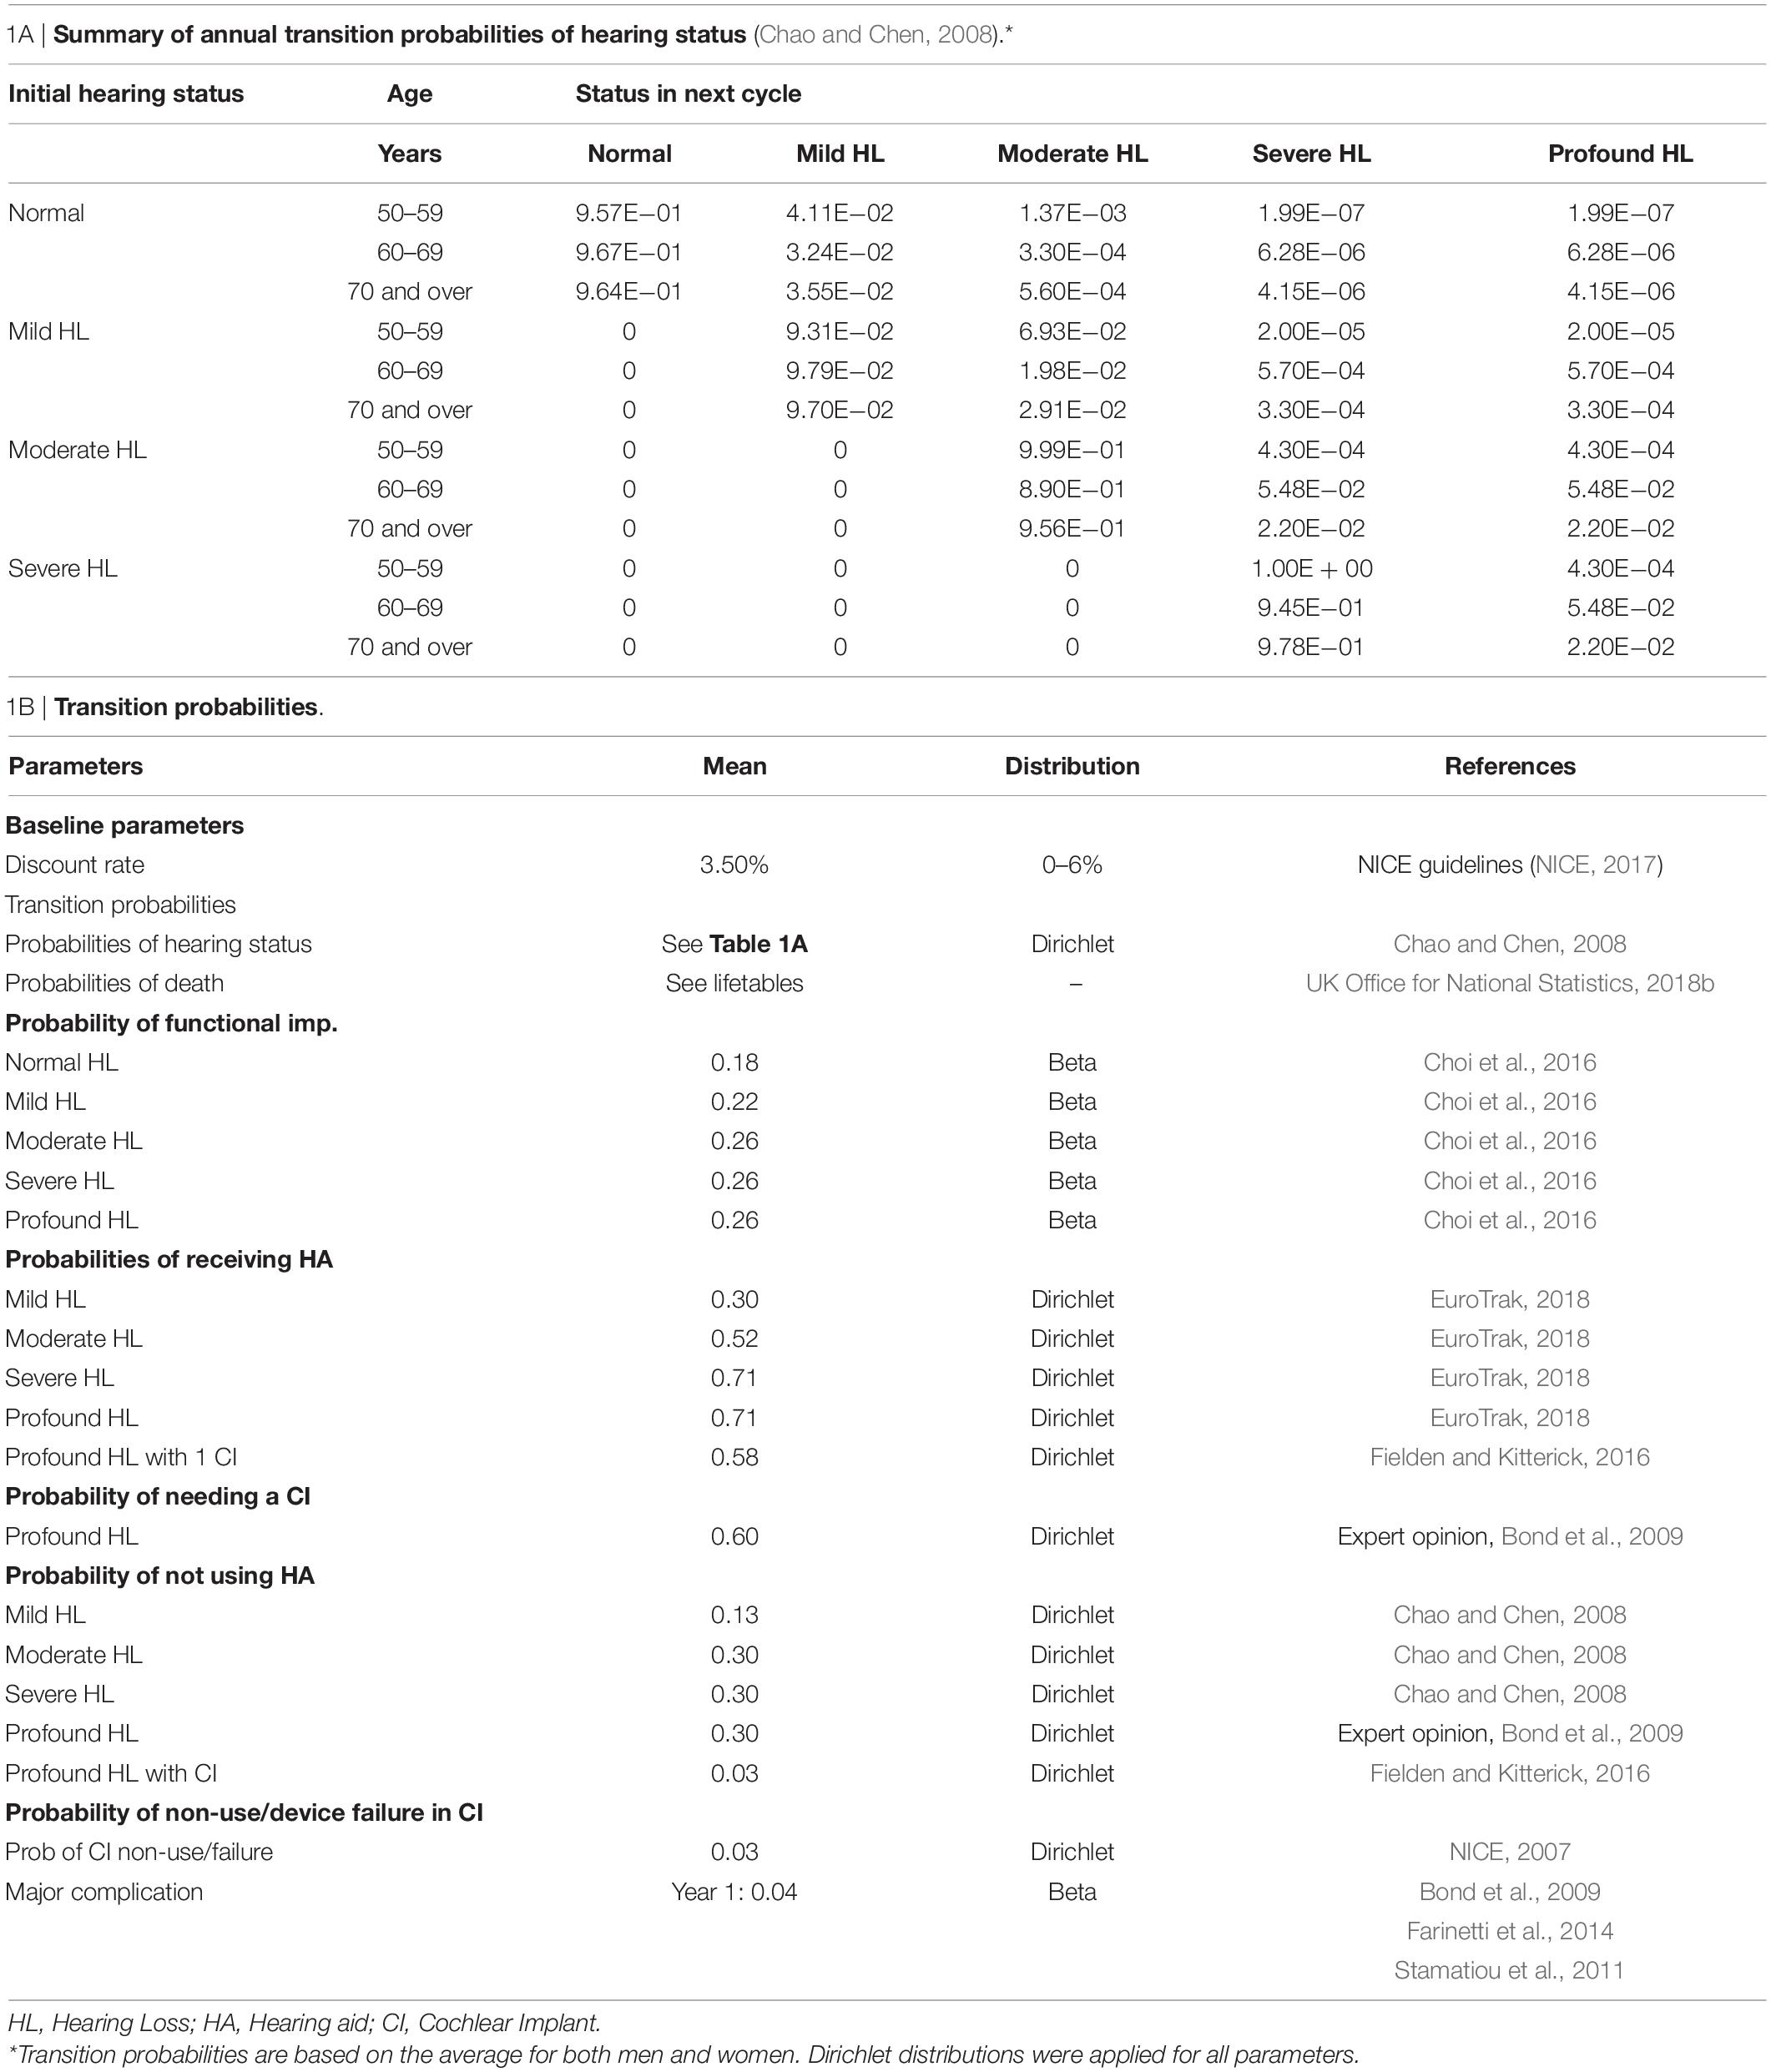
Table 1. Transition probabilities.
Outcomes
Health effects were measured using QALYs that factored both length and quality of life into a single measure (SDC 6). Preference based utility measures of health-related quality of life were obtained from published literature (Table 2). Due to the poor sensitivity of the European quality of life five dimension (EQ-5D) in sensory disorders such as hearing loss, the Health utilities index mark III (HUI-3) was used (Longworth et al., 2014; Yang Y. et al., 2015). The utility score provides a summary index of health-related quality of life on a zero to one scale. Functional impairment was incorporated in all hearing loss states, except for the cochlear implant state due to lack of available data. Functional impairment was defined as difficulties in activities of daily living (ADLs) correlated to pure-tone averages (Choi et al., 2016). We assumed the utility of being functionally impaired was equal to the lowest value of the lower bound of the parameters’ 95% confidence interval (CI). A measure of functional impairment was included at the request of our expert stakeholders. Stakeholders felt incorporating functional impairment to a percentage of hearing health states better reflects reality.
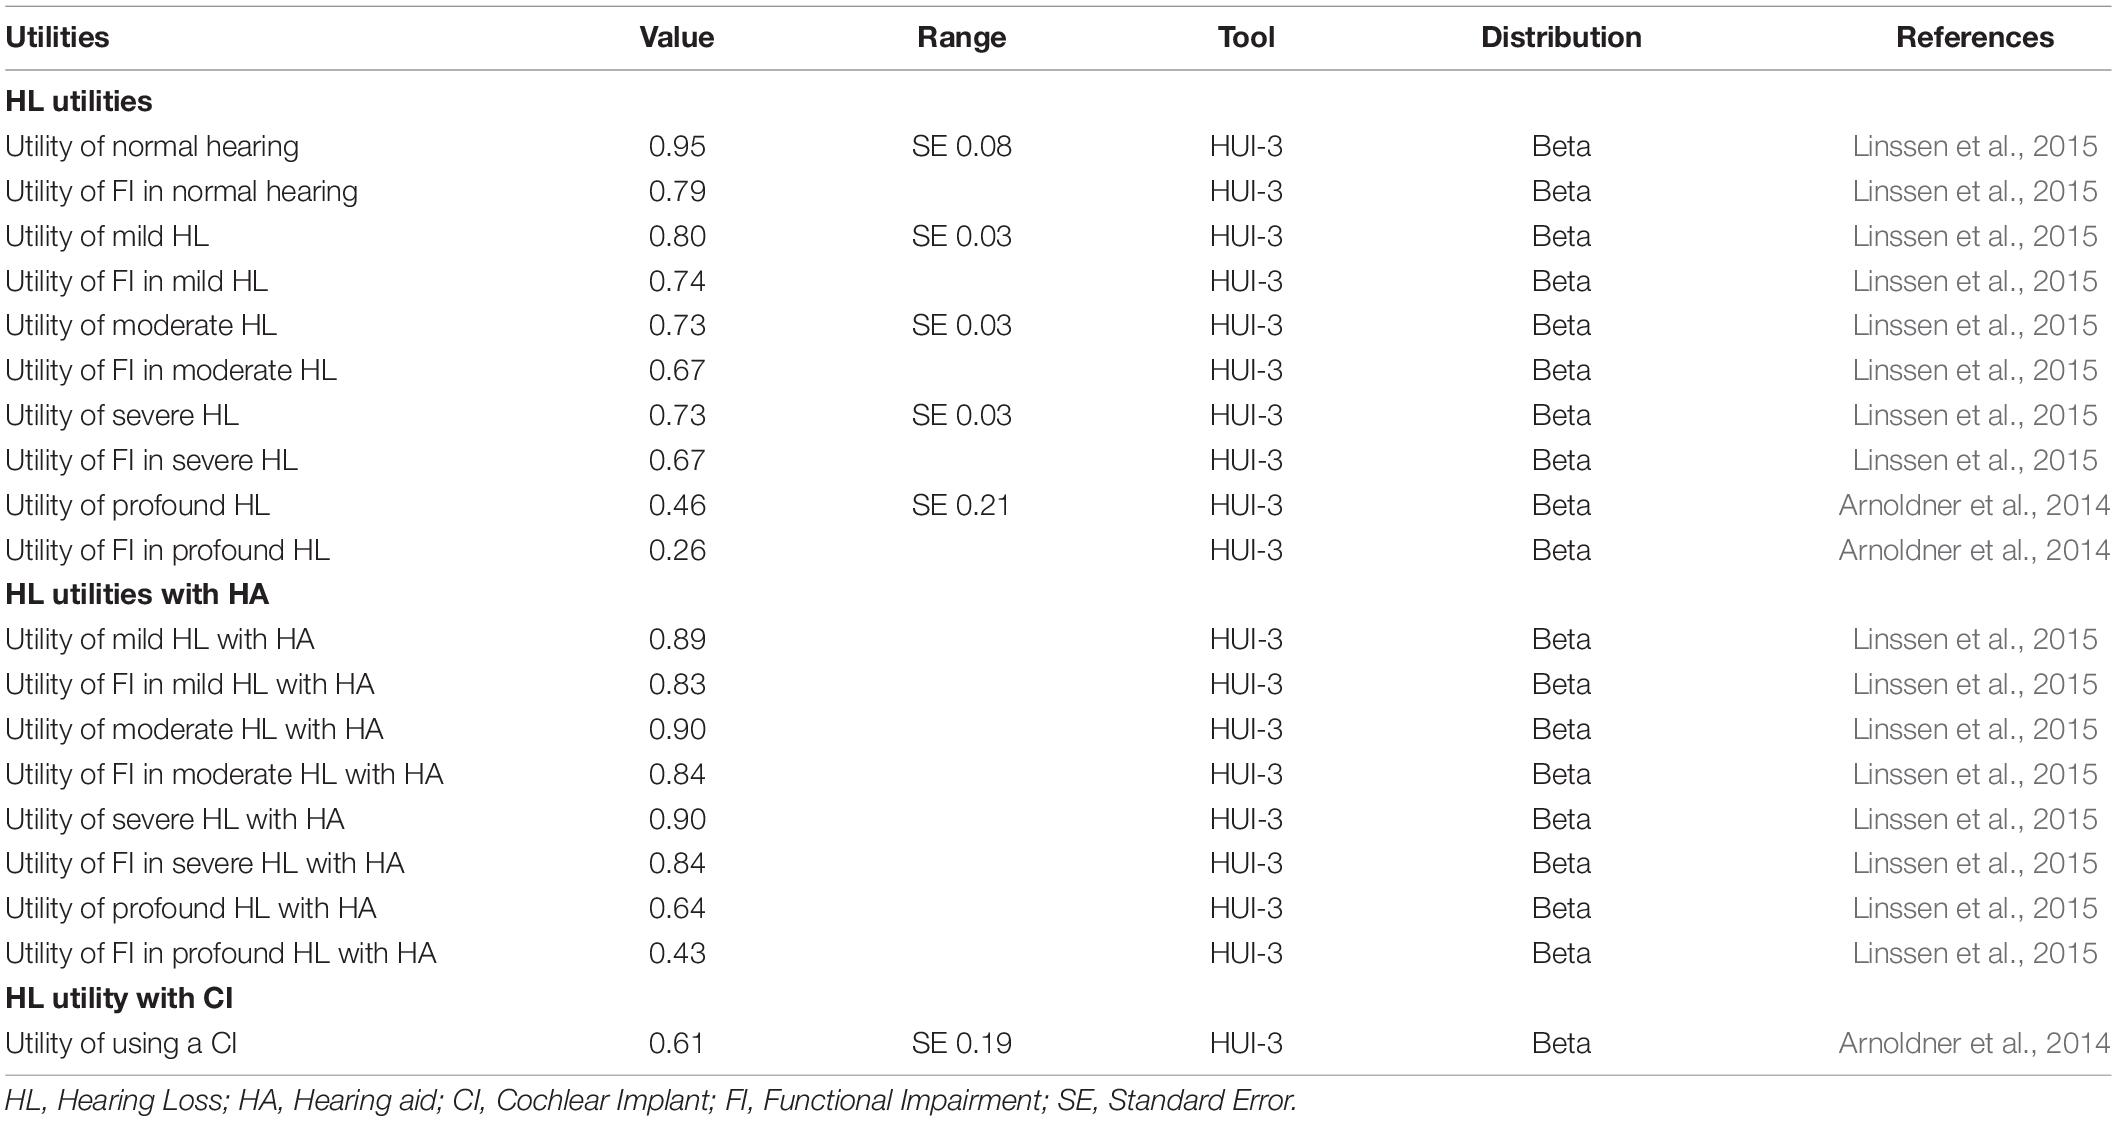
Table 2. Utilities.
Costs
Direct medical costs were assessed in 2018 Pounds (£) and adjusted for inflation using the consumer price inflation indices produced by the World Bank and the UK Office for National Statistics (SDC 7) (UK Office for National Statistics, 2018a; World Bank Group, 2018). Unit costs were derived from the literature, NHS reference cost databases, and institutional level costs from an NHS trust. SDC 8 contains a more in-depth breakdown of each unit cost. These cost estimates reflect what the NHS would cover and exclude any non-medical, opportunity, and patient incurred costs. Given the assumption that patients in the normal hearing health state are asymptomatic allows us to also assume that they will not incur any associated health care costs. Cost of the regenerative hearing therapy was set to be £0 for the headroom analysis. See Table 3 for all costs used in the model.
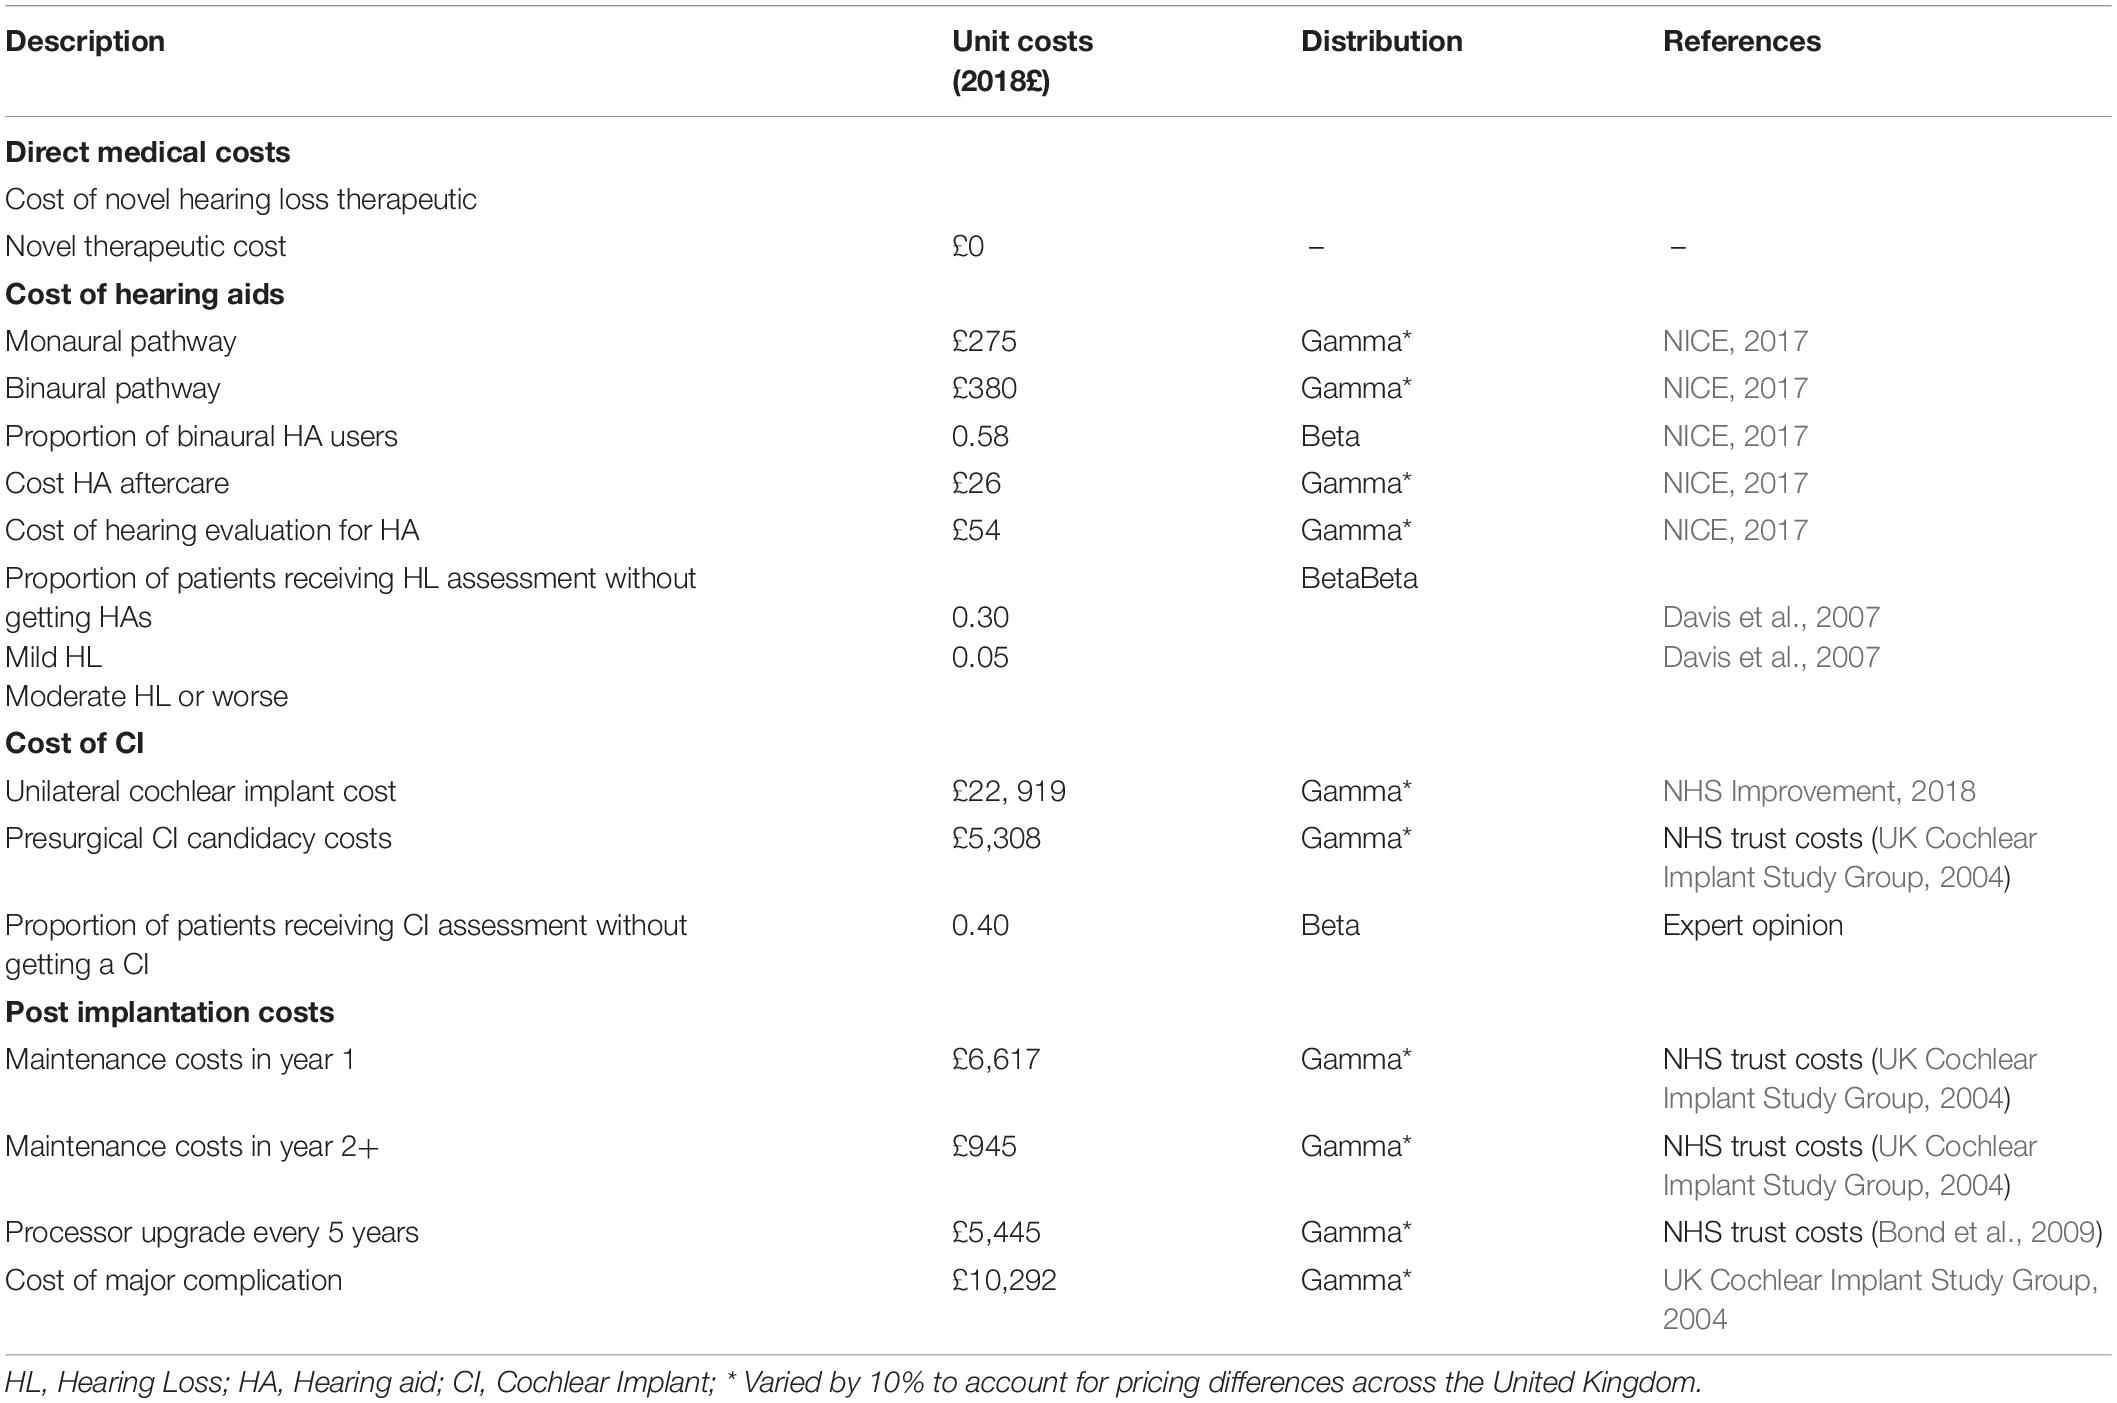
Table 3. Costs.
Analysis
A hypothetical cohort of 1,000 patients entered the model to determine the mean expected costs and effects (QALYs) per patient. Three different but related analyses were performed: (1) headroom analysis, (2) scenario analyses, and (3) threshold analyses. All results were obtained using probabilistic modeling.
The headroom analysis explored the maximum potential value of a novel regenerative therapeutic for ARHL. The headroom approach to therapeutic developments relies on the estimation of value-based price-ceilings. Such price-ceilings estimate the commercial opportunities for new products in health care systems (Girling et al., 2015). To delineate the ceiling-price, the initial scenario assumed that the therapeutic was 100% effective, meaning that all patients with any level of hearing loss returned to normal hearing (PTA: ≤25dB) and was delivered at no cost. Six scenario analyses were then developed to explore how more realistic scenarios influenced costs and effects: (1) limiting the therapeutic to different HL severities (all HL severities, only moderate HL or worse, only severe HL or worse, etc.) or (2) varying the degree of recovery (all recover to normal hearing, recovery by 1 health state such as recovering from severe to moderate HL or by 2 health states such as recovering from severe to mild HL, etc.). Threshold analysis was then used to determine the ceiling price of the novel therapeutics at different disease severities and levels of effectiveness.
Probabilistic sensitivity analyses (PSA) with 10,000 iterations were used to obtain results for all scenarios to account for uncertainty around parameter estimates (Baio and Dawid, 2015). See Tables 1–3 for distributions applied to each parameter. Given that ranges for costs were not explicitly stated in the literature, the gamma distributions were varied by 10% to account for pricing variations across the United Kingdom. 95% confidence intervals (95% CIs) of probabilistic results were calculated by the percentile method in Excel (Elias, 2015).
Results are presented in incremental net monetary benefits (iNMB). The iNMB represents the added value of an intervention compared to the current standard of care, in monetary terms. iNMB is calculated by using the following formula: iNMB = (QALYn × threshold value – Costsn) – (QALYc × threshold value – Costsc), where n = novel therapeutic, NICE threshold value = £20,000/QALY and, c = current treatment (NICE, 2017). Higher incremental NMBs equate to greater potential room for improvement. Positive iNMBs indicate that novel therapeutics are potentially cost-effective as compared to the standard of care pathway.
Results
Headroom Analysis
Table 4 summarizes the results of the headroom analysis and shows that total costs and QALYs per patient in the standard care pathway are £4,462 [£3,262–£5,663] and 15.59 [15.09–16.09], respectively. The total costs and QALYs per patient for a perfect novel hearing therapeutic strategy are £11 [£5–£17] and 16.37 [15.67–17.06], respectively. This yields potential savings of £4,451 [£3,254–£5,648] and QALY gains of 0.78 [0.37–1.19] per patient. The iNMB of a perfect, zero cost, novel regenerative hearing therapeutic in ARHL is £20,017 [£11,299–£28,737].
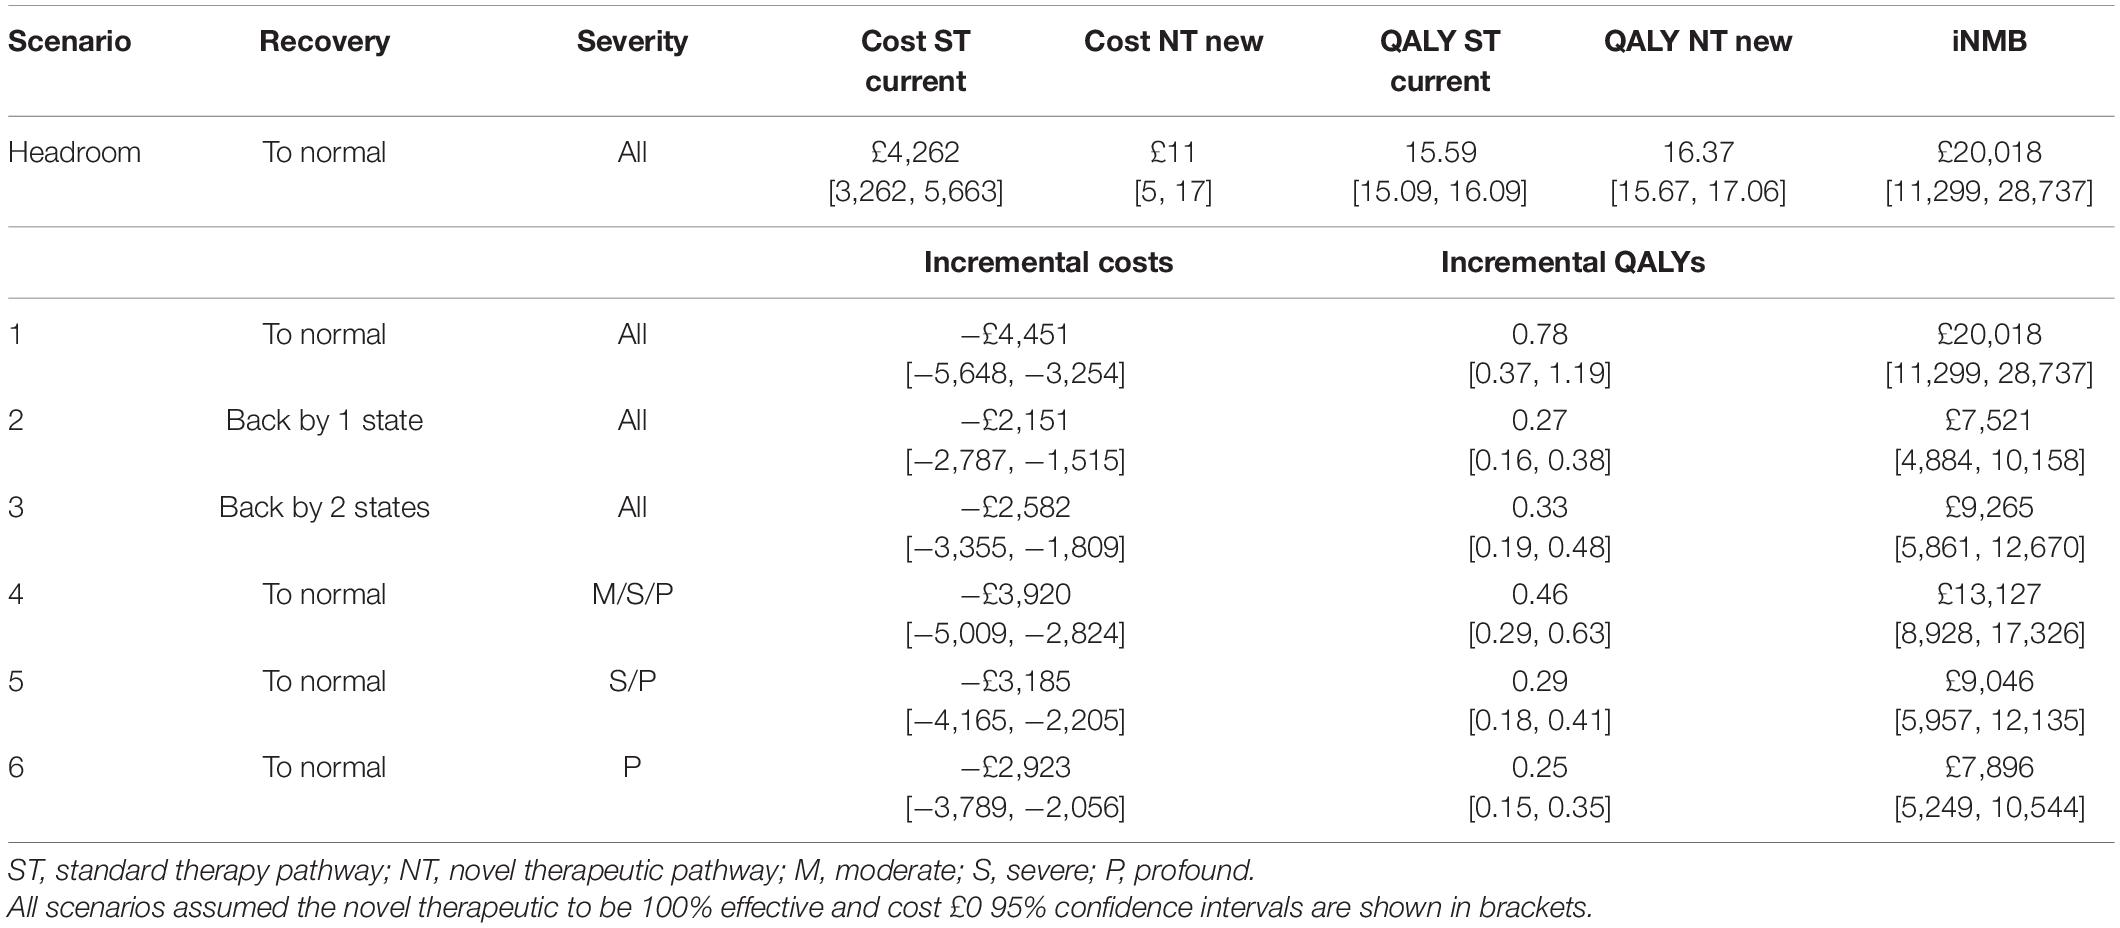
Table 4. Headroom and scenario analysis results.
Scenario Analyses
The results demonstrated that compared to the headroom scenario (scenario 1), changing the recovery rates by only one (scenario 2) or two (scenario 3) hearing health states lowers the iNMB to £7,521 [£4,884–£10,158] and £9,265 [£5,861–£12,670], respectively (Table 4). Since the assumed drug cost is zero due to the headroom scenario, limiting treatment to patients with more severe degrees of hearing loss (scenarios 4–6) decreased the iNMB, owing to the fact that only a subgroup of the model’s population had more severe forms of hearing loss. This resulted in only a proportion of the total population being treated in this scenario which decreased the overall QALY gains and resulted in less cost savings.
Threshold Analyses
The threshold analyses illustrate the ceiling prices of the novel regenerative hearing therapeutics with differing rates of effectiveness and hearing loss severities (Figures 2A–D). The lines in the graphs represent an iNMB of £0, identifying (1) the potential maximum price for each level of effectiveness, (2) the 95% confidence intervals, and (3) the average number of treatments given per person depending on the efficacy of the therapy. For example, if treatment is restricted to patients with moderate hearing loss or worse (Figure 2B), the ceiling price at an efficacy of 50% will be around £27,500/per person. See SDC 9 for a graphical comparison of threshold analyses results.
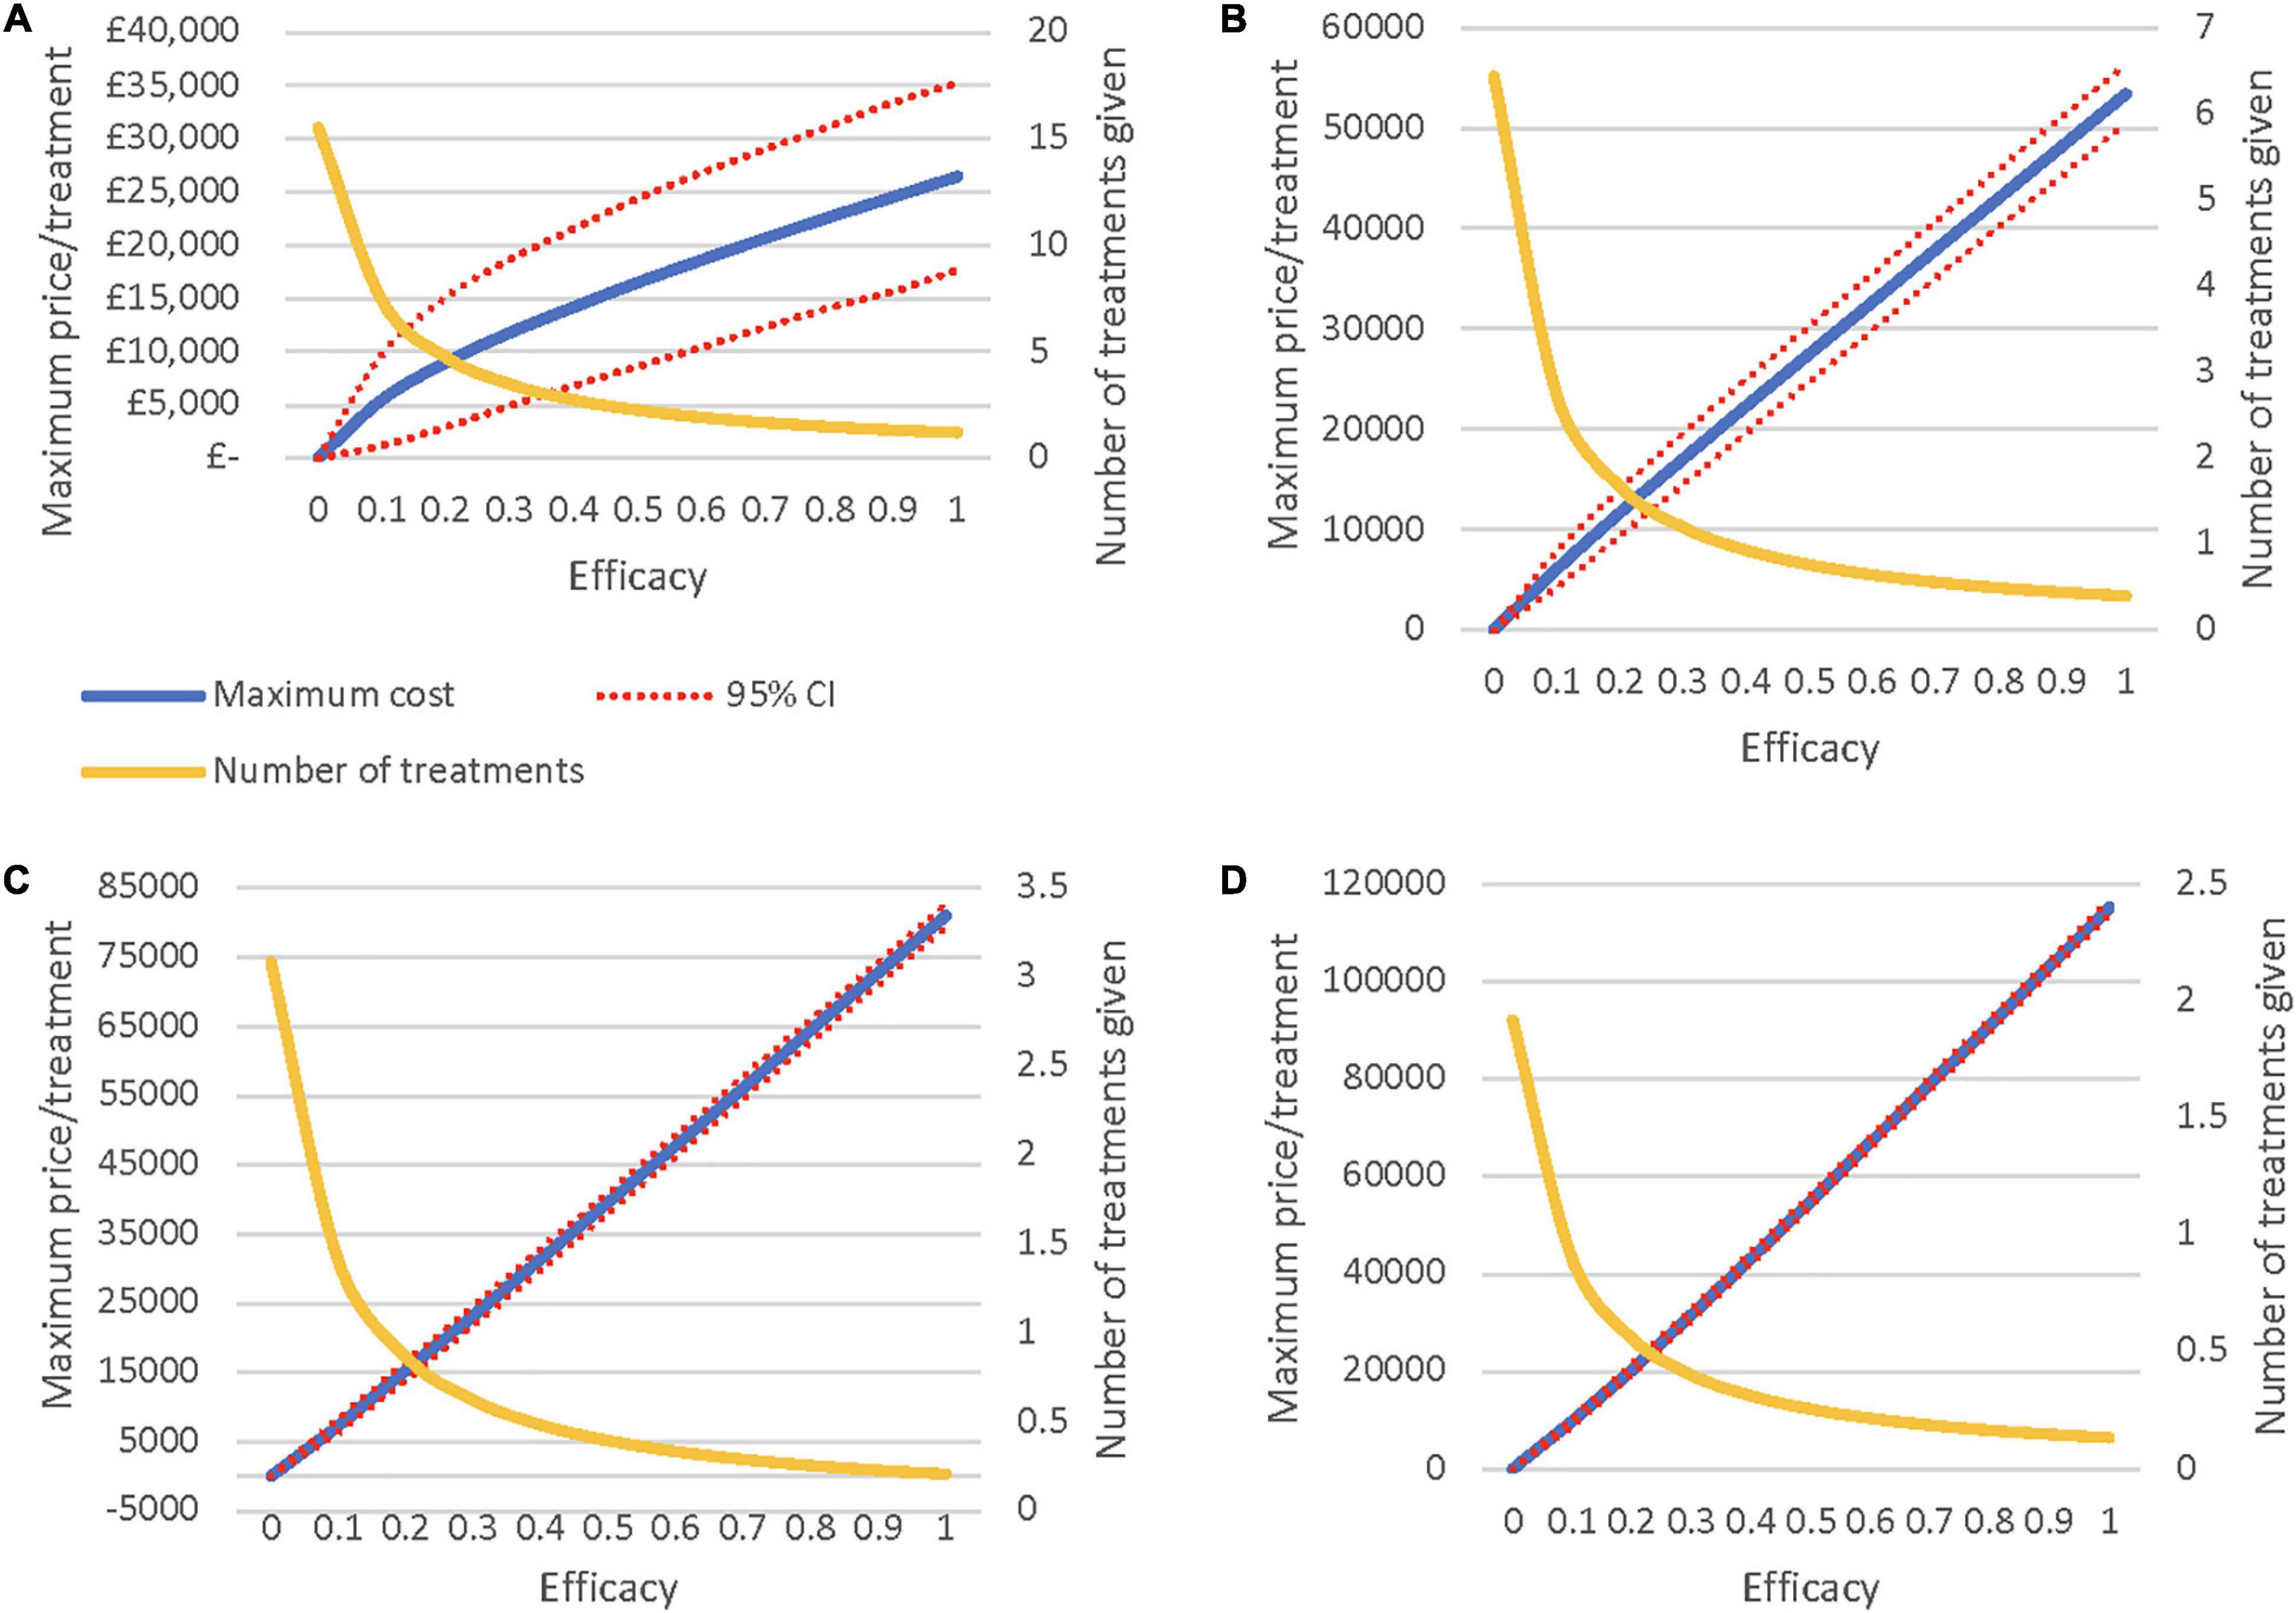
Figure 2. (A) Maximum Price when treating all severities of HL. (B) Maximum Price when treating moderate HL or worse. (C) Maximum Price when treating severe HL or worse. (D) Maximum Price when treating only profound HL.
Discussion
Summary of Key Findings
The headroom scenario yields an iNMB of £20,017 [£11,299–£28,737] compared to the current standard of care and show that novel regenerative hearing therapeutics have potential room for improvement in terms of both improved patient outcomes with QALY gains of 0.78 [0.37–1.19] and cost savings of £4,451 [£3,254–£5,648] per patient. Scenario analyses demonstrate that the iNMB increases with more effective therapeutics and more widespread eligibility criteria. Threshold analysis suggests that the ceiling price of the therapeutic is greater with severe forms of hearing loss compared to less severe states. Both scenario and threshold analyses demonstrate wide confidence intervals which reflects the uncertainty surrounding results.
Strengths
This study shows that there is significant potential room for improvement in the current standard care pathway for patients with ARHL and that novel regenerative hearing therapeutics could become cost-effective in the NHS. This model can be used by both industry and policy makers to evaluate: (1) the maximum price of a novel regenerative therapeutic in ARHL for different levels of effectiveness, (2) the minimum effectiveness required at each pricing target for the therapeutic to remain cost-effective, and (3) the impact of limiting treatment to certain subgroups of patients with hearing loss. Exploring the ceiling price of novel therapeutics at maximum efficacy will also allow pharmaceutical companies to perform feasibility estimates on the potential to recoup research and development (R&D) costs (IJzerman and Steuten, 2011; Markiewicz et al., 2016).
Given that one in five people in the United Kingdom are estimated to be affected by a hearing disorder by 2035, means that the implementation of novel hearing therapeutics will bring about substantial change to health systems (No author list, 2016). The development of this model, before a therapeutic has entered the market, will facilitate informed decision making and will increase the likelihood of developing cost-effective novel regenerative hearing therapeutics. As these novel hearing therapeutics enter into clinical trial, this research will help commissioners and policy makers to make difficult decisions on which therapeutics provide value for money are worth funding, thereby paving the way for revolutionary and urgently needed hearing therapeutics.
Limitations
Despite the robustness of our results to a variety of probabilistic sensitivity analyses, this study is subject to limitations; the first of which arises from our limited scientific understanding of ARHL. In addition to ARHL not being well understood, its association and interrelationship with age related neurocognitive decline further complicates our understanding. ARHL is not a single disease entity but a symptom of a range of underlying disease mechanisms and etiologies, resulting in an equal range of potential therapeutic targets within the inner ear and auditory pathways (Yamasoba et al., 2013; Nakagawa, 2014). As such there will be no single cure for hearing loss; in order to develop targeted therapeutics for hearing disorders in specific patient populations more detailed pheno-and genotyping of hearing loss patients will be required (Yang C. H. et al., 2015; Le Prell et al., 2016). For our model, this means that our results likely represent an overestimation of the target population with ARHL that will be eligible to receive and benefit from regenerative hearing therapeutics in the future. Despite these limitations, our model reflects our current understanding and uses the best available data on progression and utilities for ARHL.
Another limitation is that we did not include drug safety profiles for novel hearing therapeutics due to their hypothetical nature. This model assumes that along with being perfectly effective, the novel hearing therapies are free of adverse events which overestimates their potential added value. Finally, this study focused on direct medical costs incurred by the NHS and did not include indirect medical costs associated with hearing loss in either the standard of care or novel hearing therapeutic arms (NICE, 2017). This has likely led to an underestimation of the costs that NICE requires for decision making. Additionally, the PSA’s accuracy is inherently limited by the nature of modeling a hypothetical novel hearing therapeutic and by arbitrary variations in costs set at 10%.
Future Research
Consultation with our panel of expert stakeholders revealed strong support to move away from the classic classification of hearing loss using pure-tone averages to a classification scheme that incorporates functional impairment. Hearing in Noise Testing (HINT) was proposed as a potential solution moving forward. In order to construct new models using HINT, as opposed to pure-tone averages, further research will be required to delineate both ARHL transition probabilities and utilities in identified HINT states.
A growing body of evidence suggests that the use of EQ-5Ds, as recommended by NICE, may not be appropriate for all health conditions such as hearing disorders and vision loss due to the poor responsiveness of the measure to detect change (Longworth et al., 2014). Our review of the literature highlights the lack of consensus amongst studies on the best utility estimates to employ but did identify the HUI-3 as the most commonly used measure in health economic evaluations relating to hearing loss and was therefore employed in our model (Longworth et al., 2014; Yang Y. et al., 2015). To enhance comparability across studies, either the use of HUI-3s should be standardized or an EQ-5D ‘bolt-on’ for hearing should be incorporated to improve its sensitivity (Yang Y. et al., 2015).
Finally, this study not only has the capacity to inform current R&D decisions, but also to accelerate decisions in later stages of development once better therapeutic efficacy estimates have been established. As an increasing number of these therapeutics enter into clinical trials, it will be important to incorporate new evidence as it becomes available. This will improve the quality and reliability of the results, allowing for lifecycle HTA of the therapeutics. It will also be vital to conduct similar early health technology assessments in other therapeutic areas of hearing loss such as sudden sensorineural hearing loss and noise and drug induced hearing loss as the field expands (Hartz and John, 2008; Markiewicz et al., 2016; Mandavia et al., 2020).
Conclusion
This study presents the first early health economic model for regenerative hearing therapeutics in ARHL and demonstrates a large potential room for improvement in the current care pathway. Novel regenerative hearing therapeutics for ARHL could become cost-effective under current willingness-to-pay thresholds. This model can be used by policy makers and industry to support the development of cost-effective therapies with the largest potential to provide added value to society and will help accelerate the introduction of ground-breaking novel hearing therapeutics in the NHS and around the world.
Data Availability Statement
The original contributions presented in the study are included in the article/Supplementary Material, further inquiries can be directed to the corresponding author.
Ethics Statement
The studies involving human participants were reviewed and approved by the University College London Research Ethics Committee 12241/001. The patients/participants provided their written informed consent to participate in this study.
Author Contributions
EL designed, collected data, performed the modeling, and wrote the main manuscript. MS, MPS, and YH designed, collected data, performed the modeling, and provided interpretive analysis. RM, MR, and AS provided interpretive analysis and critical revisions. All authors discussed the results and implications and commented the manuscript at all stages.
Funding
Financial support was received by the National Institute of Health Research (NIHR) University College London Hospitals Biomedical Research Centre – Hearing Theme and the NIHR Collaboration for Leadership in Applied Health Research and Care (CLAHRC) North Thames.
Conflict of Interest
AS advises biotech and pharmaceutical companies in the hearing field on the design and delivery of clinical trials.
The remaining authors declare that the research was conducted in the absence of any commercial or financial relationships that could be construed as a potential conflict of interest.
Publisher’s Note
All claims expressed in this article are solely those of the authors and do not necessarily represent those of their affiliated organizations, or those of the publisher, the editors and the reviewers. Any product that may be evaluated in this article, or claim that may be made by its manufacturer, is not guaranteed or endorsed by the publisher.
Supplementary Material
The Supplementary Material for this article can be found online at: https://www.frontiersin.org/articles/10.3389/fnins.2022.769983/full#supplementary-material
References
Arnoldner, C., Lin, V. Y., Honeder, C., Shipp, D., Nedzelski, J., and Chen, J. (2014). Ten-year health-related quality of life in cochlear implant recipients. Laryngoscope 124, 278–282. doi: 10.1002/lary.24387
Baio, G., and Dawid, A. P. (2015). Probabilistic sensitivity analysis in health economics. Stat. Methods Med. Res. 24, 615–634. doi: 10.1177/0962280211419832
Blevins, N. (2018). Presbycusis. Presbycusis - Up to Date. Available online at: https://www.uptodate.com/contents/presbycusis (accessed February 19, 2020).
Bond, M., Mealing, S., Anderson, R., et al. (2009a). The effectiveness and cost-effectiveness of cochlear implants for severe to profound deafness in children and adults: a systematic review and economic model. Health Technol. Assess. 13, 1–330. doi: 10.3310/hta13440
Chao, T.-K., and Chen, T. H.-H. (2008). Cost-effectiveness of hearing aids in the hearing-impaired elderly. Otol. Neurotol. 29, 776–783. doi: 10.1097/MAO.0b013e31817e5d1b
Choi, J. S., Betz, J., Deal, J., Contrera, K. J., Genther, D. J., Chen, D. S., et al. (2016). A comparison of self-report and audiometric measures of hearing and their associations with functional outcomes in older adults. J. Aging Health 28, 890–910. doi: 10.1177/0898264315614006
Contrera, K. J., Betz, J., Genther, D. J., and Lin, F. R. (2015). Association of hearing impairment and mortality in the national health and nutrition examination survey. JAMA Otolaryngol. Neck Surg. 141, 944–946. doi: 10.1001/jamaoto.2015.1762
Davis, A., Smith, P., Ferguson, M., Stephens, D., and Gianopoulos, I. (2007). Acceptability, benefit and costs of early screening for hearing disability: a study of potential screening tests and models. Health Technol. Assess. 11, 1–294. doi: 10.3310/hta11420
EuroTrak (2018). EUROTRAK UK 2018. Available online at: https://www.bihima.com/wp-content/uploads/2018/05/EuroTrack_2018_BIHIMAConf_FINAL.pdf (accessed August 1, 2018).
Elias, C. J. (2015). Percentile and percentile-t bootstrap confidence intervals: a practical comparison. J. Econ. Methods 4, 153–161. doi: 10.1515/JEM-2013-0015
Farinetti, A., Ben Gharbia, D., Mancini, J., Roman, S., Nicollas, R., and Triglia, J.-M. (2014). Cochlear implant complications in 403 patients: comparative study of adults and children and review of the literature. Eur. Ann. Otorhinolaryngol. Head Neck Dis. 131, 177–182. doi: 10.1016/j.anorl.2013.05.005
Fielden, C. A., and Kitterick, P. T. (2016). Contralateral acoustic hearing aid use in adult unilateral cochlear implant recipients: current provision, practice, and clinical experience in the UK. Cochlear Implants Int. 17, 132–145. doi: 10.1080/14670100.2016.1162382
Fisher, D., Li, C. M., Chiu, M. S., et al. (2014). Impairments in hearing and vision impact on mortality in older people: the AGES-reykjavik study. Age Ageing 43, 69–76. doi: 10.1093/ageing/aft122
Girling, A., Lilford, R., Cole, A., and Young, T. (2015). HEADROOM APPROACH TO DEVICE DEVELOPMENT: CURRENT AND FUTURE DIRECTIONS. Int. J. Technol. Assess. Health Care 31, 331–338. doi: 10.1017/S0266462315000501
Hartz, S., and John, J. (2008). Contribution of economic evaluation to decision making in early phases of product development: a methodological and empirical review. Int. J. Technol. Assess. Health Care 24, 465–472. doi: 10.1017/S0266462308080616
IJzerman, M. J., and Steuten, L. M. G. (2011). Early assessment of medical technologies to inform product development and market access. Appl. Health Econ. Health Policy 9, 331–347. doi: 10.2165/11593380-000000000-00000
Le Prell, C. G., Lobarinas, E., Popper, A. N., and Fay, R. R. (eds) (2016). Translational Research in Audiology, Neurotology, and the Hearing Sciences. Cham: Springer.
Li, V. (2017). BioCentury - Ears Wide Open. Available online at: https://www.biocentury.com/biocentury/product-development/2017-06-02/how-hearing-loss-became-investable-space (accessed March 11, 2018).
Lin, F. R., and Albert, M. (2014). Hearing loss and dementia - Who is listening? Aging Ment. Health 18, 671–673. doi: 10.1080/13607863.2014.915924
Linssen, A. M., Anteunis, L. J. C., and Joore, M. A. (2015). The cost-effectiveness of different hearing screening strategies for 50- to 70-year-old adults: a markov model. Value Health 18, 560–569. doi: 10.1016/j.jval.2015.03.1789
Longworth, L., Yang, Y., Young, T., et al. (2014). Use of generic and condition-specific measures of health-related quality of life in NICE decision-making: a systematic review, statistical modelling and survey. Health Technol. Assess. 18, 1–224. doi: 10.3310/hta18090
Mandavia, R., Horstink, Y. M., Grutters, J. P. C., et al. (2020). The potential added value of novel hearing therapeutics: an early health economic model for hearing loss. Otol. Neurotol. 41, 1033–1041. doi: 10.1097/MAO.0000000000002744
Markiewicz, K., van Til, J. A., Steuten, L. M. G., and IJzerman, M. J. (2016). Commercial viability of medical devices using Headroom and return on investment calculation. Technol. Forecast. Soc. Change 112, 338–346. doi: 10.1016/J.TECHFORE.2016.07.041
Mathers, C., Smith, A., and Concha, M. (2000). Global Burden of Hearing Loss in the Year 2000. Geneva: World Health Organization.
McCormack, A., and Fortnum, H. (2013). Why do people fitted with hearing aids not wear them? Int. J. Audiol. 52, 360–368. doi: 10.3109/14992027.2013.769066
Nakagawa, T. (2014). Strategies for developing novel therapeutics for sensorineural hearing loss. Front. Pharmacol. 5:206. doi: 10.3389/fphar.2014.00206
National Institute for Health and Clinical Excellence (2008). Guide to the Methods of Technology Appraisal. Available online at: www.nice.org.uk (accessed April, 2013).
No author list (2016). Hearing loss: an important global health concern. Lancet 387:2351. doi: 10.1016/S0140-6736(16)30777-2
NHS (2017). NHS- Binaural Hearing Aid Estimate. https://www.england.nhs.uk/wp-content/uploads/./HLCF-Service-Spec-CP-CR.docx
NHS Improvement (2018). Copy of Annex_A_-_National_tariff_workbook. https://nhsicorporatesite.blob.core.windows.net/green/uploads/documents/2017-18_and_2018-19_National_Tariff_Payment_System.pdf
NICE (2007). NICE Health Technology Appraisal. Available online at: https://www.nice.org.uk/guidance/ta166/documents/joint-submission-from-the-british-academy-of-audiology-baa-the-british-cochlear-implant-group-bcig-and-entuk2 (accessed August 1, 2018).
NICE (2017). The Guidelines Manual | Guidance and Guidelines | NICE. Available online at: https://www.nice.org.uk/process/pmg6/chapter/assessing-cost-effectiveness (accessed March 1, 2018).
Roberts, M., Russell, L. B., David Paltiel, A., Chambers, M., McEwan, P., and Krahn, M. (2012). Conceptualizing a model: a report of the ISPOR-SMDM Modeling Good Research Practices Task Force-2. Value Health 15, 804–811. doi: 10.1016/j.jval.2012.06.016
Schilder, A. G. M., Blackshaw, H., Lenarz, T., Warnecke, A., Lustig, L. R., and Staecker, H. (2018). Biological therapies of the inner ear. Otol. Neurotol. 39, 135–137. doi: 10.1097/MAO.0000000000001689
Schilder, A. G. M., Su, M. P., Mandavia, R., et al. (2019). Early phase trials of novel hearing therapeutics: avenues and opportunities. Hear. Res. 380, 175–186. doi: 10.1016/j.heares.2019.07.003
Schubert, C. R., Fischer, M. E., Pinto, A. A., et al. (2016). Sensory impairments and risk of mortality in older adults. J. Gerontol. Ser. A Biol. Sci. Med. Sci. 75:glw036. doi: 10.1093/gerona/glw036
Stamatiou, G., Kyrodimos, E., and Sismanis, A. (2011). Complications of cochlear implantation in adults. Ann. Otol. Rhinol. Laryngol. 120, 428–432. doi: 10.1177/000348941112000702
UK Cochlear Implant Study Group (2004). Criteria of candidacy for unilateral cochlear implantation in postlingually deafened adults II: cost-effectiveness analysis. Ear Hear. 25, 336–360. doi: 10.1097/01.aud.0000134550.80305.04
UK Office for National Statistics (2018b). Deaths - Office for National Statistics. Available online at: https://www.ons.gov.uk/peoplepopulationandcommunity/birthsdeathsandmarriages/deaths (accessed March 1, 2018.
UK Office for National Statistics (2018a). Consumer Price Inflation, UK - Office for National Statistics. Available online at: https://www.ons.gov.uk/economy/inflationandpriceindices/bulletins/consumerpriceinflation/may2018 (accessed August 1, 2018).
Vemer, P., Corro Ramos, I., van Voorn, G. A. K., Al, M. J., and Feenstra, T. L. (2016). AdViSHE: a validation-assessment tool of health-economic models for decision makers and model users. Pharmacoeconomics 34, 349–361. doi: 10.1007/s40273-015-0327-2
WHO (2018). WHO | Deafness and Hearing Loss. Available online at: http://www.who.int/mediacentre/factsheets/fs300/en/ (accessed March 11, 2018).
World Bank Group (2018). Inflation Consumer Prices (Annual %) | Data. Available online at: https://data.worldbank.org/indicator/FP.CPI.TOTL.ZG?locations=GB (accessed August 1, 2018).
Yamasoba, T., Lin, F. R., Someya, S., Kashio, A., Sakamoto, T., and Kondo, K. (2013). Current concepts in age-related hearing loss: epidemiology and mechanistic pathways. Hear Res. 303, 30–38. doi: 10.1016/j.heares.2013.01.021
Yang, C.-H., Schrepfer, T., and Schacht, J. (2015). Age-related hearing impairment and the triad of acquired hearing loss. Front. Cell. Neurosci. 9:276. doi: 10.3389/fncel.2015.00276
Keywords: Early HTA, novel hearing therapeutics, regenerative hearing therapeutics, age-related hearing loss, hearing loss
Citation: Landry EC, Scholte M, Su MP, Horstink Y, Mandavia R, Rovers MM and Schilder AGM (2022) Early Health Economic Modeling of Novel Therapeutics in Age-Related Hearing Loss. Front. Neurosci. 16:769983. doi: 10.3389/fnins.2022.769983
Received: 03 September 2021; Accepted: 31 January 2022;
Published: 04 March 2022.
Edited by:
Athanasia Warnecke, Hannover Medical School, GermanyReviewed by:
Janet Bouttell, University of Glasgow, United KingdomBrian McKinnon, University of Texas Medical Branch at Galveston, United States
Copyright © 2022 Landry, Scholte, Su, Horstink, Mandavia, Rovers and Schilder. This is an open-access article distributed under the terms of the Creative Commons Attribution License (CC BY). The use, distribution or reproduction in other forums is permitted, provided the original author(s) and the copyright owner(s) are credited and that the original publication in this journal is cited, in accordance with accepted academic practice. No use, distribution or reproduction is permitted which does not comply with these terms.
*Correspondence: Anne G. M. Schilder, YS5zY2hpbGRlckB1Y2wuYWMudWs=