 Chung-Man Moon1†Yun Young Lee2†Ki-Eun Hyeong3Woong Yoon2,4Byung Hyun Baek2,4Suk-Hee Heo4,5
 Sang-Soo Shin2,4*
 Seul Kee Kim4,5*
- 1Research Institute of Medical Sciences, Chonnam National University, Gwangju, Republic of Korea
- 2Department of Radiology, Chonnam National University Hospital, Gwangju, Republic of Korea
- 3Neurozen Inc., Seoul, Republic of Korea
- 4Department of Radiology, Chonnam National University Medical School, Gwangju, Republic of Korea
- 5Department of Radiology, Chonnam National University Hwasun Hospital, Hwasun, Republic of Korea
Purpose: To develop and validate deep learning-based automatic brain segmentation for East Asians with comparison to data for healthy controls from Freesurfer based on a ground truth.
Methods: A total of 30 healthy participants were enrolled and underwent T1-weighted magnetic resonance imaging (MRI) using a 3-tesla MRI system. Our Neuro I software was developed based on a three-dimensional convolutional neural networks (CNNs)-based, deep-learning algorithm, which was trained using data for 776 healthy Koreans with normal cognition. Dice coefficient (D) was calculated for each brain segment and compared with control data by paired t-test. The inter-method reliability was assessed by intraclass correlation coefficient (ICC) and effect size. Pearson correlation analysis was applied to assess the relationship between D values for each method and participant ages.
Results: The D values obtained from Freesurfer (ver6.0) were significantly lower than those from Neuro I. The histogram of the Freesurfer results showed remarkable differences in the distribution of D values from Neuro I. Overall, D values obtained by Freesurfer and Neuro I showed positive correlations, but the slopes and intercepts were significantly different. It was showed the largest effect sizes ranged 1.07–3.22, and ICC also showed significantly poor to moderate correlations between the two methods (0.498 ≤ ICC ≤ 0.688). For Neuro I, D values resulted in reduced residuals when fitting data to a line of best fit, and indicated consistent values corresponding to each age, even in young and older adults.
Conclusion: Freesurfer and Neuro I were not equivalent when compared to a ground truth, where Neuro I exhibited higher performance. We suggest that Neuro I is a useful alternative for the assessment of the brain volume.
1. Introduction
Quantitative regional brain volumetry in humans is of great importance in clinical practice for evaluating various neurologic diseases (Heo et al., 2022), and developmental or behavioral conditions arising from normal aging (Zhao et al., 2019). Previous brain magnetic resonance imaging (MRI) studies (Zhao et al., 2019; Heo et al., 2022) have been widely applied to quantify the volume, thickness, and other morphometrics of specific brain structures. In MRI-based volumetry methods, accurate brain segmentation with a short data-processing period, such as 5-10 min, is necessary to obtain precise quantitative values of brain volume and cortical thickness, especially in large datasets (Tustison et al., 2014).
In volumetric neuroimaging studies, segmentation of brain anatomy has been a key image- processing step (Srinivasan et al., 2020). Traditionally, manual segmentation was considered the gold standard approach for brain tissue measurement (Morey et al., 2009; Schoemaker et al., 2016); however this method is subjective, extremely time-consuming, laborious, and human-resource intensive, and thus unfeasible for large MRI datasets (Perlaki et al., 2017). Currently available algorithms have low clinical feasibility because of the long processing time for brain segmentation (Suh et al., 2020). Also, the major practical limitation of prior studies is incomplete segmentation of the brain into finer anatomic regions when using widely available tools such as Freesurfer (Kaku et al., 2019). Indeed, there are substantial challenges regarding how to obtain accurate segmentation of finer brain regions in a small brain size (Kaku et al., 2019). As such, automatic segmentation algorithms and software packages developed to label parts of brain MR images could drastically reduce processing time, enabling the analysis of large amounts of data, and could remove potential sources of inconsistency between sites (Velasco-Annis et al., 2018; Srinivasan et al., 2020). Recently, deep learning techniques, including convolutional neural networks (CNNs), have been employed predominantly for rapid and accurate segmentation of coarse regions of interest (ROIs) in the analysis of medical imaging data, and for reducing the long-term performance of computation (Bae et al., 2020; Thyreau and Taki, 2020). Another issue raised is that it may not be directly applicable to brain segmentation in East Asian individuals regarding data processing time and accuracy, because deep learning models were generally based on Caucasian brains.
Our clinical volumetry software program, Neuro I (Neurozen Inc., Seoul, Republic of Korea), was recently introduced to the neuroscience community; this program uses a three-dimensional (3D) CNN-based deep learning algorithm and is approved by the Food and Drug Administration (FDA) of Republic of Korea. Especially in this tool, 3D CNN-based deep learning algorithm was trained using 776 healthy Korean individuals with normal cognition to focus on the East Asian brain; which can generate 109 ROIs based on the Desikan-Killiany-Tourville (DKT) atlas. Unlike other clinical volumetry software, Neuro I also uses a deep learning segmentation module to increase accuracy of brain tissue extraction from non-brain structures, and to improve classification of brain tissues as white matter parcellation without manual correction. To our knowledge, evidence for the effect of deep learning automatic brain segmentation based on T1-weighted brain MR images using data from East Asians is limited. Also, there have been several methodological studies looking at the effects of different image segmentation strategies by comparing differences between software packages, but there were few studies with a manual gold standard considered as a ground truth (Grimm et al., 2015).
Here, we provide an exemplary comparison of Neuro I with Freesurfer (version 6.0), which is one of the most widely used automated segmentation methods among existing freely available tools (Pemberton et al., 2021). We hypothesized that the two different software packages use different segmentation procedures and are likely to produce different values.
Therefore, in this study, we aimed to compare subcortical volume measurements from the two software packages with a ground truth in healthy individuals, and to evaluate the inter-method reliability and correlation with ages.
2. Materials and methods
2.1. Study population
This study received Institutional Review Board approval, and the requirement for informed consent was waived due to the retrospective nature of the study. We searched the imaging database for 65 healthy individuals who underwent brain MRI at a university hospital between June 1, 2020 and November 30, 2021. The inclusion criterion for healthy controls was no clinical evidence of neurological or psychiatric symptoms, as evaluated by a physician. In total, 30 healthy individuals were included: 12 males and 18 females; age range, 30–77 years; mean age, 53.62 ± 13.52 years; bodyweight 60.58 ± 10.08 kg; and height 162.45 ± 8.33 cm.
2.2. MRI
All participants were scanned with a 3-tesla MRI scanner (Siemens, Erlangen, Germany) with a 12-channel head coil. High-resolution T1-weighted images were acquired using the MPRAGE sequence with the following parameters: repetition time/echo time = 2,530/3.37 ms; field-of-view = 256 mm × 256 mm; matrix = 256 × 256; and slice thickness = 1 mm. All MRI images were visually inspected by an experienced neuroradiologist to confirm appropriate image quality and to exclude individuals with visible brain abnormalities.
2.3. Magnetic resonance volumetry
Each volumetric T1-weighted image was used separately for analysis with two different software packages on a conventional desktop computer. For concision, not all brain structures were analyzed in this study. Both software packages provided volumes for the left and right hippocampus, amygdala, entorhinal cortex, inferior temporal gyrus, and middle temporal gyrus, which is not only of interest because its volume change reflects physiologic processes but it might also gain clinical significance as a neuroimaging biomarker for the main cognitive impairment and prognostic evaluation of Alzheimer’s disease (AD) (Onitsuka et al., 2004; Grimm et al., 2015; Zhou et al., 2016). Each of the regional volume measures was averaged across left and right hemispheres.
2.3.1. Manual segmentation
To generate the ground truth for evaluating segmentation using ITK-SNAP version 3.8.0, a neuroradiologist with 20 years of dedicated experience in human brain MRI data processing and segmentation manually traced the all ROIs for the 30 participants; the scans had sufficient quality to allow manual tracing on gapless coronal slices following a detailed anatomic tracing protocol such as the DKT labeling protocol introduced in the Mindboggle publication (Klein and Tourville, 2012).
2.3.2. Volumetric procedures
FreeSurfer 6.0 (Harvard University, Boston, MA, USA) was used to analyze structural MRI data according to procedures described in prior publications (Dale et al., 1999). Data were post-processed using the “recon-all” script to produce fully segmented regions. The processing requires approximately 8 h per 3D T1-weighted image. The volume measures of the ROIs were derived from the standard stats directory using the Desikan atlas.
Neuro I used a deep learning algorithm applied to multiple steps, such as analysis-failure prediction, intensity normalization, brain extraction, and segmentation. Values for the volumes of regional brain structures and cortical thickness were obtained (Figure 1). All processing was completed within 10 min.
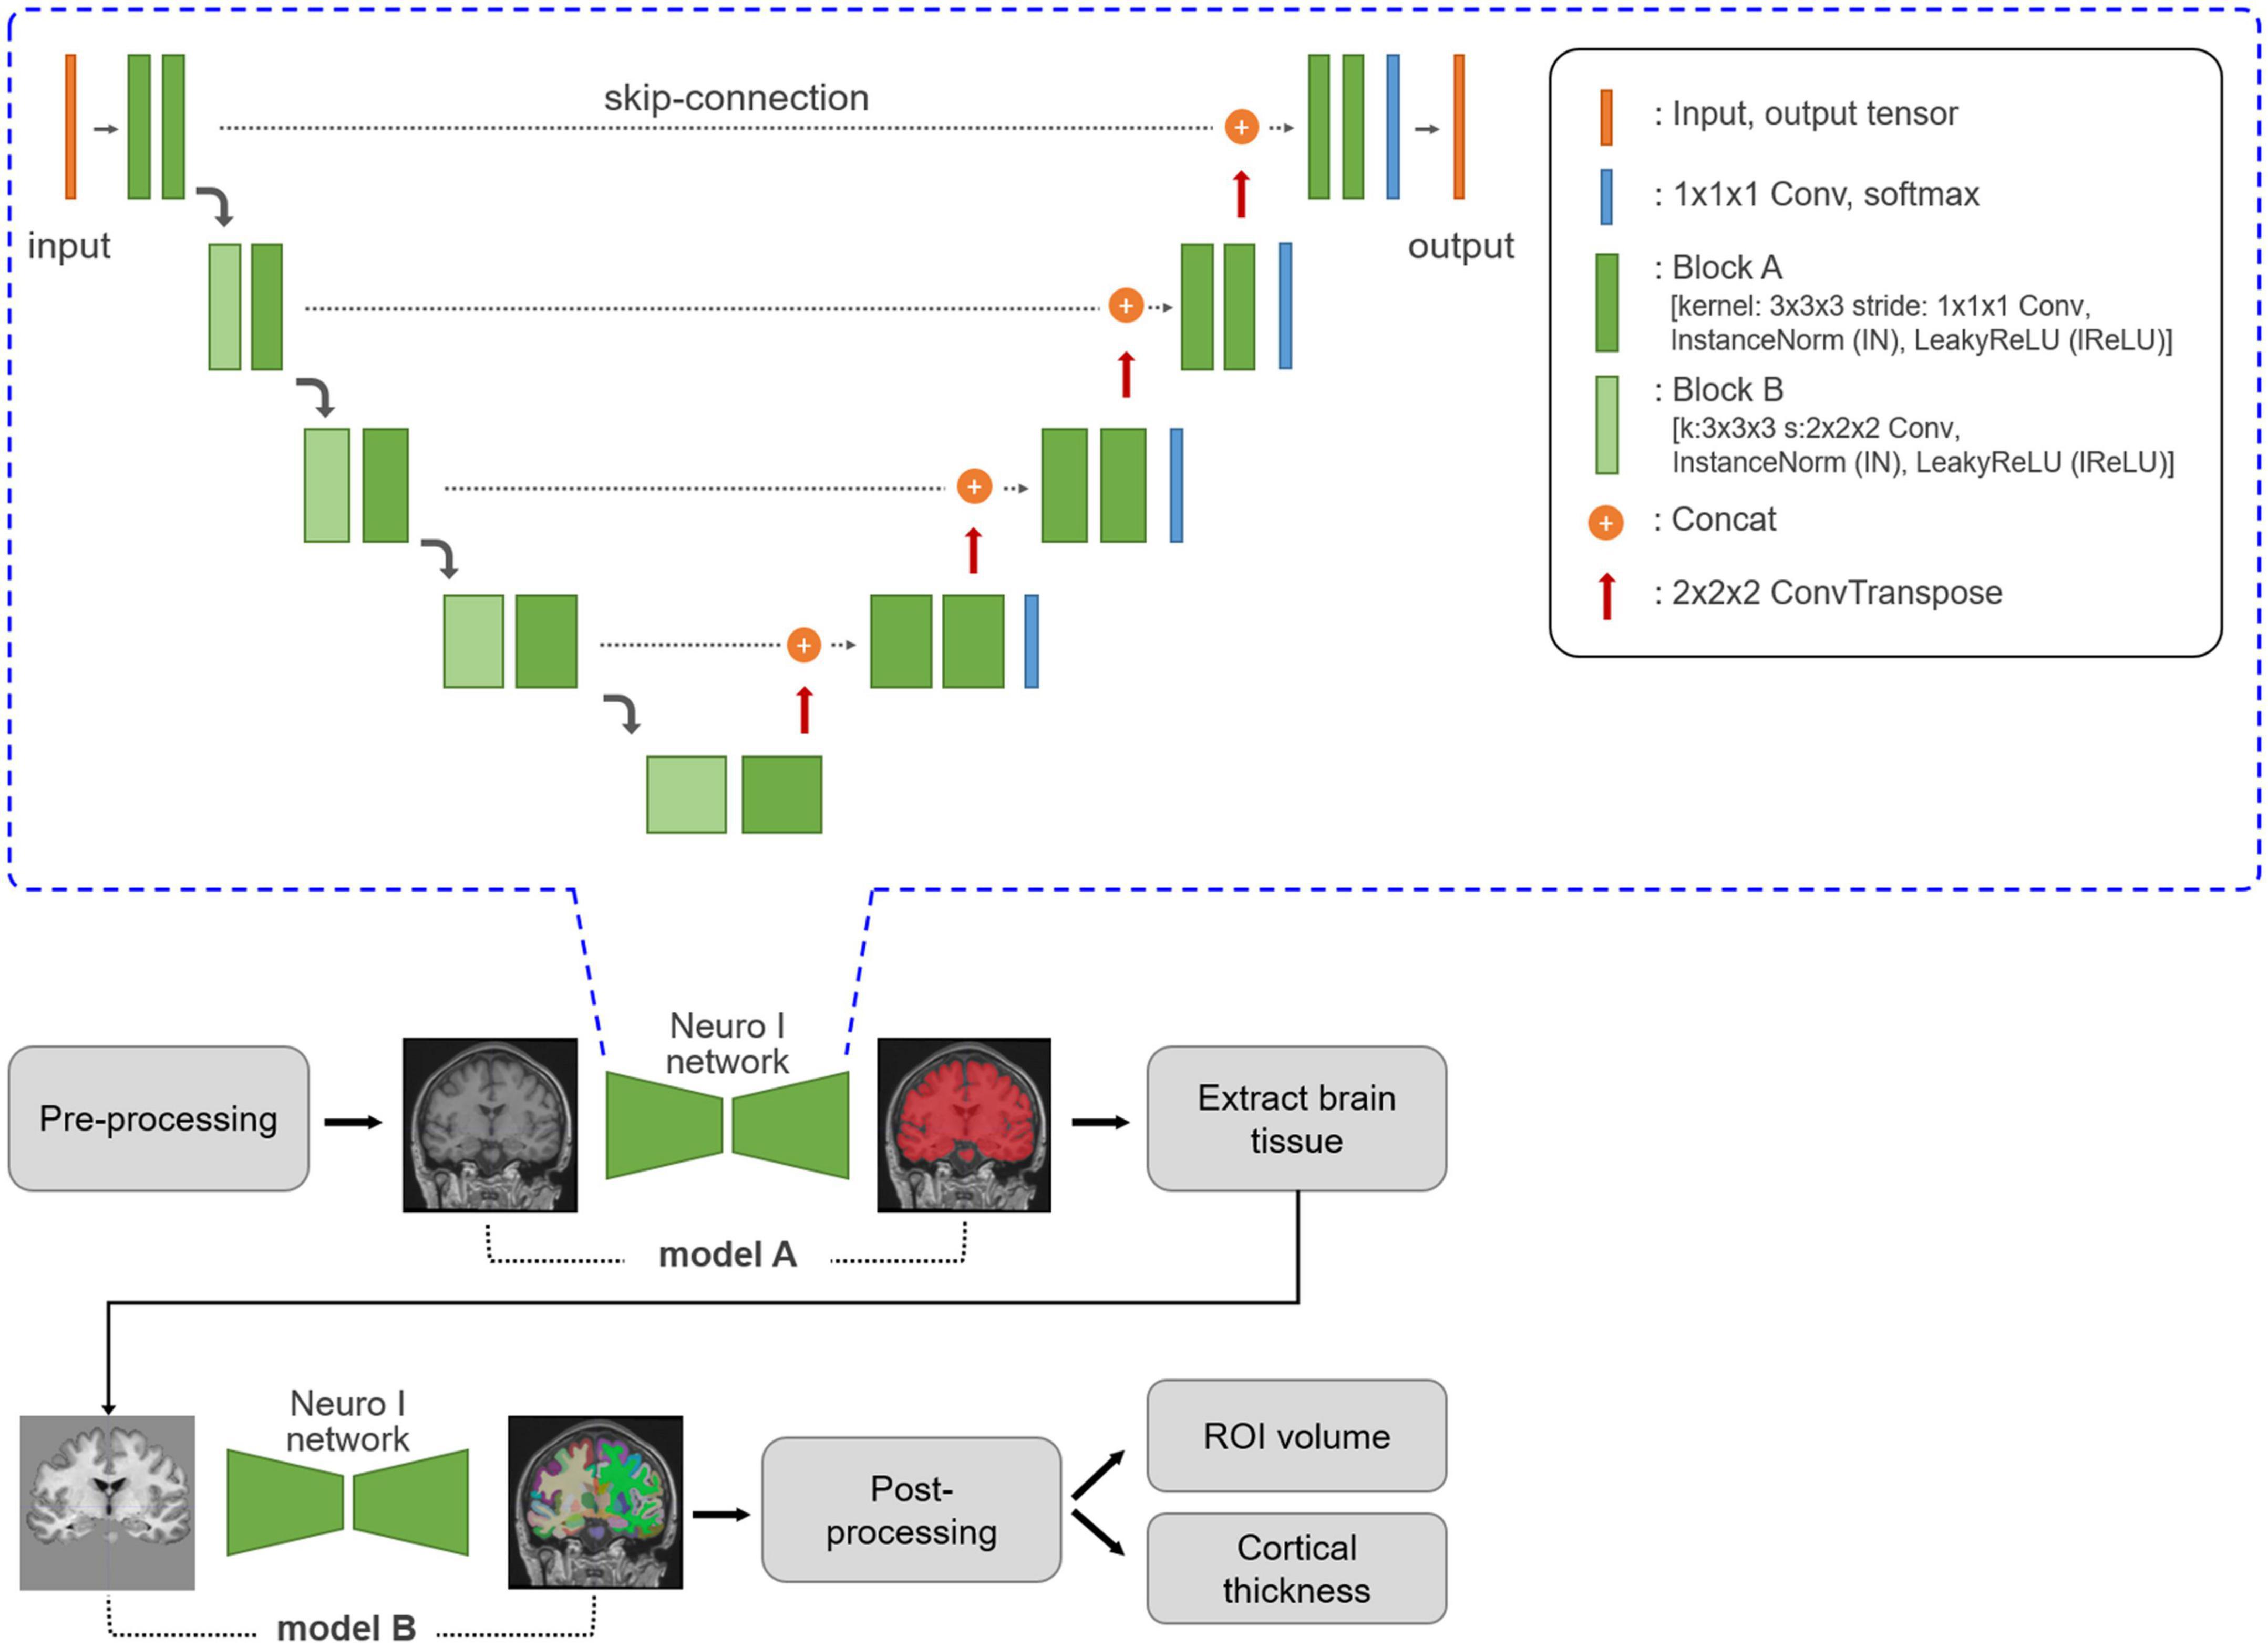
Figure 1. Neuro I process and network architecture. Three-dimensional T1-weighted MR images are subjected to MRI pre-processing, including registration and normalization. Based on empiric results showing good performance in our dataset, the Neuro I pipeline is constructed with two separate models. The first model, A, is a model for brain tissue segmentation. Using a mask from this model, sequentially after removing the intracranial volume, brain tissue is extracted from the original T1-weighted MR image to focus on classifying ROI types in brain tissue by removing non-targeted voxel classes. Model B extracts 109 brain ROIs by performing parcellation. Then, the volume and cortical thickness (mm) for each ROI are calculated. The Neuro I network is the common network structure of the two deep learning models included in the Neuro I software. The two models differ only in the shape of the input and output tensors. The above architecture is the same as that of nnU-Net (Isensee et al., 2021), but some hyperparameters and the learning process are customized because nnU-Net pipeline should be adapted to our model environment such as patch size, and GPU memory available when inputting brain MRI datasets.
2.4. Statistical analyses
Spatial overlap (Dice coefficient, D) for each ROI was calculated between the different segmentations and a ground truth according to the following equations:
where A is the segmented voxels by two different methods, B is the voxels of a ground truth, and ∩ is the intersection operation. The maximal value of D is 1, indicating perfect overlap between the two segmentations, while decreasing D indicates less overlap.
Data were analyzed using SPSS 20.0 software (SPSS Inc., Chicago, IL, USA) as a statistical analysis tool to compare the D values resulting from different segmentation approaches by paired t-test. Moreover, histograms of the distribution of D values were computed. Inter-method reliability was assessed by calculating the intraclass correlation coefficient (ICC) and effect size obtained from the standardized mean difference between the D values from the two methods. The guidelines used to interpret effect size (Cohen’s d) values were as follows: small, d = 0.2; medium, d = 0.5; and large, d = 0.8 (Cohen, 1988). Pearson correlation analysis was used to analyze the agreement of D values between the two methods, and between D values and ages for each method. The significance level was set at p < 0.05 for all the analyses.
2.5. Methodological considerations
We used manual segmentation as a ground truth because this is commonly used as the reference technique for assessing the performance of automatic segmentation techniques, and manual tracing represents the true boundaries of the segmented structures (Perlaki et al., 2017). To calculate D values, Freesurfer and ground truth segmentations had to be transformed from the image space of Freesurfer and a ground truth back to Neuro I space, which may result in slight alterations due to resampling (Morey et al., 2009; Dewey et al., 2010).
3. Results
3.1. Segmentation
Magnetic resonance imaging scans for the 30 participants were segmented twice each, once by each algorithm. For each scan, total computational time was approximately 8 h for Freesurfer, and 10 min for Neuro I. Table 1 presents mean volume measurements, as delineated by each method, including the ground truth. Mean intra-subject standard deviations are also reported.
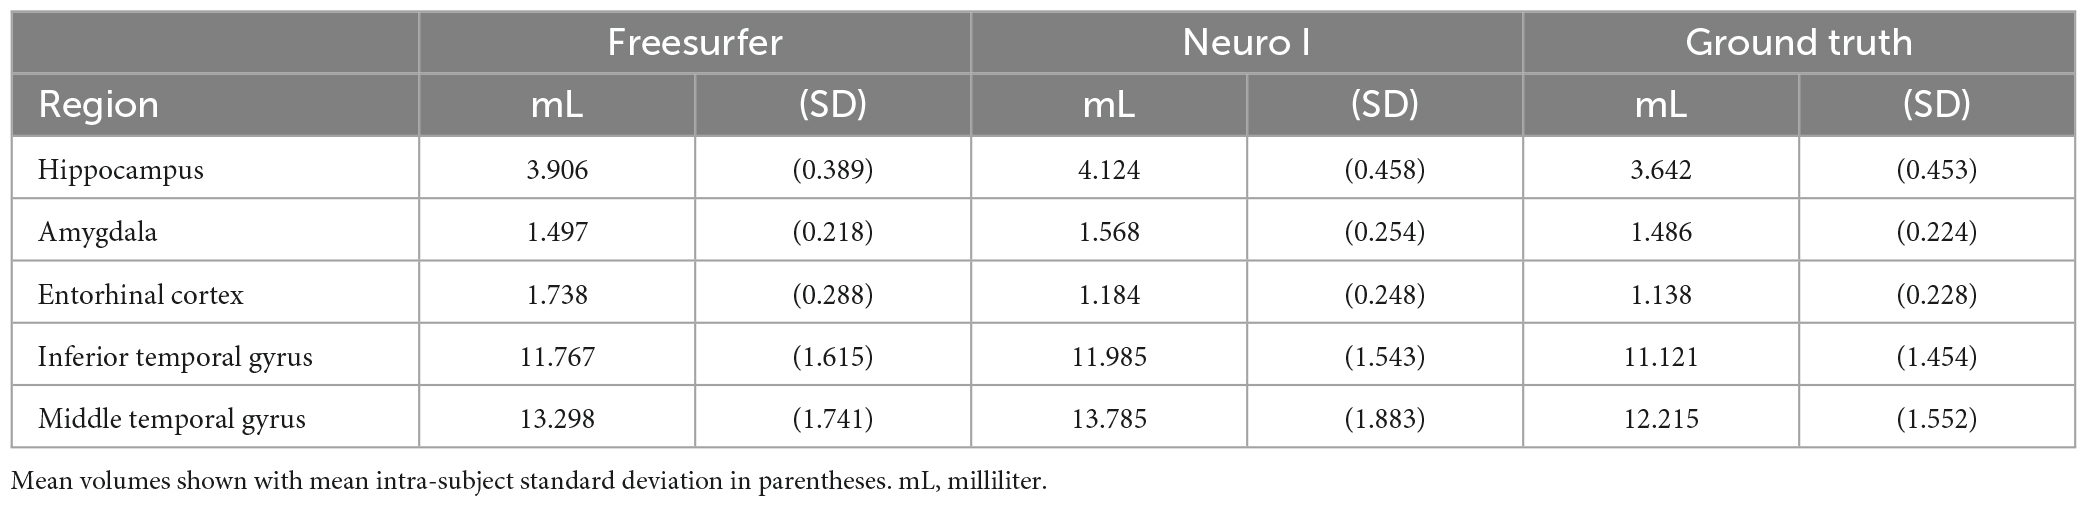
Table 1. Average structure volumes of Freesurfer, Neuro I, and ground truth.
Regarding errors of segmentation in the hippocampus, amygdala, and entorhinal cortex, Freesurfer segmentation seemed to necessitate manual corrections for quality control (Klapwijk et al., 2019), showing major boundary errors, such as stair-step artifacts along the boundary or non-natural looking, relative to Neuro I and ground truth, as demonstrated in Figure 2.
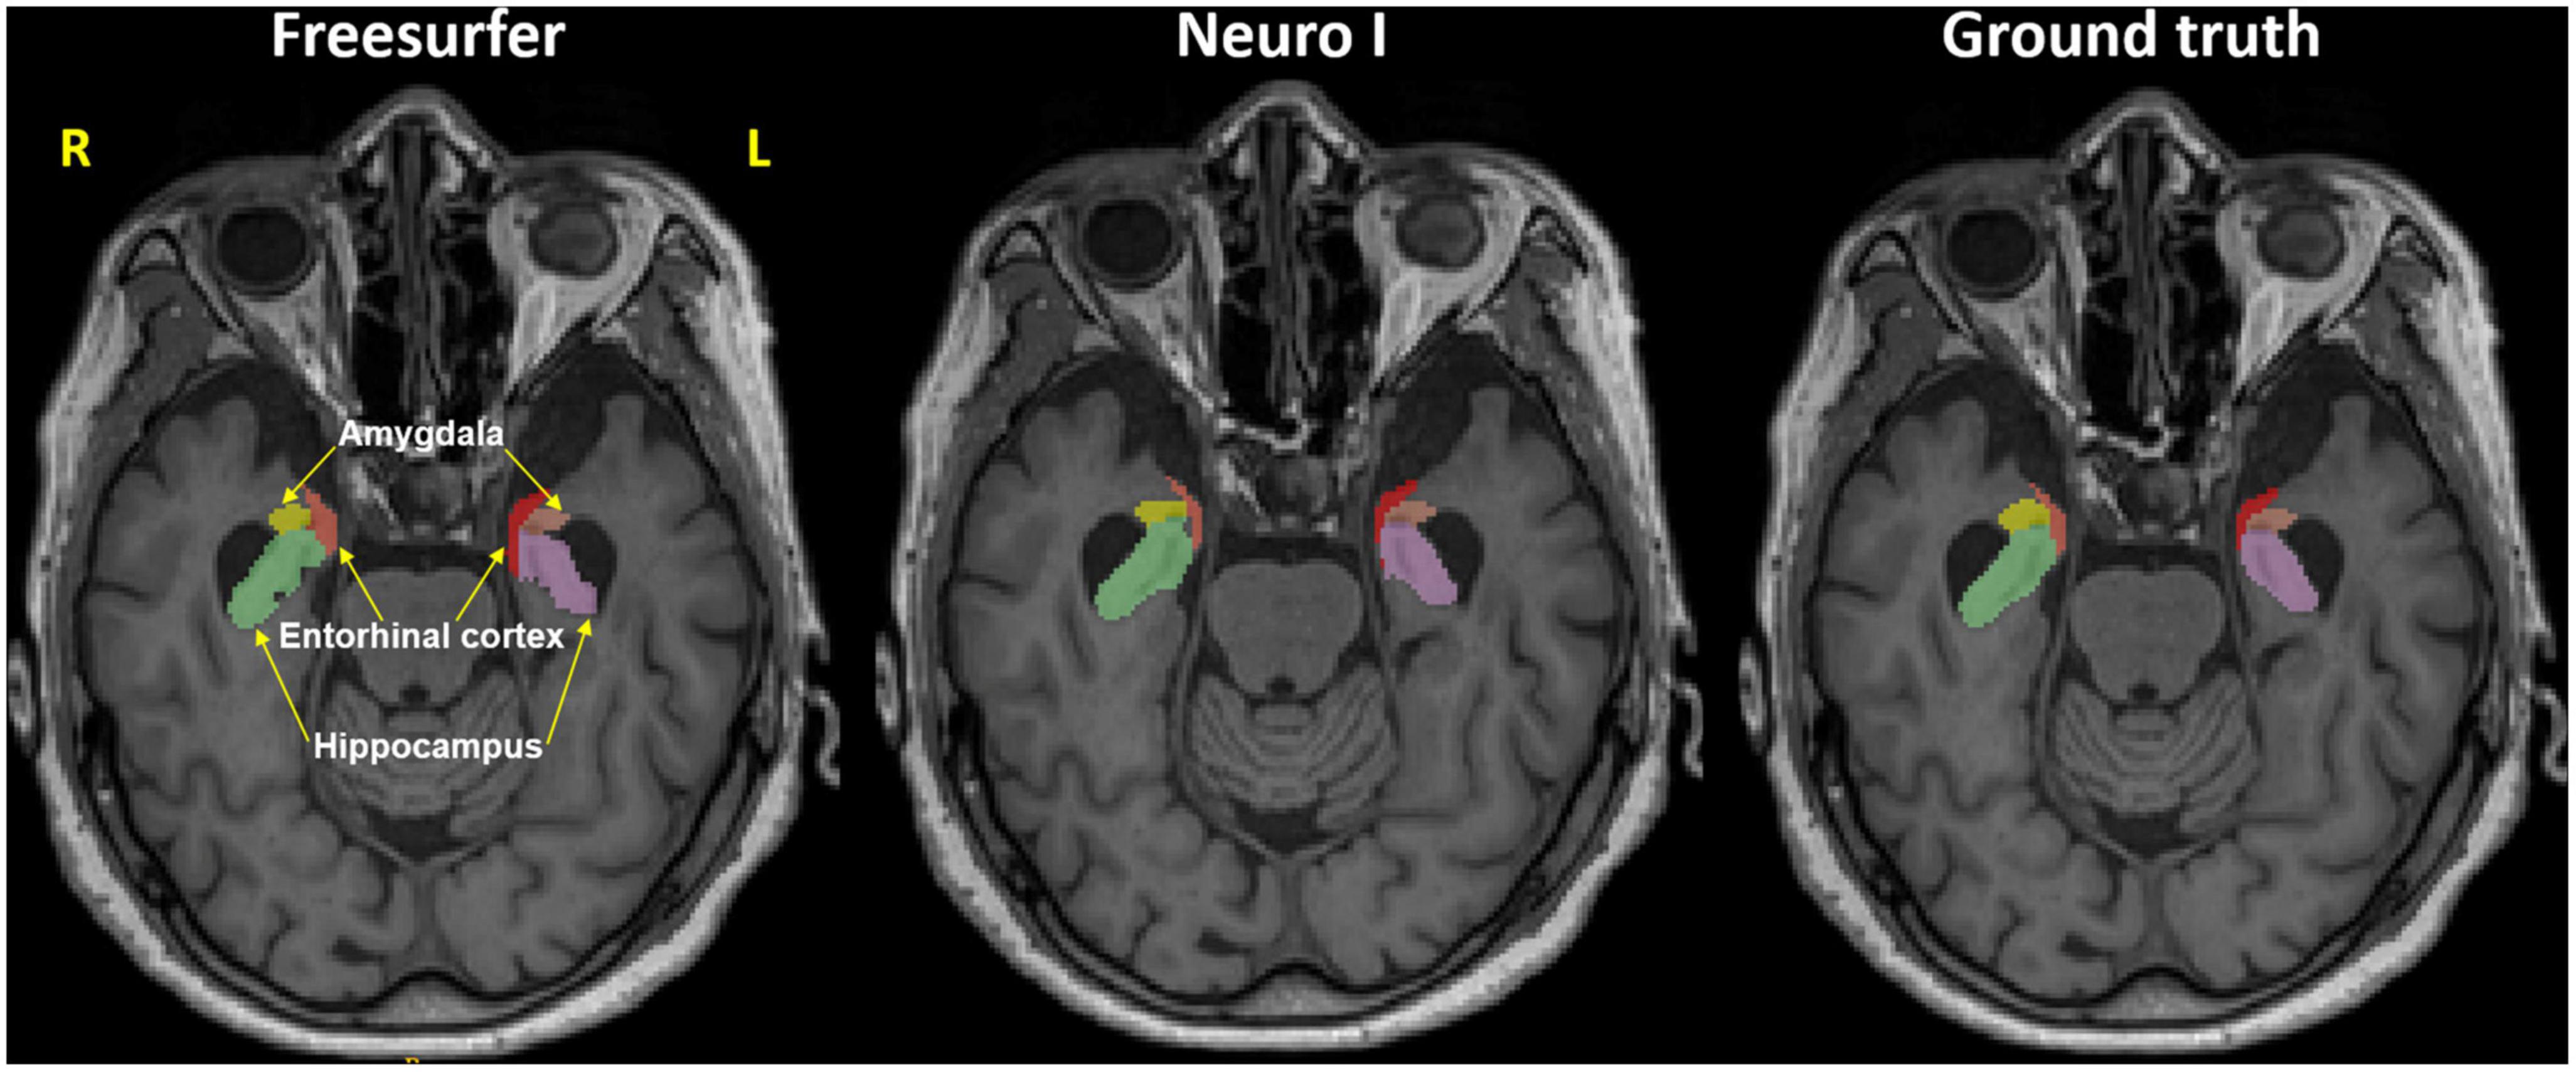
Figure 2. Representative MR image in the axial plane showing the hippocampus, amygdala, and entorhinal cortex in Freesurfer (left), our proposed model (Neuro I) (middle), and ground truth (right). It is evident that Freesurfer has errors in both over and underestimation along the boundaries of brain regions, as well as non-natural looking with grainy segmentation, whereas Neuro I segmentation obeys well the segment boundaries with more natural looking, rendering a smooth contoured. R, right; L, left.
3.2. Comparison of dice coefficients for the different segmentation methods
Figure 3 shows the effects of the different segmentation methods on D values. The mean D values of all ROIs obtained after processing with Freesurfer were significantly lower than those values obtained with Neuro I (paired t-test, p < 0.001). Also, the D values processed by Freesurfer had a larger spread [interquartile range (IQR)] than values processed by Neuro I.
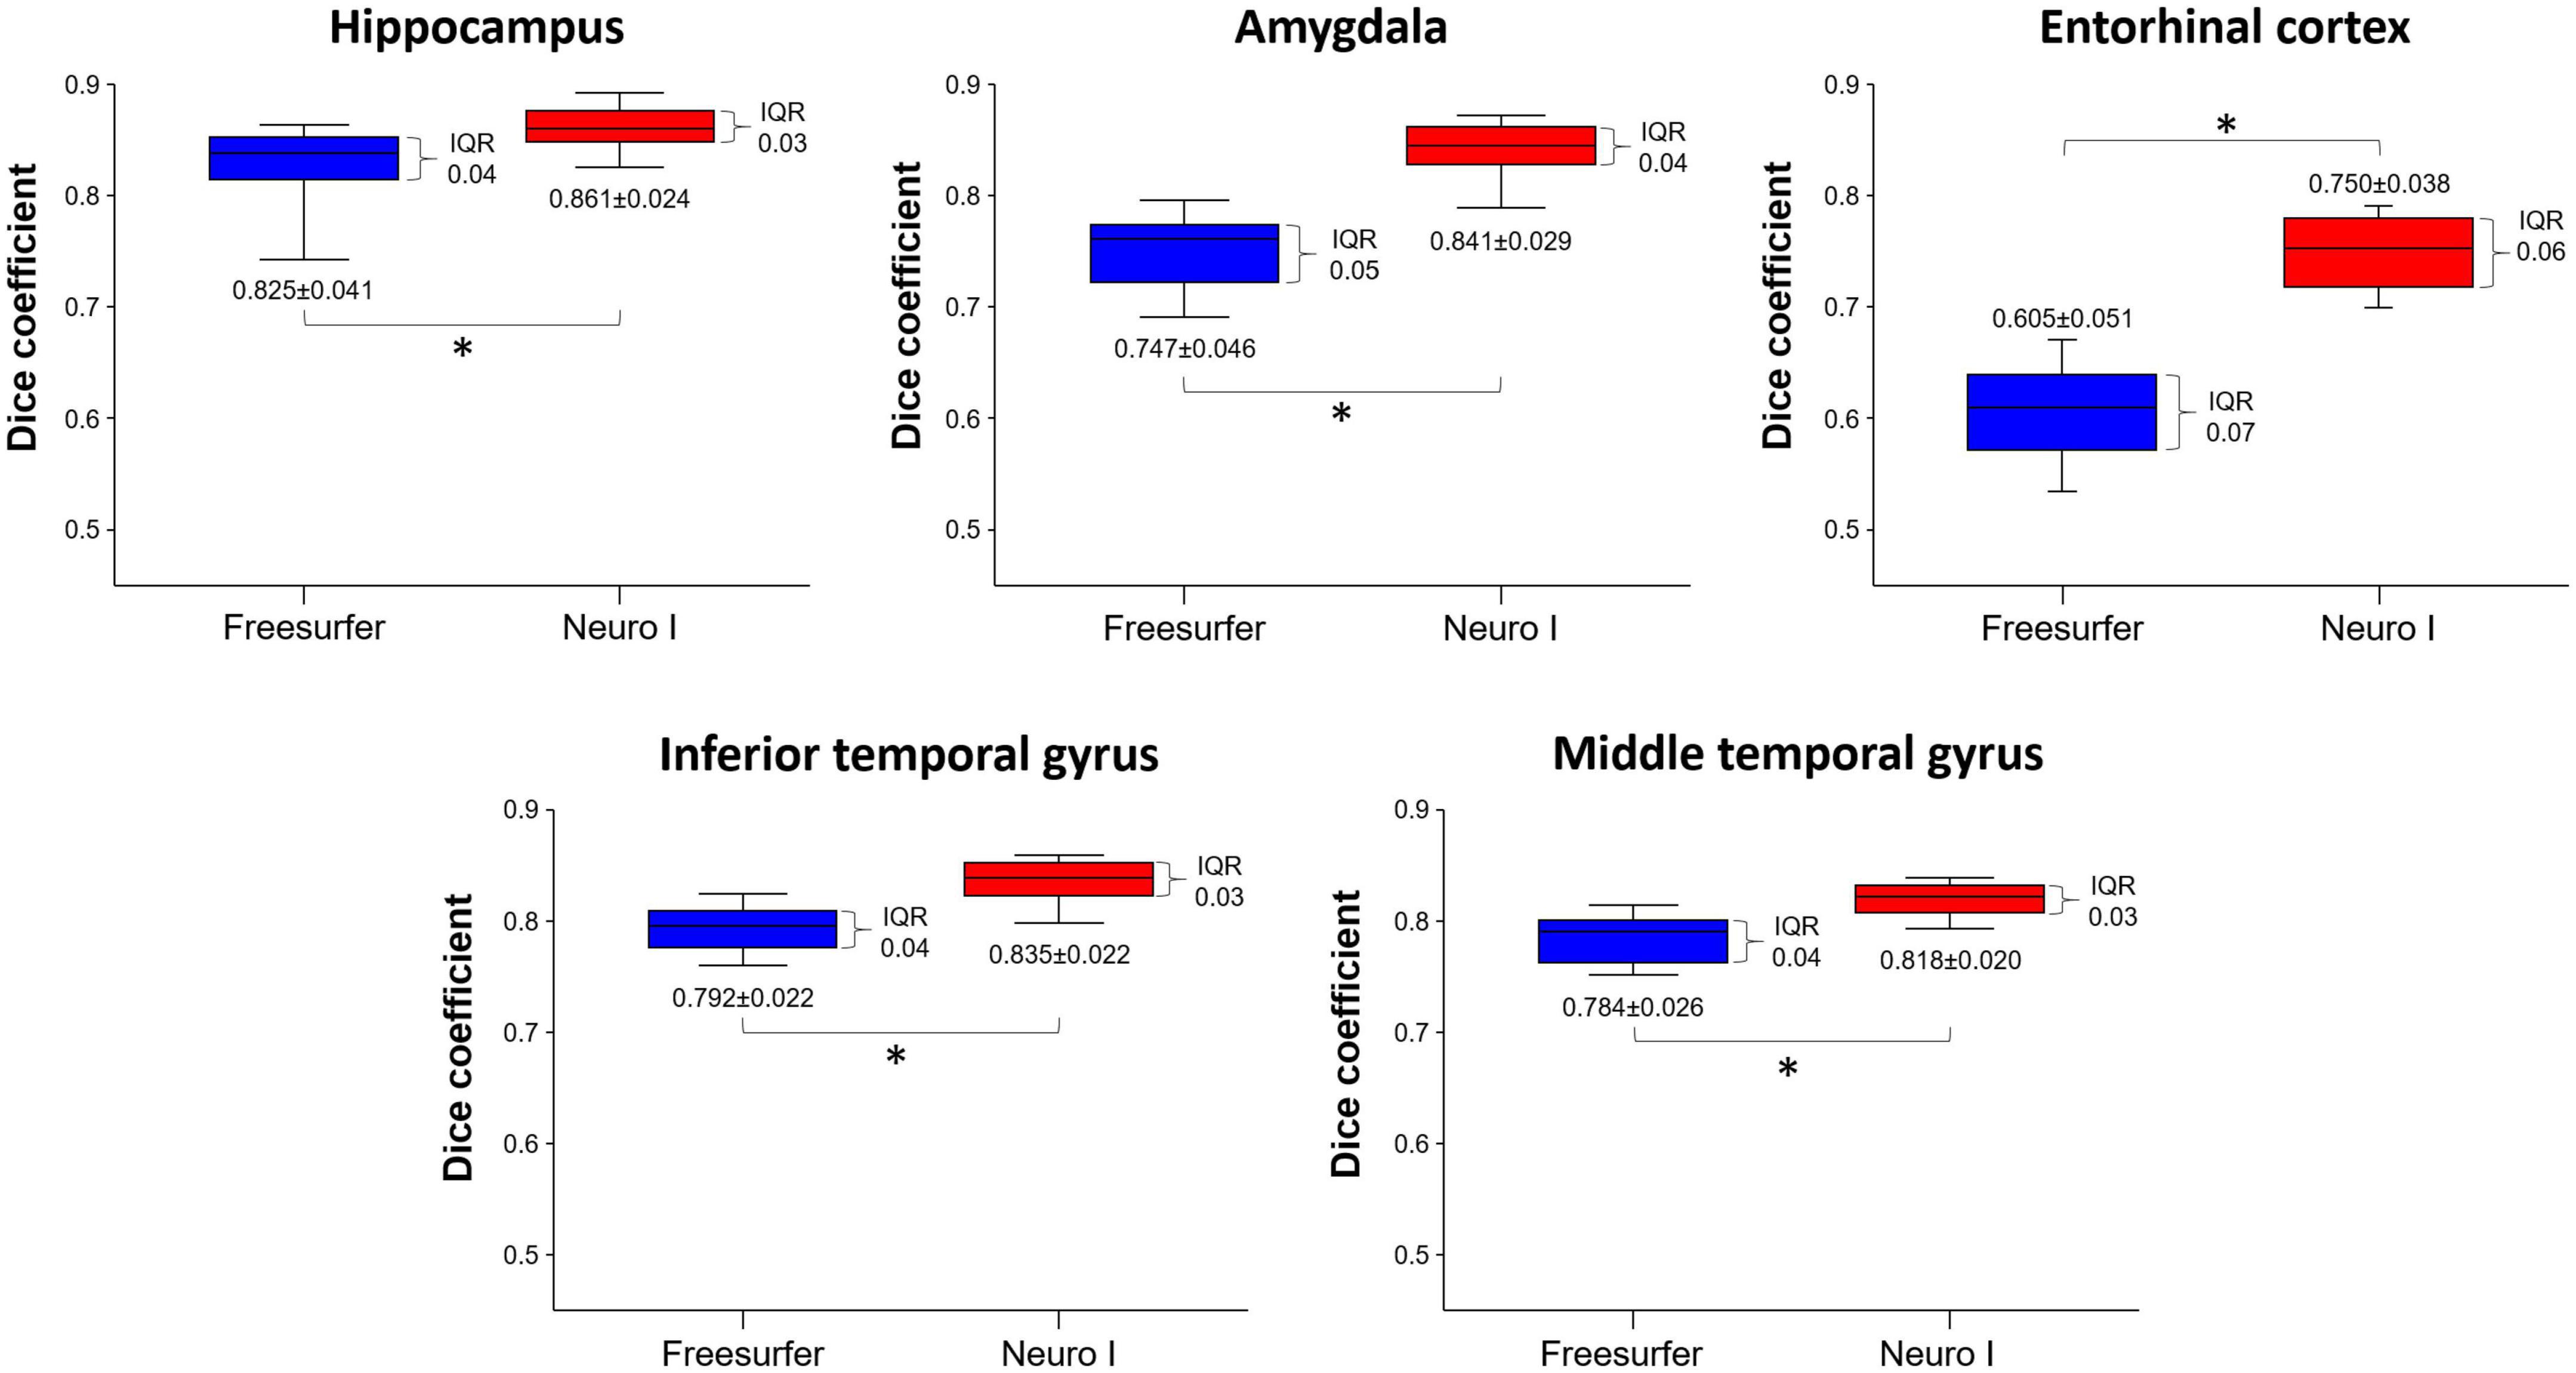
Figure 3. Comparison of dice coefficients obtained from Freesurfer and Neuro I using paired t-test. IQR, interquartile range. *Statistically significant difference at p < 0.05.
Figure 4 shows the histograms of D values using the same data but with different segmentation approaches. The histogram of the Freesurfer results shows remarkable differences in the distribution of the D values from Neuro I, especially regarding a significant discrepancy in the amygdala and entorhinal cortex.
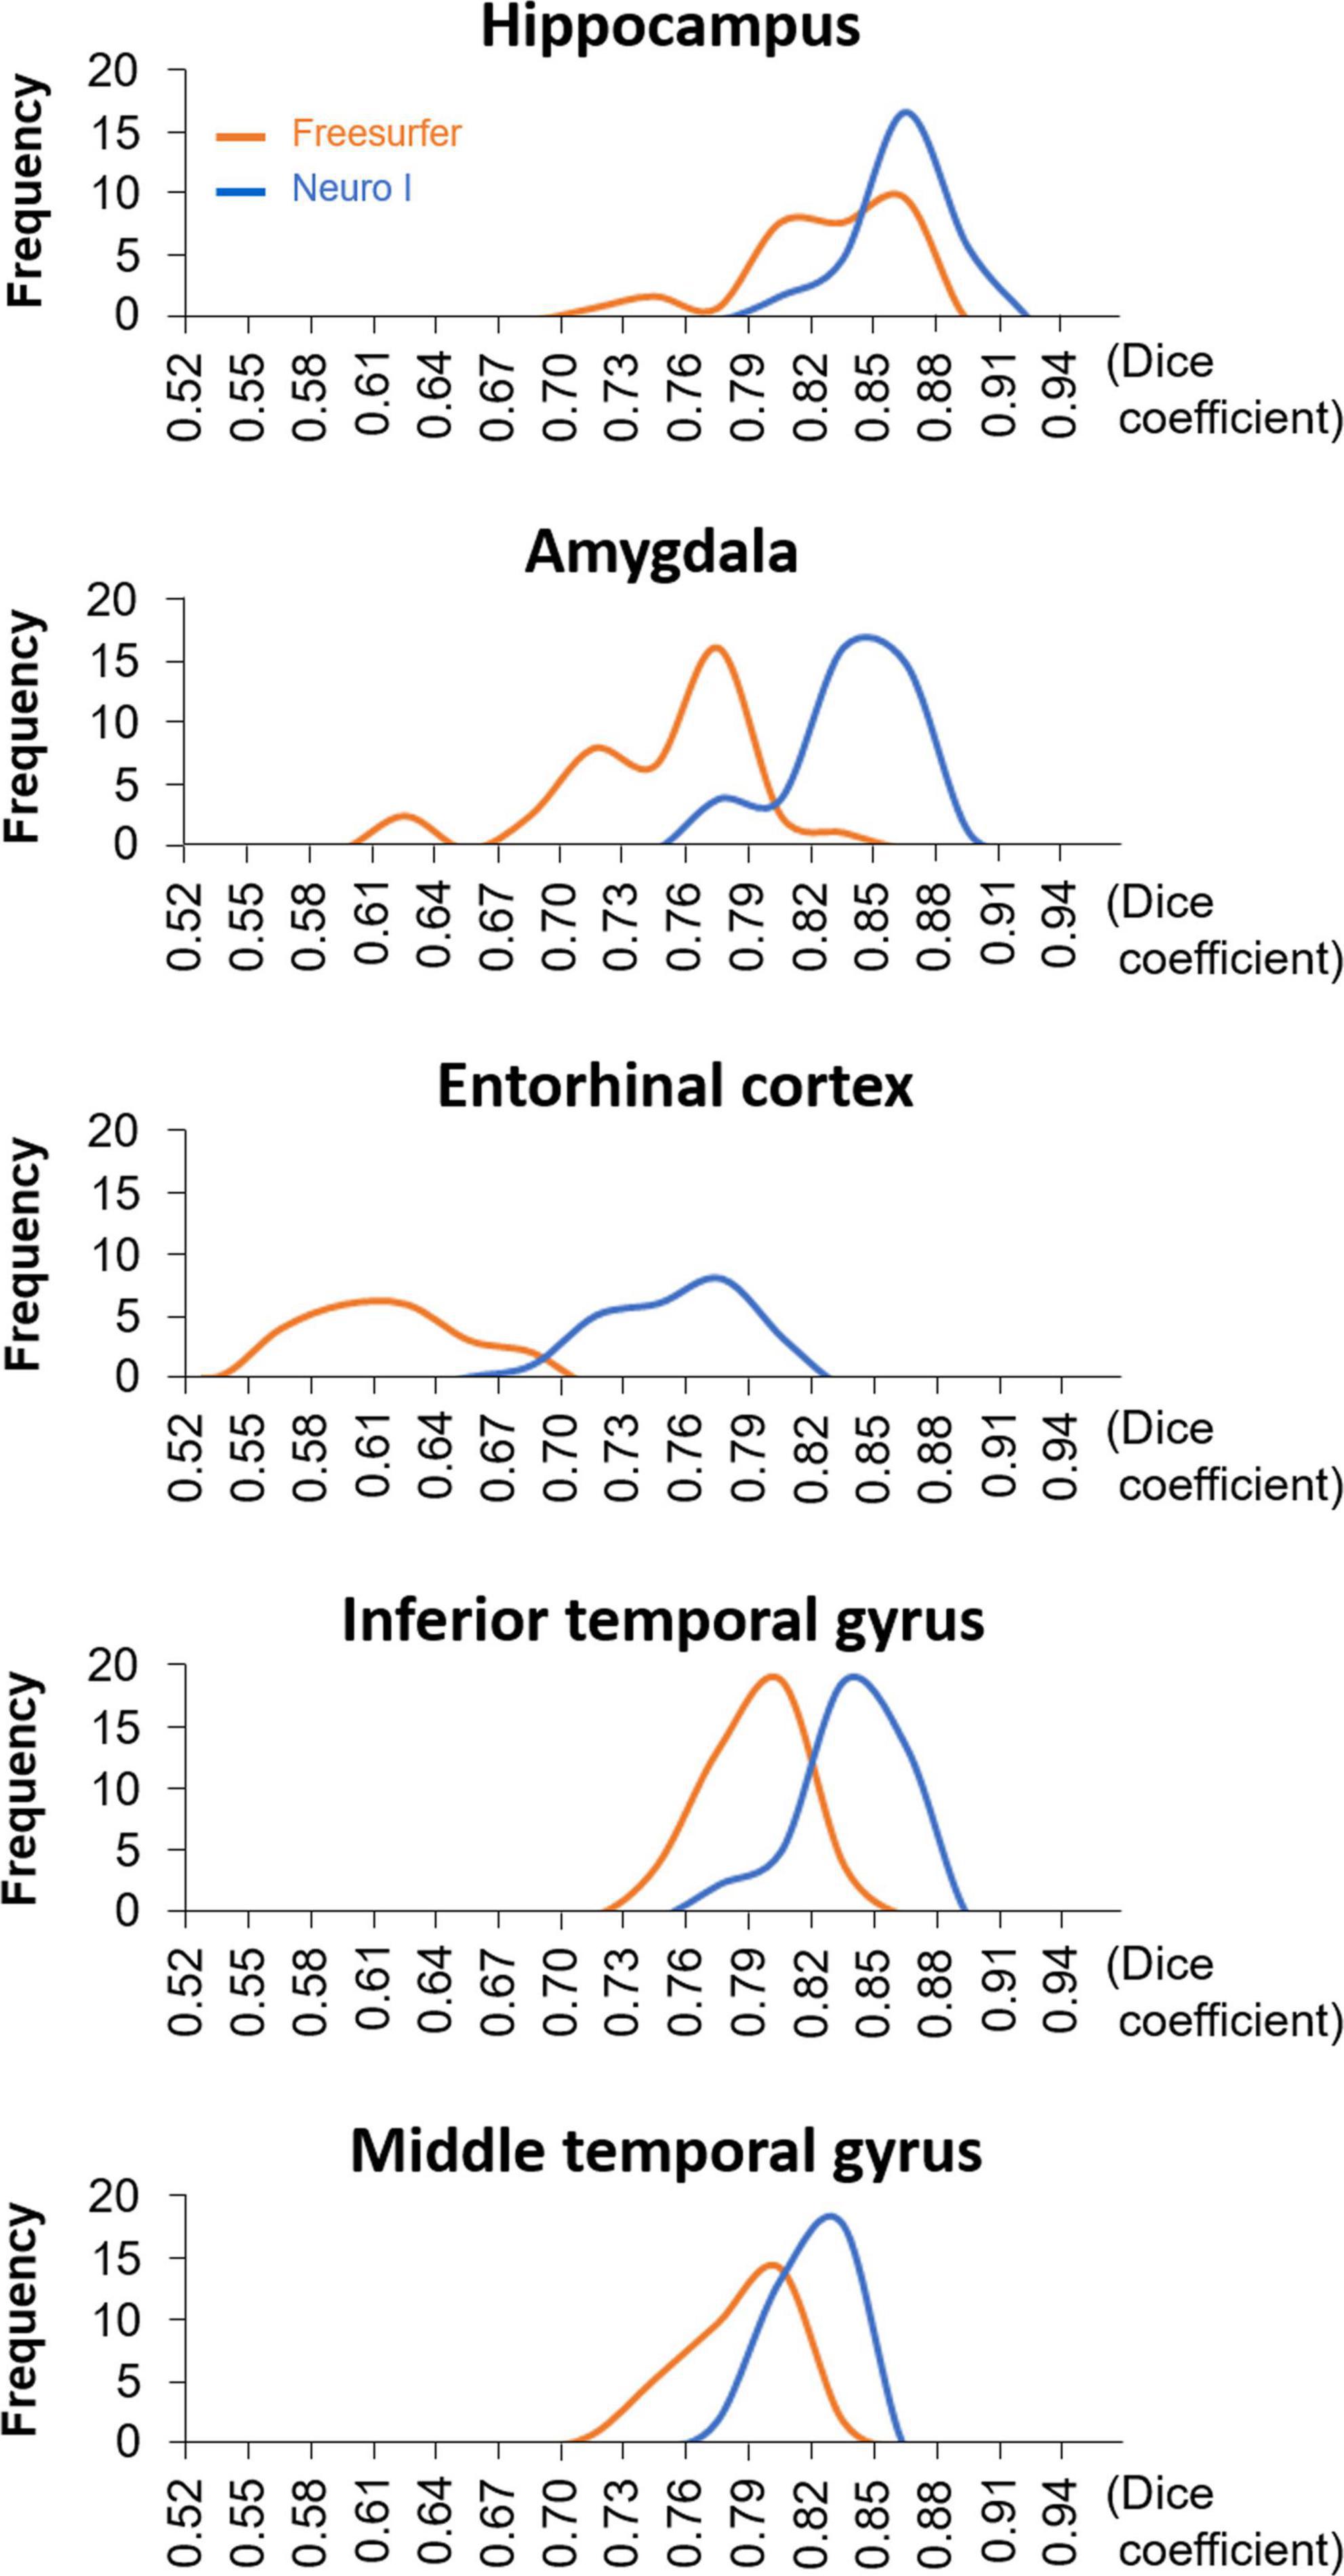
Figure 4. The histograms of dice coefficients obtained from Freesurfer and Neuro I.
3.3. Inter-method reliability
Overall D values by Freesurfer and Neuro I showed positive correlations in the hippocampus (R2 = 0.51), amygdala (R2 = 0.30), entorhinal cortex (R2 = 0.52), inferior temporal gyrus (R2 = 0.36), and middle temporal gyrus (R2 = 0.48) (Figure 5). However, surprisingly, for all ROIs, the slopes and intercepts were significantly different from 1, indicating proportional bias, and different from 0, indicating constant bias.
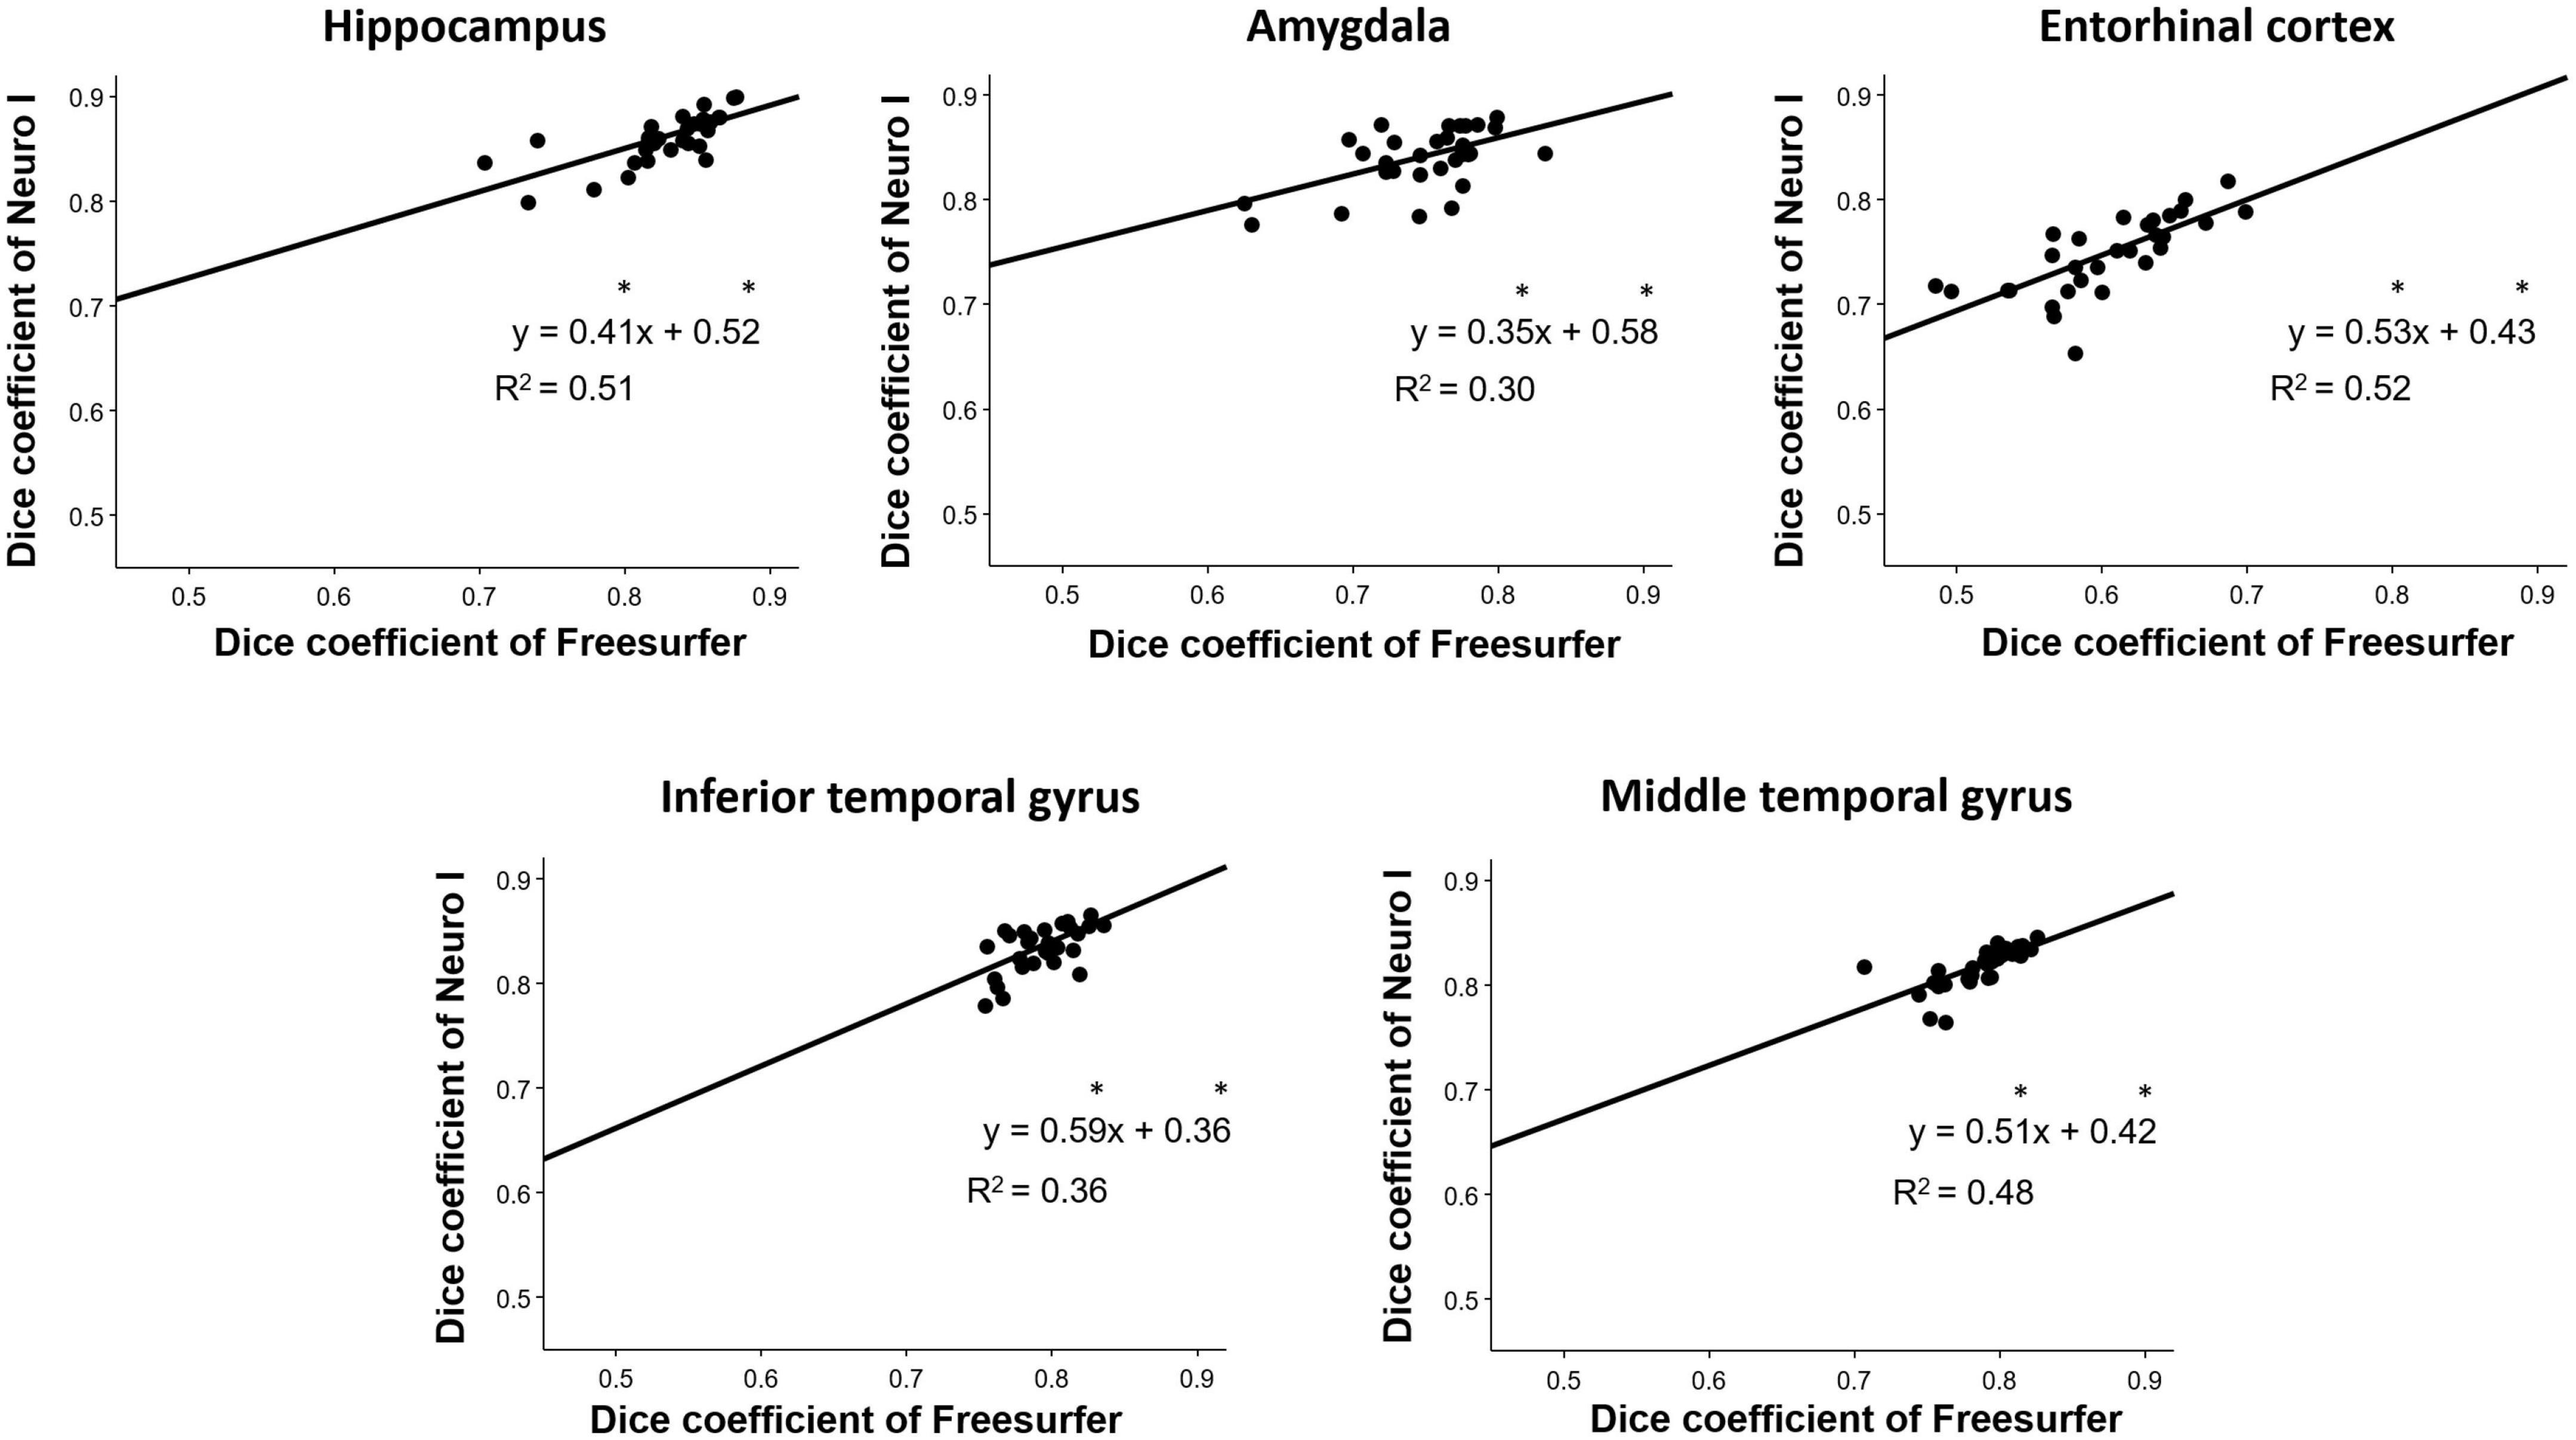
Figure 5. Correlation analyses for the investigation of discrepancies between dice coefficients obtained from Freesurfer and Neuro I. *Indicates that slope and intercept are significantly different from 1 and 0, respectively.
Regarding effect sizes, all ROIs showed that the largest effect sizes ranged from 1.07 to 3.22, especially in the amygdala and entorhinal cortex (Table 2). Also, ICCs showed significantly poor to moderate correlations between the two methods (0.498 ≤ ICC ≤ 0.688) (Table 2).
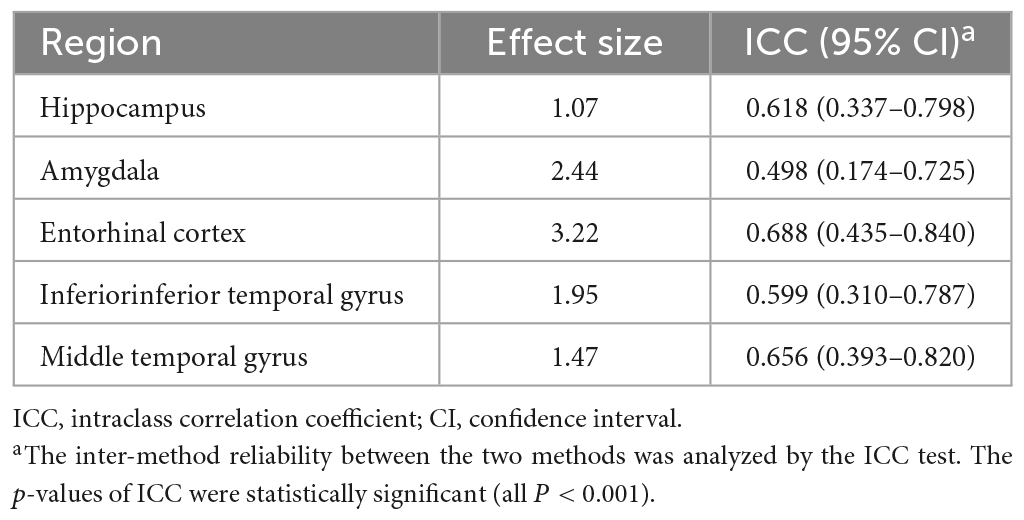
Table 2. Inter-method reliability in dice coefficients between Freesurfer and Neuro I.
3.4. Correlation of dice coefficients with age
Figure 6 shows the correlation analysis between D values and ages for each method. Our results show that segmentation strategy has a profound effect on the correlation with age. Interestingly, Neuro I revealed that D values resulted in reduced residuals when fitting data to a line of best fit, and indicated consistent values corresponding to each age, even in young and older adults.
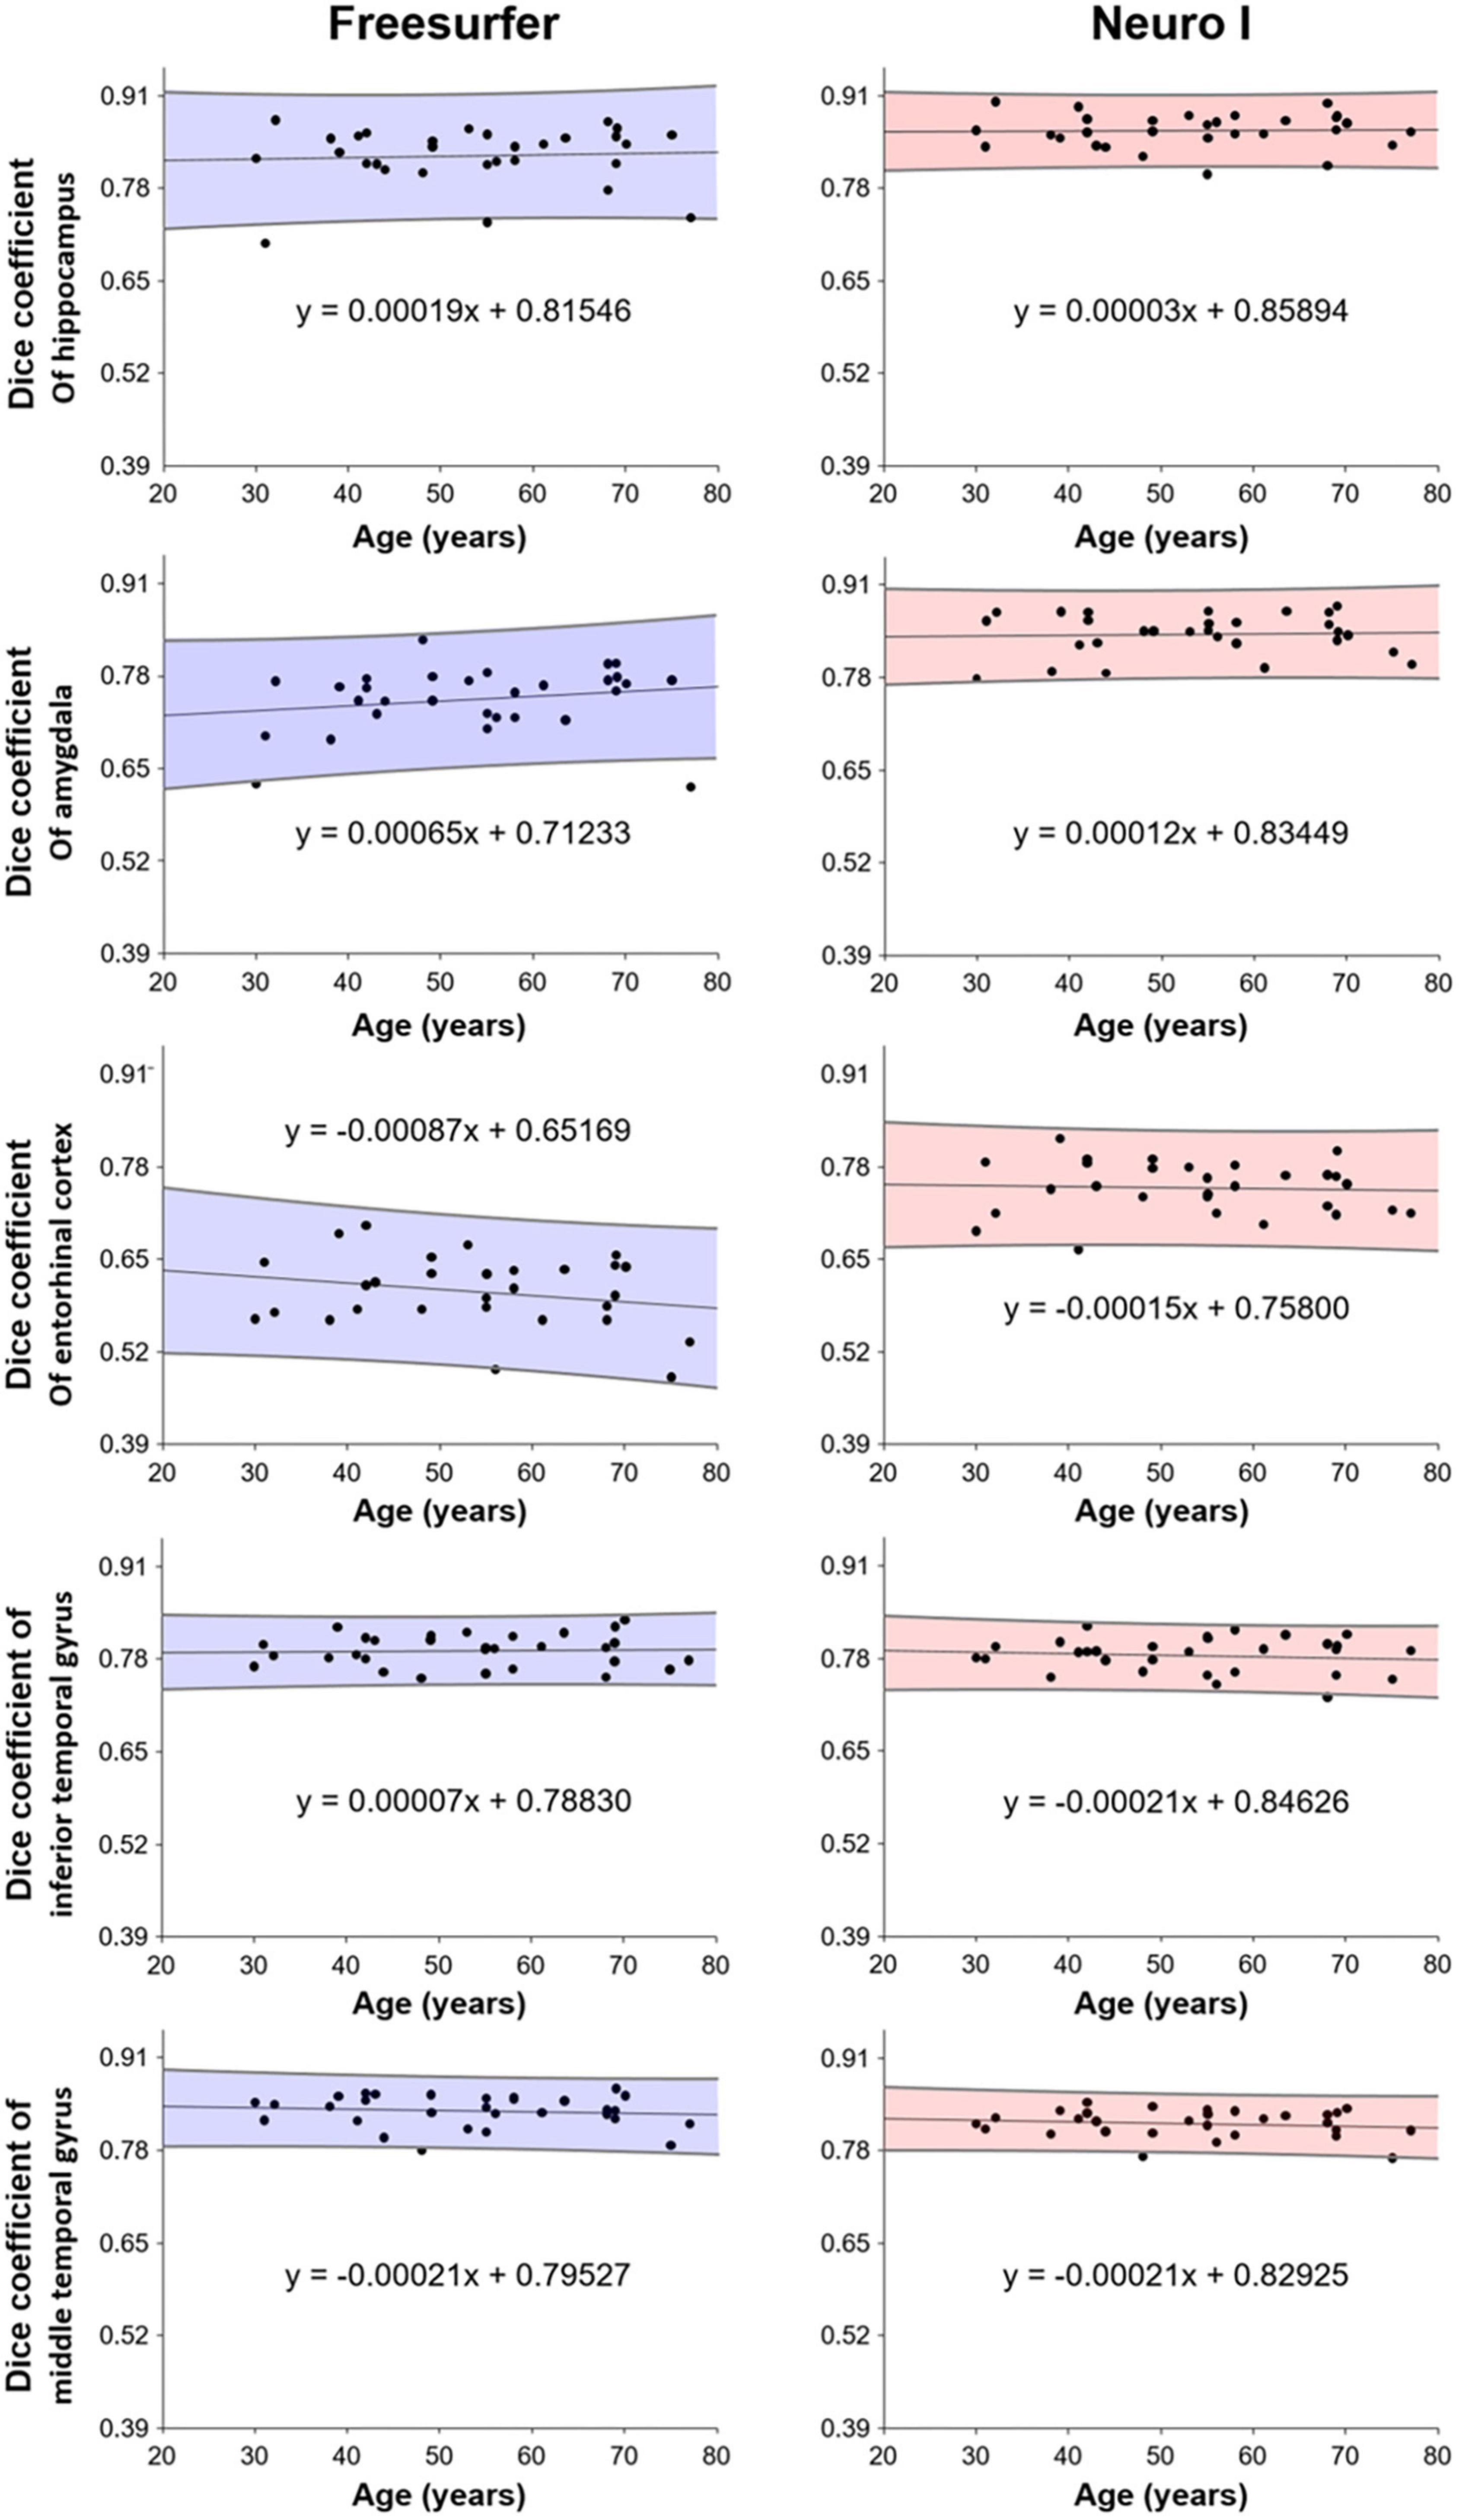
Figure 6. Correlation of dice coefficients (obtained from Freesurfer and Neuro I) with age.
4. Discussion
In this study, we evaluated brain volume measurements using Neuro I (3D CNN deep learning-based segmentation) comparing to Freesurfer (Freesurfer segmentation) in five segmented ROIs: the hippocampus, amygdala, entorhinal cortex, inferior temporal gyrus, and middle temporal gyrus. One of the disadvantages of previous segmentation strategies (e.g., Freesurfer) was the long post-processing times of 8 h (Ochs et al., 2015), while Neuro I enables processing of a whole brain MR image within 10 min. Importantly, most deep learning-based brain segmentation approaches have been oriented toward Caucasian populations; however, brain volume and shape differ between Caucasian and East Asian individuals (Kim et al., 2020). As the Neuro I deep learning model was sufficiently trained by a large cohort of East Asian individuals, we speculated that Neuro I could yield a better performance than Freesurfer.
4.1. Effect of different segmentation algorithms on the measurement of dice coefficients
Although Freesurfer is one of the most widely used tools in neuroimaging research for segmenting brain anatomy, several studies (Cherbuin et al., 2009; Wenger et al., 2014; Srinivasan et al., 2020) reported that the failure rate was high, resulting in exclusion of many scans, and indicating inconsistencies in segmentation. Another study revealed that the quality of volume estimation with Freesurfer may be less accurate because of over- or under-estimation in data processing. Indeed, a pediatric study (Schoemaker et al., 2016) found that, especially for volume of the hippocampus and amygdala, Freesurfer data may be inaccurate. Although our data did not include a pediatric population, when using Freesurfer, there is a slight chance that automatic segmentation may induce small errors or biases because the segmentation is not optimal. Thus, we suggest that more accurate segmentation algorithms will improve the accuracy of volume estimation and possibly increase the significance of the results.
Our hypothesis was that Neuro I would overcome some of the limitations of Freesurfer, because Neuro I has processing steps, such as analysis failure prediction, brain extraction, white matter segmentation, and analysis quality management, by applying the deep learning technique to reduce the error rates. Our results demonstrated that the Neuro I algorithm was fast and could provide high accuracy, based on brain volumes determined by T1-weighted brain MR images. In our study, Neuro I was superior to Freesurfer regarding D values in selected ROIs, indicating significant differences in mean values and IQRs compared to Freesurfer. In particular, the selected regions have been associated with biomarkers for AD diagnosis and cognitive decline (Wirth et al., 2013), and the decrease in brain volume could be explained by neuronal loss caused by amyloid deposition and neurofibrillary tangles (Goedert et al., 1991). Therefore, accurate and precise segmentation has importance in volumetry for curvature, shape, and connectivity analyses. Conversely, the underlying cause of changes in volume must be carefully considered, and the results for smaller structures should be cautiously interpreted because of potential differences due to the software used for volume measurements (Lee et al., 2021).
Comparison of histograms revealed that the D values from Freesurfer had an abnormal distribution or shape beyond the normal population range. We assumed that, using the “recon-all” command, Freesurfer might fail to process of brain images due to mismatched coordinates corresponding to a standard template or heterogeneous intensity ranges. In contrast, the model of Neuro I trained geographic patterns and image properties of brain anatomy from 776 data samples, provides a major difference from the Freesurfer algorithm.
4.2. Inter-method reliability
In this validation study of inter-method reliability, we found poor to moderate correlations and reliability between Freesurfer and Neuro I for the ROIs. Two studies (Fischl, 2012; Reid et al., 2017) reported that difficulty in segmenting the brain region stems from variability within its boundaries with hypointense T1 signal and a gradient of brighter intensities as one moves laterally blending with the adjacent white matter. In fact, based on visual inspection of segmentation maps, variability in the lateral boundary between the two different segmentation approaches was a contributing factor to lower inter-method reliability. Indeed, the deep learning model of Neuro I improves the quality of segmentation by producing smoother boundaries that follow the anatomic border more closely. One potential benefit of a deep learning-based brain segmentation tool is that by training over multiple samples, the model learns that jagged or stair-step boundaries are not consistent (Kaku et al., 2019). Moreover, our ROIs showed large effect sizes, which implies that the results between the two software programs were not identical.
4.3. Different segmentation approaches with age
Further, Neuro I (comparing to Freesurfer) showed a high success rate: segmentations in the finer anatomic regions were more consistent with ground truth segmentations, without bias with participant age. When evaluating age effects on brain volumes, this is an important finding. Participants in our study had a wide age range (30-77 years), and Neuro I showed a high level and small dispersion of D values, corresponding to age in brain regions closely associated with aging. It can be assumed that Freesurfer induces spurious age effects, which can lead to false biologic interpretations. One reason could be that Freesurfer does not use a population-based specific template (Srinivasan et al., 2020).
With high-speed data processing, which is a major advantage for Neuro I over Freesurfer, accurate deep learning-based automatic brain segmentation can screen or predict patients with cognitive impairment in clinical practice. Even though we did not display all results in detail in this paper, Neuro I can interact directly with a picture archival and communication system or Web server remotely. In addition, our final report provides the structural volumes of anatomical structures in cubic centimeters, and intracranial volumes as percentages. A normative range, relative to the East Asian standard template generated from 1,500 of healthy Koreans, is also provided for all the brain regions. Consequently, our findings may broaden the clinical feasibility of deep learning-based automatic brain segmentation, and the choice of segmentation strategy can impact the efficiency and detection capability of the volumetric analysis. Future studies are warranted to evaluate specific measures as biological markers in patients with cognitive impairment. Further, clinicians and researchers should consider the type of software used when interpreting the results of volume measurements.
4.4. Limitations
Our study has some limitations: first, because of the small sample size of healthy participants, there was potential for selection bias; and second, our outcomes may not be applicable to other imaging modalities, such as diffusion or perfusion MRI, or computed tomography.
5. Conclusion
Our Neuro I and Freesurfer were not equivalent when compared to a ground truth, especially for the segmentation of five ROIs, where Neuro I exhibited better performance. Therefore, we suggest that Neuro I is a useful alternative to assess the volume of a ROI; Neuro I can be used not only for voxel-wise analysis, but also for large-scale analysis of subcortical regions.
Data availability statement
The original contributions presented in this study are included in the article, further inquiries can be directed to the corresponding authors.
Ethics statement
The studies involving human participants were reviewed and approved by the Ethics Committee of Chonnam National University Hospital. Written informed consent for participation was not required for this study in accordance with the national legislation and the institutional requirements.
Author contributions
C-MM, YYL, S-SS, and SKK designed the study. C-MM, YYL, and K-EH performed the majority of experiments. C-MM, YYL, WY, BHB, and S-HH contributed to the analysis and interpretation of results. C-MM and YYL wrote the first draft of the manuscript. S-SS and SKK have approved the final manuscript and completed the manuscript. All authors agreed with the content of the manuscript.
Funding
This study was financially supported by the Ministry of Science and ICT through the National Research Foundation of Korea (Nos. 2021R1A2C1005765, 2021H1D3A2A02037997, and 2022R1A2C1003266) and Chonnam National University Hospital Biomedical Research Institute (BCRI22048).
Conflict of interest
K-EH was employed by Neurozen Inc.
The remaining authors declare that the research was conducted in the absence of any commercial or financial relationships that could be construed as a potential conflict of interest.
Publisher’s note
All claims expressed in this article are solely those of the authors and do not necessarily represent those of their affiliated organizations, or those of the publisher, the editors and the reviewers. Any product that may be evaluated in this article, or claim that may be made by its manufacturer, is not guaranteed or endorsed by the publisher.
References
Bae, J. B., Lee, S., Jung, W., Park, S., Kim, W., Oh, H., et al. (2020). Identification of Alzheimer’s disease using a convolutional neural network model based on T1-weighted magnetic resonance imaging. Sci. Rep. 10:22252. doi: 10.1038/s41598-020-79243-9
Cherbuin, N., Anstey, K. J., Reglade-Meslin, C., and Sachdev, P. S. (2009). In vivo hippocampal measurement and memory: A comparison of manual tracing and automated segmentation in a large community-based sample. PLoS One 4:e5265. doi: 10.1371/journal.pone.0005265
Cohen, J. (1988). Statistical power analysis for the behavioral sciences, 2nd Edn. Hillsdale, NJ: Lawrence Erlbaum Associates, 20–26.
Dale, A. M., Fischl, B., and Sereno, M. I. (1999). Cortical surface-based analysis. I. Segmentation and surface reconstruction. Neuroimage 9, 179–194. doi: 10.1006/nimg.1998.0395
Dewey, J., Hana, G., Russell, T., Price, J., McCaffrey, D., Harezlak, J., et al. (2010). Reliability and validity of MRI-based automated volumetry software relative to auto-assisted manual measurement of subcortical structures in HIV-infected patients from a multisite study. Neuroimage 51, 1334–1344. doi: 10.1016/j.neuroimage.2010.03.033
Goedert, M., Sisodia, S. S., and Price, D. L. (1991). Neurofibrillary tangles and beta-amyloid deposits in Alzheimer’s disease. Curr. Opin. Neurobiol. 1, 441–447. doi: 10.1016/0959-4388(91)90067-h
Grimm, O., Pohlack, S., Cacciaglia, R., Winkelmann, T., Plichta, M. M., Demirakca, T., et al. (2015). Amygdalar and hippocampal volume: A comparison between manual segmentation, Freesurfer and VBM. J. Neurosci. Methods 253, 254–261. doi: 10.1016/j.jneumeth.2015.05.024
Heo, Y. J., Baek, H. J., Skare, S., Lee, H. J., Kim, D. H., Kim, J., et al. (2022). Automated brain volumetry in patients with memory impairment: Comparison of conventional and ultrafast 3D T1-weighted MRI sequences using two software packages. AJR Am. J. Roentgenol. 218, 1062–1073. doi: 10.2214/AJR.21.27043
Isensee, F., Jaeger, P. F., Kohl, S. A. A., Petersen, J., and Maier-Hein, K. H. (2021). nnU-Net: A self-configuring method for deep learning-based biomedical image segmentation. Nat. Methods 18, 203–211. doi: 10.1038/s41592-020-01008-z
Kaku, A., Hegde, C. V., Huang, J., Chung, S., Wang, X., Young, M., et al. (2019). Darts: Denseunet-based automatic rapid tool for brain segmentation. arXiv [Preprint]. doi: 10.48550/arXiv.1911.05567
Kim, R. E. Y., Lee, M., Kang, D. W., Wang, S. M., Kim, N. Y., Lee, M. K., et al. (2020). Deep learning-based segmentation to establish East Asian normative volumes using multisite structural MRI. Diagnostics 11:13. doi: 10.3390/diagnostics11010013
Klapwijk, E. T., van de Kamp, F., van der Meulen, M., Peters, S., and Wierenga, L. M. (2019). Qoala-T: A supervised-learning tool for quality control of FreeSurfer segmented MRI data. Neuroimage 189, 116–129. doi: 10.1016/j.neuroimage.2019.01.014
Klein, A., and Tourville, J. (2012). 101 labeled brain images and a consistent human cortical labeling protocol. Front. Neurosci. 6:171. doi: 10.3389/fnins.2012.00171
Lee, J. Y., Oh, S. W., Chung, M. S., Park, J. E., Moon, Y., Jeon, H. J., et al. (2021). Clinically available software for automatic brain volumetry: Comparisons of volume measurements and validation of intermethod reliability. Korean J. Radiol. 22, 405–414. doi: 10.3348/kjr.2020.0518
Morey, R. A., Petty, C. M., Xu, Y., Hayes, J. P., Wagner, H. R. II., Lewis, D. V., et al. (2009). A comparison of automated segmentation and manual tracing for quantifying hippocampal and amygdala volumes. Neuroimage 45, 855–866. doi: 10.1016/j.neuroimage.2008.12.033
Ochs, A. L., Ross, D. E., Zannoni, M. D., Abildskov, T. J., Bigler, E. D. and Alzheimer’s Disease Neuroimaging Initiative (2015). Comparison of automated brain volume measures obtained with NeuroQuant and FreeSurfer. J. Neuroimaging 25, 721–727. doi: 10.1111/jon.12229
Onitsuka, T., Shenton, M. E., Salisbury, D. F., Dickey, C. C., Kasai, K., Toner, S. K., et al. (2004). Middle and inferior temporal gyrus gray matter volume abnormalities in chronic schizophrenia: An MRI study. Am. J. Psychiatry 161, 1603–1611. doi: 10.1176/appi.ajp.161.9.1603
Pemberton, H. G., Zaki, L. A. M., Goodkin, O., Das, R. K., Steketee, R. M. E., Barkhof, F., et al. (2021). Technical and clinical validation of commercial automated volumetric MRI tools for dementia diagnosis-a systematic review. Neuroradiology 63, 1773–1789. doi: 10.1007/s00234-021-02746-3
Perlaki, G., Horvath, R., Nagy, S. A., Bogner, P., Doczi, T., Janszky, J., et al. (2017). Comparison of accuracy between FSL’s FIRST and Freesurfer for caudate nucleus and putamen segmentation. Sci. Rep. 7:2418. doi: 10.1038/s41598-017-02584-5
Reid, M. W., Hannemann, N. P., York, G. E., Ritter, J. L., Kini, J. A., Lewis, J. D., et al. (2017). Comparing two processing pipelines to measure subcortical and cortical volumes in patients with and without mild traumatic brain injury. J. Neuroimaging 27, 365–371. doi: 10.1111/jon.12431
Schoemaker, D., Buss, C., Head, K., Sandman, C. A., Davis, E. P., Chakravarty, M. M., et al. (2016). Hippocampus and amygdala volumes from magnetic resonance images in children: Assessing accuracy of FreeSurfer and FSL against manual segmentation. Neuroimage 129, 1–14. doi: 10.1016/j.neuroimage.2016.01.038
Srinivasan, D., Erus, G., Doshi, J., Wolk, D. A., Shou, H., Habes, M., et al. (2020). A comparison of Freesurfer and multi-atlas MUSE for brain anatomy segmentation: Findings about size and age bias, and inter-scanner stability in multi-site aging studies. Neuroimage 223:117248. doi: 10.1016/j.neuroimage.2020.117248
Suh, C. H., Shim, W. H., Kim, S. J., Roh, J. H., Lee, J. H., Kim, M. J., et al. (2020). Development and validation of a deep learning-based automatic brain segmentation and classification algorithm for Alzheimer disease using 3D T1-weighted volumetric images. AJNR Am. J. Neuroradiol. 41, 2227–2234. doi: 10.3174/ajnr.A6848
Thyreau, B., and Taki, Y. (2020). Learning a cortical parcellation of the brain robust to the MRI segmentation with convolutional neural networks. Med. Image Anal. 61:101639. doi: 10.1016/j.media.2020.101639
Tustison, N. J., Cook, P. A., Klein, A., Song, G., Das, S. R., Duda, J. T., et al. (2014). Large-scale evaluation of ANTs and FreeSurfer cortical thickness measurements. Neuroimage 99, 166–179. doi: 10.1016/j.neuroimage.2014.05.044
Velasco-Annis, C., Akhondi-Asl, A., Stamm, A., and Warfield, S. K. (2018). Reproducibility of brain MRI segmentation algorithms: Empirical comparison of local MAP PSTAPLE, FreeSurfer, and FSL-FIRST. J. Neuroimaging 28, 162–172. doi: 10.1111/jon.12483
Wenger, E., Martensson, J., Noack, H., Bodammer, N. C., Kuhn, S., Schaefer, S., et al. (2014). Comparing manual and automatic segmentation of hippocampal volumes: Reliability and validity issues in younger and older brains. Hum. Brain Mapp. 35, 4236–4248. doi: 10.1002/hbm.22473
Wirth, M., Villeneuve, S., Haase, C. M., Madison, C. M., Oh, H., Landau, S. M., et al. (2013). Associations between Alzheimer disease biomarkers, neurodegeneration, and cognition in cognitively normal older people. JAMA Neurol. 70, 1512–1519.
Zhao, L., Matloff, W., Ning, K., Kim, H., Dinov, I. D., and Toga, A. W. (2019). Age-related differences in brain morphology and the modifiers in middle-aged and older adults. Cereb. Cortex 29, 4169–4193. doi: 10.1093/cercor/bhy300
Keywords: brain volumetry, deep learning, magnetic resonance imaging, segmentation, ground truth
Citation: Moon C-M, Lee YY, Hyeong K-E, Yoon W, Baek BH, Heo S-H, Shin S-S and Kim SK (2023) Development and validation of deep learning-based automatic brain segmentation for East Asians: A comparison with Freesurfer. Front. Neurosci. 17:1157738. doi: 10.3389/fnins.2023.1157738
Received: 03 February 2023; Accepted: 27 February 2023;
Published: 12 May 2023.
Edited by:
Liansheng Wang, Xiamen University, ChinaReviewed by:
Baptiste Magnier, Mines-Telecom Institute Alès, FranceSheng Lian, Fuzhou University, China
Copyright © 2023 Moon, Lee, Hyeong, Yoon, Baek, Heo, Shin and Kim. This is an open-access article distributed under the terms of the Creative Commons Attribution License (CC BY). The use, distribution or reproduction in other forums is permitted, provided the original author(s) and the copyright owner(s) are credited and that the original publication in this journal is cited, in accordance with accepted academic practice. No use, distribution or reproduction is permitted which does not comply with these terms.
*Correspondence: Seul Kee Kim, a2ltc2sucmFkQGdtYWlsLmNvbQ==; Sang-Soo Shin, a2pyYWRzc3NAZ21haWwuY29t
†These authors have contributed equally to this work