 Yuanqing Wu1,2
 Xiao-Min Xu
 Richard Salvi
 Shaohua Ding
 Xia Gao
- 1Department of Otorhinolaryngology Head and Neck Surgery, Nanjing Drum Tower Hospital Clinical College of Nanjing Medical University, Nanjing, China
- 2Department of Otorhinolaryngology Head and Neck Surgery, Nanjing First Hospital, Nanjing Medical University, Nanjing, China
- 3Department of Radiology, Nanjing First Hospital, Nanjing Medical University, Nanjing, China
- 4Center for Hearing and Deafness, University at Buffalo, The State University of New York, Buffalo, NY, United States
- 5Department of Radiology, The Affiliated Taizhou People's Hospital of Nanjing Medical University, Taizhou School of Clinical Medicine, Nanjing Medical University, Taizhou, China
Purpose: Sensorineural hearing loss (SNHL) is the most common form of sensory deprivation and is often unrecognized by patients, inducing not only auditory but also nonauditory symptoms. Data-driven classifier modeling with the combination of neural static and dynamic imaging features could be effectively used to classify SNHL individuals and healthy controls (HCs).
Methods: We conducted hearing evaluation, neurological scale tests and resting-state MRI on 110 SNHL patients and 106 HCs. A total of 1,267 static and dynamic imaging characteristics were extracted from MRI data, and three methods of feature selection were computed, including the Spearman rank correlation test, least absolute shrinkage and selection operator (LASSO) and t test as well as LASSO. Linear, polynomial, radial basis functional kernel (RBF) and sigmoid support vector machine (SVM) models were chosen as the classifiers with fivefold cross-validation. The receiver operating characteristic curve, area under the curve (AUC), sensitivity, specificity and accuracy were calculated for each model.
Results: SNHL subjects had higher hearing thresholds in each frequency, as well as worse performance in cognitive and emotional evaluations, than HCs. After comparison, the selected brain regions using LASSO based on static and dynamic features were consistent with the between-group analysis, including auditory and nonauditory areas. The subsequent AUCs of the four SVM models (linear, polynomial, RBF and sigmoid) were as follows: 0.8075, 0.7340, 0.8462 and 0.8562. The RBF and sigmoid SVM had relatively higher accuracy, sensitivity and specificity.
Conclusion: Our research raised attention to static and dynamic alterations underlying hearing deprivation. Machine learning-based models may provide several useful biomarkers for the classification and diagnosis of SNHL.
Introduction
Sensorineural hearing loss (SNHL) is a global public health problem and is often unrecognized by patients (Tordrup et al., 2022). It is estimated that SNHL currently affects 1.5 billion people worldwide and will affect 9 billion people by the year 2050 (Disease et al., 2018). SNHL can detract from quality of life at the individual level and cause a severe economic burden at the societal level (Collaborators, 2021). Known consequences of SNHL include not only hearing and communication difficulties but also social isolation, anxiety, depression and cognitive impairments (Olusanya et al., 2019), indicating the key role of neural substrates.
Neural imaging is a powerful tool and significantly enhances our knowledge about the human brain. Previous studies mostly used resting-state MRI to study SNHL, including fractional amplitude of low-frequency fluctuation (fALFF), regional homogeneity (ReHo) and degree centrality (DC). fALFF can suppress physiological noise (such as the vicinity of large blood vessels, cisterns and ventricles) and measure the contribution of low-frequency fluctuation within specific frequency bands (Zou et al., 2008). Slow 5 (0.01–0.027 Hz) and slow 4 (0.027–0.073 Hz) have better sensitivity to gray matter (Xu et al., 2019b). ReHo is calculated on Kendall coefficient consistency and defined as the similarity or nonparametric concordance of adjacent voxel time series (Li et al., 2013). Additionally, DC describes functional integration among the whole brain using graph theoretic techniques (Guan et al., 2022). These characteristics are relatively static and treat the spatial and temporal information of the functional brain as separate parts.
Emerging evidence suggests that the human brain is a complex dynamic system that is interconnected across time and space (Deco et al., 2011; Hou et al., 2018; Kong et al., 2023). Multilayer network analysis with the use of sliding windows provides the opportunity to detect the dynamic network configuration over time-resolved fMRI (Pedersen et al., 2018). The vital feature is the network switching rate or node flexibility, which is defined as the percentage of time when a node transitions to different functional networks (Bassett et al., 2011). However, the sliding windows and the length of step require prespecification and are correlated with global synchronization and temporal stability (Hutchison et al., 2013). Another analysis with the hidden Markov model (HMM) can overcome the above limitation and discrete brain states in a data-driven manner, describing the transition probabilities between states (Stevner et al., 2019). Multilayer network analysis and HMM analysis have been computed in some neuropsychological diseases, such as depression, schizophrenia and dementia (Wang et al., 2020, 2021; Li et al., 2021). To our knowledge, no study has examined the dynamic characteristics of SNHL using these processing methods.
Many studies have used traditional methodologies to diagnose SNHL presence with the help of clinical doctors, while machine learning has been widely applied to automatically identify various datasets and risk factors for diseases. Existing studies conducted machine learning models with hearing thresholds and RNA expression to diagnose hereditary hearing loss (Luo et al., 2021), noise-induced hearing loss (Chen et al., 2021) and SNHL (Shew et al., 2019), but they ignored the involvement of neural functions. fMRI-based radiomics can be utilized to explore neurological disease biomarkers and underlying mechanisms, such as cognitive impairments and depression (Shi et al., 2021; Shin et al., 2021; Chand et al., 2022).
In the present study, our hypothesis is machine learning models with a combination of static and dynamic brain feature can efficiently distinguish SNHL patients and controls. These machine learning models were applied to deidentified datasets and used to calculate the presence of SNHL. Moreover, to our knowledge, our research might be the early one to apply multi-order radiomics in identifing SNHL biomarkers, and this approach would contribute to a better understanding of machine learning tools to predict susceptibility to SNHL.
Materials and methods
Participants and ethics statement
A total of 110 bilateral SNHL patients and 106 age-and sex-matched healthy controls (HCs) were recruited from the Otolaryngology Department of Nanjing First Hospital and the local community via advertisements. This study was conducted with approval from the Research Ethics Committee of our hospital, and written informed consent was obtained from each participant prior to study participation. A pure tone audiometry (PTA) test was computed to evaluate the hearing threshold and the diagnosis of SNHL. A tympanometry test was conducted to confirm the function of the middle ear. The Mini-Mental State Examination (MMSE), Montreal Cognitive Assessment (MoCA), verbal fluency test (VFT), Trail Making Test-Part A/B (TMT-A/B), auditory verbal learning test (AVLT), clock drawing test (CDT), digit span test (DST), digit symbol substitution test (DSST), self-rating anxiety scale (SAS), and Hamilton Depression Scale (HAMD) were used to evaluate cognition and mental condition. We excluded individuals if they (1) suffered from pulsatile tinnitus, hyperacusis, Meniere’s disease, conductive deafness, Parkinson’s disease, Alzheimer’s disease and major illnesses; (2) had a history of brain injury, drug addiction, smoking or alcohol addiction; or (3) had MRI contraindications.
Imaging acquisition and data preprocessing
A 3.0 Tesla MRI with an 8-channel head coil (Ingenia, Philips Medical Systems, Netherlands) was used for the imaging acquisition. All subjects were instructed to remain awake and avoid thinking about special things during the scanning. Foam padding was used to minimize head motion, and earplugs were used to attenuate scanning noise (about 32 dB). Structural images were acquired using a 3D-T1 sequence, and the parameters were as follows: repetition time (TR) = 8.1 ms, echo time (TE) = 3.7 ms, slices = 170, thickness = 1 mm, gap = 0 mm, flip angle (FA) = 8°, field of view (FOV) = 256 mm × 256 mm, matrix = 256 × 256. Functional images were acquired using a gradient echo-planar imaging sequence as follows: time points = 240, TR = 2000 ms, TE = 30 ms, slice = 36, thickness = 4 mm, gap = 0 mm, FA = 90°, FOV = 240 mm × 240 mm, matrix = 60 × 60.
Using tools in the Graph Theoretical Network Analysis Toolbox for Imaging Connectomics (GRETNA),1 functional MRI were preprocessed following the pipelines: (1) removing the first 10 time points for signal equilibrium, the remaining 230 images underwent subsequent analysis, (2) slice timing, (3) realign, (4) normalizing to EPI template (reslicing voxel size as 3 × 3 mm3), (5) spatial smoothing with a 6 mm full width at half maximum (FWHM), (6) regressing out covariates using Friston-24 parameters, and (7) detrending and filtering with a band from 0.01 to 0.1 Hz (Figure 1A). Subjects with head motion >2.0 mm or rotation angle >2.0° in any direction were removed from analysis, and nobody was excluded in our study.
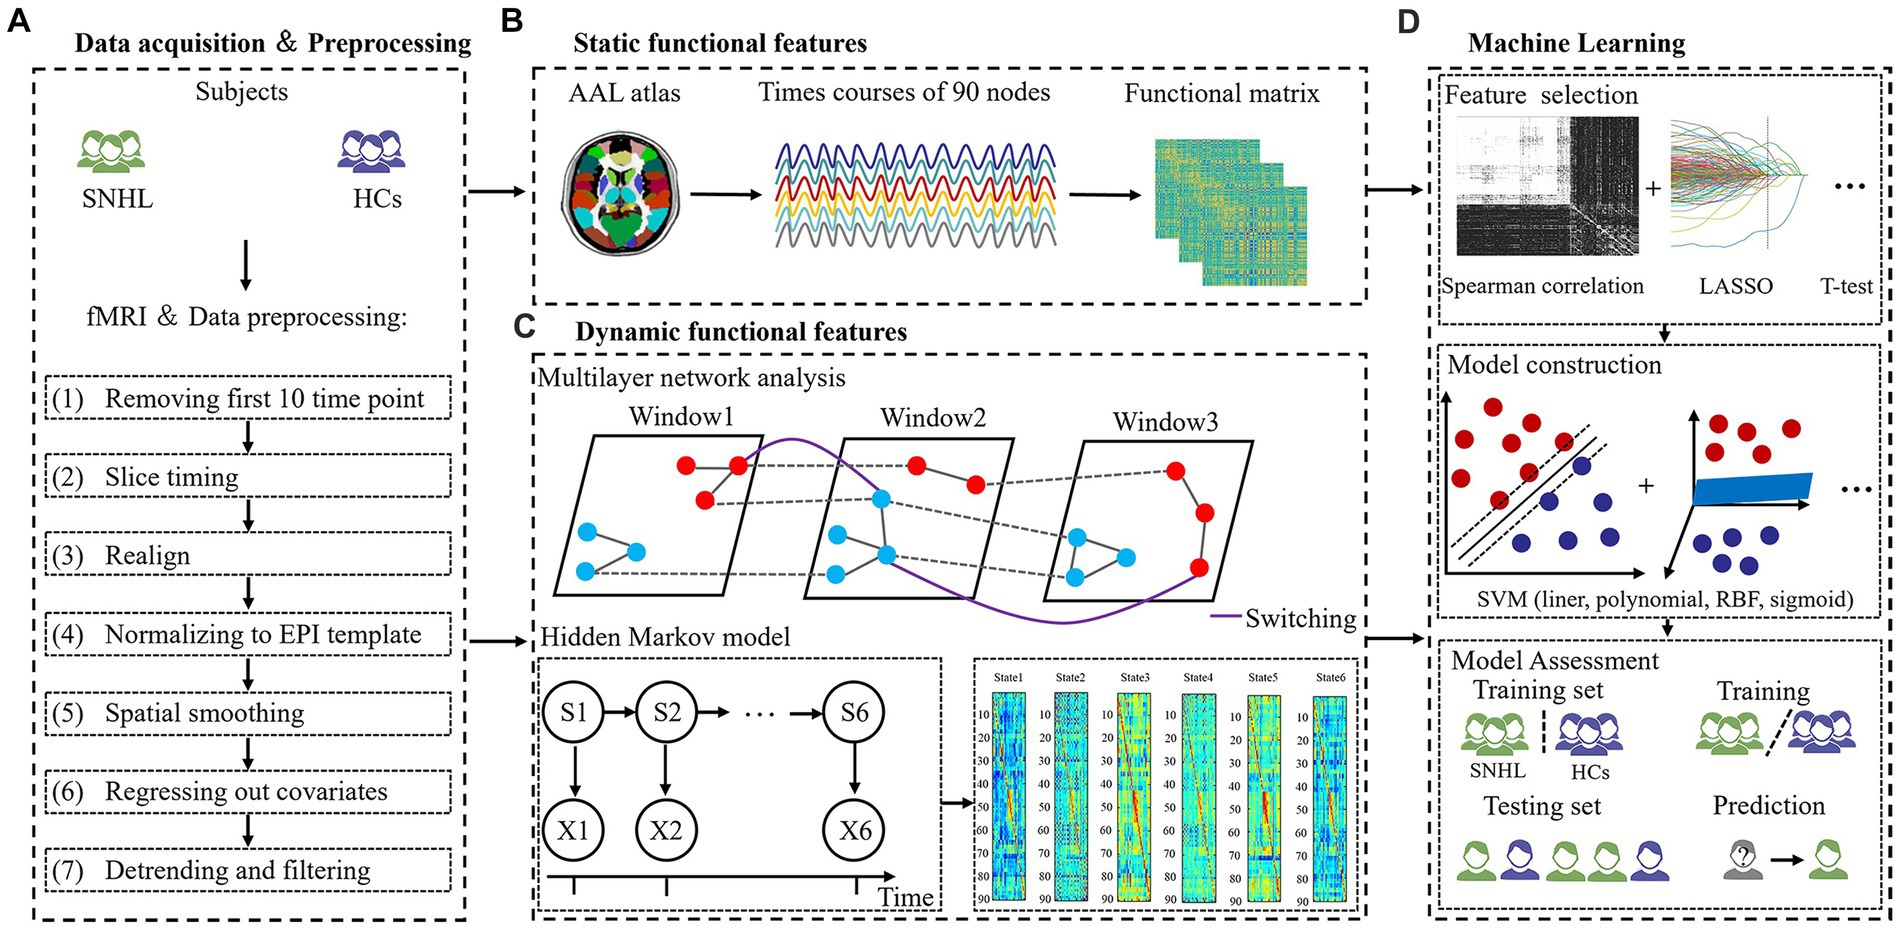
Figure 1. The flowchart of the experiment. (A) Data acquisition and processing. (B) Static functional features. (C) Dynamic functional features. (D) Machine learning.
Structural data analysis
The 3D-T1 sequence was used for structural analysis using DARTEL voxel-based morphometry (VBM) method according to previous study (Lin et al., 2013). The analysis steps were as follows: (1) segmenting T1 images into gray matter (GM), white matter and cerebrospinal fluid, (2) constructing GM templates from the dataset; (3) performing non-linear warping of segmented images; (4) spatial normalization; (5) smoothing with a 6 mm FWHM. The VBM analysis demonstrated that SNHL was not related to significant structural alterations in present study.
Static and dynamic analysis
Static brain characteristics included f1ALFF (0.01–0.027 Hz), f2ALFF (0.027–0.073 Hz), ReHo, binary DC (BDC) and weighted DC (WDC), which is consistent with previous studies (Xu et al., 2019b; Zeng et al., 2021). Then, we extracted representative signals of 90 nodes based on the anatomical automatic labeling (AAL) atlas using REST software2 (Figure 1B).
To investigate the dynamic brain features, we applied a multilayer network and HMM to time courses that were extracted from 90 nodes. We computed a sliding window method to calculate a dynamic function where the window size was set to 40 and the overlap was set to 0.975. The ordinal GenLouvain algorithm was used to track switching rates (SR)/node flexibilities (NF), and detailed information was similar to prior studies (Pedersen et al., 2018; Yang et al., 2020). This model is governed by γ and ω parameters, and we used a range of parameters, including γ = [0.9, 1, 1.1] and ω = [0.5, 0.75, 1], in the present study.
Additionally, we also applied HMM with a multivariate Gaussian observation model. According to an existing paper, the number of states assumed for the signal dynamics was specified as 6 (Moretto et al., 2022). Three global temporal characterizations of HMM dynamics were estimated from time courses, including fractional occupancies (FO) and SR (Lin et al., 2022). FO is defined as the ratio of activated HMM states across the all-time course. SR is the frequency of transitions between different states (Figure 1C).
Feature extraction
All features were based on the AAL 90 atlas in our study. Static features include f1ALFF (1–90), f2ALFF (1–90), ReHo (1–90), BDC (1–90) and WDC (1–90) [90 × 5 = 450 features]. Dynamic brain features include NF 1 → 1 (1–90), NF 1 → 2 (1–90), NF 1 → 3 (1–90), NF 2 → 1 (1–90), NF 2 → 2 (1–90), NF 2 → 3 (1–90), NF 3 → 1 (1–90), NF 3 → 2 (1–90), NF 3 → 3 (1–90) using multilayer network analysis, as well as FO (1–6) and SR using the HMM method [90 × 9 + 6 + 1 = 817 features] (Figure 1D).
Feature selection
The dimension of 1,267 extracted features is relatively high; therefore, so we needed to perform some dimensionality reduction on these features, as follows: (1) Spearman rank correlation test (the top 1% features were reserved), (2) least absolute shrinkage and selection operator (LASSO) with correlation coefficients at lambda = 100 and alpha = 1, and (3) t test and LASSO (features with a p-value <0.05 with independent sample t test were retained to perform LASSO subsequently). The above three strategies were computed with 5-fold cross-validation.
Model construction and assessment
For model construction, four types of support vector machine (SVM) models were chosen as the classifiers, including linear, polynomial, radial basis functional kernel (RBF) and sigmoid SVM (Shin et al., 2021). We compared the ability of the models to distinguish between SNHL and HC using the following indicators: the receiver operating characteristic curve (ROC), area under the curve (AUC), sensitivity, specificity and accuracy. To estimate the generalizability and transportability of machine learning models, 5,000 permutation tests were performed.
Results
Demographic characteristics and clinical data
Detailed information on demographic characteristics and clinical data is summarized in Table 1. A total of 110 SNHL patients and 106 HCs were matched in terms of sex, age and education duration (p > 0.05). The hearing thresholds of each ear at 0.25, 0.5, 1, 2, 4, and 8 kHz in the SNHL group were significantly higher than those in the HC group (p < 0.001). The SNHL group performed worse on the CFT-delay and TMT-A/B tests, which are associated with visual memory recall and cognitive flexibility, respectively. Moreover, the SAS and HAMD scores of patients with SNHL were higher than those of HCs.
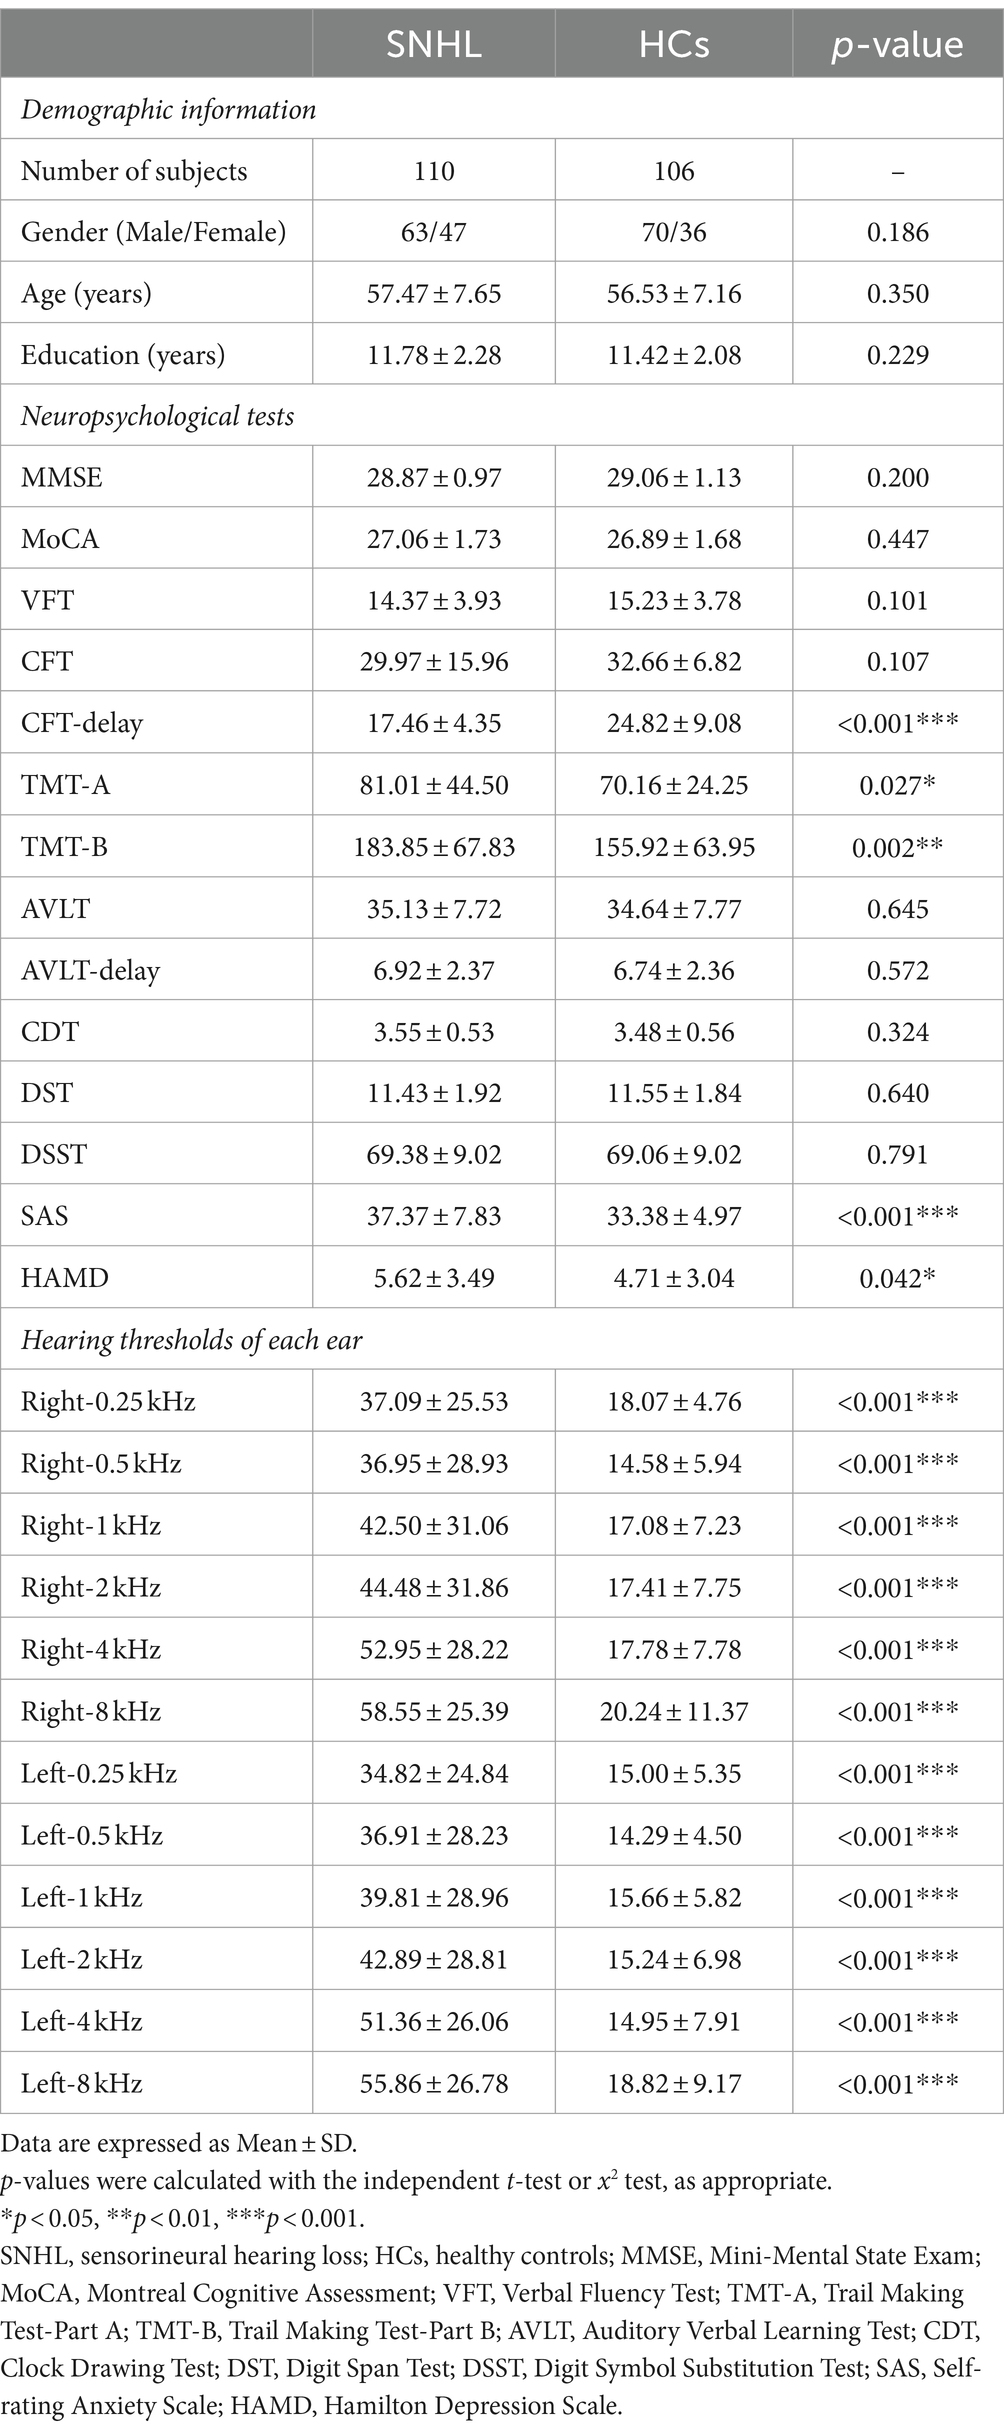
Table 1. Demographic information and clinical characteristics.
Feature selection
In the dynamic analysis with the HMM model, we chose six states, and the HMM inference estimated the time course of each state. As shown in Figure 2, the FO of HMM state 1 with SNHL was significantly increased (p < 0.001), and the FO of HMM states 3 and 6 with SNHL was significantly decreased (p < 0.001). No significance was observed in other states. In addition, the SR of SNHL patients (mean ± SD, 0.08 ± 0.05) was higher than that of HCs (mean ± SD, 0.06 ± 0.05) (p = 0.001), indicating a special pattern of temporal configuration in patients following bilateral hearing deprivation.
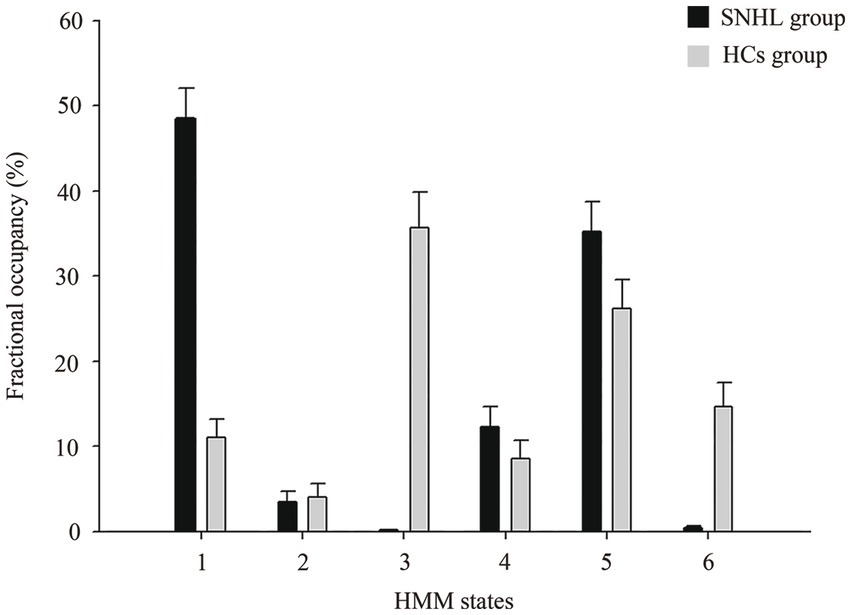
Figure 2. Alterations in fractional occupancies of each state between SNHL and HCs groups using HMM. HMM, hidden Markov model; SNHL, sensorineural hearing loss; HCs, healthy controls.
Among 1,267 imaging features, we computed three methods of feature selection. First, the discriminative regions using Spearman rank correlation in fivefold cross-validation are shown in Figure 3 and Supplementary Table S1, including FO1, FO2, FO4, BDC of the hippocampus (HIP) and ReHo values in the inferior frontal gyrus, orbital part, middle frontal gyrus, orbital part, anterior cingulate gyrus, postcentral gyrus paracentral lobule, inferior parietal lobule, precuneus, superior parietal gyrus, angular gyrus and superior occipital gyrus. Second, selected features using LASSO are summarized in Supplementary Figure S1 and Supplementary Table S2, as static characteristics (including f1ALFF, f2ALFF, ReHo, BDC and WDC) and dynamic features (including FO and NF) were involved here. Third, we applied a t test as well as LASSO to select features, and only dynamic characteristics (NF) were recruited (Supplementary Figure S2 and Supplementary Table S3).

Figure 3. Selected static and dynamic features using spearman in five-fold cross-validation. (A) Fold-1 in ReHo; (B) Fold-2 in ReHo; (C) Fold-3 in ReHo; (D) Fold-3 in BDC; (E) Fold-4 in ReHo; (F) Fold-5 in ReHo. ORBinf, inferior frontal gyrus, orbital part; ORBmid, middle frontal gyrus, orbital part; ACG, anterior cingulate gyrus; PoCG, postcentral gyrus; PCL, paracentral lobule; IPL, inferior parietal lobule, PCUN, precuneus; SPG, superior parietal gyrus; ANG, angular gyrus; SOG, superior occipital gyrus; ANG, angular gyrus; HIP, hippocampus; ReHo, regional homogeneity; BDC,binary degree centrality.
Performance of the classification for SNHL
The ROCs and their AUCs were calculated to compare the classification performance among the four machine learning models. Different SVM models (linear, polynomial, RBF and sigmoid) using selected features by Spearman rank correlation achieved a performance with AUCs of 0.8449, 0.8449, 0.8523, and 0.8539, respectively (Figure 4). Based on static and dynamic features from LASSO analysis, the AUCs of the four SVM models (linear, polynomial, RBF and sigmoid) were 0.8075, 0.7340, 0.8462, and 0.8562, respectively (Supplementary Figure S3). Classification of the results using linear, polynomial, RBF and sigmoid SVM after t test and LASSO analysis were 0.7982, 0.7033, 0.8442, and 0.8412, respectively (Supplementary Figure S4). Detailed information about the performance of the four SVMs based on the three methods of feature selection is shown in Table 2, including AUC, accuracy, sensitivity and specificity. The RBF SVM and sigmoid SVM exhibited relatively high sensitivity and specificity of classification for SNHL.
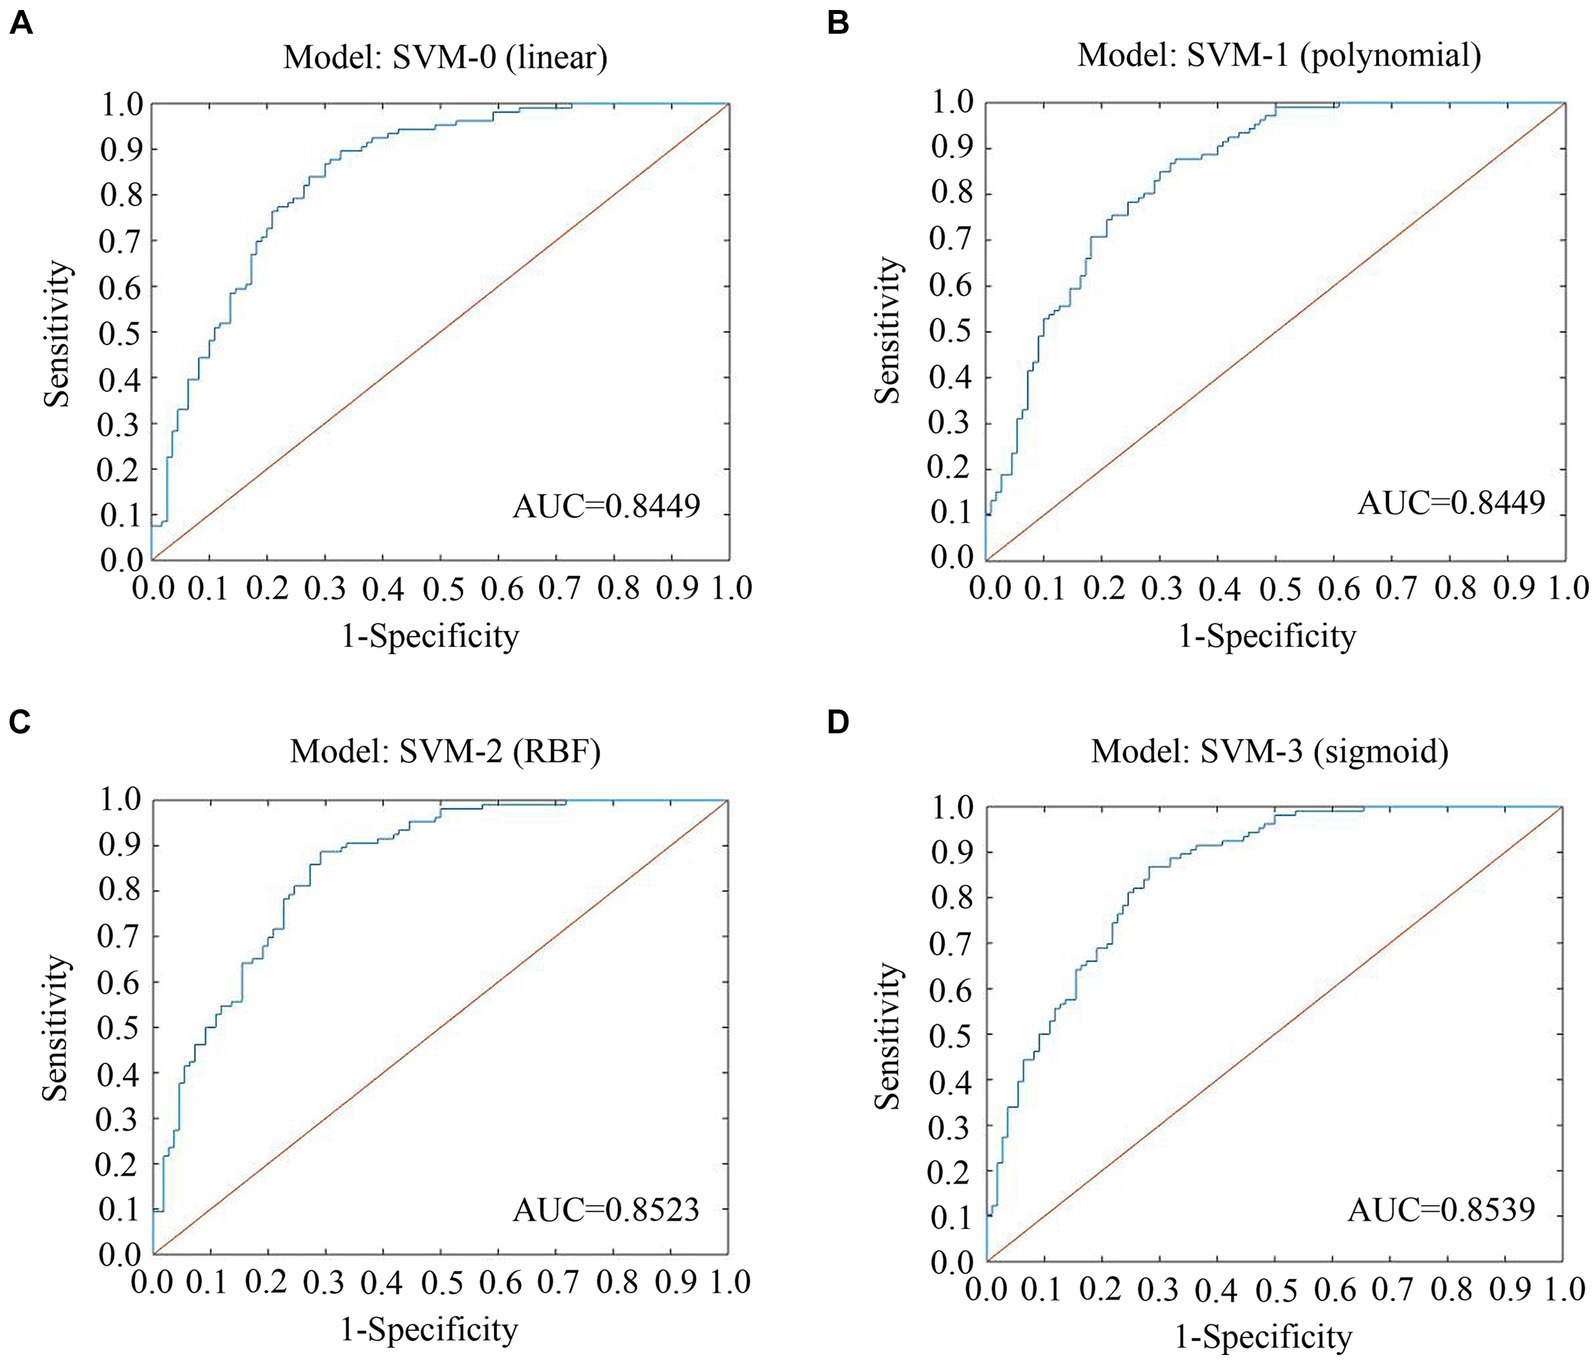
Figure 4. ROC curves and AUCs of the four SVMs using features selected by spearman. (A) Model: SVM-0; (B) Model: SVM-1; (C) Model: SVM-2; (D) Model: SVM-3. ROC, receiver operating characteristic curve; AUC, area under the curve; SVM, support vector machine; LASSO, least absolute shrinkage and selection operator; RBF, radial basis functional kernel.
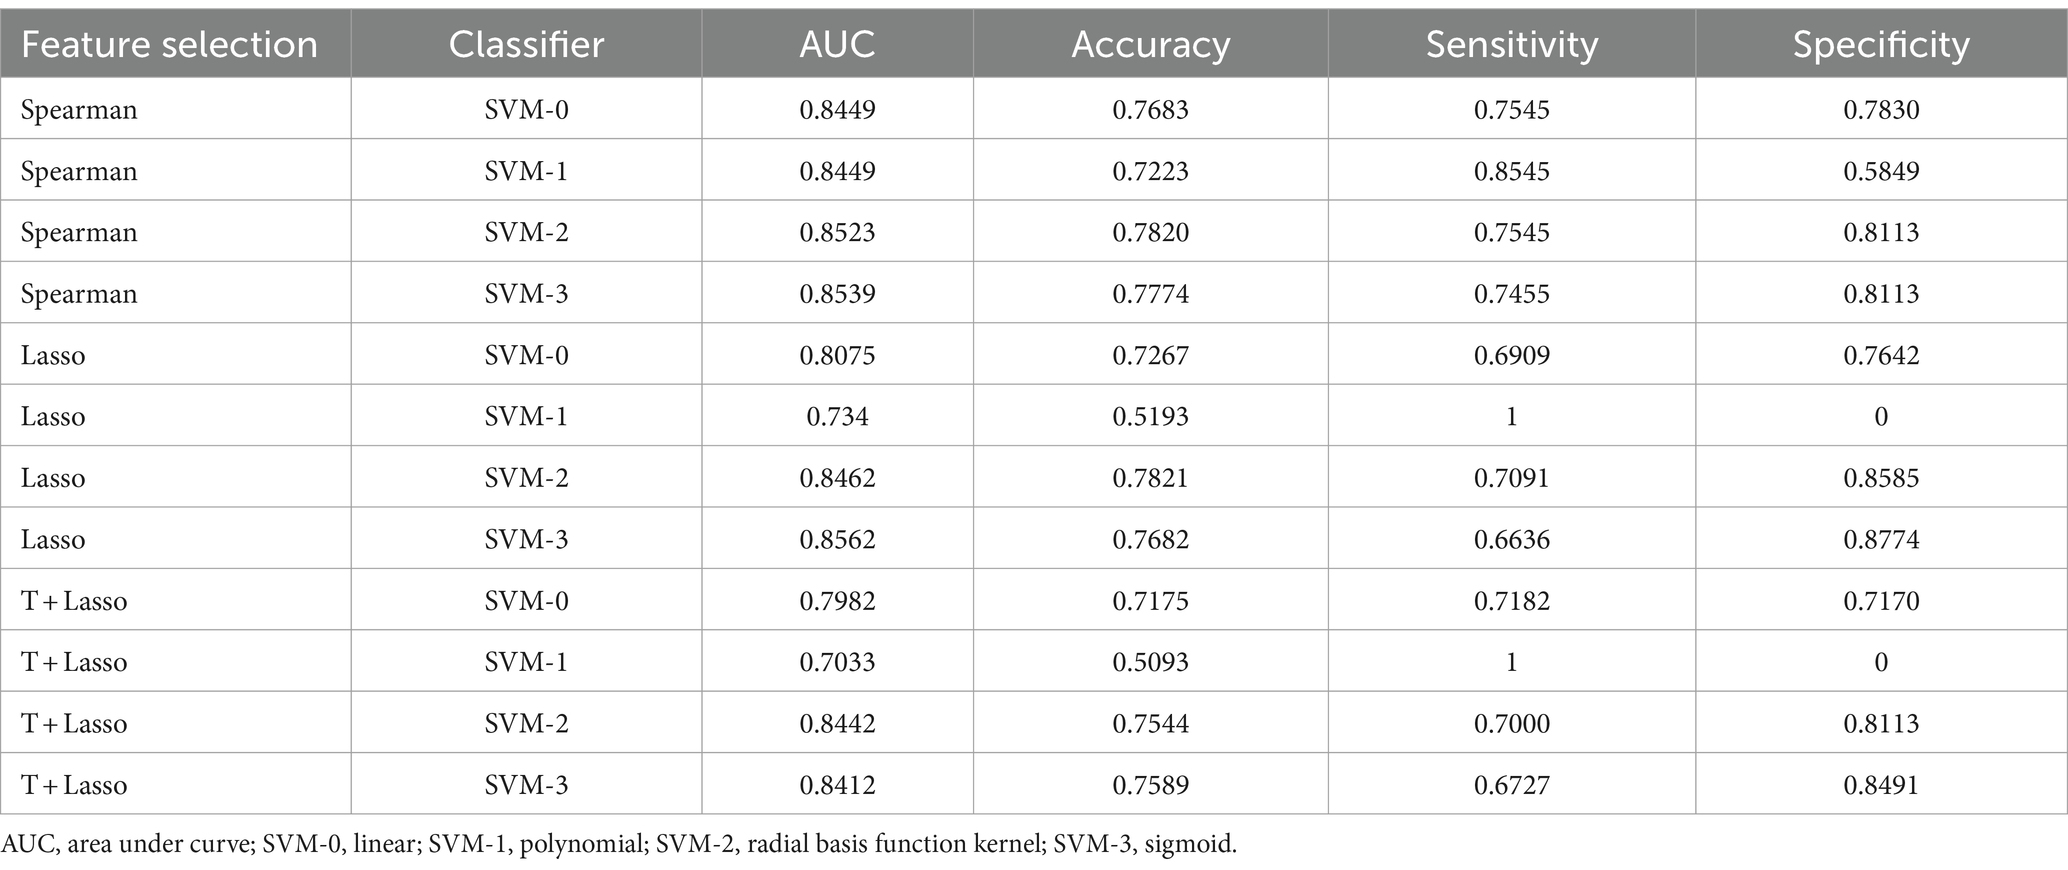
Table 2. Mean value of 5-fold cross-validation using four machine learning algorithms after different methods of feature selection.
Discussion
This study explored temporal patterns of brain function underlying SNHL and apply static and dynamic imaging radiomics features to identify SNHL biomarkers. We systematically analyzed static and dynamic imaging characteristics and applied Spearman rank correlation, LASSO, and t test plus LASSO analysis in feature selection, and then four machine learning models of SVM (linear, polynomial, RBF and sigmoid) were conducted to classify SNHL and HCs.
Machine learning models have been widely used in neuropsychiatric diseases and demonstrated that brain functional alterations had high importance of distinguish patients from controls (Gholipour et al., 2022; Qu et al., 2022). An existing study (Wasmann et al., 2022) based on peer-reviewed literature on machine learning validated the accuracy, reliability and efficiency of the automated PTA test, which is similar to manual audiometry. Machine learning models have been computed to predict hearing recovery following treatment of hearing loss (Bing et al., 2018; Koyama et al., 2021; Uhm et al., 2021). However, these studies mainly focused on clinical and hearing variables and probably ignored the influence of nonauditory symptoms. Crowson et al. used a contemporary machine learning approach to predict risk factors for depression underlying hearing loss using the Patient Health Questionnaire-9 scale (Crowson et al., 2021).
Previous imaging studies used various analysis methods to compare neural activities between SNHL patients and HCs, which were constrained by a priori assumptions at the group level. Our study established data-driven classifier modeling based on imaging features input by SVMs and matching these vectors with outputs, enabling us to distinguish SNHL and HCs at the individual level. SVMs are supervised learning models and can efficiently perform classification and regression (Furey et al., 2000). Using a kernel function, SVM mainly has a two-type classifier that transforms datasets into a higher-dimensional space (linear or nonlinear) (Wang et al., 2022). The linear SVM is the most common type to handle single-parameter issues. The polynomial SVM is used to process imaging data, while the RBF SVM is used when there is no prior information about the data. Moreover, the sigmoid SVM is associated with neural networks (Lee et al., 2021). Our results revealed that the RBF SVM and sigmoid SVM performed better than linear and polynomial SVM, which had relatively higher AUC and accuracy, indicating that these features were nonlinear.
Notably, three methods of feature selection were computed in our research. Taking the AUC, accuracy, sensitivity and specificity of SVM models based on selected features into consideration, we found that characteristics using Spearman rank correlation and LASSO selection had better performance. Similar to a previous study (Wang et al., 2020), we also tried a two-sample t test to explore dynamic alterations for each state, and FO (1,3,6) of the SNHL group showed significance. However, in our data-driven analysis using Spearman rank correlation, FO2 and FO4 were also included in selected features, which was not consistent with the above statistical test, indicating that the type of feature selection might have systematic inaccuracies. Therefore, in LASSO analysis, features of transition patterns between multilayer states based on sliding window and length of step were involved, shedding light on the importance of brain dynamics in the resting state.
Several auditory brain areas were selected as features in our study (Supplementary Figure S1), including the thalamus, temporal pole: superior temporal gyrus, temporal pole: middle temporal gyrus, inferior temporal gyrus, middle temporal gyrus, and superior temporal gyrus, which is consistent with reported studies (Xu et al., 2019a; Persic et al., 2020; Yang et al., 2021). Along with these auditory regions, frontal, parietal and hippocampal features selected in our study overlapped with areas in patients with hearing loss and cognitive impairments (Banaszkiewicz et al., 2021; Ponticorvo et al., 2021; Shen et al., 2021; Ma et al., 2022). Recent research has demonstrated occipital involvement in patients with auditory deprivation, suggestive of cross-modal reorganization (Campbell and Sharma, 2020). Anatomically, the angular gyrus and precuneus belong to the parietal lobule, and the calcarine fissure is part of the visual region. Micareli et al. computed positron emission tomography scanning in sudden SNHL patients, and decreased fluorodeoxyglucose uptake in the precentral, postcentral gyrus and cingulate gyrus as well as the cingulate and insula were observed (Micarelli et al., 2017), since these brain regions were linked to somatosensory and hearing function. Neuroanatomic volume differences (Yousef et al., 2021) and diffusion deficits (Moon et al., 2020) in the caudate nucleus have been detected in hearing loss and tinnitus. Interestingly, the lenticular nucleus was selected as a feature in the present study, although it has not been reported in SNHL in previous findings. The lenticular nucleus is reported as a new center regarding human motion cognitive impairments (Shan et al., 2018), and further work needs to be done to explore its potential role in SNHL.
There are some limitations in our research. First, the sample size is relatively small, and it is an early proof of data-driven analysis which needs to be repeated with a larger dataset to achieve stable efficacy. Second, this study is limited to investigating static and dynamic neural activities. Although we did not find the difference of VBM between SNHL and HCs. Further analysis of diffusion characteristics should be taken into account. Third, the present study was computed to classify SNHL and HCs, and future work could predict the risk of cognitive impairments underlying hearing loss with the combination of multiple clinical and imaging features. Moreover, the severity of hearing loss needs to be considered in further analysis. Finally, multi-connectivity topology and couplings of various states can be included in future feature selection.
In conclusion, three methods of feature selection and four types of machine learning were applied in differentiating SNHL and HCs, and Spearman rank correlation selection with RBF SVM and sigmoid SVM showed better performance. Our research might provide several promising imaging biomarkers for clinical diagnosis and contribute to a better understanding of machine learning approaches to predict the susceptibility to hearing loss.
Data availability statement
The original contributions presented in the study are included in the article/Supplementary material, further inquiries can be directed to the corresponding authors.
Ethics statement
The studies involving humans were approved by the Research Ethics Committee of Nanjing First Hospital. The studies were conducted in accordance with the local legislation and institutional requirements. The participants provided their written informed consent to participate in this study.
Author contributions
YW: Conceptualization, Data curation, Formal analysis, Funding acquisition, Investigation, Writing – original draft. JY: Conceptualization, Investigation, Methodology, Software, Writing – original draft. X-MX: Conceptualization, Investigation, Software, Writing – original draft. L-LZ: Methodology, Resources, Validation, Writing – review & editing. RS: Investigation, Software, Supervision, Validation, Visualization, Writing – review & editing. SD: Methodology, Project administration, Validation, Writing – review & editing. XG: Funding acquisition, Project administration, Resources, Validation, Visualization, Writing – review & editing.
Funding
The author(s) declare that financial support was received for the research, authorship, and/or publication of this article. This study has received funding by Major Program of National Natural Science Foundation of China (82192862), Nanjing Special Fund for Health Science and Technology Development (YKK21133), and Doctoral Program of Entrepreneurship and Innovation in Jiangsu Province (JSSCBS20211544).
Conflict of interest
The authors declare that the research was conducted in the absence of any commercial or financial relationships that could be construed as a potential conflict of interest.
Publisher’s note
All claims expressed in this article are solely those of the authors and do not necessarily represent those of their affiliated organizations, or those of the publisher, the editors and the reviewers. Any product that may be evaluated in this article, or claim that may be made by its manufacturer, is not guaranteed or endorsed by the publisher.
Supplementary material
The Supplementary material for this article can be found online at: https://www.frontiersin.org/articles/10.3389/fnins.2024.1402039/full#supplementary-material
Footnotes
References
Banaszkiewicz, A., Bola, L., Matuszewski, J., Szczepanik, M., Kossowski, B., Mostowski, P., et al. (2021). The role of the superior parietal lobule in lexical processing of sign language: insights from fMRI and TMS. Cortex 135, 240–254. doi: 10.1016/j.cortex.2020.10.025
Bassett, D. S., Wymbs, N. F., Porter, M. A., Mucha, P. J., Carlson, J. M., and Grafton, S. T. (2011). Dynamic reconfiguration of human brain networks during learning. Proc. Natl. Acad. Sci. U.S.A. 108, 7641–7646. doi: 10.1073/pnas.1018985108
Bing, D., Ying, J., Miao, J., Lan, L., Wang, D., Zhao, L., et al. (2018). Predicting the hearing outcome in sudden sensorineural hearing loss via machine learning models. Clin. Otolaryngol. 43, 868–874. doi: 10.1111/coa.13068
Campbell, J., and Sharma, A. (2020). Frontal cortical modulation of temporal visual cross-modal re-organization in adults with hearing loss. Brain Sci. 10:498. doi: 10.3390/brainsci10080498
Chand, G. B., Thakuri, D. S., and Soni, B. (2022). Salience network anatomical and molecular markers are linked with cognitive dysfunction in mild cognitive impairment. J. Neuroimaging 32, 728–734. doi: 10.1111/jon.12980
Chen, F., Cao, Z., Grais, E. M., and Zhao, F. (2021). Contributions and limitations of using machine learning to predict noise-induced hearing loss. Int. Arch. Occup. Environ. Health 94, 1097–1111. doi: 10.1007/s00420-020-01648-w
Collaborators, G. B. D. (2021). Hearing loss prevalence and years lived with disability, 1990-2019: findings from the global burden of Disease study 2019. Lancet 397, 996–1009. doi: 10.1016/S0140-6736(21)00516-X
Crowson, M. G., Franck, K. H., Rosella, L. C., and Chan, T. C. Y. (2021). Predicting depression from hearing loss using machine learning. Ear Hear. 42, 982–989. doi: 10.1097/AUD.0000000000000993
Deco, G., Jirsa, V. K., and McIntosh, A. R. (2011). Emerging concepts for the dynamical organization of resting-state activity in the brain. Nat. Rev. Neurosci. 12, 43–56. doi: 10.1038/nrn2961
Disease, G. B. D., Injury, I., and Prevalence, C. (2018). Global, regional, and national incidence, prevalence, and years lived with disability for 354 diseases and injuries for 195 countries and territories, 1990-2017: a systematic analysis for the global burden of Disease study 2017. Lancet 392, 1789–1858. doi: 10.1016/S0140-6736(18)32279-7
Furey, T. S., Cristianini, N., Duffy, N., Bednarski, D. W., Schummer, M., and Haussler, D. (2000). Support vector machine classification and validation of cancer tissue samples using microarray expression data. Bioinformatics 16, 906–914. doi: 10.1093/bioinformatics/16.10.906
Gholipour, T., You, X., Stufflebeam, S. M., Loew, M., Koubeissi, M. Z., Morgan, V. L., et al. (2022). Common functional connectivity alterations in focal epilepsies identified by machine learning. Epilepsia 63, 629–640. doi: 10.1111/epi.17160
Guan, B., Xu, Y., Chen, Y. C., Xing, C., Xu, L., Shang, S., et al. (2022). Reorganized brain functional network topology in Presbycusis. Front. Aging Neurosci. 14:905487. doi: 10.3389/fnagi.2022.905487
Hou, Z., Kong, Y., He, X., Yin, Y., Zhang, Y., and Yuan, Y. (2018). Increased temporal variability of striatum region facilitating the early antidepressant response in patients with major depressive disorder. Prog. Neuro-Psychopharmacol. Biol. Psychiatry 85, 39–45. doi: 10.1016/j.pnpbp.2018.03.026
Hutchison, R. M., Womelsdorf, T., Allen, E. A., Bandettini, P. A., Calhoun, V. D., Corbetta, M., et al. (2013). Dynamic functional connectivity: promise, issues, and interpretations. NeuroImage 80, 360–378. doi: 10.1016/j.neuroimage.2013.05.079
Kong, Y., Wang, W., Liu, X., Gao, S., Hou, Z., Xie, C., et al. (2023). Multi-connectivity representation learning network for major depressive disorder diagnosis. IEEE Trans. Med. Imaging 42, 3012–3024. doi: 10.1109/TMI.2023.3274351
Koyama, H., Mori, A., Nagatomi, D., Fujita, T., Saito, K., Osaki, Y., et al. (2021). Machine learning technique reveals prognostic factors of vibrant Soundbridge for conductive or mixed hearing loss patients. Otol. Neurotol. 42, e1286–e1292. doi: 10.1097/MAO.0000000000003271
Lee, S. K., Shin, J. H., Ahn, J., Lee, J. Y., and Jang, D. E. (2021). Identifying the risk factors associated with nursing home Residents' pressure ulcers using machine learning methods. Int. J. Environ. Res. Public Health 18:2954. doi: 10.3390/ijerph18062954
Li, Y., Booth, J. R., Peng, D., Zang, Y., Li, J., Yan, C., et al. (2013). Altered intra-and inter-regional synchronization of superior temporal cortex in deaf people. Cereb. Cortex 23, 1988–1996. doi: 10.1093/cercor/bhs185
Li, J., Huang, M., Pan, F., Li, Z., Shen, Z., Jin, K., et al. (2021). Aberrant development of cross-frequency multiplex functional connectome in first-episode, Drug-Naive Major Depressive Disorder and Schizophrenia. Brain Connect.
Lin, C. H., Chen, C. M., Lu, M. K., Tsai, C. H., Chiou, J. C., Liao, J. R., et al. (2013). VBM reveals brain volume differences between Parkinson's Disease and essential tremor patients. Front. Hum. Neurosci. 7:247. doi: 10.3389/fnhum.2013.00247
Lin, P., Zang, S., Bai, Y., and Wang, H. (2022). Reconfiguration of brain network dynamics in autism Spectrum disorder based on hidden Markov model. Front. Hum. Neurosci. 16:774921. doi: 10.3389/fnhum.2022.774921
Luo, X., Li, F., Xu, W., Hong, K., Yang, T., Chen, J., et al. (2021). Machine learning-based genetic diagnosis models for hereditary hearing loss by the GJB2, SLC26A4 and MT-RNR1 variants. EBioMedicine 69:103322. doi: 10.1016/j.ebiom.2021.103322
Ma, X., Li, W., Wang, Q., He, X., Qu, X., Li, T., et al. (2022). Intrinsic network changes associated with cognitive impairment in patients with hearing loss and tinnitus: a resting-state functional magnetic resonance imaging study. Ann. Transl. Med. 10:690. doi: 10.21037/atm-22-2135
Micarelli, A., Chiaravalloti, A., Viziano, A., Danieli, R., Schillaci, O., and Alessandrini, M. (2017). Early cortical metabolic rearrangement related to clinical data in idiopathic sudden sensorineural hearing loss. Hear. Res. 350, 91–99. doi: 10.1016/j.heares.2017.04.011
Moon, P. K., Qian, J. Z., McKenna, E., Xi, K., Rowe, N. C., Ng, N. N., et al. (2020). Cerebral volume and diffusion MRI changes in children with sensorineural hearing loss. Neuroimage Clin. 27:102328. doi: 10.1016/j.nicl.2020.102328
Moretto, M., Silvestri, E., Zangrossi, A., Corbetta, M., and Bertoldo, A. (2022). Unveiling whole-brain dynamics in normal aging through hidden Markov models. Hum. Brain Mapp. 43, 1129–1144. doi: 10.1002/hbm.25714
Olusanya, B. O., Davis, A. C., and Hoffman, H. J. (2019). Hearing loss: rising prevalence and impact. Bull. World Health Organ. 97, 646–646A. doi: 10.2471/BLT.19.224683
Pedersen, M., Zalesky, A., Omidvarnia, A., and Jackson, G. D. (2018). Multilayer network switching rate predicts brain performance. Proc. Natl. Acad. Sci. USA 115, 13376–13381. doi: 10.1073/pnas.1814785115
Persic, D., Thomas, M. E., Pelekanos, V., Ryugo, D. K., Takesian, A. E., Krumbholz, K., et al. (2020). Regulation of auditory plasticity during critical periods and following hearing loss. Hear. Res. 397:107976. doi: 10.1016/j.heares.2020.107976
Ponticorvo, S., Manara, R., Pfeuffer, J., Cappiello, A., Cuoco, S., Pellecchia, M. T., et al. (2021). Long-range auditory functional connectivity in hearing loss and rehabilitation. Brain Connect. 11, 483–492. doi: 10.1089/brain.2020.0814
Qu, G., Hu, W., Xiao, L., Wang, J., Bai, Y., Patel, B., et al. (2022). Brain functional connectivity analysis via graphical deep learning. I.E.E.E. Trans. Biomed. Eng. 69, 1696–1706. doi: 10.1109/TBME.2021.3127173
Shan, Y., Jia, Y., Zhong, S., Li, X., Zhao, H., Chen, J., et al. (2018). Correlations between working memory impairment and neurometabolites of prefrontal cortex and lenticular nucleus in patients with major depressive disorder. J. Affect. Disord. 227, 236–242. doi: 10.1016/j.jad.2017.10.030
Shen, Y., Hu, H., Fan, C., Wang, Q., Zou, T., Ye, B., et al. (2021). Sensorineural hearing loss may lead to dementia-related pathological changes in hippocampal neurons. Neurobiol. Dis. 156:105408. doi: 10.1016/j.nbd.2021.105408
Shew, M., New, J., Wichova, H., Koestler, D. C., and Staecker, H. (2019). Using machine learning to predict sensorineural hearing loss based on perilymph Micro RNA expression profile. Sci. Rep. 9:3393. doi: 10.1038/s41598-019-40192-7
Shi, Y., Zhang, L., Wang, Z., Lu, X., Wang, T., Zhou, D., et al. (2021). Multivariate machine learning analyses in identification of major depressive disorder using resting-state functional connectivity: a multicentral study. ACS Chem. Neurosci. 12, 2878–2886. doi: 10.1021/acschemneuro.1c00256
Shin, N. Y., Bang, M., Yoo, S. W., Kim, J. S., Yun, E., Yoon, U., et al. (2021). Cortical thickness from MRI to predict conversion from mild cognitive impairment to dementia in Parkinson Disease: a machine learning-based model. Radiology 300, 390–399. doi: 10.1148/radiol.2021203383
Stevner, A. B. A., Vidaurre, D., Cabral, J., Rapuano, K., Nielsen, S. F. V., Tagliazucchi, E., et al. (2019). Discovery of key whole-brain transitions and dynamics during human wakefulness and non-REM sleep. Nat. Commun. 10:1035. doi: 10.1038/s41467-019-08934-3
Tordrup, D., Smith, R., Kamenov, K., Bertram, M. Y., Green, N., Chadha, S., et al. (2022). Global return on investment and cost-effectiveness of WHO's HEAR interventions for hearing loss: a modelling study. Lancet Glob. Health 10, e52–e62. doi: 10.1016/S2214-109X(21)00447-2
Uhm, T., Lee, J. E., Yi, S., Choi, S. W., Oh, S. J., Kong, S. K., et al. (2021). Predicting hearing recovery following treatment of idiopathic sudden sensorineural hearing loss with machine learning models. Am. J. Otolaryngol. 42:102858. doi: 10.1016/j.amjoto.2020.102858
Wang, X., Cui, X., Ding, C., Li, D., Cheng, C., Wang, B., et al. (2021). Deficit of cross-frequency integration in mild cognitive impairment and Alzheimer's Disease: a multilayer network approach. J. Magn. Reson. Imaging 53, 1387–1398. doi: 10.1002/jmri.27453
Wang, H., Sheng, L., Xu, S., Jin, Y., Jin, X., Qiao, S., et al. (2022). Develop a diagnostic tool for dementia using machine learning and non-imaging features. Front. Aging Neurosci. 14:945274. doi: 10.3389/fnagi.2022.945274
Wang, S., Wen, H., Hu, X., Xie, P., Qiu, S., Qian, Y., et al. (2020). Transition and dynamic reconfiguration of whole-brain network in major depressive disorder. Mol. Neurobiol. 57, 4031–4044. doi: 10.1007/s12035-020-01995-2
Wasmann, J. W., Pragt, L., Eikelboom, R., and Swanepoel, W. (2022). Digital approaches to automated and machine learning assessments of hearing: scoping review. J. Med. Internet Res. 24:e32581. doi: 10.2196/32581
Xu, X. M., Jiao, Y., Tang, T. Y., Zhang, J., Lu, C. Q., Luan, Y., et al. (2019a). Dissociation between cerebellar and cerebral neural activities in humans with Long-term bilateral sensorineural hearing loss. Neural Plast. :8354849. doi: 10.1155/2019/8354849
Xu, X. M., Jiao, Y., Tang, T. Y., Zhang, J., Lu, C. Q., Salvi, R., et al. (2019b). Sensorineural hearing loss and cognitive impairments: contributions of thalamus using multiparametric MRI. J. Magn. Reson. Imaging 50, 787–797. doi: 10.1002/jmri.26665
Yang, F., Li, Y., Han, Y., and Jiang, J. (2020). Use of multilayer network modularity and spatiotemporal network switching rate to explore changes of functional brain networks in Alzheimer's disease. Annu. Int. Conf. IEEE Eng. Med. Biol. Soc. 2020, 1104–1107. doi: 10.1109/EMBC44109.2020.9175257
Yang, T., Liu, Q., Fan, X., Hou, B., Wang, J., and Chen, X. (2021). Altered regional activity and connectivity of functional brain networks in congenital unilateral conductive hearing loss. Neuroimage Clin. 32:102819. doi: 10.1016/j.nicl.2021.102819
Yousef, A., Hinkley, L. B., Nagarajan, S. S., and Cheung, S. W. (2021). Neuroanatomic volume differences in tinnitus and hearing loss. Laryngoscope 131, 1863–1868. doi: 10.1002/lary.29549
Zeng, M., Yu, M., Qi, G., Zhang, S., Ma, J., Hu, Q., et al. (2021). Concurrent alterations of white matter microstructure and functional activities in medication-free major depressive disorder. Brain Imaging Behav. 15, 2159–2167. doi: 10.1007/s11682-020-00411-6
Keywords: sensorineural hearing loss, functional imaging, static features, dynamic features, machine learning
Citation: Wu Y, Yao J, Xu X-M, Zhou L-L, Salvi R, Ding S and Gao X (2024) Combination of static and dynamic neural imaging features to distinguish sensorineural hearing loss: a machine learning study. Front. Neurosci. 18:1402039. doi: 10.3389/fnins.2024.1402039
Edited by:
Zhenyu Xiong, Rutgers, The State University of New Jersey, United StatesCopyright © 2024 Wu, Yao, Xu, Zhou, Salvi, Ding and Gao. This is an open-access article distributed under the terms of the Creative Commons Attribution License (CC BY). The use, distribution or reproduction in other forums is permitted, provided the original author(s) and the copyright owner(s) are credited and that the original publication in this journal is cited, in accordance with accepted academic practice. No use, distribution or reproduction is permitted which does not comply with these terms.
*Correspondence: Xia Gao, eGlhZ2FvZ2FvQGhvdG1haWwuY29t; Shaohua Ding, dHpfZHNoQDE2My5jb20=