 Vivek Verma
 Kyle A. Denniston
 Christopher J. Lin3
 Chi Lin
- 1Department of Radiation Oncology, University of Nebraska Medical Center, Omaha, NE, USA
- 2Department of Radiation Oncology, St. Peter’s Health Partners, Albany, NY, USA
- 3Creighton Preparatory School, Omaha, NE, USA
Purpose: This study sought to identify differences in clinical characteristics, outcomes, and treatments between adult and pediatric patients with the Ewing sarcoma family of tumors (ESFT).
Methods: By using the Surveillance, Epidemiology, and End Results database from 1983 to 2013, 1,870 patients were analyzed (n = 976 pediatric, n = 894 adult). Between the two groups, demographic, tumor, and treatment characteristics were collated and compared. The chi-square test determined differences in proportions of the variables between groups. Survival analysis was performed using the Kaplan–Meier method; distributions were compared using the log-rank test. Univariate and multivariate analyses were performed to examine variables correlating with overall survival (OS), the primary endpoint.
Results: Adult patients had a poorer prognosis and were more likely to present with primitive neuroectodermal tumor (PNET) histology, along with distant metastasis and soft tissue primary site. In patients undergoing surgery, radiation therapy (RT) was not associated with higher OS in either children or adults. If no surgery was performed, receipt of RT was associated with higher OS in adults but not children. Adulthood negatively correlated with OS on multivariate analysis when adjusting for potential confounding factors. Other salient factors associated with OS were male gender, metastatic disease, non-extremity bone location, treatment era, and PNET histology. However, when examining the most recent subset (patients treated from 2004 to 2013), RT was associated with improved OS in both pediatrics and adults, which was an independent predictor on multivariate analysis.
Conclusion: Adult patients with ESFT have inferior survival compared to pediatric patients, likely related to earlier clinical detection in the latter.
Introduction
The Ewing sarcoma family of tumors (ESFT) comprises a group of small, round, blue cell neoplasms that primarily affect the skeleton in adolescent children. The incidence is approximately 2.8 per million in the United States and has remained relatively stable over the past few decades (1). ESFT often amalgamates both Ewing sarcoma and primitive neuroectodermal tumors (PNETs), owing to similar histology, treatment, and outcome (2). PNETs are overall uncommon neoplasms that are thought to have a similar stem cell of origin as Ewing sarcoma, and thus, the treatment and outcomes of both are thought to be correlated (2). Both are also unified by the presence of the EWS–ETS fusion protein. However, although both Ewing sarcoma and PNET arise from neuroectoderm, PNET histopathologically display more developed cytological features of neural cells. Poor prognostic factors for ESFT include axial location, larger tumor size/volume, presence of metastatic disease, male gender, and older age (3–8).
The Ewing sarcoma family of tumors uncommonly occurs in adults, although the line that distinguishes the ages of adolescent children and adults is often blurred. Studies often define “adult” patients as 16 years or older, which may be inconsistent with other studies and/or provide a misrepresentation of the patient population (9). Currently, there are no studies using population-based databases that examine differential clinical factors between pediatric and adult cohorts. It is unlikely that prospective studies, or even comparatively large retrospective cohorts, would be able to accumulate large volumes of patients of adult ESFTs to permit robust conclusions.
Therefore, analyses of large population-based databases such as the Surveillance, Epidemiology, and End Results (SEER) database are valuable for these uncommon cases. The objective of this study was to compare clinical characteristics of pediatric (≤18 years) vs. adult (>18 years) ESFTs, impact of surgery and radiation therapy (RT) on both groups, and factors associated with overall survival (OS).
Materials and Methods
To analyze large volumes of patients with ESFT, we utilized the SEER registry, which encompasses an estimated 28% of the US population, including minority populations (10). The patient population was assembled using the histology codes 9260, 9364, or 9365. A total of 1,870 patients from 1983 to 2013 were selected for analysis, 976 of which were pediatric cases (≤18 years) and 894 adult cases (>18 years). All the cases with missing data were included in efforts to avoid biases.
Between the two groups, demographic, tumor, and treatment characteristics were then collated and compared. Receipt of RT was coded as external-beam, radioactive implants, or radioisotopes; cancer-directed surgery referred to local tumor excision, amputation, or surgical therapy not otherwise specified. Both were similar to existing SEER publications in this tumor type (11, 12). All statistical calculations were performed using SAS version 9.4 (SAS Institute Inc., Cary, NC, USA), and p < 0.05 was considered statistically significant. The chi-square test was used to compare the differences in proportions for the baseline clinical characteristics between groups. Survival analysis was carried out using the Kaplan–Meier method, and distributions were compared using the log-rank test. For OS, events were defined as death from any cause. For cancer-specific survival (CSS), events were defined as death from cancer. Deaths from all other reasons and those alive at the time of analysis were censored. Univariate analysis was performed to identify factors associated with the primary endpoint, OS. Hazard ratios (HRs) and 95% confidence intervals (CIs) were calculated using Cox proportional hazards regression. To adjust for potential confounding variables, multivariate analysis was done. Only the variables positively associated with OS in the univariate analysis were elected for multivariable adjusted models (p ≤ 0.05 as a cutoff).
Results
In the entire cohort (n = 1,870), median survival was 103 months (95% CI 78–145); 5- and 10-year OS were 55 and 49%, respectively. Median CSS was 143 months (95% CI 99–258); 5- and 10-year CSS were 57 and 51%, respectively.
Table 1 displays clinical parameters of both pediatric (n = 976) and adult (n = 894) populations. In short, adult patients were more likely to present with distant metastasis (DM), soft tissue primary site, and PNET histology.
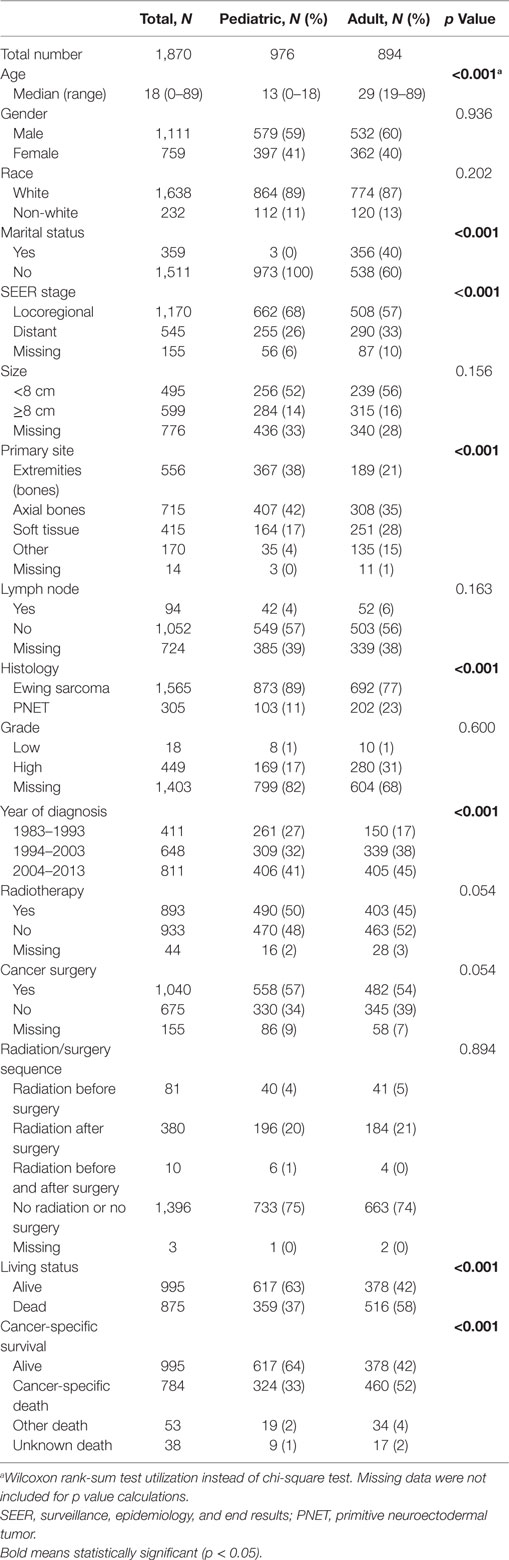
Table 1. Clinical characteristics of the entire population as well as pediatric and adult subsets.
Adult patients with ESFT had a worse prognosis (5-year OS of 43% for adult vs. 66% for pediatrics, log-rank p < 0.001) (Figure 1). In both patient cohorts, surgery was associated with a large magnitude of OS improvement (Figure 2). When stratified by receipt of surgery, adults had worse 5-year OS, both with (56 vs. 73%, log-rank p < 0.001) and without surgery (25 vs. 57%, log-rank p < 0.001) (Figure 2). In patients without surgery, RT was associated with improved OS (Figure 3). However, in patients who had surgery, RT failed to improve OS (Figure 3).
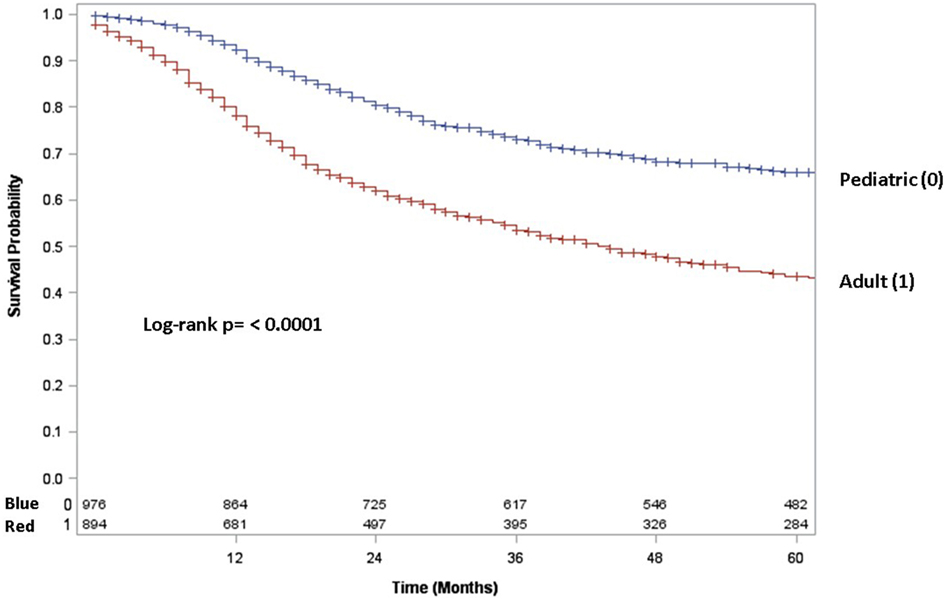
Figure 1. Overall survival in pediatric (blue line) vs. adult (red line) patients.
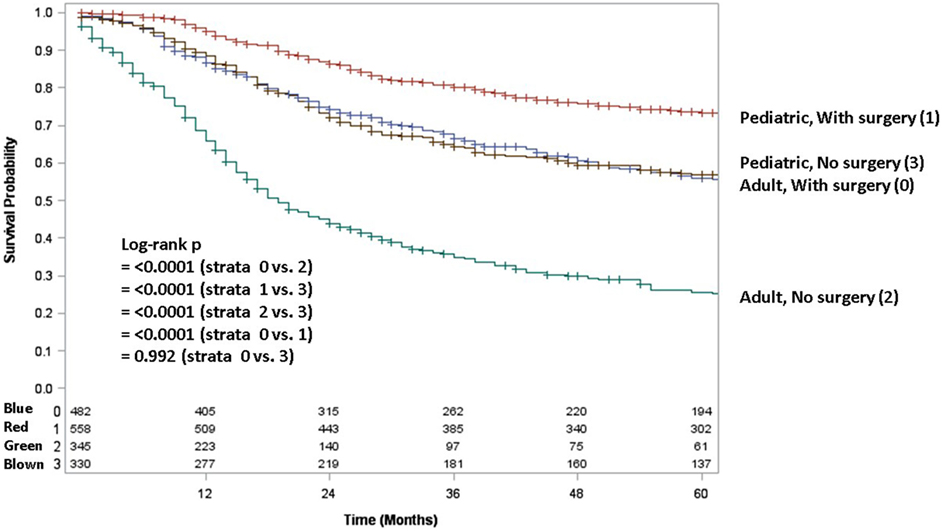
Figure 2. Overall survival in pediatric and adult patients as stratified by receipt of surgery. Red line denotes pediatric patients undergoing surgery; brown line pediatric patients without surgery; blue line adult patients undergoing surgery; green line adult patients without surgery.
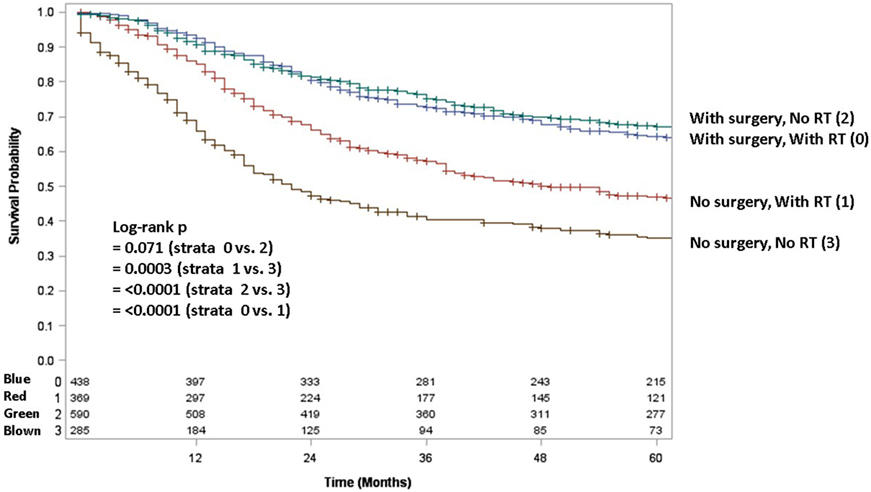
Figure 3. Overall survival in pediatric and adult patients with and without surgery as stratified by receipt of radiotherapy. Green line denotes surgery alone; blue line surgery and radiotherapy; red line radiotherapy alone; brown line neither surgery nor radiotherapy.
Table 2 displays univariate and multivariate analyses of factors associated with OS in the whole cohort. Adulthood conferred an independent association with worse OS on multivariate analysis. Other salient factors associated with OS were male gender, metastatic disease, non-extremity bone location, and PNET histology. Of note, receipt of RT was not correlated in itself or with respect to surgery. In addition, OS was increased with diagnosis/treatment in recent years compared to the past, likely owing to better techniques and therapies. When examining pediatric (Table 3) and adult (Table 4) patients separately with multivariate analysis of factors associated with OS, similar parameters were identified in both groups. Notably, gender was a factor in adult but not pediatric patients.
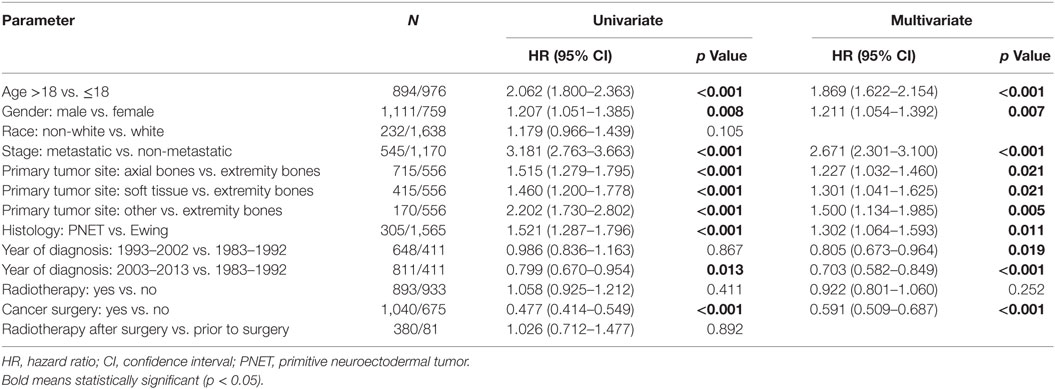
Table 2. Univariate and multivariate analyses of factors associated with overall survival.
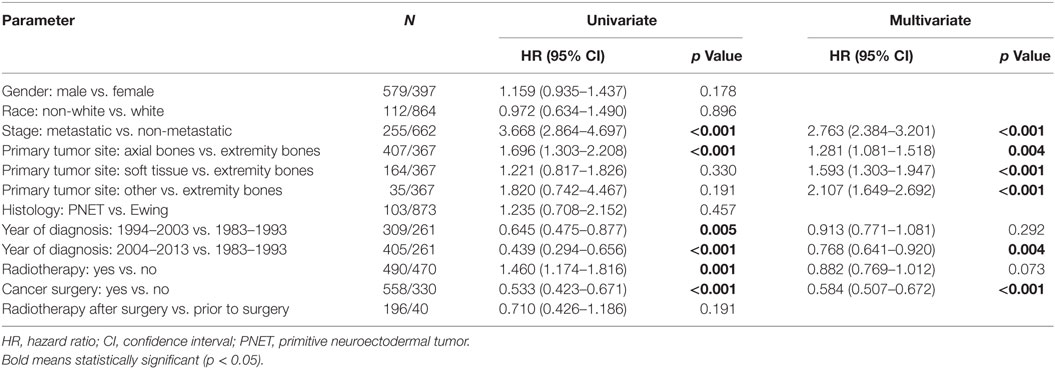
Table 3. Univariate and multivariate analyses of factors associated with overall survival in pediatric patients.
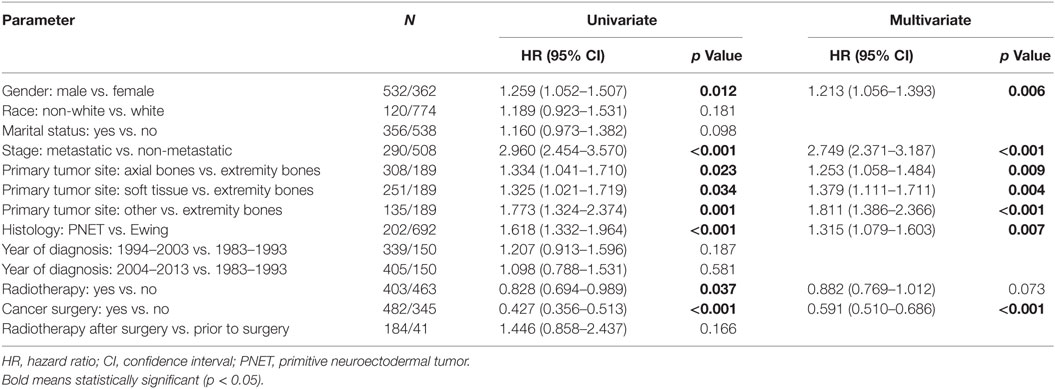
Table 4. Univariate and multivariate analyses of factors associated with overall survival in adult patients.
Because testing for the EWS/FLI translocation became available in the mid to late 1990s, we sought to further investigate the subset treated in the most recent decade (2004–2013), during which the most modern paradigms of diagnosis and treatment were most likely to be utilized. Table 5 (analogous to Table 1) displays similar comparisons between pediatric and adult groups, although notably, receipt of RT was no longer statistically significant. When comparing survival in this cohort, there were similar conclusions (e.g., adults had poorer prognosis and surgery improved survival), with one exception. In the overall cohort of patients (Figure 4), RT did not improve OS in adults and was associated with worse OS in pediatrics; the same was not true in the most modern subset (Figure 5). There was no statistical difference in OS with or without RT in pediatric patients; moreover, adults receiving RT had such with a significant improvement in OS. Tables 6–8 (analogous to Tables 2–4) illustrate that RT was independently associated with OS in all patients as well as adult and pediatric subsets separately. Of note, this difference was observed only on multivariate analysis (non-significant on univariate analysis), potentially relating to interaction with factors that were significant on univariate but non-significant on multivariate analysis (e.g., some comparisons of primary site).
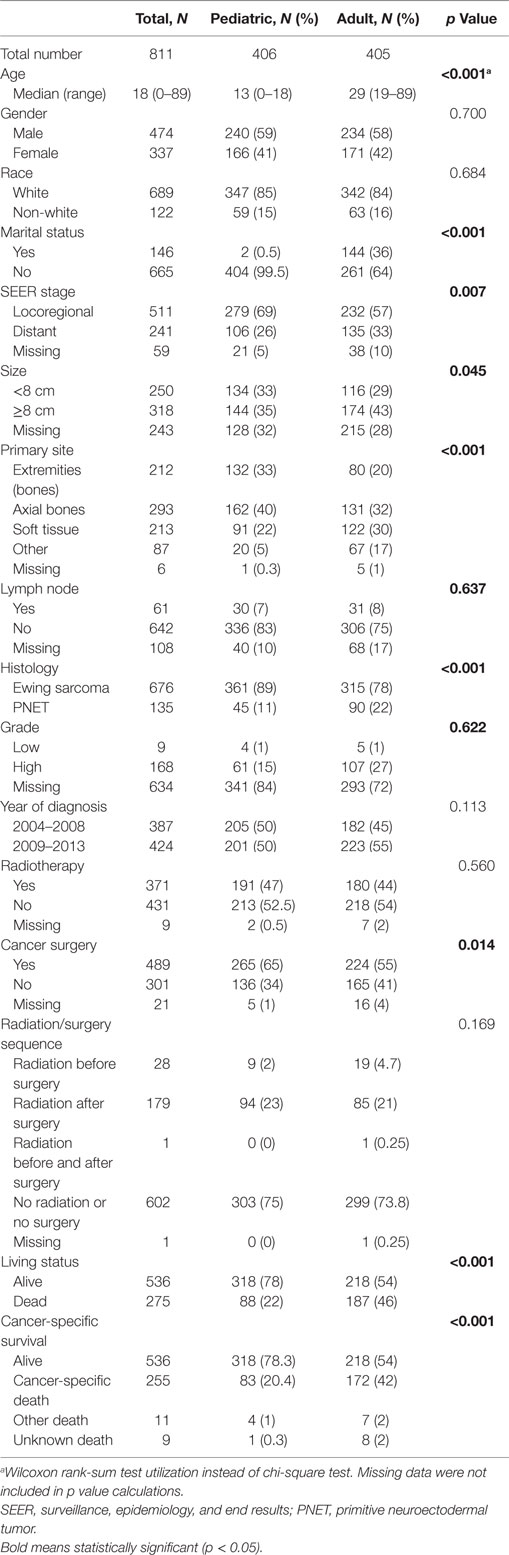
Table 5. Clinical characteristics of the entire population from 2004 to 2013 as well as pediatric and adult subsets.
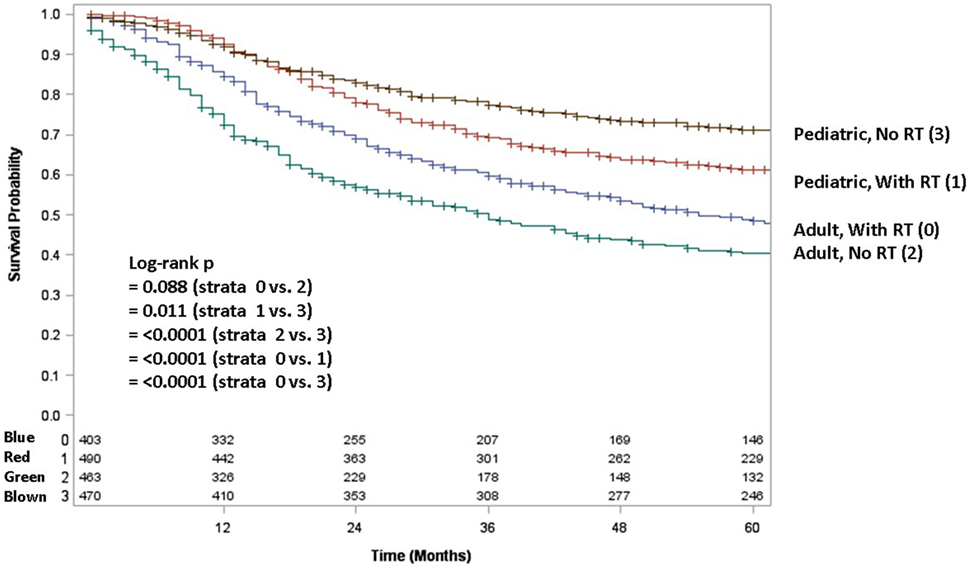
Figure 4. Overall survival in pediatric and adult patients without surgery as stratified by receipt of radiotherapy. Brown line denotes pediatric patients without radiotherapy; red line pediatric patients undergoing radiotherapy; blue line adult patients undergoing radiotherapy; green line adult patients without radiotherapy.
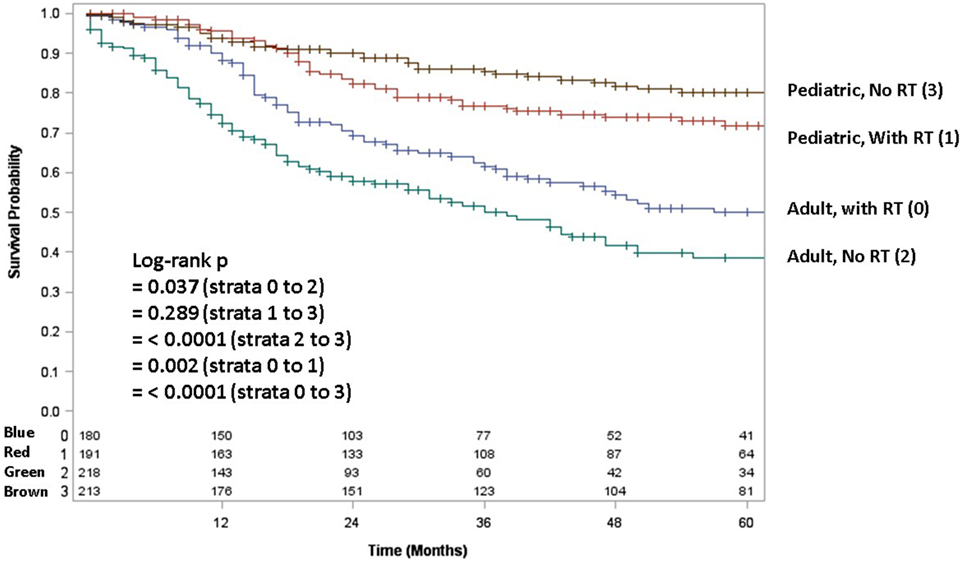
Figure 5. In the 2004–2013 cohort, overall survival in pediatric and adult patients as stratified by receipt of radiotherapy. Brown line denotes pediatric patients without radiotherapy; red line pediatric patients undergoing radiotherapy; blue line adult patients undergoing radiotherapy; green line adult patients without radiotherapy.
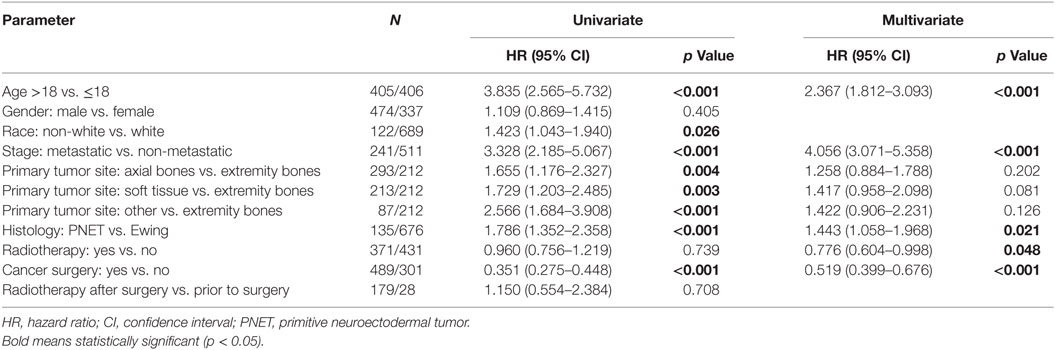
Table 6. Of the 2004–2013 cohort, univariate and multivariate analyses of factors associated with overall survival.
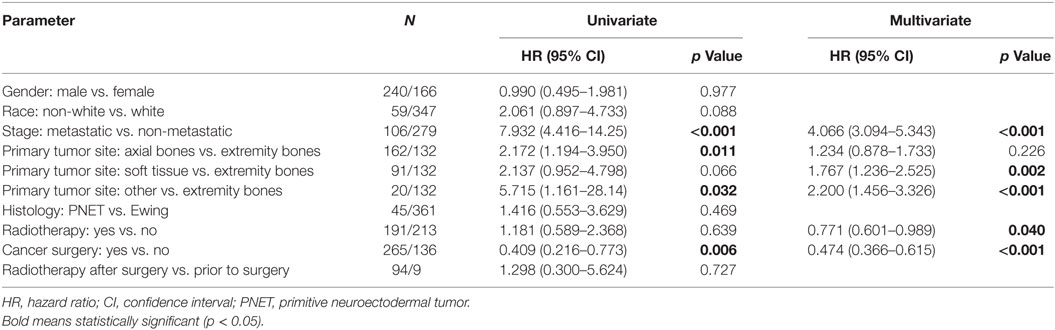
Table 7. Of the 2004–2013 cohort, univariate and multivariate analyses of factors associated with overall survival in pediatric patients.
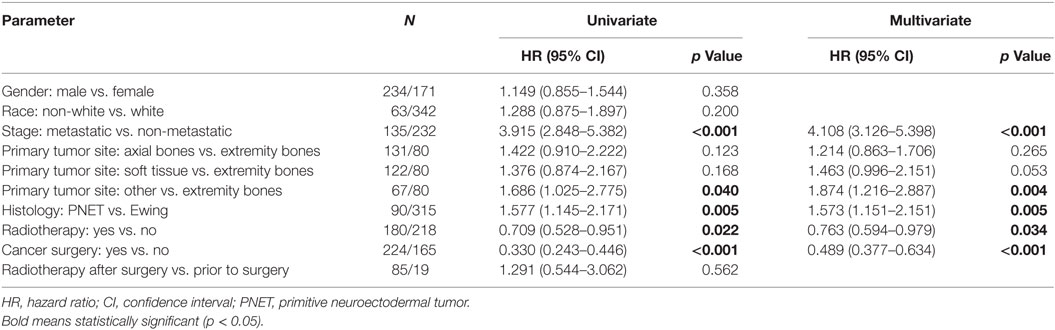
Table 8. Of the 2004–2013 cohort, univariate and multivariate analyses of factors associated with overall survival in adult patients.
Discussion
Despite some small studies that have claimed no differences between the behavior of ESFTs in children and adults (2), the use of a national database with large volumes determines that there are important differences. We determine clinical characteristics that are differentially associated with adult ESFT, describe which populations radiotherapy may benefit, and describe parameters associated with OS in ESFTs regardless of age.
Our results are similar to other data in that metastatic disease, treatment era, location, gender, and age are linked with OS (3–8). Although our study details characteristics of adult and pediatric subpopulations in a high-volume manner, work with smaller sample sizes has confirmed that prognosis in adults is poorer (13). We demonstrate that receipt of surgery is of utmost importance, whereas RT was not associated with improved outcomes in the pediatric population. It is, however, likely that there are several other pieces of information that may explain these findings. First, the lack of chemotherapy information and time to treatment are major limitations of the SEER database, and some have posited that the higher doses of chemotherapy given to children as well as earlier treatment initiation may substantially impact outcomes (13). Second, it is also likely that those patients receiving RT in any capacity may be a preselected population more likely to have poorer disease characteristics such as larger tumor size, unresectable location, and/or incomplete resection. As such, a proper comparison of both modalities remains undefined. Third, because adults were more likely to have metastatic disease and larger tumors, it is also likely that these tumors are clinically detected earlier in children than adults.
Additionally, it is compelling that the most recent subset (2004–2013) disputes many of the conclusions made in the general population of patients, indicating that perhaps modern treatment paradigms may select for RT patients in a better manner, together with improved surgical techniques and potentially even systemic therapy.
Supporting these data is institutional work from the Univer-sity of Toronto (13) analyzing 53 patients receiving VAC-IE che-motherapy. The goal of the study is to compare outcomes between pediatric (n = 29, defined as <18 years) and adult (n = 24, ≥18 years) cohorts. Adult patients, who experienced worse OS, tended to receive lower doses of IE chemotherapy and received local therapy at a later time point than pediatric counterparts; the latter independently predicted for OS on multivariate analysis. Hence, although the authors concluded that adults have poorer OS than children, the report served to show that other factors not assessed by the majority of this and similar studies (e.g., time to local therapy) could be novel prognostic factors for survival.
Overall, prognostic factors in adults and children seem to be a difficult issue to address (3, 6). In adults, these included metastasis at diagnosis and pelvic primary tumor. In children, stage independently predicted survival; larger tumors and disease at axial locations were more likely to present with metastatic disease. Thus, although mirrored well by this study in context of other data, in none of these studies has causation been implied; likely, there are an interconnected set of factors that collectively lead to poor prognosis.
There are several limitations of our analysis. In addition to the inherently retrospective nature of SEER studies as well as individualized follow-up, it must be once again prominently mentioned that causation can neither be stated nor implied with these data, especially regarding treatment interventions and survival. The SEER database also does not allow for information regarding chemotherapy, surgical margins, pathological confirmation (e.g., identifying whether a few tumors were indeed low-grade Ewing sarcomas, which would be exceedingly rare), and radiation doses. In addition, the missing values for several parameters in Table 1 prevent robust conclusions even though the groups may differ based on statistical tests (likely owing to the number of unknown values). In addition, selection bias for any patient receiving surgery (or extent of surgery) can never be ruled out, as mentioned above. Moreover, confounding items such as era of treatment (especially since newer paradigms independently correlate with increased OS) are a necessary limitation that must be accepted to accumulate sufficient sample sizes. Even the inclusion of patients treated a decade ago likely encompasses a cohort with worse OS than those treated in the present decade. The diagnosis of Ewing sarcoma based on EWS/FLI translocation becoming available in the mid-1990s may also be a confounder, but to assure high volumes of patients concordant with prior studies, a facet unique to the SEER database, we opted to include all treatment eras (7, 11, 12).
Going forward, it must be recognized that there are age-based subgroups of adult and pediatric cohorts that may offer further elucidation. For instance, the majority of the adult cohort in this study was predictably skewed toward younger patients, with few who were of middle and advanced age. The role of various treatment paradigms in these subgroups is uncertain. Similarly, the infant (<12 months) subgroup has been studied as another example, determining a potential increase in early death but similar OS (14). In addition, studying a large-volume cohort of ESFTs treated in the present decade using the most modern surgical techniques, chemotherapy regimens, and radiotherapy technologies [including proton beam therapy (15, 16)] is of great necessity to determine that the results presented herein are accurate and representative of modern treatment paradigms.
Conclusion
In our high-volume comparison of pediatric vs. adult ESFT patients, adult patients had a poorer prognosis and were more likely to present with PNET histology, along with DM and soft tissue primary site. When adjusting for potential confounders on multivariate analysis, adult patients were independently associated with worse OS, along with male gender, metastatic disease, non-extremity bone location, treatment era, and PNET histology.
Ethics Statement
This study was deemed exempt from the Institutional Review Board of the University of Nebraska Medical Center and Ethics Committee on account of no patient identifiers in a national, public database; there were no patients participating in the study.
Author Contributions
KD obtained data, CJL performed data analysis, VV wrote the manuscript, and CL conceived of the study and performed supervisory roles. All the authors read, reviewed, and approved the manuscript.
Conflict of Interest Statement
The authors declare that the research was conducted in the absence of any commercial or financial relationships that could be construed as a potential conflict of interest.
Acknowledgments
A portion of this study was presented in part at the 54th Annual Meeting of the American Society for Radiation Oncology, October 28–November 1, 2012.
Funding
There was no funding for this study.
References
1. Esiashvili N, Goodman M, Marcus RB Jr. Changes in incidence and survival of Ewing sarcoma patients over the past 3 decades: surveillance, epidemiology, and end results data. J Pediatr Hematol Oncol (2008) 30:425–30. doi: 10.1097/MPH.0b013e31816e22f3
2. Verrill MW, Judson IR, Harmer CL, Fisher C, Thomas JM, Wiltshaw E. Ewing’s sarcoma and primitive neuroectodermal tumor in adults: are they different from Ewing’s sarcoma and primitive neuroectodermal tumor in children? J Clin Oncol (1997) 17:2611–21. doi:10.1200/JCO.1997.15.7.2611
3. Fizazi K, Dohollou N, Blay JY, Guérin S, Le Cesne A, André F, et al. Ewing’s family of tumors in adults: multivariate analysis of survival and long-term results of multimodality therapy in 182 patients. J Clin Oncol (1998) 16:3736–43. doi:10.1200/JCO.1998.16.12.3736
4. Cotterill SJ, Ahrens S, Paulussen M, Jürgens HF, Voûte PA, Gadner H, et al. Prognostic factors in Ewing’s tumor of bone: analysis of 975 patients from the European Intergroup Cooperative Ewing’s Sarcoma Study Group. J Clin Oncol (2000) 18:3108–14. doi:10.1200/JCO.2000.18.17.3108
5. Oberlin O, Deley MC, Bui BN, Gentet JC, Philip T, Terrier P, et al. Prognostic factors in localized Ewing’s tumours and peripheral neuroectodermal tumours: the third study of the French Society of Paediatric Oncology (EW88 study). Br J Cancer (2001) 85:1646–54. doi:10.1054/bjoc.2001.2150
6. Rodriguez-Galindo C, Liu T, Krasin MJ, Wu J, Billups CA, Daw NC, et al. Analysis of prognostic factors in Ewing sarcoma family of tumors: review of St. Jude children’s research hospital studies. Cancer (2007) 110:375–84. doi:10.1002/cncr.22821
7. Duchman KR, Gao Y, Miller BJ. Prognostic factors for survival in patients with Ewing’s sarcoma using the surveillance, epidemiology, and end results (SEER) program database. Cancer Epidemiol (2015) 39:189–95. doi:10.1016/j.canep.2014.12.012
8. Karski EE, McIlvaine E, Segal MR, Krailo M, Grier HE, Granowetter L, et al. Identification of discrete prognostic groups in Ewing sarcoma. Pediatr Blood Cancer (2016) 63:47–53. doi:10.1002/pbc.25709
9. Martin RCG II, Brennan MF. Adult soft tissue Ewing sarcoma or primitive neuroectodermal tumors: predictors of survival? Arch Surg (2003) 138:281–5. doi:10.1001/archsurg.138.3.281
10. Surveillance, Epidemiology, and End Results Program. Overview of the SEER Program. (2016). Available from: http://seer.cancer.gov/about/overview.html
11. Applebaum MA, Worch J, Matthay KK, Goldsby R, Neuhaus J, West DC, et al. Clinical features and outcomes in patients with extraskeletal Ewing sarcoma. Cancer (2011) 117:3027–32. doi:10.1002/cncr.25840
12. Ning MS, Perkins SM, Borinstein SC, Holt GE, Stavas MJ, Shinohara ET. Role of radiation in the treatment of non-metastatic osseous Ewing sarcoma. J Med Imaging Radiat Oncol (2016) 60:119–28. doi:10.1111/1754-9485.12389
13. Gupta AA, Pappo A, Saunders N, Hopyan S, Ferguson P, Wunder J, et al. Clinical outcome of children and adults with localized Ewing sarcoma: impact of chemotherapy dose and timing of local therapy. Cancer (2010) 116:3189–94. doi:10.1002/cncr.25144
14. Wong T, Goldsby RE, Wustrack R, Cash T, Isakoff MS, DuBois SG. Clinical features and outcomes of infants with Ewing sarcoma under 12 months of age. Pediatr Blood Cancer (2015) 62:1947–51. doi:10.1002/pbc.25635
15. Verma V, Mishra MV, Mehta MP. A systematic review of the cost and cost-effectiveness studies of proton radiotherapy. Cancer (2016) 122:1483–501. doi:10.1002/cncr.29882
Keywords: Ewing sarcoma, primitive neuroectodermal tumor, pediatric oncology, survival, radiation therapy
Citation: Verma V, Denniston KA, Lin CJ and Lin C (2017) A Comparison of Pediatric vs. Adult Patients with the Ewing Sarcoma Family of Tumors. Front. Oncol. 7:82. doi: 10.3389/fonc.2017.00082
Received: 02 December 2016; Accepted: 13 April 2017;
Published: 08 May 2017
Edited by:
John Varlotto, University of Massachusetts Medical Center, USAReviewed by:
Mohamed Saad Zaghloul, Cairo University, EgyptRobert J. Canter, University of California at Davis, USA
Joanna Kitlinska, Georgetown University, USA
Copyright: © 2017 Verma, Denniston, Lin and Lin. This is an open-access article distributed under the terms of the Creative Commons Attribution License (CC BY). The use, distribution or reproduction in other forums is permitted, provided the original author(s) or licensor are credited and that the original publication in this journal is cited, in accordance with accepted academic practice. No use, distribution or reproduction is permitted which does not comply with these terms.
*Correspondence: Chi Lin, Y2xpbkB1bm1jLmVkdQ==
†These authors have contributed equally to this work.