 Márcia Cristina Fernandes Messias1*
 Giovana Colozza Mecatti1
 Célio Fernando Figueiredo Angolini2Marcos Nogueira Eberlin2Laura Credidio3
 Carlos Augusto Real Martinez3Cláudio Saddy Rodrigues Coy3Patrícia de Oliveira Carvalho1
- 1Laboratory of Multidisciplinary Research, São Francisco University (USF), Bragança Paulista, São Paulo, Brazil
- 2Institute of Chemistry, University of Campinas (UNICAMP), Campinas, São Paulo, Brazil
- 3Department of Surgery, University of Campinas (UNICAMP), Campinas, São Paulo, Brazil
Background: Rectal adenocarcinoma (RAC) is a common malignant tumor of the digestive tract and survival is highly dependent upon stage of disease at diagnosis. Lipidomic strategy can be used to identify potential biomarkers for establishing early diagnosis or therapeutic programs for RAC.
Objective: To evaluate the lipoperoxidation biomarkers and lipidomic signature in the plasma of patients with RAC (n = 23) and healthy controls (n = 18).
Methods: Lipoperoxidation was evaluated based on malondialdehyde (MDA) and F2-isoprostane levels and the lipidomic profile obtained by gas chromatography and high resolution mass spectrometry (ESI-q-TOF) associated with a multivariate statistical technique.
Results: The most abundant ions identified in the RAC patients were those of protonated phosphatidylcholine and phosphatidylethanolamine. It was found that a lisophosphatidylcholine (LPC) plasmalogen containing palmitoleic acid [LPC (P-16:1)], with highest variable importance projection score, showed a tendency to be lower in the cancer patients. A reduction of n − 3 polyunsaturated fatty acids was observed in the plasma of these patients. MDA levels were higher in patients with advanced cancer (stages III/IV) than in the early stages groups and the healthy group (p < 0.05). No differences in F2-isoprostane levels were observed among these groups.
Conclusion: This study shows that the reduction in plasma levels of LPC plasmalogens associated with an increase in MDA levels may indicate increased oxidative stress in these patients and identify the metabolite LPC (P-16:1) as a putatively novel lipid signature for RAC.
Introduction
Colorectal cancer (CRC) is the third commonest malignant tumor worldwide. Countries with the highest incidence rates are Australia, New Zealand, Canada, the United States, and parts of Europe (1). In Brazil, colon and rectal cancers are among the five most diagnosed cancers and are the third highest cause of cancer-related deaths (2, 3). Rectal cancer is a commonly frequent type of CRC and rectal adenocarcinoma (RAC) is the primary histological type of rectal cancer, associated with considerable mortality and morbidity. The overall 5-year survival rate is described as 66.5% (4).
Important cellular functions, such as signal transduction, post-translational modifications, homeostasis, adhesion, migration, apoptosis, and neurotransmission are regulated by phospholipids (PLs) (5, 6). These molecules are subject to extensive modification in cancer, often with marked alterations in the phosphatidylcholine (PC) and phosphatidylethanolamine (PE) metabolism due to changes in the activity of degradative enzymes, including phospholipase A (7, 8) and anabolic enzymes, especially fatty acid synthase, stearoyl-CoA desaturase (SCD) and choline kinase α (9, 10). Both phospholipase and fatty acid synthase are essential for tumor progression and have been identified as potential cancer treatment targets (11, 12).
Understanding the occurrence of alterations in plasma metabolic profiles and lipid peroxidation associated with tumor onset and progression could lead to better diagnostic tests and could uncover new approaches to prevent or even treat CRC. Decreased serum levels of unsaturated free fatty acids, C16:1, C18:2, C20:4, and C22:6, have been proposed as diagnostic indicators of early stages CRC (13). Also, the risk of CRC is increased with elevations in serum n − 3 polyunsaturated fatty acids (PUFA) and n − 6 PUFA (14) and with higher levels of plasma saturated fatty acids (SFAs) in plasma PLs, in particular palmitic acid (15). It has been reported that the shift from lipid uptake to de novo lipogenesis in cancer cells leads to increased membrane lipid saturation and higher levels of saturated and monounsaturated PLs, thus rendering the cancer cells more protected against the oxidative damage by reducing lipid peroxidation (16). However, inhibition of fatty acid desaturation following ablation of SCD causes oxidative stress, cell cycle inhibition, and apoptosis in cancer cells (17).
Most of the research groups investigating lipidomic profile in CRC to elucidate the changes in lipid metabolism have assessed the tissue (18–22) and exosomes (23). Biofluid-based detection strategies (urine and peripheral blood and its components) are an attractive approach for screening, mainly due to their offer of non-invasive access to large quantities of samples and ease of acquisition. Molecular analyses of early stages rectal cancer-related plasma represent an attractive choice for the discovery and validation of diagnostic biomarkers.
In this study, lipoperoxidation biomarkers [malondialdehyde (MDA) and F2-isoprostane] and lipid signatures obtained by gas chromatography (GC) and high-resolution mass spectrometry (ESI-qToF-MS) followed by multivariate data analysis, including principal component analysis (PCA) and (orthogonal) partial least squared discriminant analysis [(O)PLS-DA] were applied for the rapid investigation of potential diagnostic biomarkers in the plasma of RAC patients.
Experiment
Participants and Samples
Plasma samples were obtained from 18 healthy volunteers and 23 RAC patients stratified into three groups [stage 0, stages I/II, and stages III/IV according to the TNM classification system of the American Joint Committee on Cancers (AJCC) (24)]. The ethics committee of the São Francisco University (CAAE: 51356315.5.0000.5514) and the Faculty of Medical Sciences of the State University of Campinas (CAAE: 08287012.0.0000.5404) approved the project. Samples and clinical information on the RAC patients were obtained from the Gastrocentro Colorectal Cancer Medical Outpatient Facility of the Faculty of Medical Sciences of the University of Campinas (UNICAMP) in the period 2013 and 2014. All patients over 18 years old with RAC diagnosed by histopathology were included in the study. Data were collected considering the follow information: age, sex, BMI, race, smoker, diagnosis, date of diagnosis (date of biopsy), TNM stage, type of surgical treatment, neo/adjuvant treatment, recurrence, death, and date of death. The samples were taken prior to the patients’ being submitted to surgical procedures, chemical therapy, and/or radiotherapy. Clinical examination coupled with hemato-biochemical analysis was used to screen healthy controls. Informed consent was acquired from participants prior to blood collection. The same protocol was used in the collection of plasma samples from patients and controls. From each subject, 4 ml of whole blood was collected into a tube containing potassium-EDTA. The plasma was promptly separated and stored at −80°C for posterior analysis.
Lipid Extraction
Lipids were extracted from the plasma (0.8 ml) by the procedure of Folch et al. (25) with 5.0 ml of chloroform–methanol (2:1) and 0.5 ml aqueous solution of 0.1 N NaCl. The lower lipid phase was collected, separated into two fractions for subsequent analyses, and dried under nitrogen.
Lipid Classes Analysis by Electrospray Ionization Time-of-Flight Mass Spectrometry (ESI-qToF-MS)
The lipid extracts were diluted in 300 µl of methanol:chloroform (2:1) and 100 µl of this solution were re-diluted in 400 µl of acetonitrile:chloroform (3:1). Then 1 µl was injected into an LC (Agilent 1290) injector of an LC-MS system using no column and with a flow of 0.5 ml min−1 of acetonitrile:H2O (1:1). The mass spectrometry experiments were performed on a 6550 iFunnel q-ToF (Agilent Technologies) coupled with a Dual Agilent Jet Stream ESI source (Dual-AJS-ESI). The positive ion mode was used for the collection of the mass spectra, applying the following conditions: Gas temp. at 290°C, Drying Gas flow at 11 l min−1, Nebulizer at 45 psi, Sheath gas temp. at 350°C, Sheath gas flow 12 l min−1, VCap 3000, Nozzle voltage 320 V, Fragmenter 100 V, and OCT 1 RFV pp 750 V. Agilent Mass Hunter Qualitative Analysis software version B.07.00 was used to acquire and process the data. The ESI(+)-MS data were exported in CSV files and statistical analyses were performed using MetaboAnalyst 2.0.
Fatty Acid Analysis by GC
The dry extract of total lipids was subjected to derivatization before GC analysis. The extracts were converted into fatty acid methyl esters using BF3 methanol (26) and analyzed by GC using a Chrompack chromatographer (model CP 9001; Chrom Tech, Inc.) with a flame ionization detector and a CP-Sil 88 capillary column (Chrompak, WCOT Fused Silica) as previously reported (27). Fatty acid (FA) identification was made by comparing retention times with authentic standards (Sigma) injected under the same conditions. FA composition, represented as a percentage of total FA, was calculated using area of the chromatogram (Software N2000, G-Chrom).
Lipoperoxidation Biomarkers
Plasma level of MDA was measured according to the method of Ohkawa et al. (28). MDA level was determined by thiobarbituric acid reactive substances based on the reaction between MDA and thiobarbituric acid (TBA). 250 µl of plasma were mixed with 25 µl of 4% butylated hydroxytoluene in methanol, 1 ml 12% trichloroacetic acid, 1 ml of 0.73% TBA, and 750 µl of 0.1 mol/l Tris–HCl buffer containing 0.1 mmol/l EDTA pH 7.4. The reaction yields a pink MDA-TBA adduct, which was measured by the spectrophotometer at 532 nm. The method was standardized with 1,1,3,3-tetramethoxypropane (malondialdehyde bis dimethyl acetal) and MDA concentration was calculated as nmol/ml.
Free 8-isoprostane (8-epi-PGF2) was measured by using an enzyme immunoassay kit (8-isoprostane EIA Kit, Cayman Chemical Co., Ann Arbor, MI, USA). The plate was incubated for 90 min at room temperature, the absorbance read at 412 nm, and 8-isoprostane concentration was calculated as pg/ml.
Statistical and Multivariate Data Analysis
Comparative statistical analysis was conducted to compare the two experimental groups. The Tukey test was applied to the means and standard deviations of FA composition and lipoperoxidation biomarkers, adopting a significance level of p < 0.05 (5%). Data assessment used InStat GraphPad 2.0 software, and the graphs were elaborated using OriginLab Origin 8.1 software. To enable the assessment of lipid classes, Agilent Mass Hunter Qualitative Analysis B.07.00 software was used for data acquisition and control. Exporting files in CSV was carried out for the ESI (+)-MS. For the statistical analysis, each molecular feature (ion) was normalized by sum, unsupervised segregation was evaluated using statistical web platform Metaboanalyst 2.0. PCA was performed using pareto and the results were used to show the lipids that most strongly influence the discrimination between groups. To enhance data discrimination, the data were also analyzed using the (orthogonal) partial least squared discriminant analysis [(O)PLS-DA] method. Biomarkers were selected according to their variable importance in projection (VIP) values. In addition, an independent t-test (p ≤ 0.05) was used to evaluate whether different biomarker candidates were statistically significant between groups. The differences of FA composition between groups were analyzed by one-way ANOVA, followed by the Tukey test and p < 0.05 was considered to be statistically significant.
Results
Patient Characteristics
A total of 23 patients with RAC and 18 healthy volunteers were included in our study. RAC patients included 4 patients with stage 0 (carcinoma in situ) (17.4%), 9 (39.1%) with early stages (TNM staging I/II), and 10 (43.5%) with advanced stages (TNM staging III/IV), between 24 and 91 years old. Table 1 summarizes the major characteristics of all subjects.
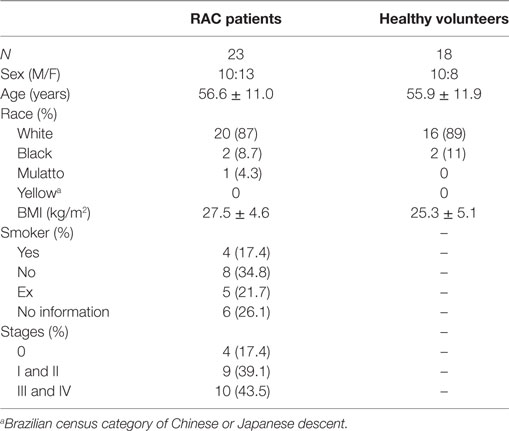
Table 1. Demographic data and major clinical characteristics of rectal adenocarcinoma (RAC) patients and healthy volunteers.
Profile Analysis of Lipids in Plasma RAC Patients vs Healthy Volunteers
Substantial differences in the lipid profiles were observed in the mass spectra of the two groups (Figure 1). To evaluate these differences, the data were integrated and co-analyzed using unsupervised PCA (Figure S1 in Supplementary Material), supervised PLS-DA (Figure 2) and OPLS-DA methods (Figure S2 in Supplementary Material). Significant differences in the lipid profile were found between RAC patients and healthy subjects, with a satisfactory separation of the groups due to contrasting concentrations of constituents (Figure 2).
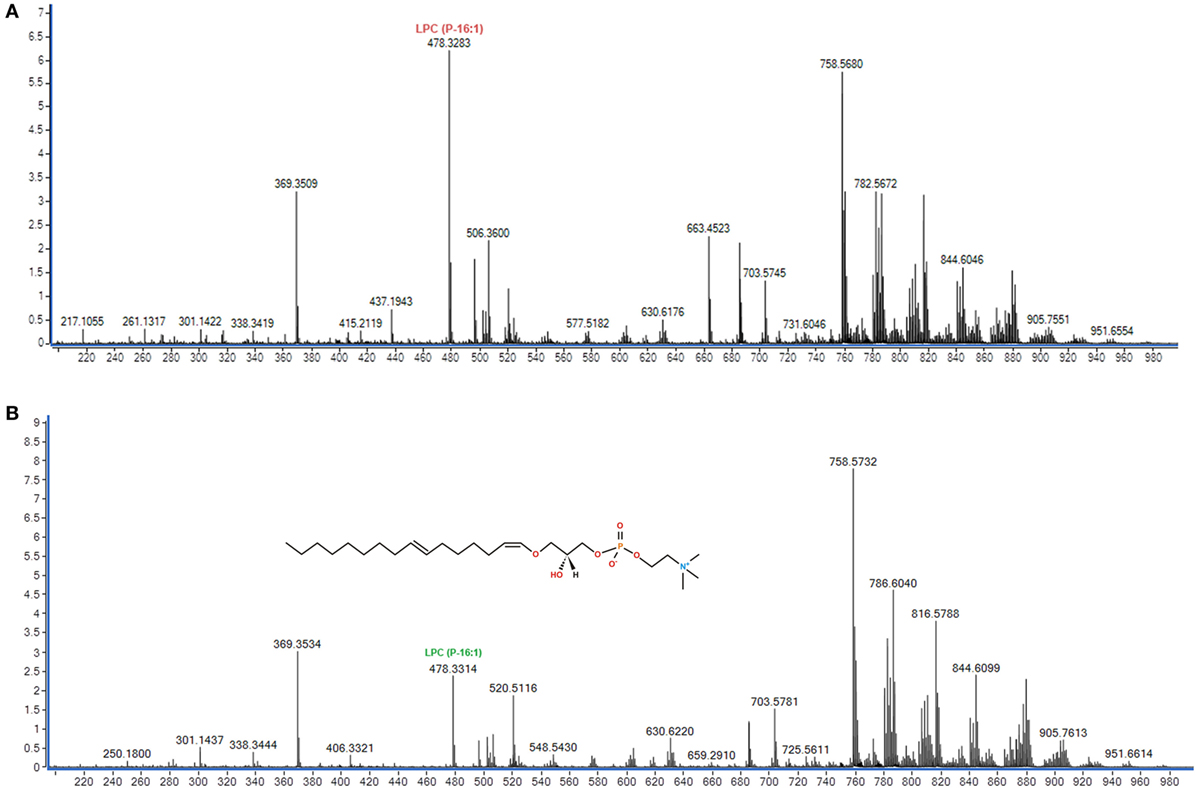
Figure 1. Representative (+) ESI-MS (q-ToF) mass spectra of plasma from (A) a healthy volunteer and (B) a rectal adenocarcinoma patient. (B) Representation of the molecular structure (C24H48NO6P) m/z 478 identified as lisophosphatidylcholine [LPC (P-16:1)].
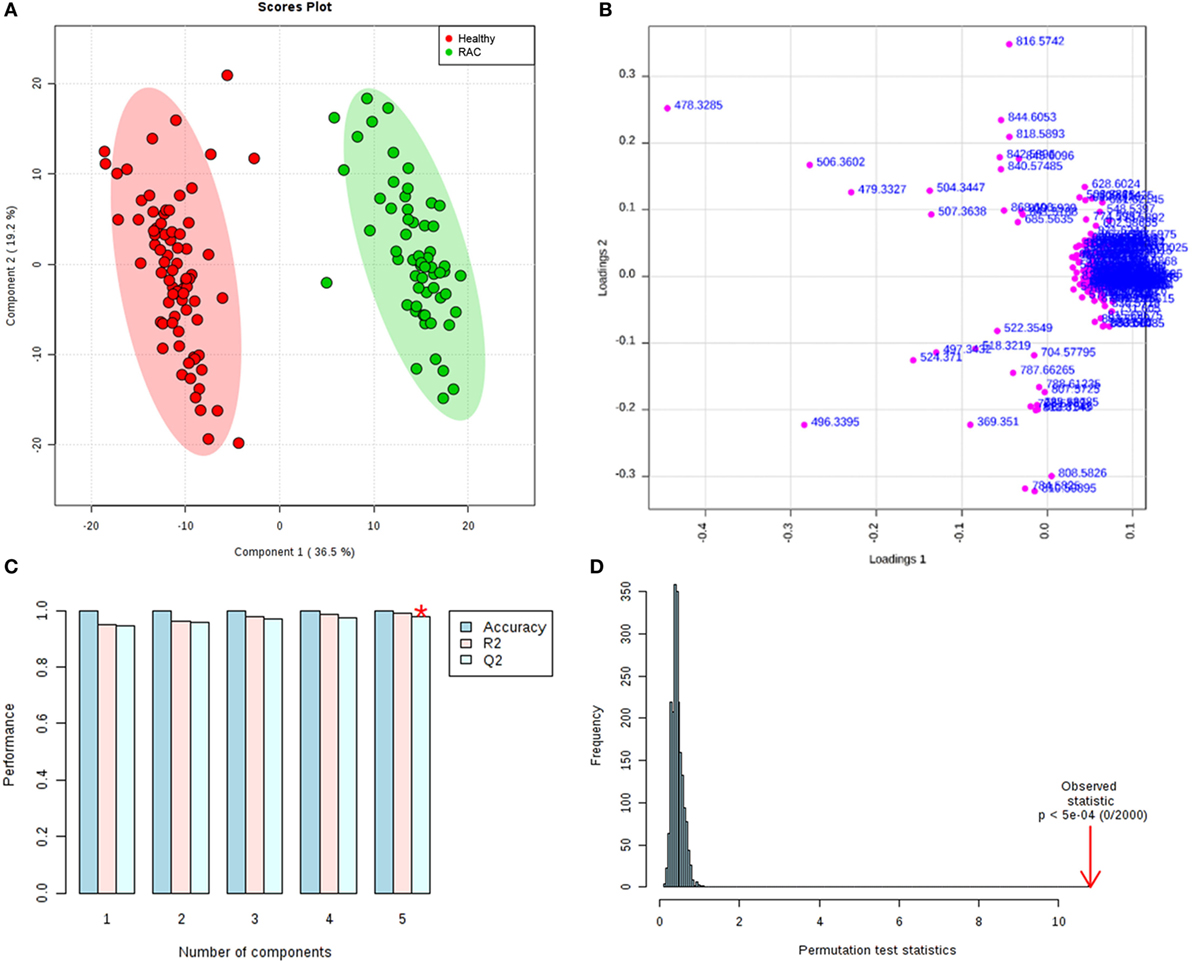
Figure 2. (A) PLS-DA scores plot of healthy volunteers (red) and rectal adenocarcinoma patients (green). 36.5 and 19.2% are the scores of the component 1 and 2, respectively. (B) Loadings plot for components 1 and 2. (C) Cross validation showing the performance measures (prediction accuracy, R2, and Q2). *best values of Q2 (0.97). (D) The permutation test statistics (p < 5e−4). PLS score (T-score) explains Y and maximizes the relation between X and Y.
The index values of the variable importance in projection (VIP) from PLS-DA were used to measure the importance of each individual metabolite (Figure 3). A total of 120 variables were initially obtained and 15 ions (m/z) were highlighted by PLS-DA as important lipids to differentiate RAC patients from healthy volunteers. Nine of those ions were identified as shown in Table 2. Some of the ions had their identification confirmed by their collision-induced dissociation displayed in their MS/MS spectra (Table 2). Ions that could not be evaluated by MS/MS were identified with the SimLipid software (PREMIER Biosoft International, CA, USA).
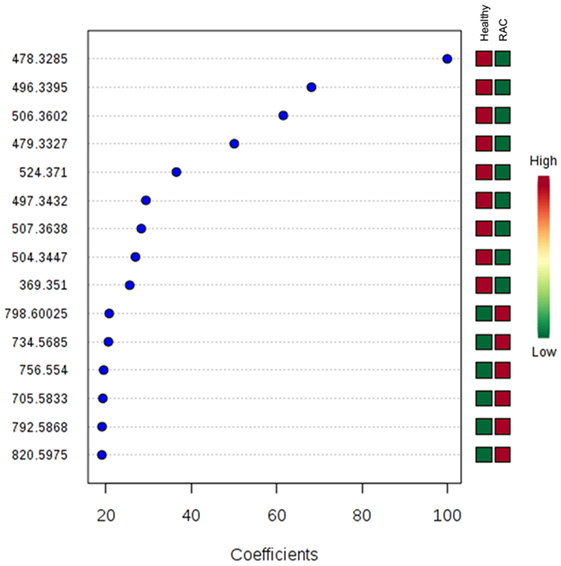
Figure 3. Important metabolite ions selected on the basis of variable importance in projection (VIP) score. The colored boxes on the right indicate relative bin integrals for healthy volunteers and rectal adenocarcinoma patients. VIP score is a weighted sum of squares of the PLS-DA loadings taking into account the amount of explained Y-variation in each dimension.
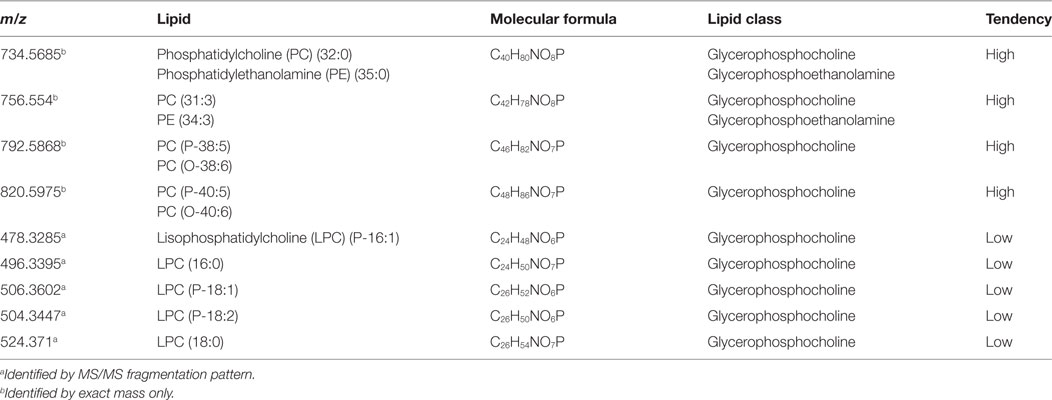
Table 2. Main classes of lipids with contrasting abundances identified in the plasma of rectal cancer patients.
Top 15 variables (ions with their m/z) that significantly contributed to the discrimination between groups were selected, resulting in a 20 VIP value cut-off. In the RAC group, ions of m/z 734 and 756 identified as PC or PE; and ions of m/z 792, 820 identified as PC plasmalogen (PCP) or 1-alkyl PC (PCO) were up-regulated, while lisophosphatidylcholine (LPC) metabolites (m/z 496 and 524) and three LPC plasmalogens (m/z 478, 506 and 504) were downregulated compared with healthy subjects. LPC plasmalogen of m/z 478 (LPC P-16:1) was the most relevant for predicting the response variable.
Table 3 sets out the results for the plasma FAs of the healthy volunteers and RAC patients in the different cancer stages. The main FAs found in all groups were the SFA followed by the n − 6 PUFAs and the MUFAs. No significant differences were observed in total MUFA and n − 6 PUFA amounts between the 0, I/II, and III/IV cancer stages, except for 16:1 n − 7 (p = 0.0455) and 20:4 n − 6 (p = 0.0472) which were reduced in the I/II cancer stages. Reductions were also observed in n − 3 PUFA, docosapentaenoic (C22:5 n − 3) (p = 0.0268) and docosahexaenoic (C22:6 n − 3) (p = 0.0086) acids in patients at the I/II cancer stages and docosapentaenoic (C22:5 n − 3) (p = 0.0330) acid was reduced in the III/IV cancer stages. The plasma of patients at stage 0 (carcinoma in situ) showed no alterations in FAs composition. As for the sum of the FAs classes (SFA, MUFA, and PUFA), there were no statistical differences among the groups evaluated.
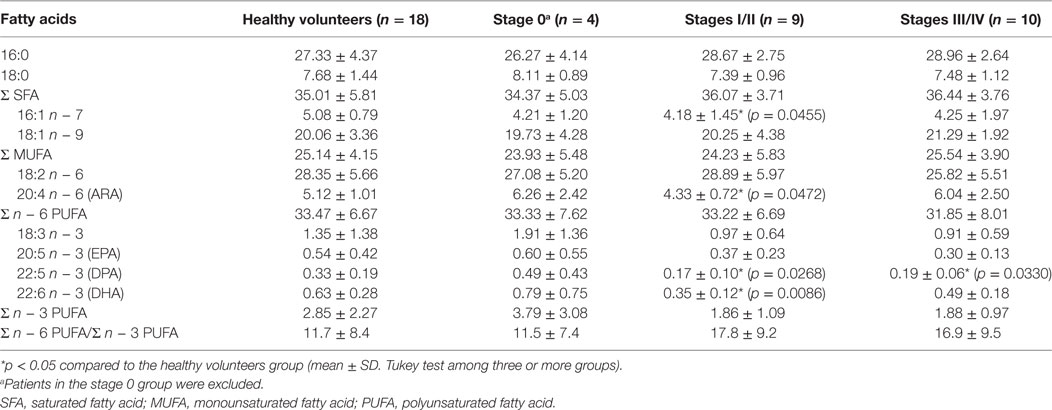
Table 3. Fatty acid (FA) composition (% total relative) of plasma total lipids in healthy volunteers (n = 18) and rectal adenocarcinoma (RAC) patients in the different cancer stages.
Lipid Peroxidation Determination
The plasma levels of MDA (nmol/mL) and of F2-isoprostane (pg/mL) of healthy volunteers and the three groups separated by the staging are set out in Figures 4A,B, respectively. The plasma levels of MDA in the III/IV cancer stages were higher than the values observed in the healthy volunteers and in the stage 0 group (p < 0.05). No differences in MDA levels were observed in patients in the early stages (stages 0 and I/II) compared to healthy volunteers (Figure 4A). As regards the F2-isoprostane levels, there were no statistical differences among the groups evaluated (Figure 4B).
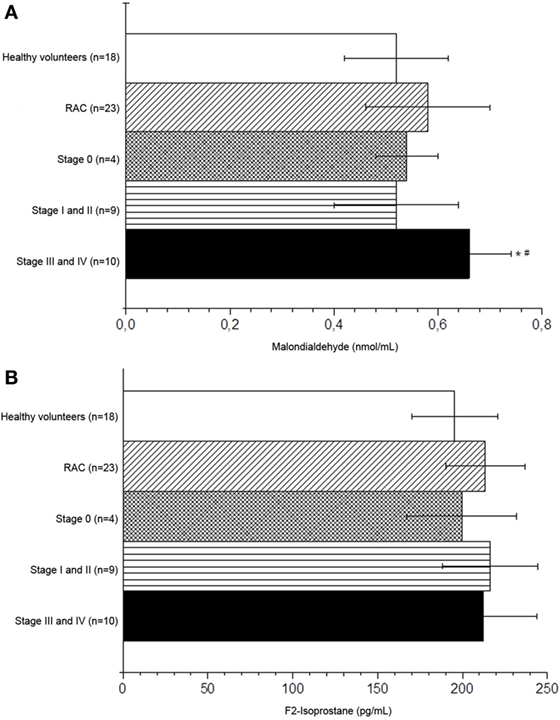
Figure 4. Malondialdehyde (A) and F2-isoprostane (B) levels of the healthy volunteers and rectal adenocarcinoma patients in the different cancer stages. *p < 0.05 compared to the healthy volunteers. #p < 0.05 compared to stage 0; ANOVA followed by Tukey test. 1. Healthy volunteers, 2. Stages 0, 3. Stages I/II, 4. Stages III/IV.
Discussion
Our results show a significant difference in the lipid profile between RAC and healthy subjects. PC/PE and PCP were upregulated while those of LPC metabolites with SFAs (16:0 and 18:0) as well as unsaturated plasmalogens (16:1, 18:1, and 18:2) were significantly lower compared with healthy subjects. Also, a relative reduction of n − 3 PUFA, already observed in the early stage of cancer, and an increase of MDA, a biomarker of oxidative stress-induced lipid peroxidation, were observed in the plasma of these patients. The increases in MDA levels associated with high levels of plasma PCPs are a confirmation of the increased levels of oxidative stress.
Plasmalogens are a unique class of glycerophospholipids containing a fatty alcohol linked by a vinyl-ether moiety at the sn − 1 position of the glycerol backbone (29). It has been suggested that plasmalogens act as molecular scavengers (29), protecting cells and lipids against oxidative stress (30, 31), as their vinyl-ether bond is highly sensitive to oxidative attack compared to its ester counterparts. In vitro studies have indicated that plasmalogens are capable of reducing the oxidation of cell membrane PUFA and cholesterol (32, 33) and have also been correlated with the reduction in the levels of several oncogenic signaling lipids involved in the regulation of cell survival, cancer aggressiveness, and tumor growth (34). By contrast, LPC plasmalogens were decreasing in RAC patients; this may occur due to increased actions of lyso-PC acyltransferases (LPCAT). The exacerbated lipid anabolic metabolism in tumor cells is reflected in elevated activity and expression of several lipogenic enzymes. The LPCAT1, which converts LPC into PCs, is overexpressed in several cancers and is associated with colon cancer growth (21, 22) showed that LPCAT4 was overexpressed in CRC and contributes to PC (16:0/16:1) accumulation via the enhanced re-acylation of LPC.
Also, an abnormal choline-containing compounds metabolism have been identified and associated with oncogenesis and tumor progression (35). Choline kinase-α (Chk-α) activity, an enzyme in the Kennedy pathway that phosphorylates free choline to PC, and PC levels were increased in colon cancer and adenoma tissue (36).
The existence of LPC P16:1 was, however, reported here for the first time in the plasma of patients with RAC. The presence of a plasmalogen in primary and metastatic CRC cell lines (37) and in exosomes secreted by the CRC cell line (23) has been reported previously. The functional role of changes in plasmanyl-lipids in malignancy and metastasis are still poorly understood. It is unclear whether decreased levels of LPC plasmalogens are due to metabolic alteration in RAC or whether plasmalogens play an important role in the pathogenesis of RAC. High levels of PC (C30:0) and low levels of LPC (C18:0) were consistently related to higher risks of colorectal, breast, and prostate cancer, independently of background factors, such as age, BMI, dietary factors, or smoking status (38). In our study, the lipidomic signature was not correlated with demographic, anthropometric, clinical, or other lifestyle factors given that the number of subjects was insufficient for that to be done.
Our results show a relative reduction of MUFA (16:1), n − 6 PUFA (20:4), and n − 3 PUFA (22:5 and 22:6) in plasma of early stages CRC patients. The observation of downregulation in FAs during cancer progression is in accordance with the previous studies of the hypermetabolic response and increased energy expenditure of cancer patients (39). Preliminary data reported a higher proportion of palmitic acid (18:0) and a lower eicosapentaenoic (20:5 n − 3) proportion in the plasma PL fraction in the CRC patients than in the controls (40). A decrease of the 16:1 n − 7/16:0 and 18:1 n − 9/18:0 ratios in colorectal tissue cancer has previously been observed, suggesting that change in FA ratios may be involved in the mechanism of CRC progression (41). Li et al. (42) reported that the reduction of oleamide and FAs (16:2, 18:0, and 20:3) in serum achieved excellent diagnostic accuracy for differentiating early stages CRC patients from healthy controls. Although we were not able to identify differences in oxidative stress as estimated by 8-isoprostane levels between groups, we found that patients with RAC at stages III and IV have increased MDA values. The relation between the staging of the tumor and the increase in oxidative stress remains unclear. Previous research has shown that higher levels of oxidative stress markers are associated with an advanced state of cancer. Mendonça et al. (43) reported that higher MDA levels were found in the serum of patients with CRC at an advanced stage (III). Surinenaite et al. (44) also reported that in 65 patients serum MDA level was more elevated in advanced than early stage CRC. The serum MDA level was significantly decreased after surgical treatments compared to pre-surgical status. Gopčević et al (45) showed, however, that Japanese patients with CRC had high plasmatic levels of MDA at all stages compared to healthy individuals and there were no differences among the stages of the disease.
Conclusion
Early stage RAC was characterized via MS lipid profiles by a reduced level of n − 3 PUFA and LPC plasmalogen species. Our results pointed to this class as a disease biomarker and a better oxidative stress evaluator, since plasmalogen alterations can be observed in early stages of RAC. Plasmalogens might, therefore, work as biomarkers for diagnosis and also be an index for the surveillance of treatment effects. This was an explorative study and the observed associations need to be validated in a larger cohort that would make it feasible to adjust for more potential confounders in multivariate statistical tests, nevertheless, the results are indeed promising.
Ethics Statement
The project was approved by the ethics committee of the São Francisco University (CAAE: 51356315.5.0000.5514) and by the Faculty of Medical Sciences of the State University of Campinas (CAAE: 08287012.0.0000.5404).
Author Contributions
PC, MM, and GM: conception and design of research; GM, LC, CM, and CC: acquisition of samples; MM and CA: performed experiments; MM, CA, and ME: acquisition of data; PC, MM, and CA: analyzed data and interpreted results of experiments; PC, MM, and CA: drafted the manuscript; and PC, MM, GM, CA, ME, CM, and CC: revised and approved final version of manuscript.
Conflict of Interest Statement
The authors declare that the research was conducted in the absence of any commercial or financial relationships that could be construed as a potential conflict of interest.
The reviewer UM and handling editor declared their shared affiliation.
Funding
The authors wish to thank their colleagues of the Unidade Integrada de Farmacologia e Gastroenterologia (UNIFAG) and Laboratório de Análises Clínicas São José from Hospital Universitário São Francisco na Providência de Deus and FAPESP (2016/11905-2) for financial support. MM acknowledges CAPES and CA acknowledges CNPQ (studentship 2015/162191-4).
Supplementary Material
The Supplementary Material for this article can be found online at http://www.frontiersin.org/articles/10.3389/fonc.2017.00325/full#supplementary-material.
References
1. Siegel R, Desantis C, Jemal A. Colorectal cancer statistics. CA Cancer J Clin (2014) 64(2):104–17. doi:10.3322/caac.21220
2. Schmidt MI, Duncan BB, Silva GA, Menezes AM, Monteiro CA, Barreto SM, et al. Doenças crônicas não transmissíveis no Brasil: carga e desafios atuais. Séries Lancet (2011) 377(9781):61–74. doi:10.1016/S0140-6736(11)60135-9
3. INCA: Instituto Nacional do Câncer. Estimativa 2016: incidência de câncer no Brasil. Rio de Janeiro: Ministério da Saúde (2015). 122 p.
5. Shevchenko A, Simons K. Lipidomics: coming to grips with lipid diversity. Nat Rev Mol Cell Biol (2010) 11(8):593–8. doi:10.1038/nrm2934
6. Perrotti F, Rosa C, Cicalini I, Sacchetta P, Del Boccio P, Genovesi D, et al. Advances in lipidomics for cancer biomarkers discovery. Int J Mol Sci (2016) 17(12):E1992. doi:10.3390/ijms17121992
7. Surrel F, Jemel L, Boilard E, Bollinger JG, Payré C, Mounier CM, et al. Group X phospholipase A2 stimulates the proliferation of colon cancer cells by producing various lipid mediators. Mol Pharmacol (2009) 76(4):778–90. doi:10.1124/mol.108.053371
8. Lee SJ, Yun CC. Colorectal cancer cells–proliferation, survival and invasion by lysophosphatidic acid. Int J Biochem Cell Biol (2010) 42(12):1907–10. doi:10.1016/j.biocel.2010.09.021
9. Notarnicola M, Tutino V, Calvani M, Lorusso D, Guerra V, Caruso MG. Serum levels of fatty acid synthase in colorectal cancer patients are associated with tumor stage. J Gastrointest Cancer (2012) 43(3):508–11. doi:10.1007/s12029-011-9300-2
10. Guo S, Wang Y, Zhou D, Li Z. Significantly increased monounsaturated lipids relative to polyunsaturated lipids in six types of cancer microenvironment are observed by mass spectrometry imaging. Sci Rep (2014) 4:5959. doi:10.1038/srep05959
11. Cummings BS. Phospholipase A2 as targets for anti-cancer drugs. Biochem Pharmacol (2007) 74(7):949–59. doi:10.1016/j.bcp.2007.04.021
12. Flavin R, Peluso S, Nguyen PL, Loda M. Fatty acid synthase as a potential therapeutic target in cancer. Future Oncol (2010) 6(4):551–62. doi:10.2217/fon.10.11
13. Zhang Y, He C, Qiu L, Wang Y, Qin X, Liu Y, et al. Serum unsaturated free fatty acids: a potential biomarker panel for early stage detection of colorectal cancer. J Cancer (2016) 7(4):477–83. doi:10.7150/jca.13870
14. Zhang P, Wen X, Gu F, Zhang X, Li J, Liu Y, et al. Role of serum polyunsaturated fatty acids in the development of colorectal cancer. Int J Clin Exp Med (2015) 8(9):15900–9.
15. Hodge AM, Williamson EJ, Bassett JK, Macinnis RJ, Giles GG, English DR. Dietary and biomarker estimates of fatty acids and risk of colorectal cancer. Int J Cancer (2015) 137(5):1224–34. doi:10.1002/ijc.29479
16. Rysman E, Brusselmans K, Scheys K, Timmermans L, Derua R, Munck S, et al. De novo lipogenesis protects cancer cells from free radicals and chemotherapeutics by promoting membrane lipid saturation. Cancer Res (2010) 70(20):8117–26. doi:10.1158/0008-5472.CAN-09-3871
17. Minville-Walz M, Pierre AS, Pichon L, Bellenger S, Fèvre C, Bellenger J, et al. Inhibition of stearoyl-CoA desaturase 1 expression induces CHOP-dependent cell death in human cancer cells. PLoS One (2010) 5(12):e14363. doi:10.1371/journal.pone.0014363
18. Liesenfeld DB, Grapov D, Fahrmann JF, Salou M, Scherer D, Toth R, et al. Metabolomics and transcriptomics identify pathway differences between visceral and subcutaneous adipose tissue in colorectal cancer patients: the ColoCare study. Am J Clin Nutr (2015) 102(2):433–43. doi:10.3945/ajcn.114.103804
19. Mirnezami R, Spagou K, Vorkas PA, Lewis MR, Kinross J, Want E, et al. Chemical mapping of the colorectal cancer microenvironment via MALDI imaging mass spectrometry (MALDI-MSI) reveals novel cancer-associated field effects. Mol Oncol (2014) 8(1):39–49. doi:10.1016/j.molonc.2013.08.010
20. Thomas A, Patterson NH, Marcinkiewicz MM, Lazaris A, Metrakos P, Chaurand P. Histology-driven data mining of lipid signatures from multiple imaging mass spectrometry analyses: application to human colorectal cancer liver metastasis biopsies. Anal Chem (2013) 85(5):2860–6. doi:10.1021/ac3034294
21. Kurabe N, Hayasaka T, Ogawa M, Masaki N, Ide Y, Waki M, et al. Accumulated phosphatidylcholine (16:0/16:1) in human colorectal cancer; possible involvement of LPCAT4. Cancer Sci (2013) 104(10):1295–302. doi:10.1111/cas.12221
22. Mansilla F, da Costa KA, Wang S, Kruhøffer M, Lewin TM, Ørntoft TF, et al. Lysophosphatidylcholine acyltransferase 1 (LPCAT1) overexpression in human colorectal cancer. J Mol Med (2009) 87(1):85–97. doi:10.1007/s00109-008-0409-0
23. Lydic TA, Townsend S, Adda CG, Collins C, Mathivanan S, Reid GE. Rapid and comprehensive “shotgun” lipidome profiling of colorectal cancer cell derived exosomes. Methods (2015) 87:83–95. doi:10.1016/j.ymeth.2015.04.014
24. AJCC: American Joint Committee on Cancer. Colon and Rectum Cancer Staging. 7th ed. New York: Springer (2010).
25. Folch J, Lees M, Stanley GHS. A simple method for the isolation and purification of total lipids from animal tissues. J Biol Chem (1957) 226(1):497–509. doi:10.1007/s10858-011-9570-9
26. AOCS: American Oil Chemists Society. Official Methods and Recommended Practices of the American Oil Chemists Society. 4th ed. (Vol. 1608). Broadmoor Drive, Champaign, IL: American Oil Chemists Society (1993). p. 61826–3489.
27. Casadei BR, Carvalho PO, Riske KA, Barbosa RM, De Paula E, Domigues CC. Brij detergents reveal new aspects of membrane microdomain in erythrocytes. Mol Membr Biol (2014) 31:195–205. doi:10.3109/09687688.2014.949319
28. Ohkawa H, Ohishi N, Yagi K. Assay for lipid peroxides in animal tissues by thiobarbituric acid reaction. Anal Biochem (1979) 95(2):351–8. doi:10.1016/0003-2697(79)90738-3
29. Wallner S, Schmitz G. Plasmalogens the neglected regulatory and scavenging lipid species. Chem Phys Lipids (2011) 164(6):573–89. doi:10.1016/j.chemphyslip.2011.06.008
30. Mangold HK, Weber N. Biosynthesis and biotransformation of ether lipids. Lipids (1987) 22(11):789–99. doi:10.1007/BF02535533
31. Braverman NE, Moser AB. Functions of plasmalogen lipids in health and disease. Biochim Biophys Acta (2012) 1822(9):1442–52. doi:10.1016/j.bbadis.2012.05.008
32. Maeba R, Ueta N. Ethanolamine plasmalogen and cholesterol reduce the total membrane oxidizability measured by the oxygen uptake method. Biochem Biophys Res Commun (2003) 302(2):265–70. doi:10.1016/S0006-291X(03)00157-8
33. Mankidy R, Ahiahonu PW, Ma H, Jayasinghe D, Ritchie SA, Khan MA, et al. Membrane plasmalogen composition and cellular cholesterol regulation: a structure activity study. Lipids Health Dis (2010) 9:62. doi:10.1186/1476-511X-9-62
34. Benjamin DI, Cozzo A, Ji X, Roberts LS, Louie SM, Mulvihill MM, et al. Ether lipid generating enzyme AGPS alters the balance of structural and signaling lipids to fuel cancer pathogenicity. Proc Natl Acad Sci U S A (2013) 110(37):14912–7. doi:10.1073/pnas.1310894110
35. Glunde K, Bhujwalla ZM, Ronen SM. Choline metabolism in malignant transformation. Nat Rev Cancer (2011) 11:835–48. doi:10.1038/nrc3162
36. Nakagami K, Uchida T, Ohwada S, et al. Increased choline kinase activity and elevated phosphocholine levels in human colon cancer. Japanese J Cancer Res (1999) 90:419–24. doi:10.1111/j.1349-7006.1999.tb00698.x
37. Fhaner CJ, Liu S, Ji H, Simpson RJ, Reid GE. Comprehensive lipidome profiling of isogenic primary and metastatic colon adenocarcinoma cell lines. Anal Chem (2012) 84(21):8917–26. doi:10.1021/ac302154g
38. Kühn T, Floegel A, Sookthai D, Johnson T, Rolle-Kampczyk U, Otto W, et al. Higher plasma levels of lysophosphatidylcholine 18:0 are related to a lower risk of common cancers in a prospective metabolomics study. BMC Med (2016) 14(1):13. doi:10.1186/s12916-016-0552-3
39. Purcell SA, Elliott SA, Baracos VE, Chu QSC, Prado CM. Key determinants of energy expenditure in cancer and implications for clinical practice. Eur J Clin Nutr (2016) 70(11):1230–8. doi:10.1038/ejcn.2016.96
40. Okuno M, Hamazaki K, Ogura T, Kitade H, Matsuura T, Yoshida R, et al. Abnormalities in fatty acids in plasma, erythrocytes and adipose tissue in Japanese patients with colorectal cancer. In Vivo (2013) 27(2):203–10.
41. Zhang J, Zhang L, Ye X, Chen L, Zhang L, Gao Y, et al. Characteristics of fatty acid distribution is associated with colorectal cancer prognosis. Prostaglandins Leukot Essent Fatty Acids (2013) 88(5):355–60. doi:10.1016/j.plefa.2013.02.005
42. Li F, Qin X, Chen H, Qiu L, Guo Y, Liu H, et al. Lipid profiling for early diagnosis and progression of colorectal cancer using direct-infusion electrospray ionization Fourier transform ion cyclotron resonance mass spectrometry. Rapid Commun Mass Spectrom (2013) 27(1):24–34. doi:10.1002/rcm.6420
43. Mendonça PS, Carioca AAF, Maia FMM. Interações entre estresse oxidativo, terapia utilizada e estadiamento em paciente com câncer colorretal. Revista Brasileira de Cancerologia (2014) 60(2):129–34.
44. Surinenaite B, Prasmickiene G, Milasiene V, Stratilatovas E, Didziapetriene J. The influence of surgical treatment and red blood cell transfusion on changes in antioxidative and immune system parameters in colorectal cancer patients. Medicina (2009) 45(10):785–91.
Keywords: lipidomic, rectal adenocarcinoma, biomarkers, lipoperoxidation, mass spectrometry
Citation: Fernandes Messias MC, Mecatti GC, Figueiredo Angolini CF, Eberlin MN, Credidio L, Real Martinez CA, Rodrigues Coy CS and de Oliveira Carvalho P (2018) Plasma Lipidomic Signature of Rectal Adenocarcinoma Reveals Potential Biomarkers. Front. Oncol. 7:325. doi: 10.3389/fonc.2017.00325
Received: 05 August 2017; Accepted: 15 December 2017;
Published: 08 January 2018
Edited by:
Tiziana Venesio, Institute for Cancer Research and Treatment (IRCC), ItalyReviewed by:
Umberto Miglio, Istituto di Candiolo (IRCCS), ItalyQingfeng Zhu, Johns Hopkins Medicine, United States
Copyright: © 2018 Fernandes Messias, Mecatti, Figueiredo Angolini, Eberlin, Credidio, Real Martinez, Rodrigues Coy and de Oliveira Carvalho. This is an open-access article distributed under the terms of the Creative Commons Attribution License (CC BY). The use, distribution or reproduction in other forums is permitted, provided the original author(s) or licensor are credited and that the original publication in this journal is cited, in accordance with accepted academic practice. No use, distribution or reproduction is permitted which does not comply with these terms.
*Correspondence: Márcia Cristina Fernandes Messias, bWFyY2lhX2NmbWVzc2lhc0Bob3RtYWlsLmNvbQ==