 Lu Wang1,2Chengqiang Li3Xue Meng2Chengming Li2Xindong Sun2
 Dongping Shang3Linlin Pang2Yixiao Li4Jie Lu3*
 Jinming Yu1,2*
- 1Department of Radiation Oncology, School of Medicine, Shandong University, Jinan, China
- 2Department of Radiation Oncology, Shandong Cancer Hospital and Institute, Shandong First Medical University and Shandong Academy of Medical Sciences, Jinan, China
- 3Department of Radiation Physics, Shandong Cancer Hospital and Institute, Shandong First Medical University and Shandong Academy of Medical Sciences, Jinan, China
- 4Department of Clinical Medicine, Jining Medical University, Jining, China
Objectives: To compare treatment plans of intensity modulated radiotherapy (IMRT), volumetric modulated arc radiotherapy (VMAT), and helical tomotherapy (HT) with simultaneous integrated boost (SIB) technique for esophageal cancer (EC) of different locations using dosimetry and radiobiology.
Methods: Forty EC patients were planned for IMRT, VMAT, and HT plans, including 10 cases located in the cervix, upper, middle, and lower thorax, respectively. Dose-volume metrics, conformity index (CI), homogeneity index (HI), tumor control probability (TCP), and normal tissue complication probability (NTCP) were analyzed to evaluate treatment plans.
Results: HT showed significant improvement over IMRT and VMAT in terms of CI (p = 0.007), HI (p < 0.001), and TCP (p < 0.001) in cervical EC. IMRT yielded more superior CI, HI and TCP compared with VMAT and HT in upper and middle thoracic EC (all p < 0.05). Additionally, V30 (27.72 ± 8.67%), mean dose (1801.47 ± 989.58cGy), and NTCP (Niemierko model: 0.44 ± 0.55%; Lyman-Kutcher-Burman model: 0.61 ± 0.59%) of heart in IMRT were sharply reduced than VMAT and HT in middle thoracic EC. For lower thoracic EC, the three techniques offered similar CI and HI (all p > 0.05). But VMAT dramatically lowered liver V30 (9.97 ± 2.84%), and reduced NTCP of lungs (Niemierko model: 0.47 ± 0.48%; Lyman-Kutcher-Burman model: 1.41 ± 1.07%) and liver (Niemierko model: 0.10 ± 0.08%; Lyman-Kutcher-Burman model: 0.17 ± 0.17%).
Conclusions: HT was a good option for cervical EC with complex target coverage but little lungs and heart involvement as it achieved superior dose conformity and uniformity. Due to potentially improving tumor control and reducing heart dose with acceptable lungs sparing, IMRT was a preferred choice for upper and middle thoracic EC with large lungs involvement. VMAT could ameliorate therapeutic ratio and lower lungs and liver toxicity, which was beneficial for lower thoracic EC with little thoracic involvement but being closer to heart and liver. Individually choosing optimal technique for EC in different location will be warranted.
Introduction
Esophageal cancer (EC) is the eighth most common carcinoma and the sixth leading cause of cancer-related death worldwide (1, 2). Radiotherapy (RT) plays a major role in multimodality management of EC. However, it still presents many challenges in treatment planning for EC. The planning target volume (PTV) is centralized and surround by several critical organs at risk (OARs) including lungs, heart, spinal cord, liver and kidneys. Although the esophagus can endure radiation dose up to 60 Gy, the highly radiosensitive nearby OARs must be spared to prevent potentially severe adverse events. More importantly, it is well-recognized that a superior RT technique which can facilitate the delivery of a substantial radiation dose to the tumor and avoid excess dose to the normal tissues in the tumor vicinity may improve patients' disappointing local control and survival (3, 4). Therefore, the question is raised that in order to improve target coverage and dose distributions of tumor as well as spare OARs, which is the optimal RT technique for EC?
Several modern external beam RT techniques are available currently to treat EC in clinical. Compared with 3-dimensional conformal radiotherapy (3D-CRT), intensity modulated radiotherapy (IMRT) has been introduced to improve target coverage (5, 6) and reduce the doses delivered to the surrounding normal tissues (7–9). However, even with IMRT, lungs and cardiac toxicities remain to be seriously regarded. Volumetric modulated arc radiotherapy (VMAT), regarded as a new generation linear-accelerator IMRT (10), can offer similar or even better dose distributions compared with IMRT and significantly shorten the delivery time (11–13). But the practical value of VMAT for EC is still debatable. Helical tomotherapy (HT) is an advanced image-guided radiotherapy technique (IGRT) combing daily pretreatment mega-voltage computed tomography (MVCT) scans with 360° dynamic rotational IMRT (14). Benefitting from pre-therapy visualization of target volumes and normal tissues, HT can further reduce irradiated OARs and permit dose escalation to tumor (15). Despite the advantages of HT have been performed in treatment of cervical cancer, nasopharyngeal carcinoma, and central nervous system tumors, its widespread application value in EC needs to be confirmed. In the past years, numerous studies have previously explored RT techniques for treating EC, but there is still no clear consensus on a preferred technique for it. Additionally, these studies have mainly focused on analysis of dose volume histogram (DVH) and dose distributions to evaluate RT plans. However, in some cases in which the treatment plans yield similar levels of dosimetric performance, analyzing other indices based on radiobiology may be essential when attempting to precisely evaluate the treatment outcome, particularly in terms of tumor control and normal tissue sparing (16, 17). But this issue is not received enough attention and the relevant data is rare. To the best of our knowledge, before our study, IMRT, VMAT, and HT treatment plans for patients with EC had not been analyzed based on both dosimetric and radiobiological parameters.
In this study, we aimed to not only compare the dose distributions to PTV and OARs for IMRT, VMAT, and HT, but also initially investigate the tumor control probability (TCP) and normal tissue complication probability (NTCP) of the three techniques. More importantly, we sought to select the optimal RT technique from IMRT, VMAT, and HT for EC in different location using both dosimetry and radiobiology.
Materials and Methods
Patients
Forty EC patients previously received definitive RT in our department were recruited for this study, involving 10 cases located in the cervix, upper, middle, and lower thorax, respectively. Each patient was re-planned planning for IMRT, VMAT, and HT. The clinicopathological data of patients was obtained from our hospital's medical records. All tumors were staged according to the 8th edition of the American Joint Committee on Cancer staging manual (18). Detailed baseline characteristics were shown in Table 1. Each patient gave written informed consent. This study was approved by Ethics Committee of Shandong Cancer Hospital and in accordance with the Declaration of Helsinki.
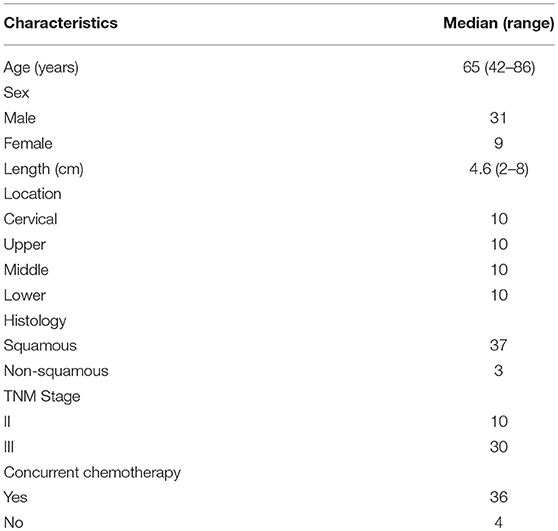
Table 1. Patients' characteristics.
Immobilization and Simulation
Patients were immobilized supinely by a thermoplastic custom-made mask on the head, neck and shoulders for the cervical, upper, and middle thoracic EC or with their arms raised above their heads using vacuum casts for the lower thoracic EC. Afterwards, the intravenous contrast-enhanced computed tomographic (CT) images of each patient for treatment planning were obtained. These images were taken at a 3 mm thickness throughout the neck, thorax, and upper abdomen that enlarge to 10 cm beyond the tumor's border. The simulation CT images were transferred to the Eclipse system (Varian Medical Systems, Palo Alto, CA, Version 13.5.35) for IMRT and VMAT planning. After delineating the targets and OARs, the CT datasets were transmitted to the TomoTherapy® Planning Station (Accuray, Sunnyvale, CA, Hi-Art, Version 5.1.3).
Target Volumes and OARs Delineation
The delineation of target volumes and OARs referred to the Radiotherapy and Oncology Group (RTOG) guidelines. The gross tumor volume (GTV) involving the primary tumor and positive lymph nodes were identified by the diagnostic CT scans, positron emission tomography/CT(PET-CT) scans, barium swallow, and esophagoscopy. The clinical target volume high (CTVH) was defined as 3–4 cm superior-inferior margins and 1 cm radial margins with respect to the GTV with 1 cm uniform margins for positive nodes. The elective nodal regions depending on the location of the primary tumor were included in the clinical target volume low (CTVL). The planning target volume high/low (PTVH/L) was delineated with additional 0.5–1.0 cm margins to the CTVH/L. All patients were treated by simultaneous integrated boost (SIB) technique. The prescribed dose was 50.4 Gy in 28 fractions for the PTVL and 59.36 Gy in 28 fractions for the PTVH according to Welsh et al. (19). The lungs, heart, spinal cord, and liver were contoured as the dose-limiting OARs. In detail, all inflated and collapsed, fibrotic, and emphysematic lungs were contoured with inclusion of small vessels extending beyond the hilar regions, excluding the proximal bronchial tree. The contour of heart was along with the pericardial sac. The superior aspect (or base) began at the level of the inferior aspect of the pulmonary artery passing the midline and extended inferiorly to the apex of the heart. The spinal cord was delineated starting at the same cranial level as the esophagus to the bottom of L2 or at the level in which the cord ended. For liver contouring, gallbladder should be excluded. The inferior vena cava (IVC) was not included when it was discrete from the liver. The portal vein (PV) should be included in the liver contour when caudate lobe was seen to the left of PV, but excluded when caudate lobe was seen to the posterior of PV (20, 21).
Treatment Planning and Delivery
IMRT and VMAT plans were generated on a Varian treatment planning system (TPS). They were delivered with 6 MV photons beams from a Varian trilogy linear accelerator equipped with a Millennium Multileaf Collimator (MLC) with 120 leaves (spatial resolution of 5 mm at isocenter for the central 20 cm and of 10 mm in the outer 2 × 10 cm, a maximum leaf speed of 2.5 cm/s and a leaf transmission of ~1.5%). The dose calculations were performed by the anisotropic analytical algorithm (AAA) and a grid resolution of 2.5 mm, considering heterogeneity corrections. IMRT plans were implemented using 7, 9, or 10 coplanar fields. The arrangement of each beam was optimized for PTV coverage and OARs sparing. Specifically, for cervical EC, 9 coplanar fields were chosen. Because of the extremely irregular shape of tumor, 10 coplanar fields in only two cases were created by adding an additional field for tumor target to 9 coplanar fields in order to achieve better target conformity. Seven coplanar fields were selected for upper, middle and lower thoracic EC. Beam geometry consisted of each treatment field with the following gantry angles: 0°/35°/70°/160°/200°/290°/325° (7 fields), 0°/35°/70°/160°/175°/200°/230°/290°/325° (9 fields), and 0°/35°/70°/160°/175°/200°/230°/290°/325° with an additional gantry angle based on individual irregular shape of tumor (10 fields). The MLC leaf sequences were generated using the dynamic sliding window IMRT delivery technique with a fixed dose rate (DR) of 400 MU/min. For VMAT plans, since each single arc was limited to a sequence of 177 control points, the application of two coplanar arcs that increase the modulation factor during optimization, could allow the optimizer to achieve a higher target homogeneity and lower OARs involvement at the same time (11, 22). Thus, VMAT plans were generated by two coplanar arcs of 360° with opposition rotation (clock-wise or counter clock-wise; without the sectors from 80 to 110° and 250 to 280° aiming for sparing lungs; a collimator rotation between ±30°). Dynamic MLC, changeable instantaneous DR and variable gantry rotational speed were utilized to optimize the dose distributions of VMAT. The maximum DR of VMAT was fixed at 600 MU/min. HT plans were designed on a tomotherapy planning station. They were optimized by superposition convolution algorithm with a dose calculation grid resolution of 1.875 × 1.875 mm2. A field width of 2.51 cm, a pitch of 0.287, and a modulation factor of 3.00 were implemented in our study. HT delivered 6 MV X-ray beams with a 64 leaves binary MLC of a 40 cm wide fan of thicknesses 0.5–5.0 cm to an isocenter 85 cm away from the source. The DR of HT was set to 846 MU/min. Previous study reported when more beams from different directions focused on the tumor, the volume of normal tissue with low-dose exposure would increase (23). HT with 51 gantry angles per rotation 360° led to extensive low-dose distribution in lungs during RT, especially for EC. Consequently, the fan-shaped virtual blocks were used in all HT plans to restrict beamlets and optimize dose distribution to spare lungs.
Treatment Plan Evaluation
For PTVs, D2, D98, D50, Dmean, conformity index (CI), and homogeneity index (HI) were analyzed. The CI was defined as: CI = (TVPV/VPTV)/(VTV/TVPV), where VPTV was the volume of the PTV, TVPV was the volume of PTV covered by the prescribed isodose line, VTV was the volume enclosed by the prescription dose line (24). The 95% isodose was chosen as the prescription isodose line. The value of CI varied from 0 to 1. The value was closer to 1, the conformity of dose distribution was better. The HI was defined as: HI = (D2–D98)/D50, where D2, D50, and D98 were the dose at 2, 50, and 98% of the PTV, respectively (25). A lower HI indicated higher dose homogeneity. For OARs, mean lung dose (MLD) and the volumes of lung receiving dose at least 5, 10, 20, and 30Gy (V5, V10, V20, and V30), mean heart dose (MHD) and the volumes of heart receiving dose at least 30, 40, and 50Gy (V30, V40, and V50), the volumes of liver receiving dose at least 20 and 30 Gy (V20 and V30), and the maximum dose (Dmax) to the spinal cord were analyzed.
Radiobiological parameters including TCP and NTCP were evaluated using Niemierko's phenomenological model (26–28). The calculations were as follows. The physical dose was firstly converted to the biologically equivalent dose of 2 Gy (EQD2) by the linear-quadratic (LQ) model and then was used to calculate the equivalent uniform dose (EUD). The TCP and NTCP were finally obtained based on the EUD. The parameters and endpoints for TCP and NTCP calculations were taken from previous studies (17, 29, 30) and were shown in Table 2A. More importantly, it was well-known that the parameters of the radiobiological models would influence the results, therefore, we also used the Webb-Nahum model (WN model) and the Lyman-Kutcher-Burman (LKB) model to further confirm our results of TCP and NTCP calculations. The WN model calculated the predictive TCP from the DVH for the PTV on basis of a normal distribution of radiosensitivity α values among a cohort of patients. The parameters used in this model were αm = 0.40 Gy−1, σα = 0.08 Gy−1, and ρ = 107/cm3, where αm and σα were the mean and standard deviation of the values of α, respectively, ρ represented the uniform clonogenic cell density (31, 32). The LKB model has been recognized to predict the NTCP values of OARs (33, 34). The tolerance dose for a 5% (TD5) or 50% (TD50) complication, n and m values in this model for predicting complications of OARs were obtained from Burman et al. and were displayed in Table 2B (35). All DVH data were exported from TPS and imported into MATLAB 2017a (Mathworks, Natick, MA, USA) to calculate TCP and NTCP.
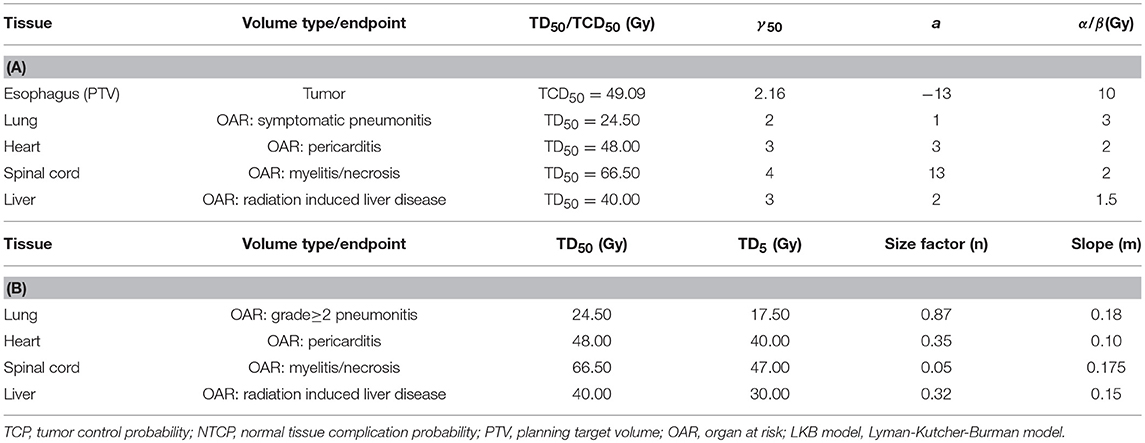
Table 2. Radiobiological parameters used to calculate TCP and NTCP by Niemierko's model (A) or LKB model (B).
Plans were normalized to 95% of the PTV received 100% of the prescribed dose. The dose constraints were defined for OARs as follows: spinal cord < 50 Gy; total lungs: V5 < 60%, V20 < 30%, V30 < 20%, MLD < 20 Gy; heart: V30 ≤ 4 0%, V40 < 3 0%; liver: V20 ≤ 30%, V30 ≤ 20%. To ensure the tumor coverage requirements, a waiver could be applied for these dose constraints in some cases.
Statistical Analyses
The data was expressed as mean ± standard deviation or median (range). ANOVA and post-hoc two-tailed paired t-tests were used. P < 0.05 indicated statistically significant. All data were performed with the Statistical Package for Social Science program (SPSS for Windows, version 17.0, SPSS Inc., Chicago, IL).
Results
The dose-volume parameters of PTVs were listed in Table 3. In cervical EC, HT yielded more superior HI and CI than IMRT and VMAT for PTVH (HI: 0.10 ± 0.01, 0.11 ± 0.02, 0.07 ± 0.03, respectively, p < 0.001; CI: 0.84 ± 0.07, 0.81 ± 0.05, 0.90 ± 0.06, respectively, p = 0.007). Meanwhile, the HI of PTVL in HT showed more appropriate dose homogeneity (0.16 ± 0.03, 0.19 ± 0.03, 0.12 ± 0.04, respectively; p = 0.001). D2, D98, D50, and Dmean of PTVH as well as D98 of PTVL were significantly different in IMRT, VMAT, and HT (all p < 0.05). In upper thoracic EC, the best HI (0.09 ± 0.01, 0.14 ± 0.03) and CI (0.88 ± 0.04, 0.72 ± 0.07) of PTVH and PTVL were generated by IMRT rather than VMAT and HT (all p < 0.05). Moreover, IMRT, VMAT, and HT provided the obviously diverse results in terms of D2 and D98 of PTVH (all p < 0.05), as well as D50, D98, and Dmean of PTVL (all p < 0.05). For middle thoracic EC, the HI (0.07 ± 0.01) and CI (0.87 ± 0.05) of PTVH and HI (0.14 ± 0.02) of PTVL in IMRT were significant improvement over VMAT and HT (all p < 0.05). Besides, the three techniques generated different levels of D2 and D98 for PTVH and D2, D98, D50, and Dmean for PTVL (all p < 0.05). In lower thoracic EC, no significant differences were observed for the three plans regarding HI and CI of PTVH and PTVL (all p > 0.05). The detailed information of the treatment plans is shown in the Supplementary Material, which could be available online. Figures 1A–D showed the dose distributions of IMRT, VMAT, and HT plans in a patient with EC in different location. Figures 2A–D displayed the DVHs for the 3 plans in the same case.
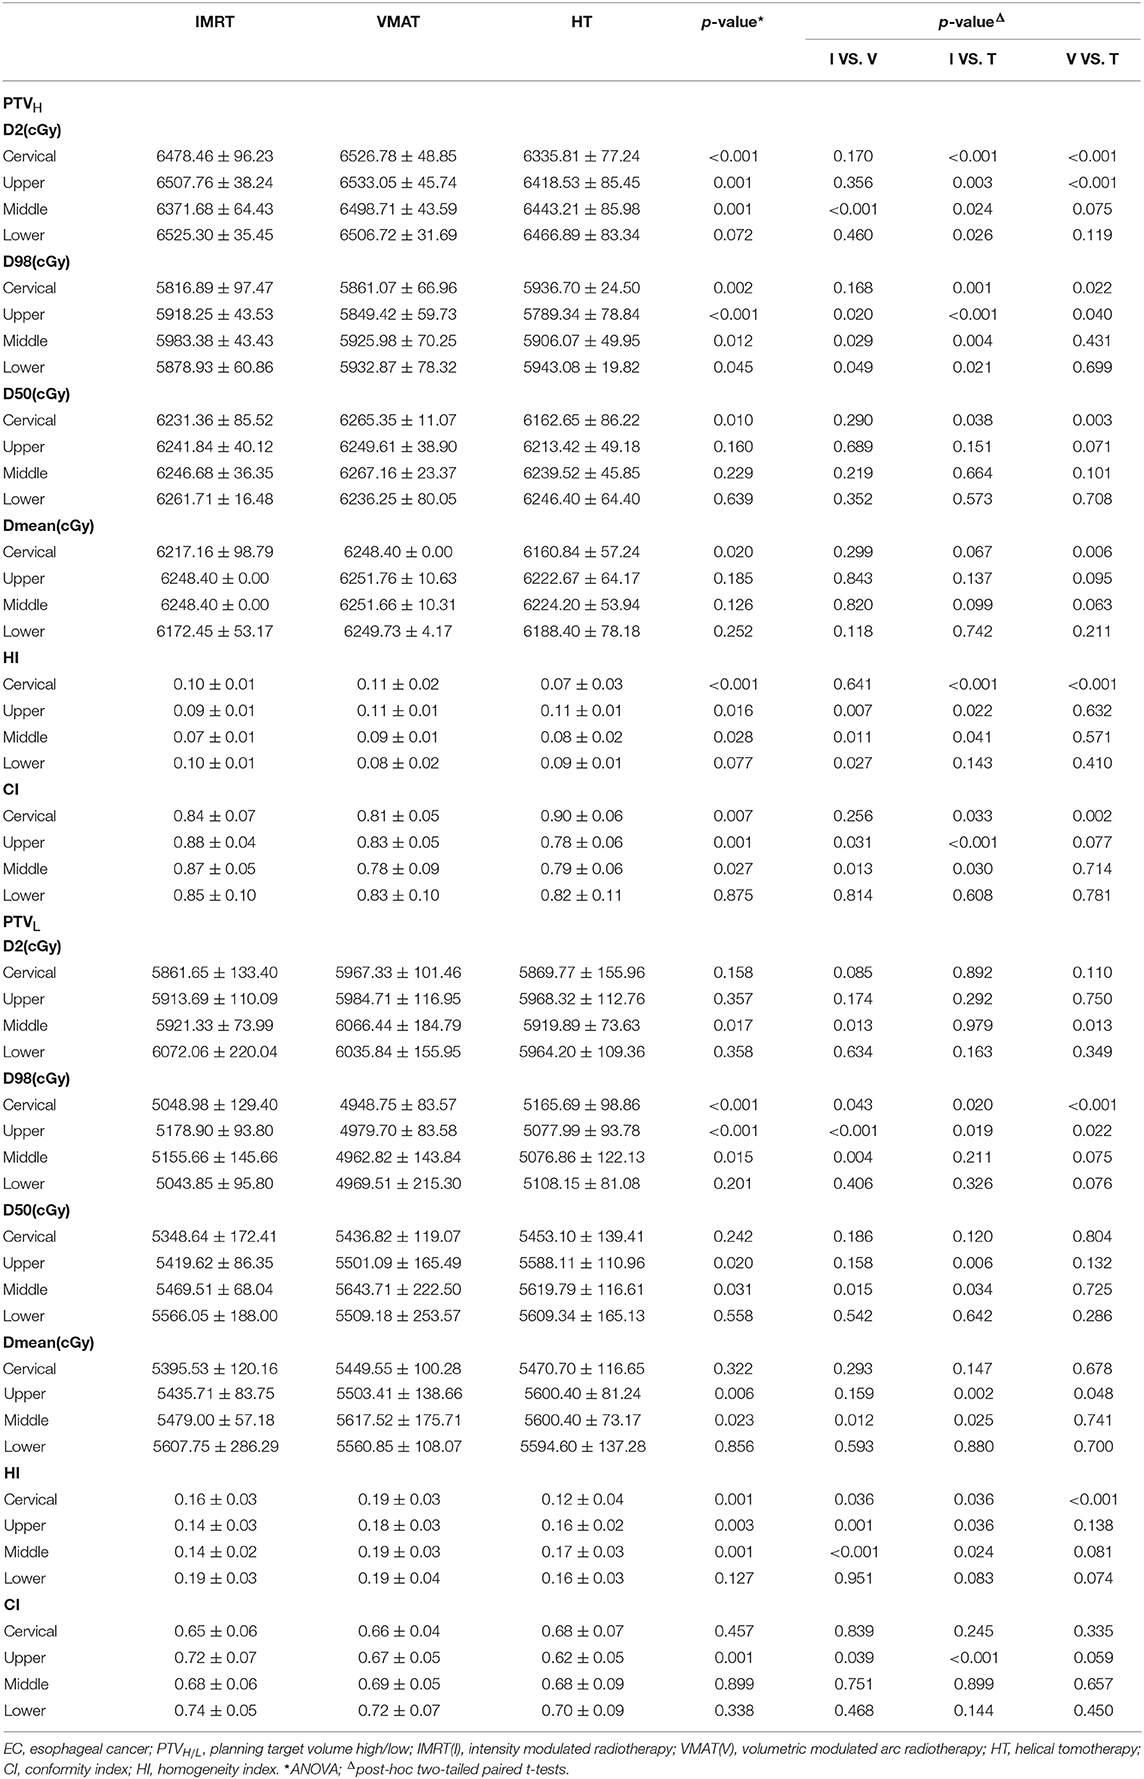
Table 3. Dosimetric results for PTVs in cervical, upper, middle, and lower thoracic EC.
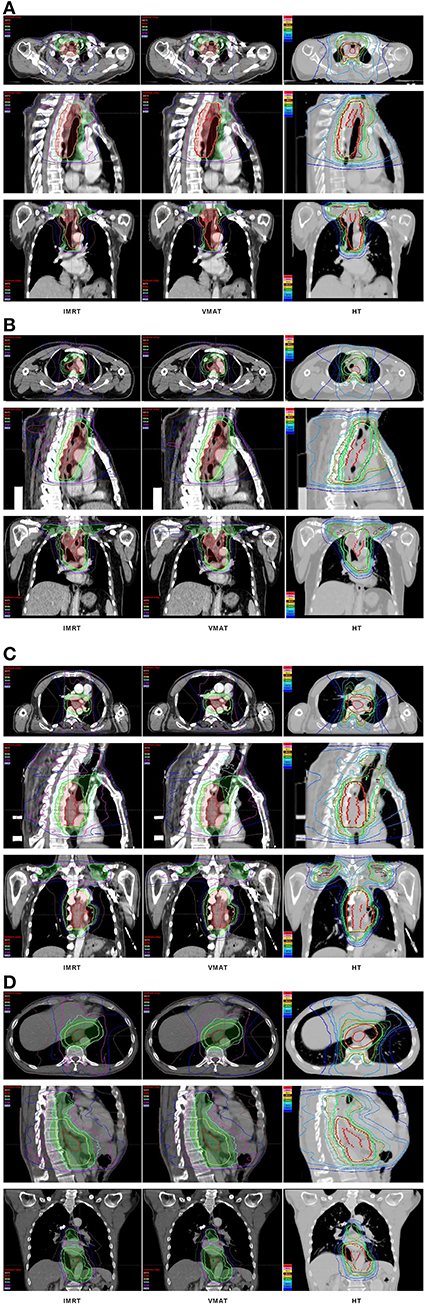
Figure 1. Dose distributions. Dose distributions of IMRT (left), VMAT (middle), HT (right) for a cervical (A), upper (B), middle (C), and lower (D) thoracic EC in axial, sagittal, and coronal views. EC, esophageal cancer; IMRT, intensity modulated radiotherapy; VMAT, volumetric modulated arc radiotherapy; HT, helical tomotherapy.
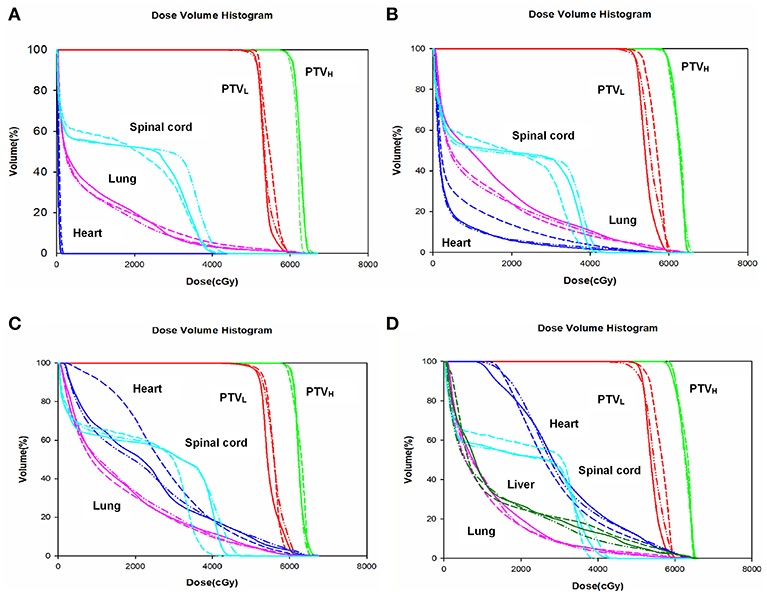
Figure 2. Dose volume histogram. Comparing the dose volume histogram from IMRT, VMAT, and HT of a patient with cervical (A), upper (B), middle (C), and lower (D) thoracic EC. EC, esophageal cancer. Solid line: IMRT; Dashed line: VMAT; Dash-dot-dotted line: HT. IMRT, intensity modulated radiation therapy; VMAT, volumetric modulated radiation therapy; HT, helical tomotherapy. Green: PTVH; Red: PTVL; Cyan: spinal cord; Pink: lung; Blue: heart; Dark green: liver.
The dosimetric results for lungs, heart, spinal cord and liver were summarized in Table 4. Specifically, V5, V10, V20, V30, and MLD of lungs showed no significant difference in any EC position in IMRT, VMAT, and HT (all p > 0.05). However, we surprisedly found the heart V30 and MHD of IMRT in middle thoracic EC were sharply reduced than that of VMAT and HT (all p < 0.05). The Dmax to spinal cord in HT displayed the lowest level compared with IMRT and VMAT in EC of all locations (all p < 0.05). Furthermore, we investigated that the liver V30 of VMAT (9.97 ± 2.84%) in lower thoracic EC was dramatically decreased than two other plans (15.24 ± 5.48%, 17.04 ± 6.57%, p = 0.014).
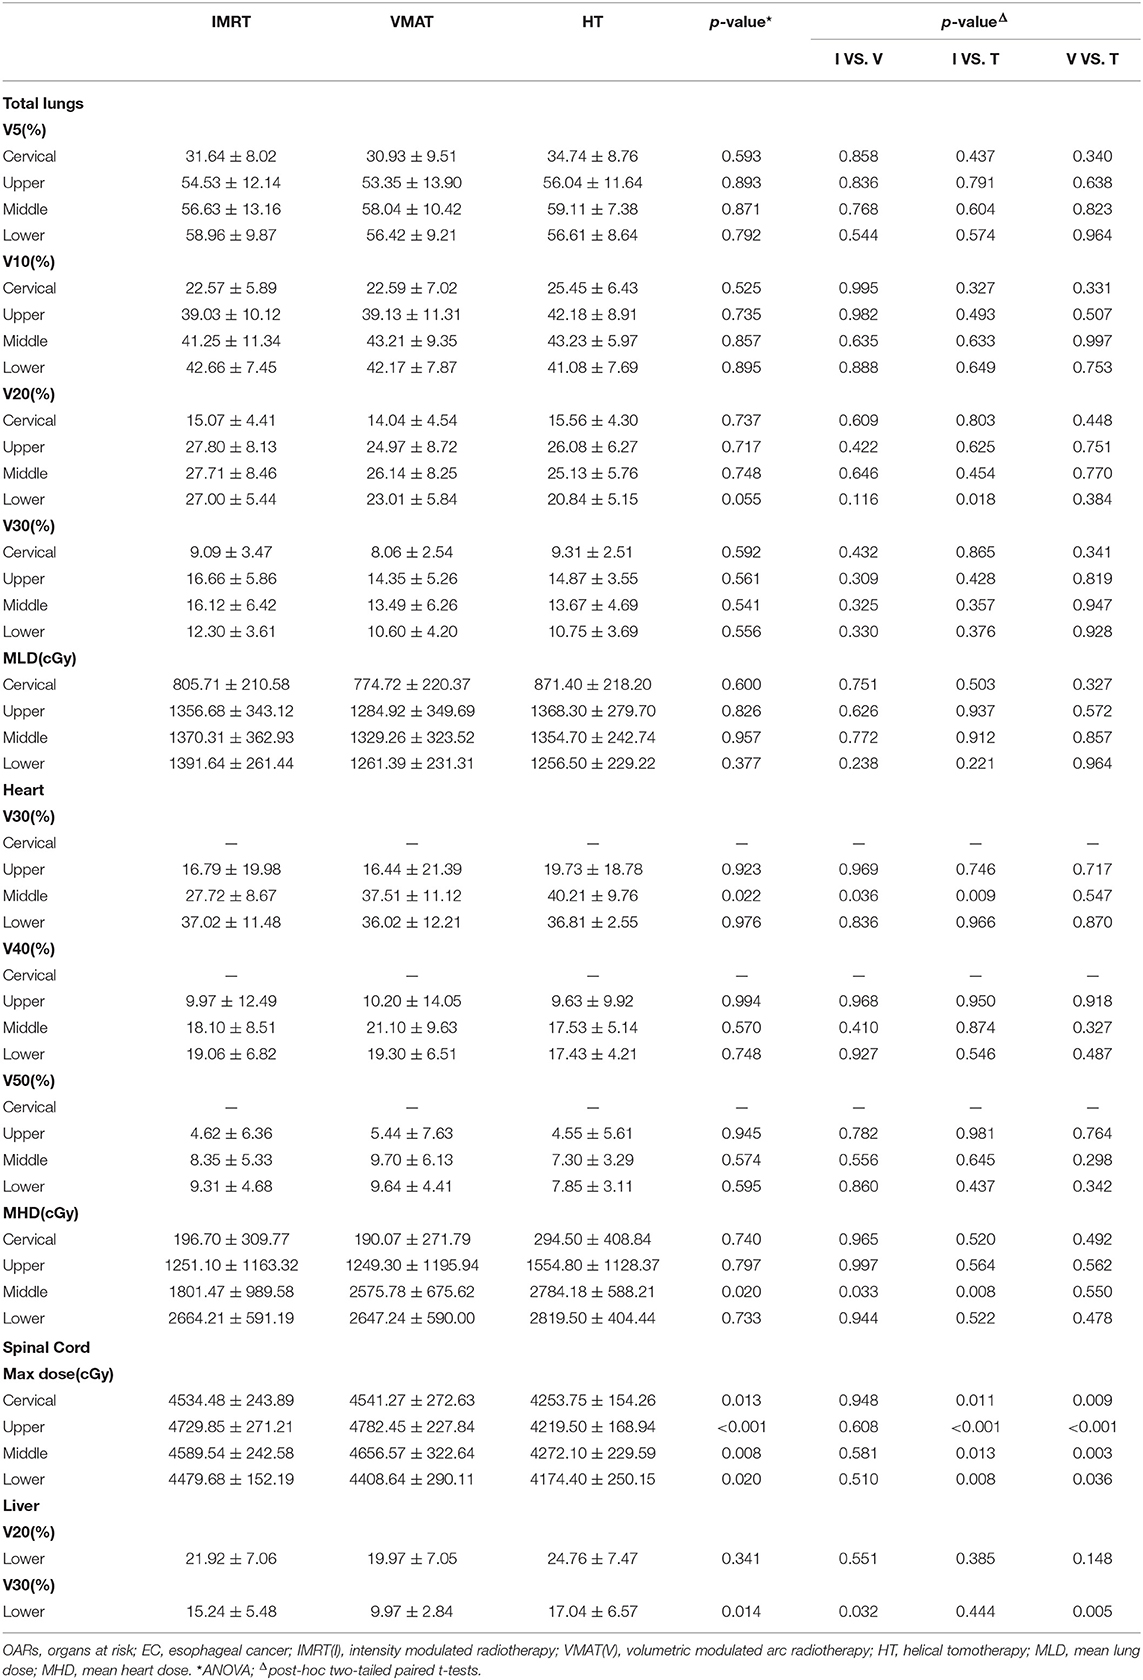
Table 4. Dosimetric results for OARs in cervical, upper, middle, and lower thoracic EC.
The data of TCP and NTCP was listed in Table 5. Although three different methods including Niemierko's phenomenological model, WN model and LKB model were utilized to calculate TCP and NTCP, the similar results were still observed. In detail, HT yielded improved TCP over IMRT and VMAT in cervical EC (p < 0.01). The TCP of IMRT in upper and middle thoracic EC were both notably increased in comparison with VMAT and HT (all p < 0.05). But for lower thoracic EC, VMAT showed better TCP followed by HT, and IMRT had the poorest result. Additionally, we found that NTCP of heart could be dramatically reduced by IMRT rather than VMAT and HT in middle thoracic EC (p < 0.05). VMAT significantly lowered NTCP of lungs and liver in lower thoracic EC compared to IMRT and HT (all p < 0.05). Besides, the different trends of NTCP of heart and lungs were not observed in other positions. NTCP of spinal cord was extremely low in all cases.
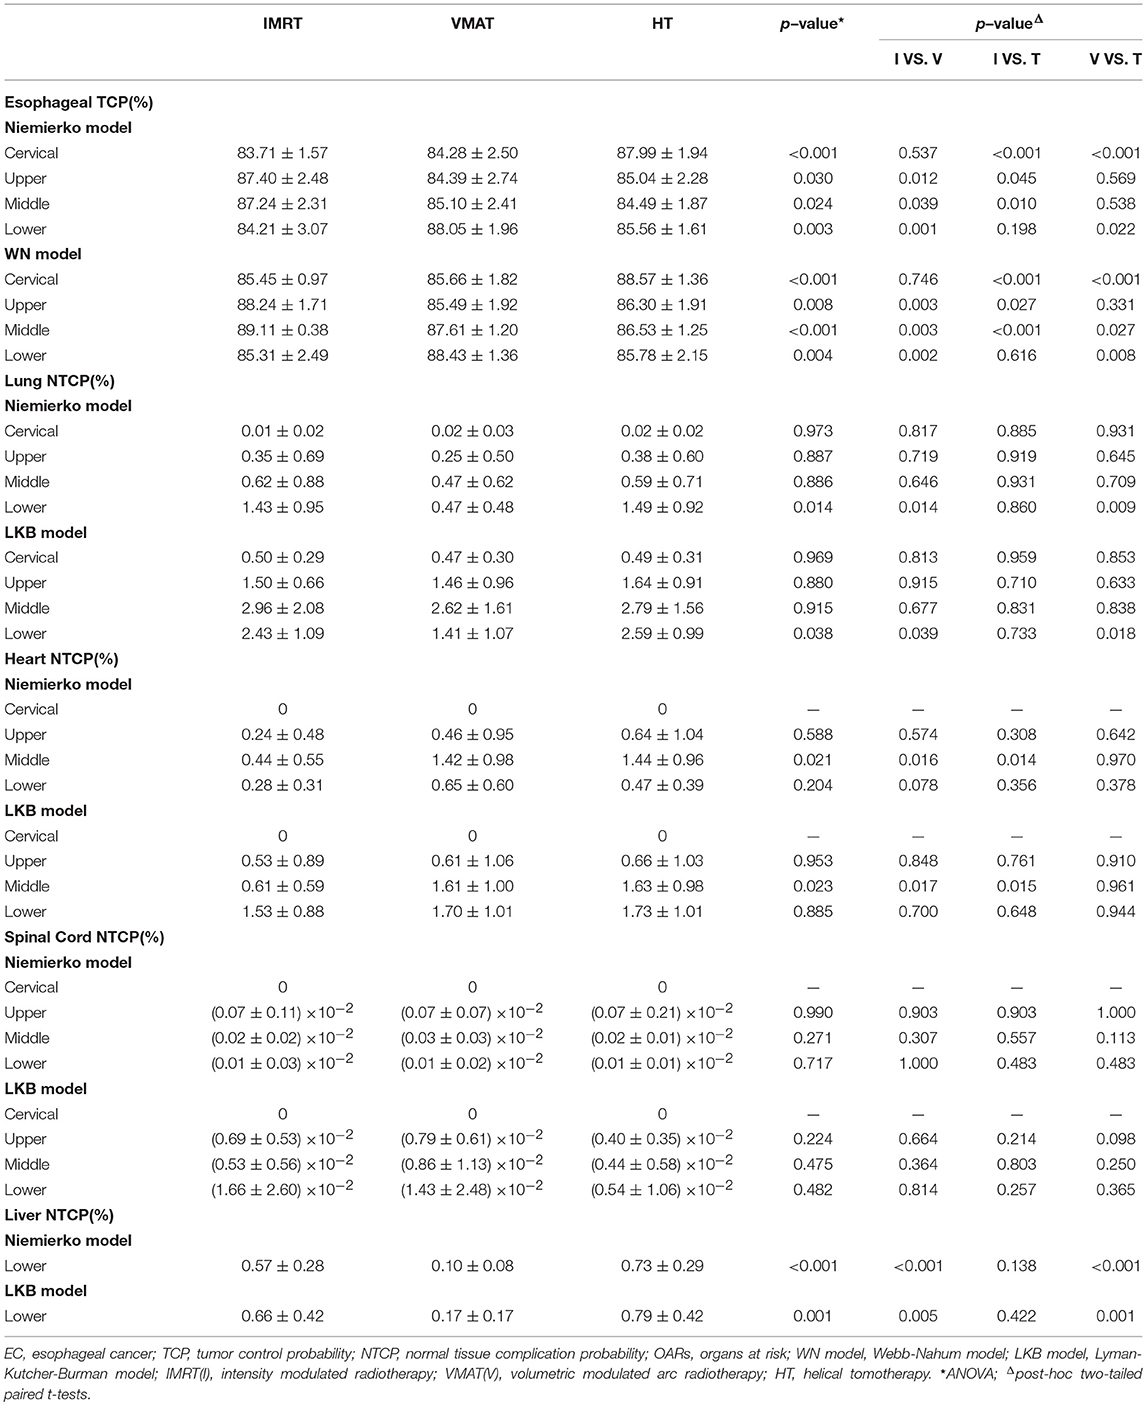
Table 5. The results of TCP for EC and NTCP for OARs.
Discussion
New and innovative RT techniques are urgently needed to deliver more safely and accurately for treating EC. Based on anatomical location, the esophagus is divided into four parts with unique characteristics. The cervical area frequently yields complex target coverage but implicating relatively small lungs volume. While, larger lungs volume is involved in the thoracic area. The lower area has smaller target volume but being closer to heart, liver, and kidneys. Notably, the primary tumor location is absolutely vital in deciding the optimal RT technique with regard to achieving an acceptable tradeoff between radiation induced toxicity and target coverage. Although increasing evidences have demonstrated that RT techniques could display different advantages and disadvantages for EC in different locations, the results were still inconclusive and needed to be further confirmed. Consequently, in this study, the widely used IMRT, VMAT, and HT were initially compared based on dosimetric and radiobiological evaluation. We sought to suggest a clear consensus on a preferred technique for EC in different location and generate better radiotherapeutic plans to guide clinical decision making.
Various DVH parameters were commonly used to evaluate treatment plan in clinical practice (36–38). However, the radiobiological analysis in view of the DVH curve as a whole might play a more critical role in determining the overall quality of treatment plan. Numerous studies indicated radiobiological models (28), which could immediately reflect tumor local control and OARs complications, should be regarded as an important consideration when selecting the optimal RT technique (11, 17). To date, no published articles have compared the IMRT, VMAT, and HT plans of EC using radiobiological evaluation. Therefore, the radiobiological parameters such as TCP and NTCP were calculated in this study. Our results undoubtedly extended and enlarged recent studies, and provided a new perspective for making clinical decisions. Integrating dosimetric and radiobiological parameters to evaluate treatment plan was more comprehensive and rational, especially in some cases yielding the analogical dosimetric metrics. As was reported in our study, IMRT, VMAT, and HT provided similar levels of dosimetry in lower thoracic EC, but radiobiological performance supported that VMAT was a better choice because of more superior TCP and lower NTCP of lungs and liver compared with IMRT and HT. Additionally, the radiobiological analysis was determined on the used models and parameters. In order to strengthen the reliability of our data, three independent predicting models were utilized in our study. Interestingly, we observed the similar trends of TCP and NTCP, and then further confirmed our results reliable. Taken together, we strongly suggested radiobiological evaluation should be widely adopted in clinical to cover the deficiency of dosimetric analysis.
Analysis of PTV coverage and dose homogeneity for IMRT, VMAT, and HT displayed different trends depending on tumor position. Wang et al. (37) compared the target coverage and dose distributions of HT, VMAT, and IMRT for locally advanced EC with SIB technique. HT proved to be superior to VMAT and IMRT in terms of CI and HI. Unfortunately, the study did not take the EC position into consideration. This was inappropriate and a limitation. As we reported, HT could yield the best CI and HI only in cervical EC but not in other positions. Another study was conducted to compare IMRT, HT, and VMAT for middle and distal EC (38). Being similar to this study, we also supported that IMRT was a preferred option for treating EC with large lungs volume involvement, since it could evidently reduce OARs dose with superior PTV coverage. Besides, our further analysis demonstrated that HT was a good option with little lung and heart involvement as it achieved excellent dose conformity and uniformity. VMAT was relatively appropriate with little thoracic involvement but surrounded by heart and liver. Although our findings were supported by previous evidences in a way, the hot topic which was the optimal RT technique for treating EC was still no consensus. Yin et al. performed a study to demonstrate that VMAT proved to be slightly better than IMRT in terms of target dose distributions for EC of all locations, and had equivalent or better OARs dose sparing and lower NTCP of lungs and heart (11). But we draw similar conclusions only in lower thoracic EC. Zhang et al. performed dosimetric analysis of TomoDirect (TD), HT, VMAT, and IMRT plans in upper thoracic EC, reporting that HT was considered as a good option with splendidly homogeneous and highly conformal dose distributions (36). However, IMRT rather than HT in our study provided superior CI and HI in upper thoracic EC. Analyzing the reasons leading to the controversial results, it may be attributed to the different numbers and angles of radiation fields, the experience of RT physicist and so on. More studies will be needed to support our results.
For carcinoma of the esophagus, radiation pneumonitis (RP) has been regarded as one of the most challenging toxicities. Numerous studies demonstrated the relationship between dosimetric parameters and RP, including MLD, V20, V13, V10, and V5 of lungs, in which V20 and MLD were strongly predictors (39–42). Tonison et al. (43) indicated that limiting the V20 to 23% or lower could keep the risk for grade≥2 RP below 10% for patients with EC who received chemoradiotherapy. Kwa et al. conducted a study of 540 patients irradiated for thoracic malignancy and proved the calculated risk of grade≥2 RP was 43, 18, and 11% for the MLD of 24–36, 16–24, and 8–16 Gy, respectively (44). The Quantitative Analysis of Normal Tissue Effects in the Clinic (QUANTEC) guidelines suggested if limiting the risk of RP ≤ 20%, it was prudent to restrict V20 ≤ 30–35%, and MLD ≤ 20–23 Gy with conventional fractionation (40). To reduce the incidence of RP in our study, V20 and MLD of lungs in IMRT, VMAT, and HT were strictly controlled in accordance with dosimetric requirements, and were not significantly different in the three plans for EC of all locations (all p > 0.05). Apart from V20 and MLD, emerging data suggested that percentage of lung volume receiving lower doses might be associated with RP. Emami et al. (29) pointed out that lungs V5 < 42% was related to the 5% incidence of symptomatic pneumonitis. While, V5 of lungs<42% was only achieved in cervical EC in this study. The increased low-dose volume of lungs should deserve more attention especially in EC cases with large thoracic involvement. In order to sharply reduce low-dose distribution of lungs, the fan-shaped virtual blocks in HT and the avoidance sectors in VMAT were used when we designed RT plans. Martin et al. (38) found that V10 and V15 of lungs in VMAT with two arcs were distinctly reduced than those in IMRT and HT for middle and distal EC. But these improvements came at the cost of higher dose to the heart. This prompted that if it was impossible to achieve all OARs dose constraints at the same time, how to make appropriate clinical decision for sparing each OAR was an urgent problem to be solved. Besides, according to our further analysis, it was clear that the target coverage and conformity for tumor and the dose constraints for normal organs should be well-managed in a tradeoff manner. In short, the better target coverage might lead to the more doses to OARs. The reduced dose of OARs had to come at the cost of the superior target coverage in some cases. How to solve these tough difficulties with compromise, clinician needed to comprehensively consider multiple factors.
Another hot topic was that radiation to the chest malignancy could exert long-term cardiac morbidities and mortality. Darby et al. (45) reported the rates of major coronary events increased linearly with the MHD by 7.4% per gray with no apparent threshold. V30 and V50 of heart have also been regarded as vital predictors for cardiac toxicities (46, 47). Up-dated evidences supported that the dose to heart was not only related to itself toxicity, but the combined dose to the heart and lung might have a synergistic effect on the increased risk of RP (48, 49). Thus, it was quite necessary to minimize dose to heart as low as possible. As the QUANTEC guidelines suggested, the long-term cardiac mortality could reduce <1% with <10% of heart V25. Although V30, V40, V50, and MHD of the heart were clinically acceptable in our study, it was really difficult to guarantee that heart V25 was <10% in particular for the middle and distal EC. Fortunately, we surprisedly found IMRT proved to be superior over VMAT and HT in terms of heart sparing for middle thoracic EC. It was time to pay close attention to adverse cardiac events for distal EC, because no present used RT technique could effectively reduce heart dose.
We needed to discuss the limitations of our study at this point. Firstly, because of a single-center and small sample size study, many confounding factors might affect the results. Our conclusions will be further confirmed. Secondly, more clinical trials investigating the local-regional control, overall survival and toxicity of different RT techniques for EC patients will be needed and aid the selection of the best possible treatment planning technique. Thirdly, with the advances in proton therapy (PT), it may be widely used in EC in future. However, no treatment plans of PT were generated in our study because of our institute not yet carrying out any related service. The dosimetry and radiobiology between PT and photon therapy will be compared in further study. But even so, given a solid based analysis, our study provided a new insight into better understanding of IMRT, VMAT, and HT plans characteristics in EC of different anatomical parts and aimed to guide clinical strategy.
Conclusions
We initially suggested that EC of different location should be treated by different RT techniques. Moreover, radiobiological parameters such as TCP and NTCP should be widely used to evaluate treatment plans not only depending on dosimetric analysis. Overall, HT was a good option for cervical EC with complex target conformity but little lungs and heart involvement since it achieved superior dose conformity and uniformity. Due to potentially improving tumor control and reducing heart dose with acceptable lungs sparing, IMRT was a preferred choice for upper and middle thoracic EC with large lungs involvement. VMAT could ameliorate therapeutic ratio and lower lungs and liver toxicity, which was beneficial for lower thoracic EC with little thoracic involvement but being closer to heart and liver. Depending on the primary tumor location to choose optimal technique for EC will be warranted.
Data Availability
All data generated or analyzed during this study are included in this published article.
Ethics Statement
This study was approved by Ethics Committee of Shandong Cancer Hospital. Each patient gave written informed consent in accordance with the Declaration of Helsinki.
Author Contributions
LW designed the study, generated the radiotherapy treatment plans, carried out data collection, statistical analysis, and wrote the initial draft. CQL, XS, and DS helped to generate the radiotherapy treatment plans. LP and YL contributed to data collection. XM participated in the design of the study. CML contributed to the statistical analysis. JL and JY supervised the research. All authors read and approved the final version of this manuscript.
Conflict of Interest Statement
The authors declare that the research was conducted in the absence of any commercial or financial relationships that could be construed as a potential conflict of interest.
Acknowledgments
The authors wish to thank patients and their kin for supporting our work and thank editors as well as reviewers for reading the manuscript.
Supplementary Material
The Supplementary Material for this article can be found online at: https://www.frontiersin.org/articles/10.3389/fonc.2019.00674/full#supplementary-material
Supplementary Materials. Treatment plans of a patient with cervical (Image 1_v1), upper (Image 2_v1), middle (Image 3_v1), and lower (Image 4_v1) thoracic esophageal cancer.
References
1. Torre LA, Bray F, Siegel RL, Ferlay J, Lortet-Tieulent J, Jemal A. Global cancer statistics, 2012. CA Cancer J Clin. (2015) 65:87–108. doi: 10.3322/caac.21262
2. Chen W, Zheng R, Baade PD, Zhang S, Zeng H, Bray F, et al. Cancer statistics in China, 2015. CA Cancer J Clin. (2016) 66:115–32. doi: 10.3322/caac.21338
3. Cooper JS, Guo MD, Herskovic A, Macdonald JS, Martenson JA Jr, Al-Sarraf M, et al. Chemoradiotherapy of locally advanced esophageal cancer: long-term follow-up of a prospective randomized trial (RTOG 85-01). Radiation Therapy Oncology Group. JAMA. (1999) 281:1623–7. doi: 10.1001/jama.281.17.1623
4. Minsky BD, Pajak TF, Ginsberg RJ, Pisansky TM, Martenson J, Komaki R, et al. INT 0123 (Radiation Therapy Oncology Group 94-05) phase III trial of combined-modality therapy for esophageal cancer: high-dose versus standard-dose radiation therapy. J Clin Oncol. (2002) 20:1167–74. doi: 10.1200/JCO.2002.20.5.1167
5. Welsh J, Palmer MB, Ajani JA, Liao Z, Swisher SG, Hofstetter WL, et al. Esophageal cancer dose escalation using a simultaneous integrated boost technique. Int J Radiat Oncol Biol Phys. (2012) 82:468–74. doi: 10.1016/j.ijrobp.2010.10.023
6. Fenkell L, Kaminsky I, Breen S, Huang S, Van Prooijen M, Ringash J. Dosimetric comparison of IMRT vs. 3D conformal radiotherapy in the treatment of cancer of the cervical esophagus. Radiother Oncol. (2008) 89:287–91. doi: 10.1016/j.radonc.2008.08.008
7. Kole TP, Aghayere O, Kwah J, Yorke ED, Goodman KA. Comparison of heart and coronary artery doses associated with intensity-modulated radiotherapy versus three-dimensional conformal radiotherapy for distal esophageal cancer. Int J Radiat Oncol Biol Phys. (2012) 83:1580–6. doi: 10.1016/j.ijrobp.2011.10.053
8. Lin SH, Wang L, Myles B, Thall PF, Hofstetter WL, Swisher SG, et al. Propensity score-based comparison of long-term outcomes with 3-dimensional conformal radiotherapy vs. intensity-modulated radiotherapy for esophageal cancer. Int J Radiat Oncol Biol Phys. (2012) 84:1078–85. doi: 10.1016/j.ijrobp.2012.02.015
9. Haefner MF, Lang K, Verma V, Koerber SA, Uhlmann L, Debus J, et al. Intensity-modulated versus 3-dimensional conformal radiotherapy in the definitive treatment of esophageal cancer: comparison of outcomes and acute toxicity. Radiat Oncol. (2017) 12:131. doi: 10.1186/s13014-017-0863-3
10. Yu CX. Intensity-modulated arc therapy with dynamic multileaf collimation: an alternative to tomotherapy. Phys Med Biol. (1995) 40:1435–49.
11. Yin L, Wu H, Gong J, Geng JH, Jiang F, Shi AH, et al. Volumetric-modulated arc therapy vs. c-IMRT in esophageal cancer: a treatment planning comparison. World J Gastroenterol. (2012) 18:5266–75. doi: 10.3748/wjg.v18.i37.5266
12. Nicolini G, Ghosh-Laskar S, Shrivastava SK, Banerjee S, Chaudhary S, Agarwal JP, et al. Volumetric modulation arc radiotherapy with flattening filter-free beams compared with static gantry IMRT and 3D conformal radiotherapy for advanced esophageal cancer: a feasibility study. Int J Radiat Oncol Biol Phys. (2012) 84:553–60. doi: 10.1016/j.ijrobp.2011.12.041
13. Lin CY, Huang WY, Jen YM, Chen CM, Su YF, Chao HL, et al. Dosimetric and efficiency comparison of high-dose radiotherapy for esophageal cancer: volumetric modulated arc therapy versus fixed-field intensity-modulated radiotherapy. Dis Esophagus. (2014) 27:585–90. doi: 10.1111/dote.12144
14. Dawson LA, Jaffray DA. Advances in image-guided radiation therapy. J Clin Oncol. (2007) 25:938–46. doi: 10.1200/JCO.2006.09.9515
15. Rong Y, Welsh JS. Dosimetric and clinical review of helical tomotherapy. Expert Rev Anticancer Ther. (2011) 11:309–20. doi: 10.1586/era.10.175
16. Mavroidis P, Ferreira BC, Shi C, Lind BK, Papanikolaou N. Treatment plan comparison between helical tomotherapy and MLC-based IMRT using radiobiological measures. Phys Med Biol. (2007) 52:3817–36. doi: 10.1088/0031-9155/52/13/011
17. Allaveisi F, Moghadam AN. Comparison between the four-field box and field-in-field techniques for conformal radiotherapy of the esophagus using dose-volume histograms and normal tissue complication probabilities. Jpn J Radiol. (2017) 35:327–34. doi: 10.1007/s11604-017-0637-8
18. Rice TW, Gress DM, Patil DT, Hofstetter WL, Kelsen DP, Blackstone EH. Cancer of the esophagus and esophagogastric junction-Major changes in the American Joint Committee on Cancer eighth edition cancer staging manual. CA Cancer J Clin. (2017) 67:304–17. doi: 10.3322/caac.21399
19. Welsh JW, Seyedin SN, Allen PK, Hofstetter WL, Ajani JA, Chang JY, et al. Local control and toxicity of a simultaneous integrated boost for dose escalation in locally advanced esophageal cancer: interim results from a prospective phase I/II trial. J Thorac Oncol. (2017) 12:375–82. doi: 10.1016/j.jtho.2016.10.013
20. Kong FM, Ritter T, Quint DJ, Senan S, Gaspar LE, Komaki RU, et al. Consideration of dose limits for organs at risk of thoracic radiotherapy: atlas for lung, proximal bronchial tree, esophagus, spinal cord, ribs, and brachial plexus. Int J Radiat Oncol Biol Phys. (2011) 81:1442–57. doi: 10.1016/j.ijrobp.2010.07.1977
21. Esophageal Carcinoma Cooperative Group of Radiation Oncology Society of Chinese Medical Association. Treatment guideline of radiotherapy for Chinese esophageal carcinoma (draft). Chin J Cancer. (2010) 29:855–9. doi: 10.5732/cjc.010.10250
22. Ma Y, Li M, Yin Y, Kong L, Sun X, Lin X, et al. Hypofractionated stereotactic radiotherapy for brain metastases: a dosimetric and treatment efficiency comparison between volumetric modulated arc therapy and intensity modulated radiotherapy. Technol Cancer Res Treat. (2010) 9:499–507. doi: 10.1177/153303461000900508
23. Chandra A, Guerrero TM, Liu HH, Tucker SL, Liao Z, Wang X, et al. Feasibility of using intensity modulated radiotherapy to improve lung sparing in treatment planning for distal esophageal cancer. Radiother Oncol. (2005) 77:247–53. doi: 10.1016/j.radonc.2005.10.017
24. Feuvret L, Noël G, Mazeron JJ, Bey P. Conformity index: a review. Int J Radiat Oncol Biol Phys. (2006) 64:333–42. doi: 10.1016/j.ijrobp.2005.09.028
25. International Commission on Radiation Units and Measurements. Special considerations regarding-dose and dose-volume prescribing and reporting in IMRT. J ICRU. (2010) 10:27–40. doi: 10.1093/jicru/ndq008
26. Niemierko A. Reporting and analyzing dose distributions: a concept of equivalent uniform dose. Med Phys. (1997) 24:103–10. doi: 10.1118/1.598063
27. Gay HA, Niemierko A. A free program for calculating EUD-based NTCP and TCP in external beam radiotherapy. Phys Med. (2007) 23:115–25. doi: 10.1016/j.ejmp.2007.07.001
28. Oinam AS, Singh L, Shukla A, Ghoshal S, Kapoor R, Sharma SC. Dose volume histogram analysis and comparison of different radiobiological models using in-house developed software. J Med Phys. (2011) 36:220–9. doi: 10.4103/0971-6203.89971
29. Emami B, Lyman J, Brown A, Coia L, Goitein M, Munzenrider JE, et al. Tolerance of normal tissue to therapeutic irradiation. Int J Radiat Oncol Biol Phys. (1991) 21:109–22.
30. Okunieff P, Morgan D, Niemierko A, Suit HD. Radiation dose-response of human tumors. Int J Radiat Oncol Biol Phys. (1995) 32:1227–37.
31. Webb S, Nahum AE. A model for calculating tumour control probability in radiotherapy including the effects of inhomogeneous distributions of dose and clonogenic cell density. Phys Med Biol. (1993) 38:653–66.
32. Bedford JL, Viviers L, Guzel Z, Childs PJ, Webb S, Tait DM. A quantitative treatment planning study evaluating the potential of dose escalation in conformal radiotherapy of the oesophagus. Radiother Oncol. (2000) 57:183–93. doi: 10.1016/S0167-8140(00)00258-9
33. Miller J, Fuller M, Vinod S, Suchowerska N, Holloway L. The significance of the choice of radiobiological (NTCP) models in treatment plan objective functions. Austral Phys Eng Sci Med. (2009) 32:81–7. doi: 10.1007/BF03178632
34. Seppenwoolde Y, Lebesque JV, de Jaeger K, Belderbos JS, Boersma LJ, Schilstra C, et al. Comparing different NTCP models that predict the incidence of radiation pneumonitis. Normal tissue complication probability. Int J Radiat Oncol Biol Phys. (2003) 55:724–35. doi: 10.1016/s0360-3016(02)03986-x
35. Burman C, Kutcher GJ, Emami B, Goitein M. Fitting of normal tissue tolerance data to an analytic function. Int J Radiat Oncol Biol Phys. (1991) 21:123–35.
36. Zhang Y, Wang H, Huang X, Zhang Q, Ren R, Sun R, et al. Dosimetric comparison of TomoDirect, helical tomotherapy, VMAT, and ff-IMRT for upper thoracic esophageal carcinoma. Med Dosim. (2018) 44:167–72. doi: 10.1016/j.meddos.2018.05.001
37. Wang YC, Chen SW, Chien CR, Hsieh TC, Yu CY, Kuo YC, et al. Radiotherapy for esophageal cancer using simultaneous integrated boost techniques: dosimetric comparison of helical TomoTherapy, Volumetric-modulated Arc Therapy (RapidArc) and dynamic intensity-modulated radiotherapy. Technol Cancer Res Treat. (2013) 12:485–91. doi: 10.7785/tcrt.2012.500348
38. Martin S, Chen JZ, Rashid Dar A, Yartsev S. Dosimetric comparison of helical tomotherapy, RapidArc, and a novel IMRT & Arc technique for esophageal carcinoma. Radiother Oncol. (2011) 101:431–7. doi: 10.1016/j.radonc.2011.08.030
39. Palma DA, Senan S, Tsujino K, Barriger RB, Rengan R, Moreno M, et al. Predicting radiation pneumonitis after chemoradiation therapy for lung cancer: an international individual patient data meta-analysis. Int J Radiat Oncol Biol Phys. (2013) 85:444–50. doi: 10.1016/j.ijrobp.2012.04.043
40. Marks LB, Bentzen SM, Deasy JO, Kong FM, Bradley JD, Vogelius IS, et al. Radiation dose-volume effects in the lung. Int J Radiat Oncol Biol Phys. (2010) 76:S70–6. doi: 10.1016/j.ijrobp.2009.06.091
41. Tucker SL, Mohan R, Liengsawangwong R, Martel MK, Liao Z. Predicting pneumonitis risk: a dosimetric alternative to mean lung dose. Int J Radiat Oncol Biol Phys. (2013) 85:522–7. doi: 10.1016/j.ijrobp.2012.03.052
42. Tang X, Li Y, Tian X, Zhou X, Wang Y, Huang M, et al. Predicting severe acute radiation pneumonitis in patients with non-small cell lung cancer receiving postoperative radiotherapy: development and internal validation of a nomogram based on the clinical and dose-volume histogram parameters. Radiother Oncol. (2019) 132:197–203. doi: 10.1016/j.radonc.2018.10.016.
43. Tonison JJ, Fischer SG, Viehrig M, Welz S, Boeke S, Zwirner K, et al. Radiation pneumonitis after intensity-modulated radiotherapy for esophageal cancer: institutional data and a systematic review. Sci Rep. (2019) 9:2255. doi: 10.1038/s41598-018-38414-5
44. Kwa SL, Lebesque JV, Theuws JC, Marks LB, Munley MT, Bentel G, et al. Radiation pneumonitis as a function of mean lung dose: an analysis of pooled data of 540 patients. Int J Radiat Oncol Biol Phys. (1998) 42:1–9.
45. Darby SC, Ewertz M, McGale P, Bennet AM, Blom-Goldman U, Brønnum D, et al. Risk of ischemic heart disease in women after radiotherapy for breast cancer. N Engl J Med. (2013) 368:987–98. doi: 10.1056/NEJMoa1209825
46. Wei X, Liu HH, Tucker SL, Wang S, Mohan R, Cox JD, et al. Risk factors for pericardial effusion in inoperable esophageal cancer patients treated with definitive chemoradiation therapy. Int J Radiat Oncol Biol Phys. (2008) 70:707–14. doi: 10.1016/j.ijrobp.2007.10.056
47. Shirai K, Tamaki Y, Kitamoto Y, Murata K, Satoh Y, Higuchi K, et al. Dose-volume histogram parameters and clinical factors associated with pleural effusion after chemoradiotherapy in esophageal cancer patients. Int J Radiat Oncol Biol Phys. (2011) 80:1002–7. doi: 10.1016/j.ijrobp.2010.03.046
48. Huang EX, Hope AJ, Lindsay PE, Trovo M, El Naqa I, Deasy JO, et al. Heart irradiation as a risk factor for radiation pneumonitis. Acta Oncol. (2011) 50:51–60. doi: 10.3109/0284186X.2010.521192
Keywords: esophageal cancer, IMRT, VMAT, HT, dosimetry, radiobiology, TCP, NTCP
Citation: Wang L, Li C, Meng X, Li C, Sun X, Shang D, Pang L, Li Y, Lu J and Yu J (2019) Dosimetric and Radiobiological Comparison of External Beam Radiotherapy Using Simultaneous Integrated Boost Technique for Esophageal Cancer in Different Location. Front. Oncol. 9:674. doi: 10.3389/fonc.2019.00674
Received: 26 April 2019; Accepted: 10 July 2019;
Published: 25 July 2019.
Edited by:
Steven H. Lin, University of Texas MD Anderson Cancer Center, United StatesReviewed by:
Chunhui Han, City of Hope National Medical Center, United StatesRuijie Yang, Peking University Third Hospital, China
Bao-Tian Huang, Cancer Hospital of Shantou University Medical College, China
Copyright © 2019 Wang, Li, Meng, Li, Sun, Shang, Pang, Li, Lu and Yu. This is an open-access article distributed under the terms of the Creative Commons Attribution License (CC BY). The use, distribution or reproduction in other forums is permitted, provided the original author(s) and the copyright owner(s) are credited and that the original publication in this journal is cited, in accordance with accepted academic practice. No use, distribution or reproduction is permitted which does not comply with these terms.
*Correspondence: Jie Lu, bGx1amllOTlAMTI2LmNvbQ==; Jinming Yu, eXVqaW5taW5nc2R6bEAxNjMuY29t