 Dongyuan Wu1,2Xinyuan Li3Xiaohan Zhang3Fang Han3Xin Lu3Lei Liu4Junsheng Zhang5Mei Dong2Huanjie Yang3
 Hui Li1*
- 1Department of Biochemistry and Molecular Biology, Basic Medical Science College, Harbin Medical University, Harbin, China
- 2Department of Pharmacy, Harbin Medical University Cancer Hospital, Harbin, China
- 3School of Life Science and Technology, Harbin Institute of Technology, Harbin, China
- 4College of Bioinformatics Science and Technology, Harbin Medical University, Harbin, China
- 5College of Basic Medicine, Harbin Medical University, Harbin, China
Gemcitabine (GEM)-based chemotherapy is the standard regimen for the treatment of pancreatic cancer (PC). However, chemoresistance is a major challenge in PC treatment. Reliable biomarkers are urgently needed to predict the response to GEM-based therapies. GEM-sensitive (GEM-S) and GEM-resistant (GEM-R) pancreatic carcinoma xenograft models were established, and GEM monotherapy and GEM plus nanoparticle albumin-bound paclitaxel (nab-PTX) doublet therapy were administered to GEM-S/R tumor-bearing mice. Metabolomic mass spectrometry (MS) analysis of serum, liver, and tumor samples was performed using an ultraperformance liquid chromatography-quadrupole time-of-flight mass spectrometer. The results showed that both GEM monotherapy and combination therapy significantly inhibited the tumor growth in GEM-S subgroup. However, in the GEM-R subgroup, tumor growth was not significantly inhibited by GEM monotherapy, but was significantly suppressed by GEM combination therapy. Metabolic profiling analysis by hierarchical cluster analysis and partial least squares discriminant analysis showed that the differences in metabolites were most significant in serum of three types of samples in the GEM-S/R subgroups, regardless of the administration of GEM monotherapy or combination therapy. The differential metabolite analysis of serum samples revealed 38 and 26 differential metabolites between the GEM-R and GEM-S subgroups treated with GEM monotherapy or combination therapy, and four common discriminating metabolites were investigated: 3-hydroxyadipic acid, D-galactose, lysophosphatidylcholine (LysoPC) (P-16:0), and tetradecenoyl-L-carnitine. The relative amounts of the four metabolites changed significantly and consistently after GEM monotherapy or combination therapy. The levels of these four metabolites were significantly different in the GEM-S and GEM-R pancreatic carcinoma xenograft models; thus, these metabolites could be effective predictive indicators of the efficacy of chemotherapy in PC patients, regardless of the administration of GEM alone or GEM plus nab-PTX.
Introduction
Pancreatic cancer (PC) is one of the most aggressive human cancers, and affected patients have a 5 years survival rate of <9% (1, 2). Although tumor resection is the most curative option for PC patients, no more than 20% of patients can undergo surgery at the time of diagnosis because metastasis has already occurred (3). Therefore, chemotherapy plays a critical role in the therapeutic management of PC in patients with unresectable PC (4–6). Recent years have witnessed the rapid development of revolutionary targeted therapies and immune therapies, but these therapies have not shown significant results in PC (7–9). Thus, cytotoxic drugs remain the backbone of treatment for PC.
Gemcitabine (GEM) was approved as a the first-line drug for PC treatment in 1997, but the overall survival time of PC patients on GEM monotherapy is <6 months (10). Recently, GEM combinations were confirmed to increase median survival (11). GEM plus nanoparticle albumin-binding paclitaxel (nab-PTX) doublet therapy is a representative PC treatment that has been shown to increase overall survival at 1 and 2 years and to increase median survival by 1.8 months (12, 13). Thus, far, GEM monotherapy and combination therapy are the major therapeutic regimens for PC patients. However, chemotherapy resistance remains a key challenge in PC treatment (14, 15). In addition to cancer cells, the tumor microenvironment and pharmacokinetics contribute to clinical chemotherapy failure and apparent drug resistance (16–18).
Extracellular vesicles (EVs) have the potential to target specific tumor cells and affect tumor formation and progression; thus, EVs have been applied in the development of new therapeutic strategies to increase the efficacy of antitumor therapies (19). Further studies suggested that exosomes have the potential to stimulate an antitumor immune response (20, 21). Lucien et al. reported the application of EVs in tumor therapy (22). These tools can markedly improve the effectiveness of drug therapy. As a nanoparticle, nab-PTX is transported across the endothelial cell layer through EVs via biological albumin pathways and penetrates tumor tissue to increase the antitumor effect of PTX (23). However, potential predictive biomarkers of the effectiveness of chemotherapy in PC need to be explored to both better predict the chemotherapy response and avoid drug resistance.
Metabolomics is helpful for understanding systematic physiological responses induced by external stimuli. Thus, unbiased profiling can be used to identify metabolic features before and during treatment to identify outcomes related to treatment (24, 25) and to enhance the understanding and/or prediction of chemotherapeutic efficacy (26–29).
Considering the scientific rationale and the need to discover predictive biomarkers of the efficacy of GEM-based chemotherapy, we generated GEM-sensitive (GEM-S) and GEM-resistant (GEM-R) pancreatic carcinoma xenograft models in nude mice and analyzed the metabolic profiles in serum, liver, and tumor samples after treatment with GEM alone or GEM plus nab-PTX to identify potential metabolic biomarkers. Using pharmacometabolomics techniques, we explored potential predictive biomarkers of the efficacy of GEM-based therapy with the goal of achieving the optimal therapeutic results in PC patients.
Materials and Methods
Chemicals and Reagents
Fetal bovine serum was purchased from Invitrogen (Carlsbad, USA), and RPMI 1640 and DMEM media were supplied by Gibco (Thermo Fisher Scientific, China). GEM (Hubei Halfsky Pharmaceuticals Co., China) and albumin-binding PTX (Abraxane®, Abraxis BioScience, LLC, USA) were acquired from the pharmacy at Harbin Medical University Cancer Hospital. Deionized water was produced by a Milli-Q ultrapure water system (Millipore, Billerica, USA).
High-performance liquid chromatography-grade acetonitrile was purchased from Fisher Scientific (Waltham, MA, USA), and formic acid and high-performance liquid chromatography-grade methanol were purchased from Sigma-Aldrich and Fluka (St. Louis, MO, USA).
Cell Culture
The human BxPC-3 and PANC-1 PC cell lines were purchased from Shanghai Institutes for Biological Sciences (Shanghai, China). BxPC-3 cells were cultured in RPMI-1640 medium, and PANC-1 cells were grown in DMEM. Both media were supplemented with 10% fetal bovine serum. These human PC cells were incubated at 37°C in 5% CO2. BxPC-3 cells are relatively responsive to GEM, whereas PANC-1 cells are relatively resistant to GEM (30–32). The cells were used in experiments in the logarithmic growth phase and were conformed to be pathogen free.
Subcutaneous Tumor Growth Study
Male BALB/c nude mice (3–5 weeks old) were purchased from Vital River Laboratories (Beijing, China) to establish the subcutaneous xenograft model. The mice were housed in standard mouse plexiglass cages at 25 ± 1°C with 40–60% humidity and a 12/12-h light/dark cycle and were fed ad-libitum a regular autoclaved chow diet and water. Animal experiments were performed in accordance with the Ethics of Animal Experiments Committee of Harbin Institutes of Technology (Harbin, China).
BxPC-3 and PANC-1 cells were cultured and injected subcutaneously into BALB/c nude mice (right lower back) at a dose of 5 × 10⁶ cells per mouse in 0.1 ml of a 1:1 PBS/Matrigel mixture. When all mice had measurable tumors with an average volume of 100–150 mm3 (calculated as (length × width2)/2), BxPC-3 and PANC-1 tumor-bearing nude mice were randomly divided into three groups (n ≥ 6), and the treatment regimen was started immediately. The three groups of tumor-bearing mice were treated with GEM alone (G group), GEM plus nab-PTX (GP group), or normal saline (C group). The mice in the G group were treated with 30 mg/kg GEM twice a week (the days 1 and 4) for 2 weeks by intraperitoneal (i.p.) perfusion. The mice in the GP group were treated with GEM as stated for the G group and with 20 mg/kg nab-PTX once a week (day 4) for 2 weeks by intravenous (i.v.) injection through the tail vein. The mice in the C group were injected with 100 μl of normal saline solution through the same route and on the same days as in the G group. After initiating treatment, the tumors were measured every other day until the mice were killed. The relative tumor volume was calculated by dividing the tumor volume at each time point by the tumor volume at the start of treatment. Net tumor growth was calculated by subtracting the tumor volume on the first treatment day from that on the last day. BxPC-3 and PANC-1 tumor-bearing nude mice treated with GEM monotherapy or combination therapy were killed after 2 weeks of treatment. Whole blood, liver, and tumor samples were collected and processed for metabolite analysis.
Sample Collection and Preparation
Whole blood samples were collected from tumor-bearing mice in non-anticoagulant vacuum tubes. Then, the samples were centrifuged at 4,000 × g to separate the serum for metabolic profiling. A volume of 300 μl of precooled methanol/acetonitrile (1:1) was added to 100 μl of serum to precipitate the protein. The samples were then placed in a rotary vacuum to obtain a dry residue, which was stored at −80°C until analysis.
The tumor and liver samples were resected from tumor-bearing mice, washed immediately with cold saline, and dried on filter paper. Then, the tissues were stored in liquid nitrogen until further processing. Before the metabolite analysis, 20 mg of frozen tissue was sliced at a thickness of 20 μm and incubated in 75% precooled methanol solution at a concentration of 20 μl/mg. The tissue sections were subjected to ultrasonic disruption in 5-s pulses alternating with 5-s pauses, for a total of 2 min. The tissues were then centrifuged at 12,000 rpm for 15 min at 4°C. The supernatant was evaporated by rotary vacuum and stored at −80°C until further analysis. This study was approved by the Ethics of Animal Experiments Committee of Harbin Institutes of Technology.
UPLC-Q/TOF for Non-targeted Metabolomic MS Analysis
The samples were redissolved in 100 μl of 50% methanol, and 5 μl of the supernatant was injected into a BEH C18 column (2.1 mm × 100 mm, 1.7 μm; Waters, Milford, USA) on an ultraperformance liquid chromatography (UPLC) system (Waters, Milford, USA) with a flowrate of 0.35 ml/min and a column temperature of 40°C. The mobile phase conditions were as follows: linear gradient analysis with mobile phase A, acetonitrile containing 0.1% formic acid, and mobile phase B, 0.1% formic acid. The ratio of eluting solvent A was maintained at 1% for 0.5 min and then linearly increased from 1 to 53% from 0.5 to 3.5 min, to 70% from 3.5 to 7.5 min, and to 90% from 7.5 to 9 min. Then, 90% eluting solvent A was maintained for 4 min. Finally, the ratio of eluting solvent A was linearly decreased from 90 to 1% from 13 to 15 min.
Mass spectrum (MS) acquisition and MS/MS identification were both performed in positive and negative modes with a 6520 series accurate quadrupole time-of-flight mass spectrometer (Q-TOF MS) equipped with a dual electrospray ion source (Agilent, Santa Clara, CA, USA). For MS, the instrument was operated using an electrospray ionization source in both positive and negative ionization modes with survey scans acquired from m/z 70 to 1,100 at a scan rate of 1.5 spectra/s. The ionization parameters were as follows: capillary voltage, 4.5 kV in positive mode and 3.5 kV in negative mode; gas temperature, 330°C; gas flowrate; 10 L/min; fragment voltage, 100 V; and skimmer voltage, 65 V.
Metabolite Identification
Differential metabolite structural information, including the retention time (RT), m/z and MS/MS spectra, was confirmed using spectra from the Human Metabolome Database (http://www.hmdb.ca/), Metabolite and Tandem MS Database (http://metlin.scripps.edu/index.php), or Mass Bank Database (http://www.massbank.jp/).
Statistical Analysis
Both principal component analysis (PCA) and partial least squares discriminant analysis (PLS-DA) were performed to obtain the global metabolic profiles in serum, liver, and tumor samples from BxPC-3 or PANC-1 tumor-bearing nude mice, in the G, GP, and C groups. To avoid overfitting, we used cross-validation to certify the stability and credibility of the PLS-DA models. Furthermore, hierarchical cluster analysis (HCA) was performed to visualize the changes in these metabolites after GEM monotherapy or combination therapy in BxPC-3 or PANC-1 PC tumor-bearing nude mice.
The relative amounts of the metabolites with discriminatory significance were calculated by integrating their characteristic signals in the MS spectra. One-way ANOVA was employed to determine the significance of differences in each metabolite among treatment groups in both BxPC-3 and PANC-1 tumor-bearing nude mice. Multivariate statistical analysis was performed using SIMCA-p v.11.5 (Umetrics AB, Umea, Sweden) for PCA, PLS-DA, and cross-validation. HCA was conducted by the R package tnet for standardization and hierarchical clustering (33).
Results
Establishing GEM-S and GEM-R Subcutaneous PC Xenograft Models
In this study, GEM-S and GEM-R subcutaneous tumor xenograft models were generated by the subcutaneous injection human BxPC-3 or PANC-1 PC cells into BALB/c nude mice. After 2 weeks, both GEM-S and GEM-R tumor xenografts were established, and the tumor-bearing nude mice were treated with GEM alone or GEM plus nab-PTX for 2 weeks. The treatment scheme is shown in Figure 1A. The tumor-bearing mice remained in good condition during the treatment. All the mice treated with GEM alone or GEM plus nab-PTX survived until the end of the 17 days observation period. The mice weighed between 15 and 20 g throughout the treatment period, with no statistically significant differences in body weight among treatment groups. The changes in the subcutaneous tumor xenografts were investigated in mice with different drug-resistant phenotypes after GEM monotherapy or combination therapy. In GEM-S tumor-bearing nude mice, both GEM monotherapy and GEM plus nab-PTX doublet therapy significantly inhibited tumor growth, as determined by relative and net tumor growth (Figures 1B,D). The net tumor growths in the G and GP groups were 106.09 mm3 (P < 0.05) and −15.72 mm3 (P < 0.001), respectively. Furthermore, GEM combination therapy had stronger inhibitory activity than GEM monotherapy. However, in GEM-R tumor-bearing nude mice, tumor growth was not significantly affected by GEM monotherapy compared with saline but was significantly suppressed by GEM plus nab-PTX. The net tumor growths in the GP and G groups were 167.82 mm3 (P < 0.001) and 403.61 mm3 (P > 0.05), respectively (Figures 1C,E). These results indicated different efficiencies with GEM monotherapy in the GEM-S and GEM-R subgroups, but the similar efficiencies of GEM combination therapy in the two subgroups, suggesting the successful establishment of GEM-S and GEM-R tumor models.
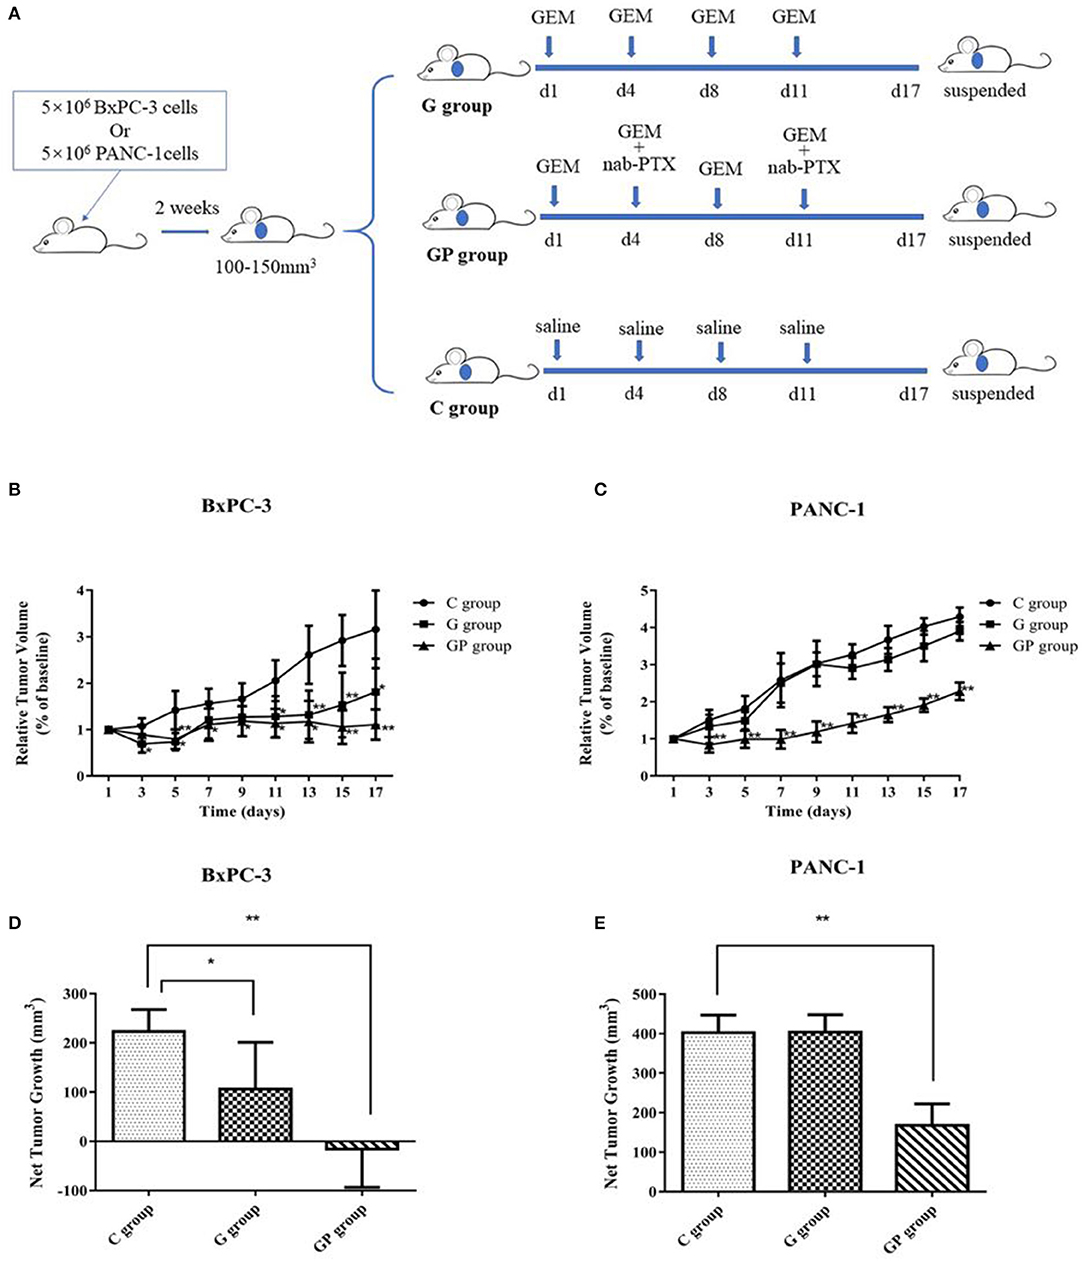
Figure 1. The impact of gemcitabine (GEM)-based chemotherapies on GEM-sensitive and GEM-resistant pancreatic subcutaneous tumor xenografts. (A) The scheme of the treatment performed in vivo. (B) Relative tumor volume changes of BxPC-3 tumor-bearing mice with GEM-based chemotherapy. (C) Relative tumor volume changes of PANC-1 tumor-bearing mice with GEM-based chemotherapy. (D) Net tumor growth changes of BxPC-3 tumor-bearing mice with GEM-based chemotherapy. (E) Net tumor growth changes of PANC-1 tumor-bearing mice with GEM-based chemotherapy. Data are representative of mean values ± standard deviation per group. **Significant difference (P < 0.01) compared with C group, *significant difference (P < 0.05) compared with C group. G, GEM; GP, GEM plus nab-PTX; C, untreated.
Metabolic Profiling of GEM-S and GEM-R Tumor-Bearing Nude Mice Treated With GEM-Based Chemotherapy
Metabolites were identified by comparing RT, m/z values, and MS fragmentation patterns with published data. In total, this study identified 88 and 79 metabolites in serum, 78 and 87 metabolites in liver, 83 and 94 metabolites in the tumors from GEM-S (BxPC-3) and GEM-R (PANC-1) tumor-bearing mice, respectively.
To provide comparative interpretations and to visualize metabolic similarities or differences among GEM monotherapy, GEM combination therapy, and control therapy in GEM-S and GEM-R tumor-bearing mice, the UPLC/Q-TOF MS spectra datasets of serum, liver, and tumor were separately analyzed by multivariate analysis. Both unsupervised PCA and supervised PLS-DA multivariate analyses were conducted to provide an overview of all samples in a data set. The PCA score plots for different tissues in GEM-S/R tumor-bearing mice treated with different regimens had no obvious outlier (Supplemental Figure 1). The PLS-DA score plot clearly showed the formation of independent clusters among the GEM monotherapy, GEM plus nab-PTX doublet therapy, and control groups of serum, liver, and tumor samples from GEM-S and GEM-R tumor-bearing mice (Figure 2). The model statistics, R2 and Q2, indicated that the models were robust without statistical overfitting (Supplemental Figure 2). These data suggested that the metabolic profiles in the serum, livers, and tumors of GEM-S and GEM-R pancreatic tumor-bearing mice were clearly different in each treatment group, indicating significant differences in the overall metabolism in the serum, livers, and tumors of tumor-bearing mice with different GEM-resistant phenotypes upon exposure to GEM monotherapy or combination therapy.
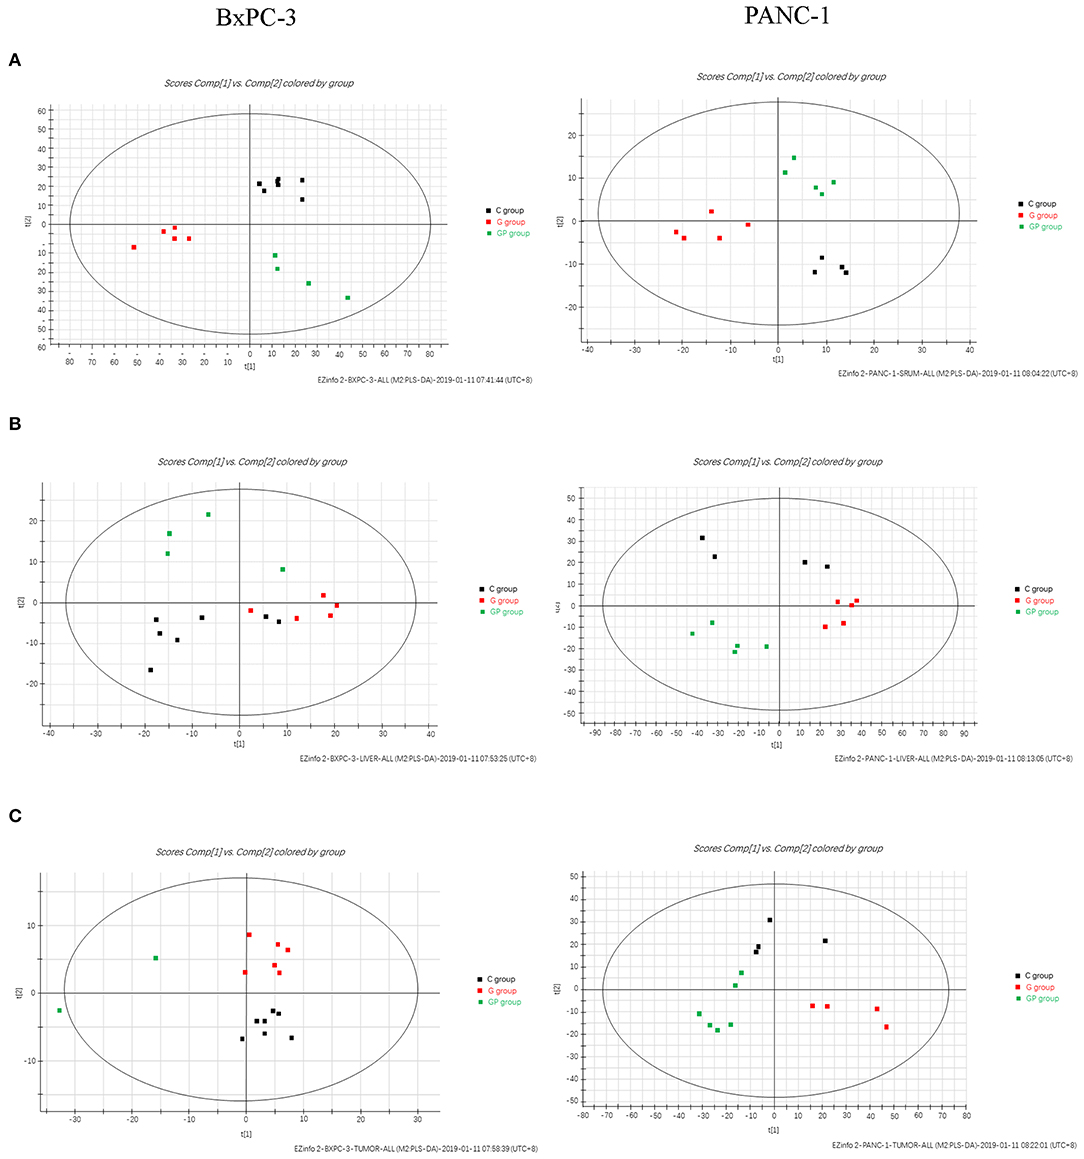
Figure 2. The two-dimensional score plots of PLS-DA of serum, liver, and tumor samples to discriminate among GEM plus nab-PTX, GEM alone, and untreated therapy in BxPC-3 and PANC-1 pancreatic tumor-bearing mice. (A) Serum samples; (B) liver samples; (C) tumor samples.
To further explore the significance of different metabolites in serum, liver, and tumor samples from different treatment groups of GEM-S and GEM-R tumor-bearing mice, one-way ANOVA was employed. HCA as performed to visualize the changes in differential metabolites in different tissues from GEM-S/R PC tumor-bearing nude mice treated with GEM monotherapy or combination therapy. As shown in the serum HCA heatmap, the observations in the GEM-S treatment subgroups were completely separated, but the separation in the GEM-R subgroups was not obvious. The HCA heatmap for all differential metabolites in serum samples from the GEM-S and GEM-R treatment subgroups is presented in Figure 3, and the differentially expressed metabolites are summarized in Table 1. The differential tumor and liver metabolites in the GEM-S and GEM-R subgroups treated with GEM-based chemotherapy were not significantly separated in the HCA-heatmap, as shown in Supplemental Figures 3, 4. The significant differential metabolites in liver and tumor samples from mice treated with GEM alone or GEM plus nab-PTX are listed in Supplemental Tables 1–4. The results described above suggested that among the three types of samples, the serum metabolites showed the most significant differences between GEM-S and GEM-R subgroups treated with GEM monotherapy or combination therapy. Therefore, metabolic changes in serum could successfully reflect the efficacy of GEM-based treatment.
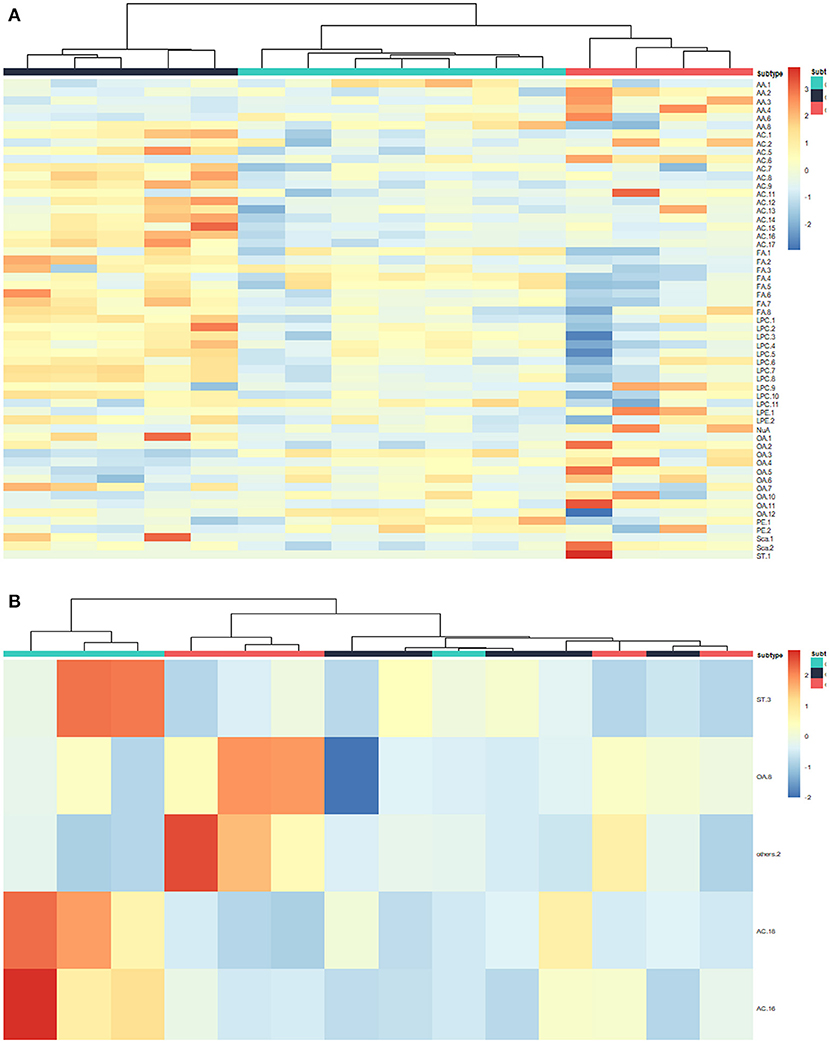
Figure 3. Hierarchical cluster analysis (HCA) heatmap of the differential metabolites in serum samples treated by GEM plus nab-PTX or GEM in GEM-S subgroup (A) and GEM-R subgroup (B).
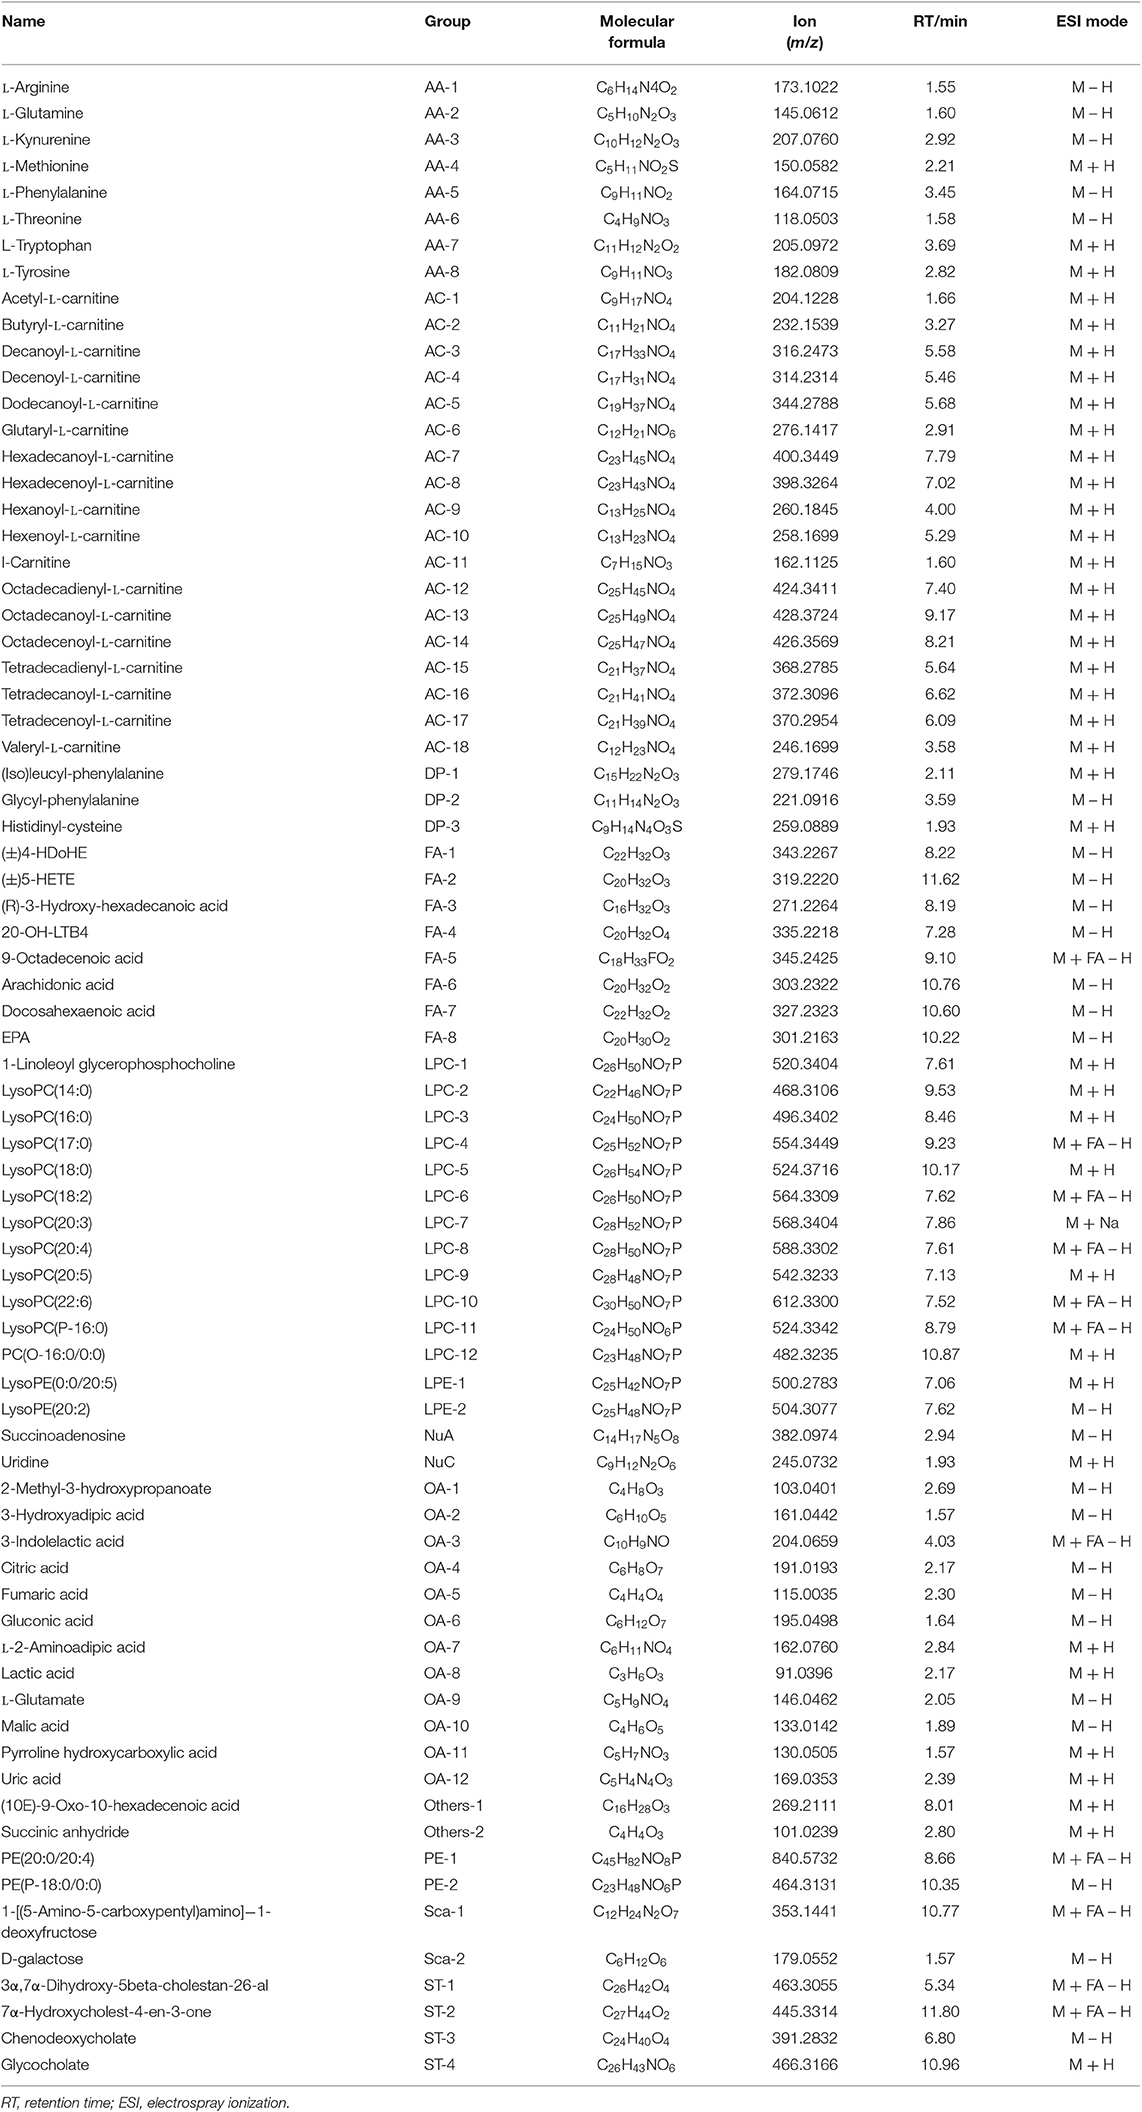
Table 1. Summary of the differential metabolites in GEM-S/R pancreatic tumor-bearing mice treated with GEM-based chemotherapy.
Analysis of Serum Metabolites Correlated With GEM-Based Chemotherapy Efficacy
To investigate the relationship between the efficacy of GEM-based chemotherapy and changes in serum metabolites, we analyzed the differential metabolites in serum samples in the GEM-S and GEM-R subgroups when GEM administered alone or in combination. In the GEM monotherapy group, 39 differential metabolites were identified in the GEM-S subgroup, but only one differential metabolite (tetradecanoyl-L-carnitine) was found in the GEM-R subgroup, this metabolite was also identified in the GEM-S subgroup. Thus, there were 38 differential metabolites in the GEM-R and GEM-S subgroups in response to GEM alone, as shown in Table 2.
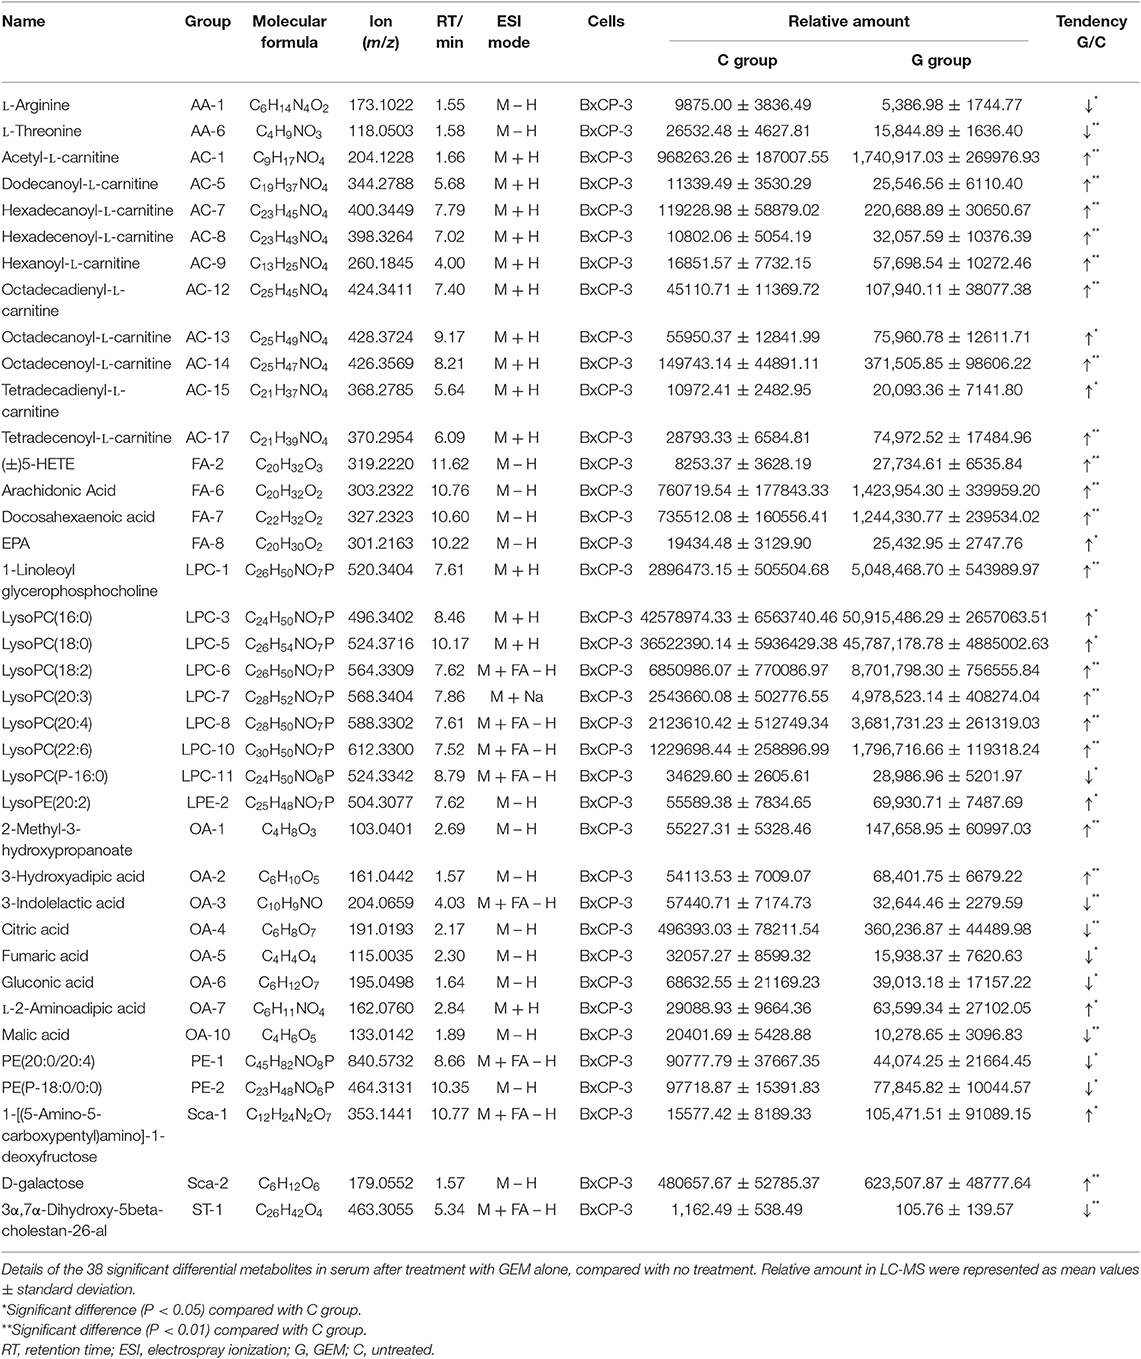
Table 2. Details of 38 significant differential metabolites in serum treated with GEM alone.
The impact of GEM plus nab-PTX doublet therapy on the differential metabolites in the GEM-S/R subgroups was also explored. A total of 21 differential metabolites were identified in the GEM-S subgroup, but only five were found in the GEM-R subgroup. None of the differential metabolites were shared between the two subgroups, so there were 26 different substances associated with GEM combination therapy, as shown in Table 3.

Table 3. Details of 26 significant differential metabolites in serum treated with GEM plus nab-PTX.
To better predict the efficacy of GEM-based treatment regimens, the common differential metabolites in serum including the differential metabolites from GEM-R and GEM-S tumor-bearing mice treated with GEM monotherapy or combination therapy were compiled. There were four common discriminating metabolites in the GEM-S and GEM-R subgroups treated with GEM monotherapy or combination therapy: 3-hydroxyadipic acid (OA-2), D-galactose (Sca-2), lysophosphatidylcholine [LysoPC (P-16:0), LPC-11], and tetradecenoyl-L-carnitine (AC-17) (Figure 4). The relative amounts of change in the common discriminating metabolites are shown in Figure 5; these four metabolites changed consistently and significantly in the GEM-S subgroup compared with the C group, regardless of treatment with GEM monotherapy or combination therapy. Compared to the C group, both the G and GP groups showed a significant increase in OA-2, Sca-2, and AC-17, and an obvious decrease in LPC-11. However, except for the identification of AC-17, OA-2, Sca-2, and LPC-11 in serum from the GEM-R subgroup, no differential metabolites were identified in the other treatment groups. In summary, these four metabolites showed significant differences in serum from the GEM-S and GEM-R PC models; thus, they might effectively predict the efficacy of chemotherapy in the context of both GEM alone and GEM plus nab-PTX.
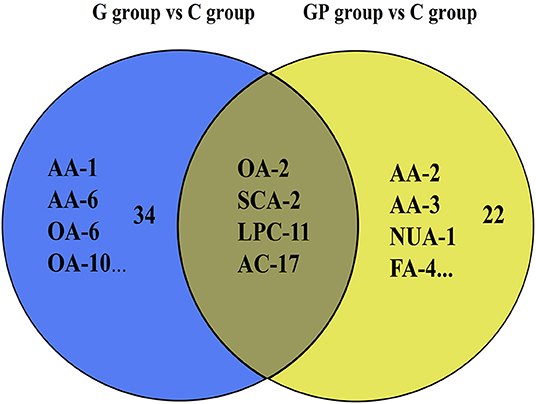
Figure 4. Venn diagram of the common discriminating metabolites identified between GEM-S and GEM-R groups both with GEM monotherapy and GEM combination. The blue ovals illustrate the differential metabolites with GEM alone compared with saline between GEM-S and GEM-R subgroup. The yellow ovals illustrate the differential metabolites with GEM plus nab-PTX compared with saline between GEM-S and GEM-R subgroup.
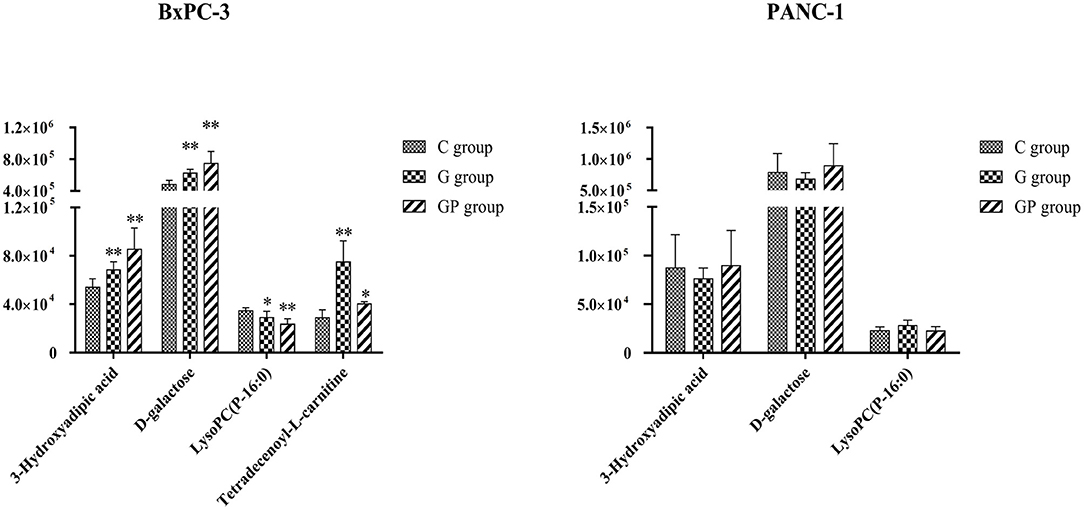
Figure 5. The relative amount changes of the common discriminating metabolites identified between GEM-S and GEM-R groups both with GEM monotherapy and GEM combination. **Significant difference (P < 0.01) compared with C group; *significant difference (P < 0.05) compared with C group. G, GEM; GP, GEM plus nab-PTX; C, untreated.
Discussion
Although previous studies have shown that ~70–90% of PC patients have KRAS mutation (34, 35), there are currently no effective therapeutics targeting KRAS. Haas et al. reported no significant difference in overall survival for KRAS wild-type vs. mutant patients, and KRAS mutation status is predictive rather than prognostic in advanced PC (34). Efforts focused on targeting PC have been disappointing (7, 36), so the standard of care for PC continues to be chemotherapy. However, chemoresistance is a major challenge in the treatment of PC (14, 15, 17, 18). The efficacy of GEM monotherapy for PC is limited by emerging drug resistance, which can be intrinsic or acquired after multiple treatment cycles. To overcome drug resistance, two regimens, including GEM plus nab-PTX, are usually applied, as first-line therapy for PC patients (37). However, not all patients benefit from this intense therapy, and clinicians lack predictive markers to help choose which patients will benefit or to predict when chemoresistance will occur.
In this study, we conducted a preliminary exploration of predictive indicators of the efficacy of GEM-based chemotherapy. We established GEM-S and GEM-R PC xenograft models and then analyzed the changes in metabolic profiles after treatment with GEM monotherapy and combination therapy to explore potential biomarkers for predicting the effect of GEM-based therapy. Considering that nab-PTX monotherapy is not used to treat PC in the clinic, the impact of nab-PTX alone on metabolism was not investigated. The tumor growth experiments showed that GEM monotherapy significantly inhibited tumor growth in the GEM-S subgroup but not in the GEM-R subgroup. However, GEM plus nab-PTX doublet therapy significantly inhibited tumor growth in both subgroups. These results were similar to clinical trial results (37, 38).
To better understand the effect of GEM-based chemotherapy on metabolism, we performed a metabolomics analysis of serum, liver, and tumor samples from GEM-S/R tumor-bearing mice treated with chemotherapeutics. The PLS-DA results showed that monotherapy and combination therapy had significant impacts on serum, liver and tumor metabolism (Figure 2). However, cluster analysis of these differential substances from different tissues showed that only serum differential metabolites in the GEM-S subgroup could significantly distinguish the drug regimens; these metabolites could not be separate in the other groups. We also obtained similar results when identifying differential metabolites in different groups (Supplemental Figures 3, 4). In the GEM monotherapy group, 39 differential metabolites in serum and five in the liver were identified in GEM-S tumor-bearing mice, but no differential metabolites were discovered in the tumor. On the other hand, one, seven, and one differential metabolites were identified in serum, liver, and tumor samples from GEM-R tumor-bearing mice, respectively. Furthermore, in the GEM plus nab-PTX group, 21, 3, and 2 differential metabolites were identified in serum, liver, and tumor samples from GEM-S subgroup, and 5, 2, and 2 differential metabolites were identified in serum, liver, and tumor samples from GEM-R subgroup. Based on the above results, we concluded that regardless of treatment with GEM monotherapy or combination therapy, the metabolic profiles in serum were more significantly different than those in the liver and tumor and thus could better reflect the effect of drugs on metabolism. It is well-known that changes in circulating metabolites associated with tumors might reflect alterations in metabolism within the tumor as well as general alterations in the host (39). In this study, we found that compared to control group, GEM-based chemotherapy had less effect on tumor and liver metabolites than on serum metabolites. Moreover, in the GEM-S group, both monotherapy and combination therapy led to significant metabolic changes, with 38 and 26 differential metabolites, respectively. Therefore, there is extensive clinical guiding significance through monitoring changes in serum metabolites after chemotherapy and exploring the differential metabolites in serum as biomarkers to predict the efficacy of chemotherapy.
In the clinic, the choice of monotherapy or combination therapy regimens for patients with advanced PC was based on the general state of the patients (5, 6). The clinical effectiveness of a treatment regimen in cancer patients is estimated by the Response Evaluation Criteria in Solid Tumors, at ~2 months after chemotherapy (40). If therapeutic effect could be predicted by monitoring serum metabolite changes after treatment, the treatment regimen could be adjusted as soon as possible thereby avoiding disease progression due to drug resistance and ensuring that PC patients receive timely and effective treatment. We identified four common differential metabolites in the serum of tumor-bearing mice treated with GEM alone or GEM plus nab-PTX. Compared with GEM-R mice, GEM-S mice showed a significant increase in OA-2, Sca-2, and AC-17 and a significant decrease in LPC-11 on GEM-based chemotherapy compared with the control (no treatment) (Figure 5). These metabolites have potential as molecular markers for discriminating bearing mice between GEM-S and GEM-R pancreatic tumors. However, we also found that the relative amount of OA-2 was higher in the GEM-R group than that in the GEM-S group in the absence of treatment. Therefore, we believe that the changes in these four differential metabolites in serum before and after treatment are more instructive for the clinical prediction of GEM-based treatment effects, and monitoring differential serum metabolites is expected to be useful in the clinic since serum is easy to obtain.
It is well-known that cancer cells can reprogram their metabolism to satisfy energy requirements and to preserve their integrity in harsh and hypoxic environments. Sac-2 is an energy source and also a necessary basic substrate for the biosynthesis of many macromolecules in the body. Sac-2 is involved in the biosynthesis of nucleotide sugars, which are the primary substrates for deoxyribonucleotide and ribonucleotide synthesis. GEM is a specific analog of the native pyrimidine nucleotide deoxycytidine and inhibits DNA synthesis through incorporation into DNA and inhibition of the enzyme ribonucleotide reductase (41). Furthermore, deoxyribonucleotide and ribonucleotide pools, which are both essential for DNA repair, are depleted by phosphorylated gemcitabine (41). In our study, Sac-2 levels increased significantly in GEM-S group after GEM-based chemotherapy, compared with no treatment, which may be related to the GEM-mediated inhibition of DNA synthesis. In addition, Sac-2 participates in the degradation of galactose, which can be transformed into α-D-glucose-6P, a component of glycolysis. The increase in Sac-2 may also be related to the inhibition of glycolysis by GEM-based chemotherapy.
With the exception of the Warburg effect, one of the most important metabolic aberrations in cancer cells is the elevated synthesis of lipids, which are building blocks for cell membrane formation during cell proliferation and signal transduction (42–46). LPCs were recognized as carriers of fatty acids, phosphatidylglycerol and choline between tissues (47) and were closely related to the occurrence and development of PC (47–50). Our results showed that the relative amount of LPC-11 in the GEM-S subgroup decreased markedly upon treatment with either GEM monotherapy or combination therapy compared with no treatment; LPC-11 could be a metabolic predictor of the efficacy of GEM-based chemotherapy. The carnitine system is another pivotal mediator in cancer metabolic plasticity, which is involved in the bi-directional transport of acyl moieties from the cytosol to the mitochondria and vice versa and thus plays a fundamental role in tuning the switch between the glucose and fatty acid metabolism (51). AC-17 is a long-chain acylcarnitine, which is transformed to long-chain acetyl-CoA, which participates in the β-oxidation of fatty acids, a process that provides energy for cancer cells. In this study, the relative amount of AC-17 increased significantly in GEM-S mice, especially in those treated with GEM alone, suggesting that GEM-based treatment may inhibit fatty acid β-oxidation to decrease the energy available to cancer cells. OA-2 is a dicarboxylic acid derived from the omega-oxidation of 3-hydroxy fatty acids. The relative amount of OA-2 increased significantly in GEM-S mice treated with GEM monotherapy and combination monotherapy. Although these metabolites have not been previously reported in the context of GEM-based PC treatment, they are theoretically worthy of further attention. Changes in these four metabolites may predict the efficacy of GEM-based treatment and be related to lipid metabolism; these hypotheses require further verification.
This study preliminarily explored predictive metabolic indicators of the efficacy of GEM-based chemotherapy in subcutaneous PC xenografts. Further studies are needed to verify whether the alterations in the metabolites identified in this study are similar in PC patients on GEM-based chemotherapy and to explore the mechanism by which GEM-based regimens for PC affect metabolism. In combination with clinical practice, experimental research will be performed to investigate the effects of differential changes in metabolites at different times after treatment to find the best assessment time and to better predict the effectiveness of GEM-based chemotherapy.
Conclusion
The relative amount of 3-hydroxyadipic acid, D-galactose, LysoPC (P-16:0), and tetradecenoyl-L-carnitine were significant different changed between GEM-S and GEM-R pancreatic carcinoma xenograft model groups, regardless of treatment with GEM alone or GEM plus nab-PTX. Monitoring the changes of metabolites may be a viable option for improving acquired resistance and preventing the acquisition of chemoresistance in PC.
Data Availability Statement
The datasets generated for this study are available on request to the corresponding author.
Ethics Statement
This research was approved by the Ethics of Animal Experiments Committee of Harbin Institutes of Technology.
Author Contributions
HL conceived and designed the experiments. DW, XLi, XZ, FH, XLu, LL, JZ, MD, and HY performed the experiments and analyzed the data. FH and DW wrote the paper. All authors read and approved the final manuscript.
Funding
This work was supported by the National Natural Science Foundation of China (81472929 and 81172616).
Conflict of Interest
The authors declare that the research was conducted in the absence of any commercial or financial relationships that could be construed as a potential conflict of interest.
Supplementary Material
The Supplementary Material for this article can be found online at: https://www.frontiersin.org/articles/10.3389/fonc.2019.01524/full#supplementary-material
References
1. Siegel RL, Miller KD, Jemal A. Cancer statistics, 2019. CA Cancer J Clin. (2019) 69:7–34. doi: 10.3322/caac.21551
2. Chen W, Zheng R, Baade PD, Zhang S, Zeng H, Bray F, et al. Cancer statistics in China, 2015. CA Cancer J Clin. (2016) 66:115–32. doi: 10.3322/caac.21338
3. Li D, Xie K, Wolff R, Abbruzzese JL. Pancreatic cancer. Lancet. (2004) 363:1049–57. doi: 10.1016/S0140-6736(04)15841-8
4. Olson JL, Bold RJ. Currently available first-line drug therapies for treating pancreatic cancer. Expert Opin Pharmacother. (2018) 19:1927–40. doi: 10.1080/14656566.2018.1509954
5. McGuigan A, Kelly P, Turkington RC, Jones C, Coleman HG, McCain RS. Pancreatic cancer: a review of clinical diagnosis, epidemiology, treatment and outcomes. World J Gastroenterol. (2018) 24:4846–61. doi: 10.3748/wjg.v24.i43.4846
6. Sohal DP, Mangu PB, Khorana AA, Shah MA, Philip PA, O'Reilly EM, et al. Metastatic pancreatic cancer: American society of clinical oncology clinical practice guideline. J Clin Oncol. (2016) 34:2784–96. doi: 10.1200/JCO.2016.67.1412
7. Aslan M, Shahbazi R, Ulubayram K, Ozpolat B. Targeted Therapies for Pancreatic cancer and hurdles ahead. Anticancer Res. (2018) 38:6591–606. doi: 10.21873/anticanres.13026
8. Balachandran VP, Beatty GL, Dougan SK. Broadening the impact of immunotherapy to pancreatic cancer: challenges and opportunities. Gastroenterology. (2019) 156:2056–72. doi: 10.1053/j.gastro.2018.12.038
9. Macherla S, Laks S. Emerging role of immune checkpoint blockade in pancreatic cancer. Int J Mol Sci. (2018) 19:3505. doi: 10.3390/ijms19113505
10. Burris HA 3rd, Moore MJ, Andersen J, Green MR, Rothenberg ML, Modiano MR, et al. Improvements in survival and clinical benefit with gemcitabine as first-line therapy for patients with advanced pancreas cancer: a randomized trial. J Clin Oncol. (1997) 15:2403–13. doi: 10.1200/JCO.1997.15.6.2403
11. Ciliberto D, Botta C, Correale P, Rossi M, Caraglia M, Tassone P, et al. Role of gemcitabine-based combination therapy in the management of advanced pancreatic cancer: a meta-analysis of randomised trials. Eur J Cancer. (2013) 49:593–603. doi: 10.1016/j.ejca.2012.08.019
12. Chiorean EG, Von Hoff DD, Reni M, Arena FP, Infante JR, Bathini VG, et al. CA19-9 decrease at 8 weeks as a predictor of overall survival in a randomized phase III trial (MPACT) of weekly nab-paclitaxel plus gemcitabine versus gemcitabine alone in patients with metastatic pancreatic cancer. Ann Oncol. (2016) 27:654–60. doi: 10.1093/annonc/mdw006
13. Von Hoff DD, Ramanathan RK, Borad MJ, Laheru DA, Smith LS, Wood TE, et al. Gemcitabine plus nab-paclitaxel is an active regimen in patients with advanced pancreatic cancer: a phase I/II trial. J Clin Oncol. (2011) 29:4548–54. doi: 10.1200/JCO.2011.36.5742
14. Zemanek T, Melichar B, Lovecek M, Soucek P, Mohelnikova-Duchonova B. Biomarkers and pathways of chemoresistance and chemosensitivity for personalized treatment of pancreatic adenocarcinoma. Pharmacogenomics. (2019) 20:113–27. doi: 10.2217/pgs-2018-0073
15. Adamska A, Elaskalani O, Emmanouilidi A, Kim M, Abdol Razak NB, Metharom P, et al. Molecular and cellular mechanisms of chemoresistance in pancreatic cancer. Adv Biol Regul. (2018) 68:77–87. doi: 10.1016/j.jbior.2017.11.007
16. Capurso G, Sette C. Drug resistance in pancreatic cancer: new player caught in act. Medicina. (2019) 40:39–40. doi: 10.1016/j.ebiom.2019.02.008
17. Qiu J, Yang G, Feng M, Zheng S, Cao Z, You L, et al. Extracellular vesicles as mediators of the progression and chemoresistance of pancreatic cancer and their potential clinical applications. Mol Cancer. (2018) 17:2. doi: 10.1186/s12943-017-0755-z
18. Amrutkar M, Gladhaug IP. Pancreatic cancer chemoresistance to gemcitabine. Cancers. (2017) 9:e157. doi: 10.3390/cancers9110157
19. Chulpanova DS, Kitaeva KV, James V, Rizvanov AA, Solovyeva VV. Therapeutic prospects of extracellular vesicles in cancer treatment. Front Immunol. (2018) 9:1534. doi: 10.3389/fimmu.2018.01534
20. Batista IA, Melo SA. Exosomes and the future of immunotherapy in pancreatic cancer. Int J Mol Sci. (2019) 20:567. doi: 10.3390/ijms20030567
21. Garofalo M, Villa A. Systemic administration and targeted delivery of immunogenic oncolytic adenovirus encapsulated in extracellular vesicles for cancer therapies. Viruses. (2018) 10:e558. doi: 10.3390/v10100558
22. Lucien F, Lac V, Billadeau DD, Borgida A, Gallinger S, Leong HS. Glypican-1 and glycoprotein 2 bearing extracellular vesicles do not discern pancreatic cancer from benign pancreatic diseases. Oncotarget. (2019) 10:1045–55. doi: 10.18632/oncotarget.26620
23. Chen N, Brachmann C, Liu X, Pierce DW, Dey J, Kerwin WS, et al. Albumin-bound nanoparticle (nab) paclitaxel exhibits enhanced paclitaxel tissue distribution and tumor penetration. Cancer Chemother Pharmacol. (2015) 76:699–712. doi: 10.1007/s00280-015-2833-5
24. Everett JR. From metabonomics to pharmacometabonomics: the role of metabolic profiling in personalized medicine. Front Pharmacol. (2016) 7:297. doi: 10.3389/fphar.2016.00297
25. Everett JR. Pharmacometabonomics in humans: a new tool for personalized medicine. Pharmacogenomics. (2015) 16:737–54. doi: 10.2217/pgs.15.20
26. Phua LC, Goh S, Tai DWM, Leow WQ, Alkaff SMF, Chan CY, et al. Metabolomic prediction of treatment outcome in pancreatic ductal adenocarcinoma patients receiving gemcitabine. Cancer Chemother Pharmacol. (2018) 81:277–89. doi: 10.1007/s00280-017-3475-6
27. Jiang L, Lee SC, Ng TC. Pharmacometabonomics analysis reveals serum formate and acetate potentially associated with varying response to gemcitabine-carboplatin chemotherapy in metastatic breast cancer patients. J Proteome Res. (2018) 17:1248–57. doi: 10.1021/acs.jproteome.7b00859
28. Shen J, Ye Y, Chang DW, Huang M, Heymach JV, Roth JA, et al. Circulating metabolite profiles to predict overall survival in advanced non-small cell lung cancer patients receiving first-line chemotherapy. Lung Cancer. (2017) 114:70–8. doi: 10.1016/j.lungcan.2017.10.018
29. Miolo G, Muraro E, Caruso D, Crivellari D, Ash A, Scalone S, et al. Pharmacometabolomics study identifies circulating spermidine and tryptophan as potential biomarkers associated with the complete pathological response to trastuzumab-paclitaxel neoadjuvant therapy in HER-2 positive breast cancer. J Proteome Res. (2016) 7:39809–22. doi: 10.18632/oncotarget.9489
30. Banerjee J, Al-Wadei HA, Al-Wadei MH, Dagnon K, Schuller HM. Differential modulation of nicotine-induced gemcitabine resistance by GABA receptor agonists in pancreatic cancer cell xenografts and in vitro. BMC Cancer. (2014) 14:725. doi: 10.1186/1471-2407-14-725
31. Fryer RA, Barlett B, Galustian C, Dalgleish AG. Mechanisms underlying gemcitabine resistance in pancreatic cancer and sensitisation by the iMiD lenalidomide. Anticancer Res. (2011) 31:3747–56.
32. Pan X, Arumugam T, Yamamoto T, Levin PA, Ramachandran V, Ji B, et al. Nuclear factor-kappaB p65/relA silencing induces apoptosis and increases gemcitabine effectiveness in a subset of pancreatic cancer cells. Clin Cancer Res. (2008) 14:8143–51. doi: 10.1158/1078-0432.CCR-08-1539
33. Ward JH. Hierarchical grouping to optimize an objective function. Publ Am Stat Assoc. (1963) 58:236–44. doi: 10.1080/01621459.1963.10500845
34. Haas M, Ormanns S, Baechmann S, Remold A, Kruger S, Westphalen CB, et al. Extended RAS analysis and correlation with overall survival in advanced pancreatic cancer. Br J Cancer. (2017) 116:1462–9. doi: 10.1038/bjc.2017.115
35. Tjensvoll K, Lapin M, Buhl T, Oltedal S, Steen-Ottosen Berry K, Gilje B, et al. Clinical relevance of circulating KRAS mutated DNA in plasma from patients with advanced pancreatic cancer. Mol Oncol. (2016) 10:635–43. doi: 10.1016/j.molonc.2015.11.012
36. Amanam I, Chung V. Targeted therapies for pancreatic cancer. Cancers. (2018) 10:36. doi: 10.3390/cancers10020036
37. Kim G. nab-Paclitaxel for the treatment of pancreatic cancer. Cancer Manag Res. (2017) 9:85–96. doi: 10.2147/CMAR.S127840
38. Neesse A, Michl P, Tuveson DA, Ellenrieder V. nab-Paclitaxel: novel clinical and experimental evidence in pancreatic cancer. Zeitschrift fur Gastroenterologie. (2014) 52:360–6. doi: 10.1055/s-0034-1366002
39. Rattner J, Bathe OF. Monitoring for response to antineoplastic drugs: the potential of a metabolomic approach. Metabolites. (2017) 7:e60. doi: 10.3390/metabo7040060
40. Schwartz LH, Seymour L, Litiere S, Ford R, Gwyther S, Mandrekar S, et al. RECIST 1.1—Standardisation and disease-specific adaptations: perspectives from the RECIST Working Group. Eur J Cancer. (2016) 62:138–45. doi: 10.1016/j.ejca.2016.03.082
41. Ciccolini J, Serdjebi C, Peters GJ, Giovannetti E. Pharmacokinetics and pharmacogenetics of Gemcitabine as a mainstay in adult and pediatric oncology: an EORTC-PAMM perspective. Cancer Chemother Pharmacol. (2016) 78:1–12. doi: 10.1007/s00280-016-3003-0
42. Sunami Y, Rebelo A, Kleeff J. Lipid metabolism and lipid droplets in pancreatic cancer and stellate cells. Cancers. (2017) 10:e3. doi: 10.3390/cancers10010003
43. Swierczynski J, Hebanowska A, Sledzinski T. Role of abnormal lipid metabolism in development, progression, diagnosis and therapy of pancreatic cancer. World J Gastroenterol. (2014) 20:2279–303. doi: 10.3748/wjg.v20.i9.2279
44. Macasek J, Vecka M, Zak A, Urbanek M, Krechler T, Petruzelka L, et al. Plasma fatty acid composition in patients with pancreatic cancer: correlations to clinical parameters. Nutr Cancer. (2012) 64:946–55. doi: 10.1080/01635581.2012.716138
45. Fuchs B, Muller K, Paasch U, Schiller J. Lysophospholipids: potential markers of diseases and infertility? Mini Rev Med Chem. (2012) 12:74–86. doi: 10.2174/138955712798868931
46. Nishi K, Suzuki K, Sawamoto J, Tokizawa Y, Iwase Y, Yumita N, et al. Inhibition of fatty acid synthesis induces apoptosis of human pancreatic cancer cells. Anticancer Res. (2016) 36:4655–60. doi: 10.21873/anticanres.11016
47. Drzazga A, Sowinska A, Koziolkiewicz M. Lysophosphatidylcholine and lysophosphatidylinosiol–novel promissing signaling molecules and their possible therapeutic activity. Acta Poloniae Pharmaceut. (2014) 71:887–99.
48. Okita M, Gaudette DC, Mills GB, Holub BJ. Elevated levels and altered fatty acid composition of plasma lysophosphatidylcholine(lysoPC) in ovarian cancer patients. Int J Cancer. (1997) 71:31–4. doi: 10.1002/(SICI)1097-0215(19970328)71:1<31::AID-IJC7>3.0.CO;2-4
49. Tao L, Zhou J, Yuan C, Zhang L, Li D, Si D, et al. Metabolomics identifies serum and exosomes metabolite markers of pancreatic cancer. EPMA J. (2019) 15:86. doi: 10.1007/s11306-019-1550-1
50. Akita H, Ritchie SA, Takemasa I, Eguchi H, Pastural E, Jin W, et al. Serum metabolite profiling for the detection of pancreatic cancer: results of a large independent validation study. Pancreas. (2016) 45:1418–23. doi: 10.1097/MPA.0000000000000680
Keywords: pancreatic carcinoma, metabonomics, chemotherapy, gemcitabine, predictive indicator
Citation: Wu D, Li X, Zhang X, Han F, Lu X, Liu L, Zhang J, Dong M, Yang H and Li H (2020) Pharmacometabolomics Identifies 3-Hydroxyadipic Acid, D-Galactose, Lysophosphatidylcholine (P-16:0), and Tetradecenoyl-L-Carnitine as Potential Predictive Indicators of Gemcitabine Efficacy in Pancreatic Cancer Patients. Front. Oncol. 9:1524. doi: 10.3389/fonc.2019.01524
Received: 14 August 2019; Accepted: 18 December 2019;
Published: 29 January 2020.
Edited by:
Cyril Corbet, Catholic University of Louvain, BelgiumReviewed by:
Mariangela Garofalo, University of Padova, ItalyTaiping Zhang, Peking Union Medical College Hospital (CAMS), China
Byron Baron, University of Malta, Malta
Copyright © 2020 Wu, Li, Zhang, Han, Lu, Liu, Zhang, Dong, Yang and Li. This is an open-access article distributed under the terms of the Creative Commons Attribution License (CC BY). The use, distribution or reproduction in other forums is permitted, provided the original author(s) and the copyright owner(s) are credited and that the original publication in this journal is cited, in accordance with accepted academic practice. No use, distribution or reproduction is permitted which does not comply with these terms.
*Correspondence: Hui Li, bGlodWlAZW1zLmhyYm11LmVkdS5jbg==