 Ion Antohe1,2
 Angela Dǎscǎlescu1,2Cǎtǎlin Dǎnǎilǎ1,2Amalia Titieanu1,2Mihaela Zlei3Iuliu Ivanov4Adriana Sireteanu4
 Mariana Pavel5
 Petru Cianga5*
- 1Hematology Department, Grigore T. Popa University of Medicine and Pharmacy, Iaşi, Romania
- 2Hematology Department, Regional Oncology Institute, Iaşi, Romania
- 3Immunophenotyping Department, Regional Oncology Institute, Iaşi, Romania
- 4Molecular Diagnostic Department, Regional Oncology Institute, Iaşi, Romania
- 5Immunology Department, Grigore T. Popa University of Medicine and Pharmacy, Iaşi, Romania
Acute myeloid leukemia (AML) is generally considered a poorly immunogenic malignancy, displaying a “non-inflamed” leukemia microenvironment (LME), leading to T cell tolerance. However, the immune landscape of AML is much more heterogeneous. Since B7 expression is regarded as a consequence of an interferon-mediated “inflammatory” phenotype, we have investigated by flow cytometry the B7 checkpoint ligands B7.1, B7.2, programmed death ligand 1 (PD-L1), PD-L2, ICOS-L, B7-H3, and B7-H4 on the AML blasts of 30 newly diagnosed patients and their corresponding receptors [cytotoxic T lymphocyte-associated protein 4 (CTLA-4), programmed death 1 (PD-1), and inducible T cell costimulator (ICOS)] on bone marrow (BM) T cell maturation populations. We could thus evidence B7-negative and B7-positive leukemias either with an isolated expression or part of eight different checkpoint ligand “signatures” that always included an inhibitory B7 molecule. B7-positive AMLs encompassed intermediate and adverse European Leukemia Net (ELN) risk cases and displayed mainly central memory CD4+ T cells with high ICOS levels and effector CD8+ T cells with high PD-1 expression. B7-negative cases were rather classified as AML with recurrent genetic anomalies and displayed predominantly naive T cells, with the exception of NPM1 mutated AMLs, which expressed B7-H3. These different B7 immune profiles suggest that specific immunotherapies are required to target the distinct immune evasion strategies of this genetically heterogeneous disease.
Introduction
The last decade has witnessed dramatic advances in the field of cancer immunotherapy. Immune checkpoint blockade (ICB) is reshaping the treatment paradigm of solid tumors (1) and hematologic cancers, such as Hodgkin lymphoma (2). Furthermore, CD19-directed chimeric antigen receptor (CAR)-T cells and the bispecific T cell engager (BiTE®) blinatumomab have produced spectacular remissions in acute lymphoblastic leukemia and diffuse large B cell lymphoma (3–6).
Simultaneously, gene expression profiling (GEP) of tumor immune microenvironments is revolutionizing our understanding of cancer-immune interactions. Several recurrent pan-cancer immune profiles have been identified and could serve as biomarkers for predicting clinical responses to immunotherapy or for tailoring personalized treatment strategies (7, 8). Briefly, tumors with inflamed type I and II interferon (IFN)-driven immune microenvironments (informally designated as “hot”) are ICB responsive, while “cold” “immune-desert” tumors would rather benefit from adoptive cell transfer or tumor–peptide vaccination (9).
The development of immunotherapy in acute myeloid leukemia (AML) has been hindered so far not only by its remarkable genetic, antigenic, and clonal heterogeneity (10–13) and the risk of significant off-target hematologic toxicity but also by the lack of biomarkers defining patient populations more likely to benefit from it (9). Recent research revealed that immune profiles are identifiable in human AML and hold prognostic and therapeutic relevance (9, 14). The AML immune response shares numerous traits with solid cancers (15) and offers various opportunities for immunotherapy (9). However, given its origin within an immune-privileged, regulatory T cell (Treg)-abundant bone marrow (BM) niche (16), its low mutational load (11), deficient antigen presentation (17–20), aggressive growth, and bloodstream dissemination (21, 22), AML was regarded as a poorly immunogenic tumor with a rather “immune-desert” leukemia microenvironment (LME) phenotype (9), in which immunoediting is either absent or a rather late event (23).
Noteworthy, the LME of some AML cases displays evidence of a prior antileukemic immune response, restrained by immune escape mechanisms such as cytotoxic T lymphocyte associated protein-4 (CTLA-4)/B7.1/B7.2 and programmed death 1 (PD-1)/PD-1L signaling or Treg expansion (9). B7 molecules are key structures of the immune checkpoints that regulate T cell activation (24). Previous research has shown that upregulation of B7 ligands such as programmed death ligand 1 (PD-L1), PD-L2, and B7.2 on AML blasts is inducible by exposure to interferon γ (IFN-γ) (25–27), which indicates an “inflamed” immune profile. Hijacking of these immune checkpoint molecules is used by leukemia cells to evade immune surveillance (28).
The expression of IFN-γ-responsive genes has been correlated with primary refractory AML and is able to predict responses to ICB or flotetuzumab (CD3/CD123 DART®), showing that immune signatures within the LME can serve as reliable biomarkers to predict responses to immunotherapy (14, 29).
Previous research was rather focused on finding prognostic relevance of isolated B7 molecule expression in AML (28, 30–32), and only very recently a comprehensive analysis of B7 checkpoint ligand co-expression correlated with checkpoint receptors and T cell populations was conducted (33).
Well-beyond investigating the expression of isolated molecules, our study aims to simultaneously evaluate the B7 checkpoint ligand phenotype of AML blasts (B7.1, B7.2, PD-L1, PD-L2, ICOS-L, B7-H3, B7-H4) and the expression of immune checkpoint receptors (ICRs) [inducible T cell costimulator (ICOS), PD-1, CTLA-4] on helper and cytotoxic T cell maturation populations and to correlate these data to standard prognostic factors. We advanced the notion of “B7 checkpoint ligand signatures” to systematize the co-signaling output of AML blasts toward T cells. Since the expression of the immune escape PD-1/PD-L1 axis is correlated with an IFN-rich “inflamed” LME (9), it will be a challenge for future studies to demonstrate that the expression of B7 checkpoint ligands could serve as feasible alternative or complementary markers of AML with “inflamed” microenvironment, impacting upon distinctive immunotherapy approaches.
Materials and Methods
Patient Selection
Based on informed consent, 30 patients diagnosed with de novo, non-promyelocytic AML between 2016 and 2019 at the Iaşi Regional Oncology Institute, Romania, were included in this study. This study has been approved by the institutional ethics committee. BM and peripheral blood (PB) samples were collected at diagnosis. AML diagnosis was established according to the WHO diagnostic criteria (34), and patients were risk-stratified in accordance with the 2017 European Leukemia Net (ELN) recommendations (35). We have also analyzed the BM and PB samples of four healthy volunteers after their informed consent.
Flow Cytometry
AML blasts and T cells were analyzed by multiparameter flow cytometry (MFC) on erythrocyte-lysed fresh BM and PB samples. This study comprised four phases: (1) confirmation of AML diagnosis with EuroFlow standardized monoclonal antibody (MoAbs) panels (2, 36) analysis of the expression of B7-1, B7-2, PD-L1, B7-H2, PD-L2, B7-H3, B7-H4 on AML blasts; (3) analysis of Treg percentages and T cell maturation subsets in the BM; (4) evaluation of PD-1, ICOS, and CTLA-4 expression on T cell maturation subsets. In line with previous research regarding B7 checkpoint ligand expression in AML but also solid cancers, B7 molecules were considered positive if present on more than 10% of the total AML cells (30, 32, 37).
Data acquisition was performed on a BD FACS ARIA III cytometer, and data were interpreted using the FACS DIVA v6.1.3 software. An identical investigation protocol was applied for all healthy subjects. The MoAbs used in this study are detailed in Supplementary Table 1.
AML blasts gating was performed on CD45+/CD34+/CD117+/HLA-DR+ events. Subsequently, the expression level of each B7 molecule was assessed.
T cell gating was performed on CD3+/CD4+ and CD3+/CD8+ events. The following T cell maturation subsets were defined based on their differential expression of CD28, CD27, and CD45RA: naive (N), central memory (CM), intermediate effector memory (iEM), late effector memory (late EM) (38, 39). Tregs were defined as CD3+/CD4+/CD25+/CD127- events (40). A T cell population was considered predominant if it outnumbered each of the other T cell subsets. Finally, the expression of ICOS, PD-1, and CTLA-4 was evaluated on BM total and maturation subsets of CD4+ and CD8+ cells. All the experiments were performed in compliance with the rules of standard biosecurity and institutional safety procedures.
Statistical Analysis
Statistical analyses were performed using the IBM® SPSS Statistics 21.0 Software. Each figure contains the relevant statistical information: the n, total number of patients, the significance p-value, the statistical test used. The chi square, Fisher's exact test, Mann–Whitney test, and Student's t-test were used to analyze the associations between different variables. The Pearson correlation coefficient was calculated to investigate the relationships between numerical variables. The two-way ANOVA test was used to analyze the differences among multiple variables. A p < 0.05 was considered as statistically significant.
Results
Baseline Patient Characteristics
Patient data are summarized in Table 1. The median age at diagnosis was 59 years (range 27–83 years). A total of 23.3% of patients had favorable ELN risk cytogenetics, 46.7 and 30% had intermediate and, respectively, adverse karyotypes. Two patients harbored FLT-3-ITD mutations, and three patients had NPM1 mutated status. FLT-3-ITD and NPM-1 mutations did not coexist in our study group.
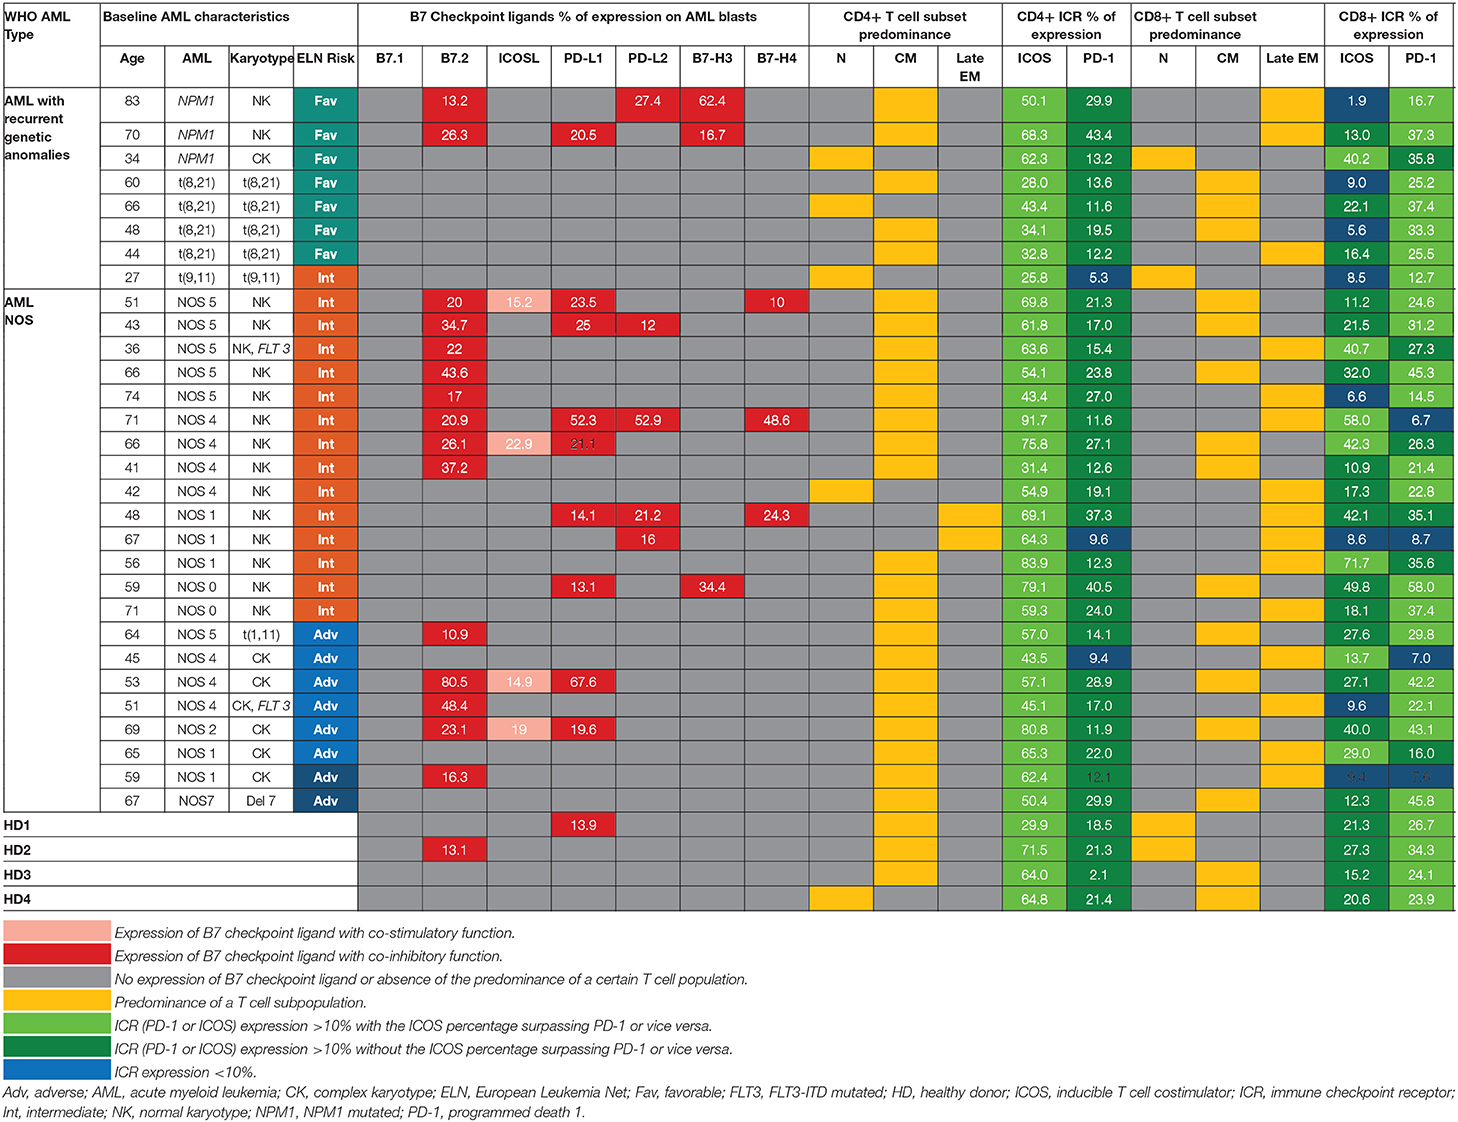
Table 1. Patterns of expression of B7 ligands, ICRs, T cell populations relative to WHO AML type and ELN risk.
B7 Checkpoint Ligands Are More Frequently Expressed in Intermediate and Adverse Risk Acute Myeloid Leukemia
Within the healthy donor (HD) group, we could evidence the isolated expression of two molecules, PD-L1 and B7.2, in two cases (Table 1), while 18 patients (60%) were identified with B7 ligand expression. The B7 molecule levels differed markedly from those of HD (Figure 1A): PD-L1 (B7+ vs. B7–: p = 0.028, B7– vs. HD: p = 0.739), B7.2 (B7+ vs. B7–: p = 0.0003, B7– vs. HD: p = 0.7111) and ICOS-L (B7+ vs. B7–: p = 0.049, B7– vs. HD: p = 0.011). Out of the B7-positive cases, 10 expressed B7 molecule signatures and eight had isolated B7 expression.
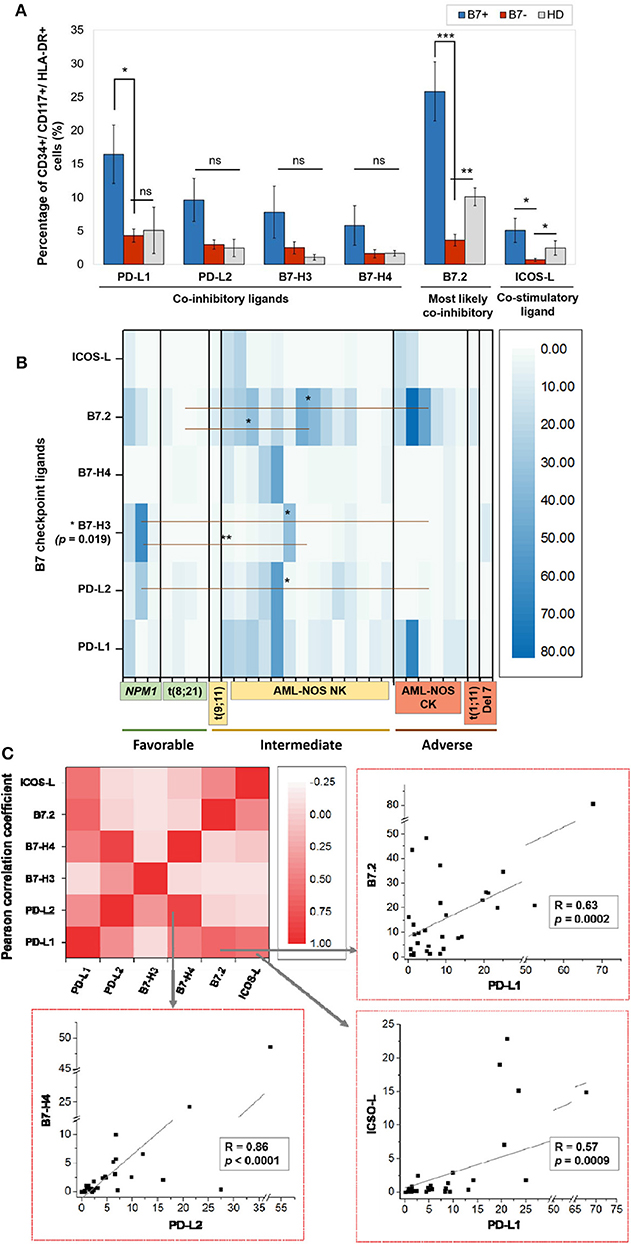
Figure 1. (A) Percentage of CD34+/CD117+/HLA-DR+ cells expressing the indicated B7 checkpoint ligands in patients, categorized as B7+ (n = 18) or B7– (n = 12) based on the B7 ligand expression and healthy donors (HD, n = 4). Bars represent the mean ± SEM (***P < 0.001, **P < 0.01, *P < 0.05; ns, not significant; two-tailed t-test, Mann–Whitney test). (B) Heat map of percentages of acute myeloid leukemia (AML) blasts expressing the indicated B7 checkpoint ligands in patients categorized based on their corresponding European Leukemia Net (ELN) risks: favorable, intermediate, and adverse (**P < 0.01, *P < 0.05; two-tailed t-test). (C) Heat map of B7 ligand co-expression. Pearson correlation coefficients (R) were computed, and ANOVA test was used to validate the significance of the identified correlations.
B7.2 was the most frequently expressed molecule (50% of cases, n = 15), followed by PD-L1 (30%, n = 9), PD-L2 (15%, n = 5), ICOS-L (12%, n = 4), B7-H3 (10%, n = 3), and B7-H4 (10%, n = 3). B7.1 was expressed at extremely low levels and was thus considered negative. B7.2 was equally expressed isolated or co-expressed, while all the other B7 ligands were mainly co-expressed on AML blasts as B7 signatures.
The majority of B7-positive patients (16 out of 18, 88.8%) had intermediate or adverse ELN risk AML-Not Otherwise Specified (NOS). Out of these, complex karyotype AML-NOS expressed either B7.2 isolated or co-expressed B7.2, ICOS-L, and PD-L1, while normal karyotype AML-NOS also expressed PD-L2, B7-H3, and B7-H4 alongside B7.2, ICOS-L, and PD-L1 (Figure 1B). The two FLT-3 ITD mutated, normal karyotype AML-NOS cases displayed only an isolated B7.2 expression (Table 1).
By contrast, favorable risk AML rarely expressed B7 molecules (2 out of 7 cases, 28.6%). Out of this group, NPM1 mutated AML was the only B7-positive subtype and was correlated with B7-H3 expression (p = 0.02) and significantly higher levels of B7-H3 when compared to the AML-NOS cases (p = 0.019). AML with t (8,21)(q22;q22) was B7 negative and expressed significantly lower percentages of B7.2 (p = 0.036) when compared to the AML-NOS cases (Figure 1B).
Further details regarding the expression of each B7 checkpoint ligand relative to age, WHO AML type, and ELN risk are provided in Table 1. We found no significant correlation between patient age, gender, hyperleukocytosis, and the expression of B7 checkpoint ligands. However, B7 positivity was correlated with the presence of refractory AML (p = 0.017, chi square test) and worse overall survival (p = 0.004, log rank test) (data not shown).
B7-Positive Leukemias Rather Express Inhibitory B7 Ligands
We have identified eight different B7 checkpoint ligand signatures in 10 patients (Table 1): co-expression of B7.2, ICOS-L, PD-L1 (three cases); B7.2, ICOS-L, PD-L1, B7-H4 (one case); B7.2, PD-L1, PD-L2 (one case); B7.2, PD-L1, B7-H3 (one case); B7.2, PD-L2, B7-H3 (one case); PD-L1; B7-H3 (one case); B7.2, PD-L1, PD-L2, B7-H4+ (one case); PD-L1, PD-L2, B7-H4+ (one case). A mean number of three B7 ligands were co-expressed in these signatures. PD-L1 and B7.2 were regularly expressed in B7 ligand signatures (90 and 80%, respectively), and all signatures included at least one B7 molecule with clearly defined or most likely co-inhibitory role, such as B7.2 (41).
Furthermore, we found statistically significant correlations between the expression levels of the following B7 ligand combinations: B7.2–PD-L1 (p = 0.0002), B7.2–ICOS-L (p = 0.019), PD-L1–ICOS-L (p = 0.0009), PD-L1–B7-H4 (p = 0.0051), PD-L2–B7-H4 (p < 0.0001). B7.2 expression was rather associated with ICOS-L and PD-L1 in the B7.2/PD-L1/ICOS-L (three cases) and B7.2/PD-L1/ICOS-L/B7-H4 signatures (one case). Moreover, PD-L2 was correlated to B7-H4 expression (p < 0.0001). However, B7.2 expression was not correlated to PD-L2, B7-H3, and B7-H4. Finally, B7-H3 and B7-H4 expression was mutually exclusive (p = 0.027; Figure 1C).
Helper and Cytotoxic T Cells From Acute Myeloid Leukemia Patients Display Different Maturation and Immune Checkpoint Receptor Expression Patterns
On an overall analysis, CD4+ T cells displayed predominantly a CM phenotype (80% of cases) and were rarely polarized as naive or effector cells. CD8+ cells displayed significantly higher late EM frequencies (p < 0.0001) and lower naive (p < 0.0001) and CM (p < 0.0001) cells than CD4+ cells (Figure 2A).
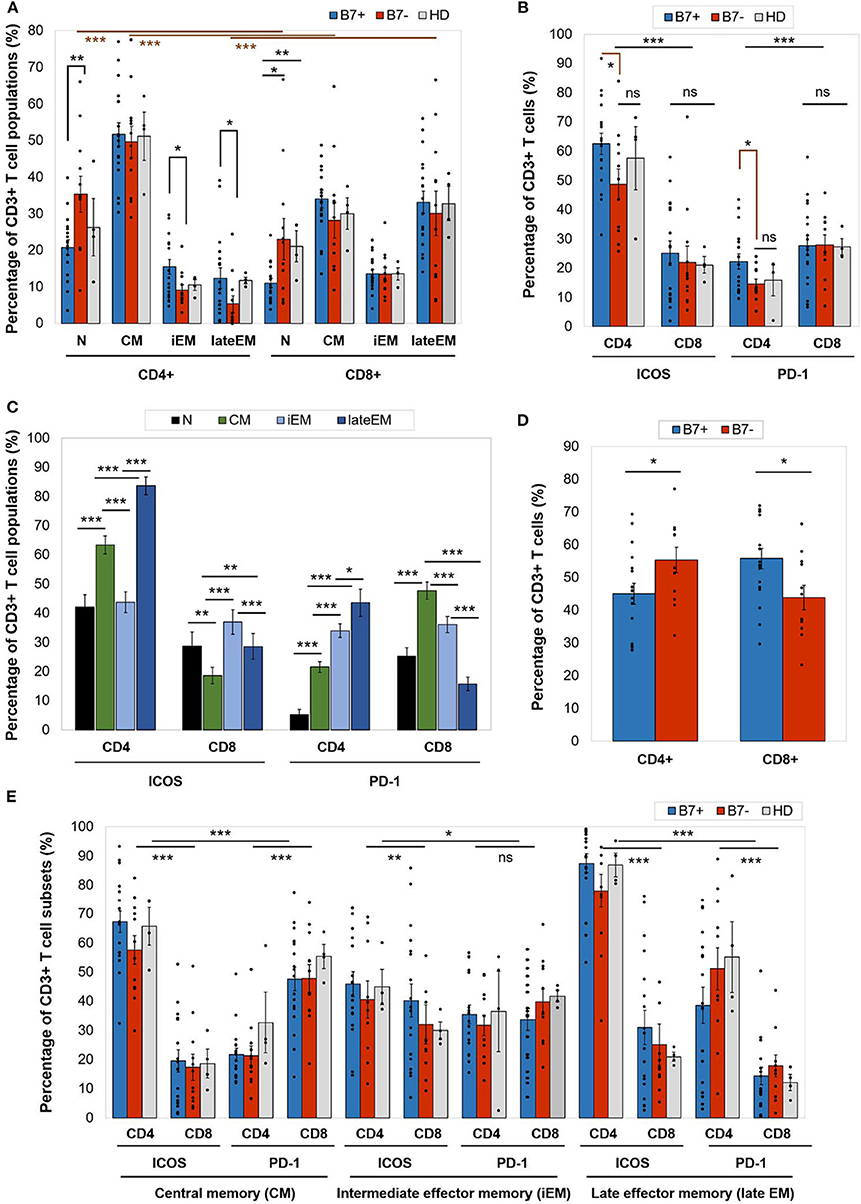
Figure 2. (A) Percentage of CD4+ or CD8+ T cell populations—naive (N), central memory (CM), intermediate effector memory (iEM), and late effector memory (late EM)—in AML patients (either B7+, n = 18, or B7–, n = 12) and healthy donors (HD, n = 4). Individual values are represented as points. Bars represent the mean ± SEM (**P < 0.01, *P < 0.05; two-tailed t-test, Mann–Whitney test). (B) Expression of immune checkpoint receptors [inducible T cell costimulator (ICOS) and programmed death 1 (PD-1)] on CD4+ or CD8+ T cells in AML patients (either B7+, n = 18, or B7-, n = 12) and healthy donors (HD, n = 4). Individual values are represented as points. Bars represent the mean ± SEM (***P < 0.001, *P < 0.05; ns, not significant; two-tailed t-test and two-way ANOVA). (C) Expression of immune checkpoint receptors (ICOS and PD-1) on CD4+ or CD8+ T cells populations—N, CM, iEM, and late EM—in AML patients. Bars represent the mean ± SEM (n = 30; ***P < 0.001, **P < 0.01, *P < 0.05; two-tailed paired t-test). (D) Percentage of C4+ or CD8+ T cells in AML patients (either B7+, n = 18, or B7–, n = 12). Individual values are represented as points. Bars represent the mean ± SEM (*P < 0.05; two-tailed t-test). (E) Expression of immune checkpoint receptors (ICOS and PD-1) on CD4+ or CD8+ T cells populations—CM, iEM, and late EM—in AML patients (either B7+, n = 18, or B7–, n = 12) and healthy donors (HD, n = 4). Individual values are represented as points. Bars represent the mean ± SEM (***P < 0.001, **P < 0.01, *P < 0.05; ns, not significant; two-way ANOVA).
When comparing the CD4+ and CD8+ T cells, CD4+ T cells had significantly higher ICOS expression (p < 0.0001), while CD8+ expressed higher PD-1 levels (p = 0.0001; Figure 2B). CTLA-4 was identified at levels below 1% on all T cell populations (Table 2A).
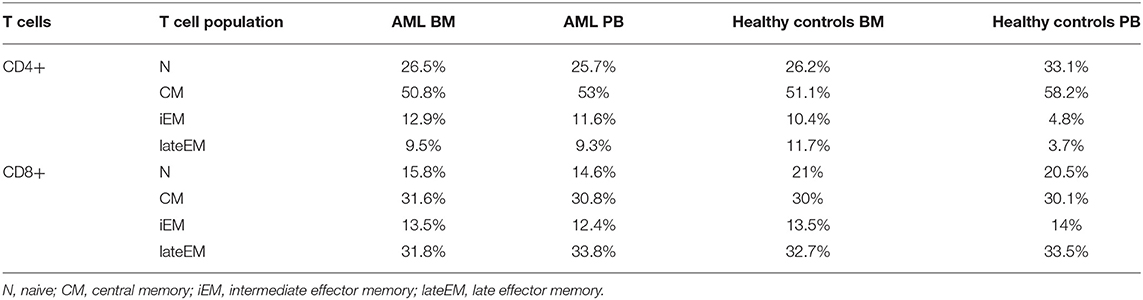
Table 2A. Mean percentages of T cell maturation populations in the BM aspirate and PB of AML patients and healthy controls.
Furthermore, ICOS and PD-1 expression varied across T cell maturation subsets. ICOS had the highest levels of expression on late EM CD4+ (lateEM vs. iEM: p < 0.0001, lateEM vs. CM: p < 0.0001) and iEM CD8+ (iEM vs. lateEM: p < 0.0001, iEM vs. CM: p < 0.0001) T cells (Figure 2C).
On CD4+ cells, PD-1 expression progressively increased from the naive toward late EM cells (N vs. CM: p < 0.0001, CM vs. iEM: p < 0.0001, iEM vs. lateEM: p = 0.027). By contrast, on CD8+ cells, the CM and iEM subpopulations expressed the highest PD-1 levels, and late EM cells displayed the lowest levels (lateEM vs. CM or iEM: p < 0.0001; Figure 2C, Tables 2A,B). Additionally, our analysis showed that all the PB T cell populations mirrored the BM T cell subpopulations in both AML patients and healthy individuals (Table 2A).
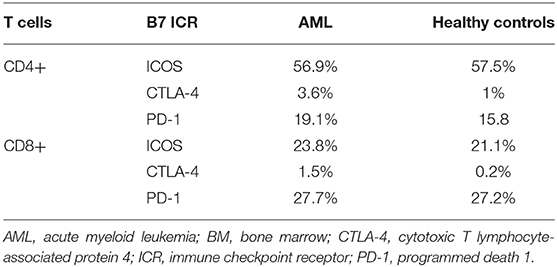
Table 2B. Mean percentages of positivity of ICOS, CTLA-4, and PD-1 on CD4+ and CD8+ BM T cells.
The B7 Phenotype of Acute Myeloid Leukemia Blasts Is Mirrored by Distinct Modifications in T Cell Maturation and Immune Checkpoint Receptor Expression
When compared to the B7 negatives, B7-positive patients displayed significantly higher percentages of CD8+ T cells (p = 0.019) and lower CD4+ T cells (p = 0.043; Figure 2D).
Although the majority of the BM CD4+ T cells were CM cells irrespectively of the B7 phenotype, two differences were noted in B7 positive cases: (1) lower percentages of naive T cells (p = 0.008); and (2) higher percentages of iEM (p = 0.016) and late EM (p = 0.022) T cells. Similarly, naive CD8+ T cells were poorly represented in B7-positive AMLs (Figure 2A).
Furthermore, B7+ patients expressed higher ICOS (CM: p < 0.0001, iEM: p = 0.009, lateEM: p < 0.0001) and PD-1 (CM: p < 0.0001, iEM: p = 0.11, lateEM: p < 0.0001) levels on the effector CD4+, but not CD8+ cells (Figure 2E).
Discussion
Similarly to solid cancers (7, 8), immune profiles in AML have been broadly described as T cell “inflamed,” in which immune cells overexpress multiple B7 ligands and ICRs, and “non-inflamed,” lacking evidence of adaptive resistance-driven immune dysfunction (9). Briefly, an “inflamed” immune profile is characterized by efficient presentation of leukemia antigens, dendritic cell activation, IFN-γ production, and the priming of leukemia-specific T cells. However, the antileukemia immune response is gradually inhibited by immune escape axes such as PD1–PD-L1, which exhaust T cells, in parallel with tumor outgrowth. By contrast, in an “immune-desert” profile, T cell priming is reduced or absent, and tolerance to leukemia is instated (7).
The “inflamed/non-inflamed” AML dichotomy might explain why patients with identical AML entities and risk profiles may have different outcomes that deviate from the initial ELN prognostic prediction (42). Recent research has demonstrated that an “inflamed” AML immune profile can predict the resistance to cytotoxic therapy but also the patient's responsiveness to immunotherapies such as ICBs or DART (9, 29, 43). However, future research is necessary to investigate how B7 immune profiling can complement the predictive ability of the ELN risk classification and guide immunotherapy.
In our study, we have identified two groups of patients based on the B7 phenotype that display T cell maturation profiles and ICR expression patterns that can be successfully reconciled with literature data regarding the immune pathogenesis of “inflamed” and “non-inflamed” cancer immune profiles.
The B7-positive group was predominant (60%) and was mostly characterized by the presence of molecules with known or most probably inhibitory role in cancer and AML in particular (B7.2, PD-L1, PD-L2, B7-H3, B7-H4) (28, 44). B7.2 and PD-L1 were the most frequently expressed checkpoint ligands, in line with previous research (30, 45). B7.1 was constantly negative. B7.2, PD-L1, PD-L2, or ICOS-L were constantly expressed across B7 signatures in several combinations that showed statistical relevance (Figure 1C), suggesting that they represent key players of AML immune evasion axes. However, statistical analysis further revealed several patterns of co-expression of the other B7 ligands that likely indicate slightly different immune evasion strategies across the various B7-positive AMLs. Thus, PD-L1 expression was correlated with B7.2 and ICOS-L positivity, but not with PD-L2, B7-H3, or B7-H4.
In complex karyotype AML-NOS, the B7 phenotype was rather restricted to isolated B7.2 expression or the co-expression of B7.2, PD-L1, and ICOS-L, which was also the most frequent B7 signature. On the other hand, normal karyotype AML-NOS cases expressed more diverse B7 ligands, including PD-L2 and B7-H4, which were statistically correlated, but also B7-H3. Interestingly, B7-H3 and B7-H4 expression was mutually exclusive, and B7-H3 expression was correlated with NPM1 mutated AML. ICOS-L was the only co-stimulatory ligand that was identified in 40% of B7 signatures. However, its facilitating role is probably either outbalanced by the co-expression of inhibitory ligands PD-L1 or B7.2 or, according to literature data, is detrimental in itself for successful antileukemic immunity by inducing Treg expansion (46), PD-1 expression, and T cell exhaustion (47, 48). Briefly, all these B7-positive cases shared the presence of B7.2, PD-L1, or PD-L2 but had a rather heterogeneous expression of ICOS-L, B7-H4, and B7-H3, ligands that are likely involved in fine-tuning the immune escape process across different AML subtypes. In line with literature data (43), we also found that B7 ligand expression was correlated with primary refractory AML (p = 0.017, chi square test) (data not shown).
The B7-negative patient group was smaller (40%) and encompassed most of the AML cases with recurrent genetic anomalies, most notably with t(8,21)(q22;q22) and t(9,11)(p21;q23).
The expression of B7 ligands on AML blasts has been further mirrored by polarization differences in T cell populations and ICR expression. When the B7+ and the B7– cases were analyzed separately, it turned out that the B7+ patient cases had significantly higher cytotoxic and lower T helper cell percentages, while this ratio was reversed within the B7– group. When analyzing the maturation subsets, we were able to show that most of the CD4+ T cells fall in the CM category, unlike the CD8+ T cells where the effector subsets outnumber the central memory ones. Furthermore, B7+ patients had a significantly lower number of naive CD4+ and CD8+ T cells than the B7- patients (Figure 2A). The similarity of the CM CD4+ and CD8+ T cells in the B7+, B7–, and healthy donor groups is most probably explained by the high number of lymphocytes that do not target leukemic cells. When analyzing the effector populations, an interesting distinction could be noticed. Both iEM and late EM populations of CD4+ T cells were higher in the B7+ patients than in the B7– patients, while within the CD8+ group of cells, even though the effector populations, especially late EM, were better represented, no significant differences could be evidenced between the B7-positive and B7-negative patients. This allows us to speculate that the B7+ AML cells prove more potent in priming the CD4+ T cells and turning them into both CM and effector cells than the B7– AMLs. However, the polarization distribution of the CD8+ cells suggests that the cytotoxic lymphocytes might benefit from both T helper-dependent and independent priming.
On an overall analysis of our AML patients, setting aside the maturation polarization, the ICOS expression was predominant on CD4+ T cells, while PD-1 was higher on CD8+ cells. When compared to B7 negatives, B7-positive patients expressed higher levels of both ICOS and PD-1 on CD4+ T cells, unlike the CD8+ cells that expressed similar levels of ICOS and PD-1 regardless of the B7 positivity or negativity. Despite the significant predominance of CD8+ T cells in B7+ AML patients, it so seems that B7 checkpoint ligands are rather impacting the immunoediting of CD4+ BM T cells.
Analyzing further the ICOS and PD-1 expression on maturative subsets, we have noted a progressive increase in PD-1 expression from the naive toward the CD4+ effector compartment, while ICOS expression was highest on lateEM cells. By contrast, PD-1 expression on CD8+ cells was highest on CM, but not effector cells that displayed higher ICOS levels. Since CD4+ T cells promote the CD8+ T cell antitumor activity and prevent their exhaustion (49), we can hypothesize that CD4 T cell PD-1-mediated exhaustion precedes CD8+ cell exhaustion in B7+ AML and, more than that, is a prerequisite for CD8+ cell exhaustion.
When extending the investigation of ICOS and PD-1 expression on maturative subsets in B7-positive and B7-negative patients, we could stress further that the highest ICOS expression was present on late EM CD4+ T cells, followed by CM and iEM CD4+ T cells, and it always surpassed the ICOS expression on CD8+ T cells. Even though the level of expression was constantly higher on the cells of B7-positive patients, no statistically significant differences vs. negative ones or healthy donors emerged. PD-1 was instead always expressed at higher levels on CD8+ T cells as compared to CD4+ T cells, with the highest level reached by the CM CD8+ T cells, followed by iEM and late EM CD8+ T cells. However, the differences between B7+ and B7– patients and healthy donors were again not significant, even though iEM and late EM CD8+ T cells constantly displayed higher levels of PD1. As ICOS and PD1 binding mediate activating, respectively, inhibitory signals, these results might suggest that, irrespectively of B7 expression on AML blasts, CD8+ T cells are more prone to PD-1-mediated apoptosis, while their CD4+ counterparts are more susceptible to activation, but also to activation-induced cell death. Furthermore, the presence or absence of the B7 molecules on the AML blasts seems to have a minimal impact in influencing the levels of expression of ICOS and PD-1 on the T cell surfaces.
Finally, we have aimed to harmonize our data with the models of AML immune pathogenesis with “inflamed” and “non-inflamed” microenvironments [reviewed in Davidson-Moncada et al. (9)]. Thus, in our study, it was the intermediate and adverse risk AML cases which were frequently B7 positive (78.2%), as well as NPM1 mutated AML, that displayed features holding indirect evidence of an “inflammatory” microenvironment, including the expression of mainly inhibitory B7 ligands, correlated with higher percentages of CD4 effector cells, less CD4+ and CD8+ naive T cells, as well as higher ICOS and PD-1 expression. NPM1 mutated AML also presented effector differentiation of CD8+ PD-1+ T cells, which is likely a feature of immune exhaustion. The rather inflammatory polarity of the immune microenvironment in NPM1 mutated AML is further supported by research that revealed that NPM1 mutation generates immunogenic peptides (50), an IFN-γ-driven T cell response (51) and is correlated with B7-H3 and PD-L1 expression (32, 52). These correlations are relevant since literature suggests that “inflamed” AML could benefit from ICB or even synergistic DART/ICB approaches (9, 43).
By contrast, B7-negative AML was characterized by higher percentages of naive CD4+ and CD8+ T cells and lower ICR expression and was more prevalent in AML with t(8,21)(q22;q22) but also in AML harboring the t(9,11)(p21;q23), an entity with rather low immunogenicity, as shown by previous research (53, 54). Thus, these non-inflamed, low immunogenic AML types are likely less capable of priming T cells and mounting antileukemia immune responses. Therefore, B7-negative AML should be approached differently by adoptive cell transfer (chimeric antigen receptor T cells), leukemia peptide vaccines, or strategies that augment tumor cell immunogenicity and convert “non-inflamed” LMEs to inflammatory ones, such as hypomethylating agents (9, 15).
It is most clear that further research is needed to improve the characterization of the T cell composition and immune checkpoint landscape of the BM microenvironment. Recently, a comprehensive study conducted by Williams et al. (33) addressed the frequencies of BM T cell populations and their ICR expression as well as the expression of B7 checkpoint ligands on tumor cells of 39 newly diagnosed and 68 relapsed AML patients and correlated them with standard AML prognostic factors. The authors showed that immune exclusion, i.e., the absence of T cell BM infiltration, is not a feature of AML, since BM T cell percentages were similar to the age-matched HD, a finding that has been replicated by our study. However, AML patients had slightly higher Treg percentages when compared to healthy donors. The study of Williams et al. (33) shows that the BM microenvironment has inflammatory features in a subgroup of patients since the numbers of effector helper and cytotoxic T cells were increased. Furthermore, CD4+ cells overexpressed the co-stimulatory molecules OX40 and ICOS, and PD-1 had higher expression percentages levels on both CD4- and CD8-positive T cells when compared to the control group. The differences in ICOS and PD-1 expression on CD4+ and, respectively, CD8+ cells in our study also suggest that helper and cytotoxic T cell exhaustion is a process regulated by subtle differences in the expression of co-stimulatory and co-inhibitory immune receptors. We consider this finding important for the design of future combination immunotherapies since successful ICB relies on the T helper-assisted generation of cytotoxic antitumor effector cells (7). Williams et al. (33) also show that T cell exhaustion is likely a multistep process, with latter stages of exhaustion co-expressing PD-1 and TIM-1 (T cell immunoglobulin and mucin domain containing-3) or LAG-3 (lymphocyte-activation gene 3) and indicating the presence of more antigen-experienced T cells in the BM milieu and an inflammatory environment. Regarding the expression of B7 ligands on AML cells, Williams et al. (33) correlated PD-L1 expression with TP53 mutation and adverse karyotypes. In our similarly sized group of newly diagnosed AML patients, we were able to confirm this association between the expression of B7 ligands, including PD-L1 and the adverse-risk ELN patient subgroup.
Williams et al. (33) did not present survival data since the patients had received various treatment modalities in different clinical trials. Although we found a statistically relevant detrimental effect of B7 expression on overall survival and correlated B7 expression with the presence of primary refractory AML (data not shown), we consider that these data require validation on a larger patient cohort since primary refractory AML patients represent a population with a particularly poor prognosis which might be independent of B7 expression.
Our study has obvious limitations, including the deliberate simplification of the leukemia immune biology, which depends on many other factors, such as functional T helper polarization (Th1, Th2, Th17), NK cells, macrophages or myeloid derived suppressor cells, and a relatively small patient group made of exclusively newly diagnosed AML cases however reflecting the heterogeneous AML patient population and confirming several conclusions emerging from the study of Williams et al. (33).
Our data provide a more in-depth insight on the immune biology of AML. The B7 expression and antileukemic immunity in general are continuously regulated by a plethora of factors, including tumor-independent ones (7, 15). Hence, the interaction between immune effectors and AML blasts should be regarded as a dynamic process and the B7 phenotypes of these cells might be subjects of change across the longitudinal evolution of the patients (9). For example, a patient with favorable risk AML might present with an immune desert B7-negative phenotype at diagnosis, which, at relapse, might convert to an inflammatory B7-positive one. Thus, it is more likely that independently of the ELN cytogenetic risk of AML, the B7 phenotype would rather indicate which immunotherapy approach is more suitable for the patient's type of immune dysfunction at that specific moment than assist practitioners in refining the long-term prognosis of AML patients.
All in all, our results reinforce the concept that this genetically heterogeneous disease has distinct and versatile patterns of antitumor immune response that depend on factors beyond the intrinsic genetic traits of the tumor cells. This finding is particularly relevant since new AML drugs are being rapidly developed and immune profiles emerge as a powerful biomarker in guiding and personalizing the new immunotherapy approaches.
Conclusions
Gene expression profiling of the leukemia immune microenvironment is laborious, time-consuming, and not widely available. Hence, alternative markers for a faster and less expensive evaluation of the AML immune landscape are needed. In this paper, we have demonstrated that B7 checkpoint receptor and ligand profiling by flow cytometry is able to generate relevant data.
In our study group, in more than half of the cases, the AML blasts expressed B7 molecule signatures or isolated B7 ligands. Regardless of the B7 combination, a co-inhibitory B7 molecule, such as B7.2, PD-L1, or PD-L2, was always present. B7 molecule expression was more frequent in intermediate and adverse ELN risk AML (78.2%) when compared to favorable risk cases (28.5%). Finally, B7 positivity was correlated with primary refractory AML and reduced overall survival.
B7-positive AMLs displayed a predominance of effector BM CD4+ T cells with significantly higher levels of ICOS and PD-1. B7-negative AMLs were characterized by a significant predominance of naive CD4+ and CD8+ T cells and lower CD4+ T cell ICOS and PD-1 levels.
As B7 ligands and their counterpart T cell receptors are regarded as indirect indicators of an IFN-driven “inflammatory” microenvironment, we can thus hypothesize that the B7 immune profiling of AML blasts and T cells could serve as a useful biomarker to rapidly discriminate between AMLs with “inflamed” vs. “non-inflamed” microenvironment. Rather than defining an AML subtype in itself, the B7 phenotype more likely offers a momentary perspective of the versatile interaction between leukemia and immune cells that could predict resistance to standard chemotherapy and could guide personalized immunotherapy.
We have undoubtedly entered a new therapeutic era in AML, where new and effective drugs are being rapidly designed, but the progress of immunotherapy clinical trials has a tendency to outpace our understanding of leukemia immune biology. The immune profiling of the tumor microenvironment will likely have a major impact on future clinical trial design, drug development, and integration of personalized immunotherapy in current therapeutic strategies.
Data Availability Statement
The datasets generated for this study are available on request to the corresponding author.
Ethics Statement
The studies involving human participants were reviewed and approved by Ethics Committee, Grigore T. Popa University of Medicine and Pharmacy, Iasi, Romania. The patients/participants provided their written informed consent to participate in this study.
Author Contributions
IA, MZ, and PC are responsible for the study design. IA, AD, and CD were involved in the clinical management of the patients. MZ, II, and AS performed the immunophenotypic, molecular, and cytogenetic analyses. MP performed the statistical analysis and contributed to the graphical illustrations. IA and PC wrote the manuscript. All the authors were involved in the revision of the manuscript.
Funding
This work was supported by a research grant from the University of Medicine and Pharmacy Gr. T. Popa, Iaşi, Romania, No. 30332/28.12.2017.
Conflict of Interest
The authors declare that the research was conducted in the absence of any commercial or financial relationships that could be construed as a potential conflict of interest.
Acknowledgments
We would like to thank Dr. Corina Cianga for the critical revision of the manuscript.
Supplementary Material
The Supplementary Material for this article can be found online at: https://www.frontiersin.org/articles/10.3389/fonc.2020.00264/full#supplementary-material
References
1. Kyi C, Postow MA. Immune checkpoint inhibitor combinations in solid tumors: opportunities and challenges. Immunotherapy. (2016) 8:821–37. doi: 10.2217/imt-2016-0002
2. Dada R. Program death inhibitors in classical hodgkin's lymphoma: a comprehensive review. Ann Hematol. (2018) 97:555–61. doi: 10.1007/s00277-017-3226-0
3. Maude SL, Frey N, Shaw PA, Aplenc R, Barrett DM, Bunin NJ, et al. Chimeric antigen receptor T cells for sustained remissions in leukemia. N Engl J Med. (2014) 371:1507–17. doi: 10.1056/NEJMoa1407222
4. Topp MS, Gökbuget N, Zugmaier G, Klappers P, Stelljes M, Neumann S, et al. Phase II trial of the anti-CD19 bispecific T cell–engager blinatumomab shows hematologic and molecular remissions in patients with relapsed or refractory B-precursor acute lymphoblastic leukemia. J Clin Oncol. (2014) 32:4134–40. doi: 10.1200/JCO.2014.56.3247
5. Roberts ZJ, Better M, Bot A, Roberts MR, Ribas A. Axicabtagene ciloleucel, a first-in-class CAR T cell therapy for aggressive NHL. Leuk Lymphoma. (2018) 59:1785–96. doi: 10.1080/10428194.2017.1387905
6. Blum S, Martins F, Lübbert M. Immunotherapy in adult acute leukemia. Leuk Res. (2017) 60:63–73. doi: 10.1016/j.leukres.2017.06.011
7. Chen DS, Mellman I. Elements of cancer immunity and the cancer–immune set point. Nature. (2017) 541:321–30. doi: 10.1038/nature21349
8. Thorsson V, Gibbs DL, Brown SD, Wolf D, Bortone DS, Ou Yang T-H, et al. The immune landscape of cancer. Immunity. (2018) 48:812–30.e14. doi: 10.1016/j.immuni.2018.03.023
9. Davidson-Moncada J, Viboch E, Church SE, Warren SE, Rutella S. Dissecting the immune landscape of acute myeloid leukemia. Biomedicines. (2018) 6:110. doi: 10.3390/biomedicines6040110
10. Welch J, Ley T, Link D, Miller C. The origin and evolution of mutations in acute myeloid leukemia. Cell. (2012) 150:264–278. doi: 10.1016/j.cell.2012.06.023
11. Papaemmanuil E, Gerstung M, Bullinger L, Gaidzik VI, Paschka P, Roberts ND, et al. Genomic classification and prognosis in acute myeloid leukemia. N Engl J Med. (2016) 374:2209–21. doi: 10.1056/NEJMoa1516192
12. Network TCGAR. Genomic and epigenomic landscapes of adult de novo acute myeloid leukemia. N Engl J Med. (2013) 368:2059–74. doi: 10.1056/NEJMoa1301689
13. Talati C, Sweet K. Recently approved therapies in acute myeloid leukemia: a complex treatment landscape. Leuk Res. (2018) 73:58–66. doi: 10.1016/j.leukres.2018.09.001
14. Vadakekolathu J, Patel T, Reeder S, Schaarschmidt H, Schmitz M, Bornhäuser M, et al. Immune gene expression profiling in children and adults with acute myeloid leukemia identifies distinct phenotypic patterns. Blood. (2017) 130:3942.
15. Curran EK, Godfrey J, Kline J. Mechanisms of immune tolerance in leukemia and lymphoma. Trends Immunol. (2017) 38:513–25. doi: 10.1016/j.it.2017.04.004
16. Fujisaki J, Wu J, Carlson AL, Silberstein L, Putheti P, Larocca R, et al. In vivo imaging of treg cells providing immune privilege to the haematopoietic stem-cell niche. Nature. (2011) 474:216–9. doi: 10.1038/nature10160
17. Chamuleau MED, Souwer Y, Van Ham SM, Zevenbergen A, Westers TM, Berkhof J, et al. Class II-associated invariant chain peptide expression on myeloid leukemic blasts predicts poor clinical outcome. Cancer Res. (2004) 64:5546–50. doi: 10.1158/0008-5472.CAN-04-1350
18. Van Luijn MM, Westers TM, Chamuleau MED, Van Ham SM, Ossenkoppele GJ, Van De Loosdrecht AA. Class II-associated invariant chain peptide expression represents a novel parameter for flow cytometric detection of acute promyelocytic leukemia. Am J Pathol. (2011) 179:2157–61. doi: 10.1016/j.ajpath.2011.07.027
19. Van Luijn MM, Chamuleau MED, Thompson JA, Ostrand-Rosenberg S, Westers TM, Souwer Y, et al. Class II-associated invariant chain peptide down-modulation enhances the immunogenicity of myeloid leukemic blasts resulting in increased CD4+ T-cell responses. Haematologica. (2010) 95:485–93. doi: 10.3324/haematol.2009.010595
20. Van Luijn MM, Chamuleau MED, Ressing ME, Wiertz EJ, Ostrand-Rosenberg S, Souwer Y, et al. Alternative Ii-independent antigen-processing pathway in leukemic blasts involves TAP-dependent peptide loading of HLA class II complexes. Cancer Immunol Immunother. (2010) 59:1825–38. doi: 10.1007/s00262-010-0908-z
21. Ommen HB, Hokland P, Haferlach T, Abildgaard L, Alpermann T, Haferlach C, et al. Relapse kinetics in acute myeloid leukaemias with MLL translocations or partial tandem duplications within the MLL gene. Br J Haematol. (2014) 165:618–28. doi: 10.1111/bjh.12792
22. Zhang L, Chen X, Liu X, Kline DE, Teague RM, Gajewski TF, et al. CD40 ligation reverses T cell tolerance in acute myeloid leukemia. J Clin Invest. (2013) 123:1999–2010. doi: 10.1172/JCI63980
23. Dudenhöffer-Pfeifer M, Bryder D. Immunoediting is not a primary transformation event in a murine model of MLL-ENL AML. Life Sci Alliance. (2018) 1:e201800079. doi: 10.26508/lsa.201800079
24. Loke P, Allison JP. Emerging mechanisms of immune regulation: the extended B7 family and regulatory T cells. Arthritis Res Ther. (2004) 6:208. doi: 10.1186/ar1225
25. Kondo A, Yamashita T, Tamura H, Zhao W, Tsuji T, Shimizu M, et al. Interferon-gamma and tumor necrosis factor-alpha induce an immunoinhibitory molecule, B7-H1, via nuclear factor-kappaB activation in blasts in myelodysplastic syndromes. Blood. (2010) 116:1124–31. doi: 10.1182/blood-2009-12-255125
26. Berthon C, Driss V, Liu J, Kuranda K, Leleu X, Jouy N, et al. In acute myeloid leukemia, B7-H1 (PD-L1) protection of blasts from cytotoxic T cells is induced by TLR ligands and interferon-gamma and can be reversed using MEK inhibitors. Cancer Immunol Immunother. (2010) 59:1839–49. doi: 10.1007/s00262-010-0909-y
27. Krönig H, Kremmler L, Haller B, Englert C, Peschel C, Andreesen R, et al. Interferon-induced programmed death-ligand 1 (PD-L1/B7-H1) expression increases on human acute myeloid leukemia blast cells during treatment. Eur J Haematol. (2014) 92:195–203. doi: 10.1111/ejh.12228
28. Greaves P, Gribben JG. The role of B7 family molecules in hematologic malignancy. Blood. (2013) 121:734–44. doi: 10.1182/blood-2012-10-385591
29. Uy GL, Godwin J, Rettig MP, Vey N, Foster M, Arellano ML, et al. Preliminary results of a phase 1 study of flotetuzumab, a CD123 x CD3 Bispecific dart® protein, in patients with relapsed/refractory acute myeloid leukemia and myelodysplastic syndrome. Blood. (2017) 130.
30. Whiteway A, Corbett T, Anderson R, Macdonald I, Grant Prentice H. Expression of co-stimulatory molecules on acute myeloid leukaemia blasts may effect duration of first remission. Br J Haematol. (2003) 120:442–51. doi: 10.1046/j.1365-2141.2003.04085.x
31. Chen X, Liu S, Wang L, Zhang W, Ji Y, Ma X. Clinical significance of B7-H1 (PD-L1) expression in human acute leukemia. Cancer Biol Ther. (2008) 7:622–7. doi: 10.4161/cbt.7.5.5689
32. Hu Y, Lv X, Wu Y, Xu J, Wang L, Chen W, et al. Expression of costimulatory molecule B7-H3 and its prognostic implications in human acute leukemia. Hematology. (2015) 20:187–95. doi: 10.1179/1607845414Y.0000000186
33. Williams P, Basu S, Garcia-Manero G, Hourigan CS, Oetjen KA, Cortes JE, et al. The distribution of T-cell subsets and the expression of immune checkpoint receptors and ligands in patients with newly diagnosed and relapsed acute myeloid leukemia. Cancer. (2018) 125:1470–81. doi: 10.1002/cncr.31896
34. Arber DA, Orazi A, Hasserjian R, Borowitz MJ, Beau MM Le, Bloomfield CD, et al. The 2016 revision to the World Health Organization classi fi cation of myeloid neoplasms and acute leukemia. Blood. (2016) 127:2391–406. doi: 10.1182/blood-2016-03-643544
35. Döhner H, Estey E, Grimwade D, Amadori S, Appelbaum FR, Büchner T, et al. Diagnosis and management of AML in adults: 2017 ELN recommendations from an international expert panel. Blood. (2017) 129:424–47. doi: 10.1182/blood-2016-08-733196
36. van Dongen JJM, Lhermitte L, Böttcher S, Almeida J, van der Velden VHJ, Flores-Montero J, et al. EuroFlow antibody panels for standardized n-dimensional flow cytometric immunophenotyping of normal, reactive and malignant leukocytes. Leukemia. (2012) 26:1908–75. doi: 10.1038/leu.2012.120
37. Thompson RH, Gillett MD, Cheville JC, Lohse CM, Dong H, Webster WS, et al. Costimulatory molecule B7-H1 in primary and metastatic clear cell renal cell carcinoma. Cancer. (2005) 104:2084–91. doi: 10.1002/cncr.21470
38. Mahnke YD, Brodie TM, Sallusto F, Roederer M, Lugli E. The who's who of T-cell differentiation: human memory T-cell subsets. Eur J Immunol. (2013) 43:2797–809. doi: 10.1002/eji.201343751
39. Xu L, Zhang Y, Luo G, Li Y. The roles of stem cell memory T cells in hematological malignancies. J Hematol Oncol. (2015) 8:113. doi: 10.1186/s13045-015-0214-5
40. Yu N, Li X, Song W, Li D, Yu D, Zeng X, et al. CD4+CD25+CD127low/– T Cells: a more specific treg population in human peripheral blood. Inflammation. (2012) 35:1773–80. doi: 10.1007/s10753-012-9496-8
41. Thompson CB. Distinct roles for the costimulatory ligands B7-1 and B7-2 in T helper cell differentiation? Cell. (1995) 81:979–82. doi: 10.1016/S0092-8674(05)80001-7
42. Gerstung M, Papaemmanuil E, Martincorena I, Bullinger L, Gaidzik VI, Paschka P, et al. Precision oncology for acute myeloid leukemia using a knowledge bank approach. Nat Genet. (2017) 49:332–340. doi: 10.1038/ng.3756
43. Rutella S, Church SE, Vadakekolathu J, Viboch E, Sullivan AH, Hood T, et al. Adaptive immune gene signatures correlate with response to flotetuzumab, a CD123 × CD3 bispecific dart® molecule, in patients with relapsed/refractory acute myeloid leukemia. Blood. (2018) 132(Suppl. 1):444. doi: 10.1182/blood-2018-99-111539
44. Guo Y, Wang AY. Novel immune check-point regulators in tolerance maintenance. Front Immunol. (2015) 6:421. doi: 10.3389/fimmu.2015.00421
45. Maeda A, Yamamoto K, Yamashita K, Asagoe K, Nohgawa M, Kita K, et al. The expression of co-stimulatory molecules and their relationship to the prognosis of human acute myeloid leukaemia: poor prognosis of B7-2-positive leukaemia. Br J Haematol. (1998) 102:1257–62. doi: 10.1046/j.1365-2141.1998.00901.x
46. Han Y, Dong Y, Yang Q, Xu W, Jiang S, Yu Z, et al. Acute myeloid leukemia cells express ICOS ligand to promote the expansion of regulatory T Cells. Front Immunol. (2018) 9:2227. doi: 10.3389/fimmu.2018.02227
47. Knaus HA, Berglund S, Hackl H, Blackford AL, Zeidner JF, Montiel-Esparza R, et al. Signatures of CD8+ T cell dysfunction in AML patients and their reversibility with response to chemotherapy. JCI insight. (2018) 3:e120974. doi: 10.1172/jci.insight.120974
48. Ozkazanc D, Yoyen-Ermis D, Tavukcuoglu E, Buyukasik Y, Esendagli G. Functional exhaustion of CD4 + T cells induced by co-stimulatory signals from myeloid leukaemia cells. Immunology. (2016) 149:460–71. doi: 10.1111/imm.12665
49. Ostroumov D, Fekete-Drimusz N, Saborowski M, Kühnel F, Woller N. CD4 and CD8 T lymphocyte interplay in controlling tumor growth. Cell Mol Life Sci. (2018) 75:689–713. doi: 10.1007/s00018-017-2686-7
50. Greiner J, Ono Y, Hofmann S, Schmitt A, Mehring E, Gotz M, et al. Mutated regions of nucleophosmin 1 elicit both CD4+ and CD8+ T-cell responses in patients with acute myeloid leukemia. Blood. (2012) 120:1282–89. doi: 10.1182/blood-2011-11-394395
51. Forghieri F, Riva G, Lagreca I, Barozzi P, Vallerini D, Morselli M, et al. Characterization and dynamics of specific T cells against nucleophosmin-1 (NPM1)-mutated peptides in patients with NPM1-mutated acute myeloid leukemia. Oncotarget. (2019) 10:869–82. doi: 10.18632/oncotarget.26617
52. Greiner J, Hofmann S, Schmitt M, Götz M, Wiesneth M, Schrezenmeier H, et al. Acute myeloid leukemia with mutated nucleophosmin 1: an immunogenic acute myeloid leukemia subtype and potential candidate for immune checkpoint inhibition. Haematologica. (2017) 102:e499–e501. doi: 10.3324/haematol.2017.176461
53. Andersson AK, Ma J, Wang J, Chen X, Gedman AL, Dang J, et al. The landscape of somatic mutations in infant MLL-rearranged acute lymphoblastic leukemias. Nat Genet. (2015) 47:330–7. doi: 10.1038/ng.3230
Keywords: acute myeloid leukemia (AML), immunotherapy, checkpoint ligand, B7 molecules, programmed death 1 (PD-1), inducible T cell costimulator (ICOS)
Citation: Antohe I, Dǎscǎlescu A, Dǎnǎilǎ C, Titieanu A, Zlei M, Ivanov I, Sireteanu A, Pavel M and Cianga P (2020) B7-Positive and B7-Negative Acute Myeloid Leukemias Display Distinct T Cell Maturation Profiles, Immune Checkpoint Receptor Expression, and European Leukemia Net Risk Profiles. Front. Oncol. 10:264. doi: 10.3389/fonc.2020.00264
Received: 09 January 2020; Accepted: 14 February 2020;
Published: 13 March 2020.
Edited by:
Ciprian Tomuleasa, Iuliu Haţieganu University of Medicine and Pharmacy, RomaniaReviewed by:
Mihnea Dragomir, University of Texas MD Anderson Cancer Center, United StatesAlina Daniela Tanase, Fundeni Clinical Institute, Romania
Copyright © 2020 Antohe, Dǎscǎlescu, Dǎnǎilǎ, Titieanu, Zlei, Ivanov, Sireteanu, Pavel and Cianga. This is an open-access article distributed under the terms of the Creative Commons Attribution License (CC BY). The use, distribution or reproduction in other forums is permitted, provided the original author(s) and the copyright owner(s) are credited and that the original publication in this journal is cited, in accordance with accepted academic practice. No use, distribution or reproduction is permitted which does not comply with these terms.
*Correspondence: Petru Cianga, cGV0cnUuY2lhbmdhQHVtZmlhc2kucm8=