 Natasja L. de Vries
 Ahmed Mahfouz
 Frits Koning
 Noel F. C. C. de Miranda
- 1Pathology, Leiden University Medical Center, Leiden, Netherlands
- 2Immunohematology and Blood Transfusion, Leiden University Medical Center, Leiden, Netherlands
- 3Human Genetics, Leiden University Medical Center, Leiden, Netherlands
- 4Delft Bioinformatics Laboratory, Delft University of Technology, Delft, Netherlands
- 5Leiden Computational Biology Center, Leiden University Medical Center, Leiden, Netherlands
Cancers are characterized by extensive heterogeneity that occurs intratumorally, between lesions, and across patients. To study cancer as a complex biological system, multidimensional analyses of the tumor microenvironment are paramount. Single-cell technologies such as flow cytometry, mass cytometry, or single-cell RNA-sequencing have revolutionized our ability to characterize individual cells in great detail and, with that, shed light on the complexity of cancer microenvironments. However, a key limitation of these single-cell technologies is the lack of information on spatial context and multicellular interactions. Investigating spatial contexts of cells requires the incorporation of tissue-based techniques such as multiparameter immunofluorescence, imaging mass cytometry, or in situ detection of transcripts. In this Review, we describe the rise of multidimensional single-cell technologies and provide an overview of their strengths and weaknesses. In addition, we discuss the integration of transcriptomic, genomic, epigenomic, proteomic, and spatially-resolved data in the context of human cancers. Lastly, we will deliberate on how the integration of multi-omics data will help to shed light on the complex role of cell types present within the human tumor microenvironment, and how such system-wide approaches may pave the way toward more effective therapies for the treatment of cancer.
Introduction – Heterogeneity of Cancer and Need for Multidimensional Approaches
A genetic basis for cancer development was first proposed by the German zoologist Theodor Boveri who speculated that malignant tumors might be the result of abnormal chromosome alterations in cells (1). By then, a cancer cell-centric vision dominated, where tumorigenesis was thought to be exclusively driven by multistep alterations in cellular genomes. During the last decades, however, it has become increasingly apparent that the study of cancers must also encompass other constituents of the cancer microenvironment including immune cells, fibroblasts, and other stromal components, to capture all aspects of cancer biology (2). The immune system, for example, plays a dichotomous role in cancer development and progression, as different cells can antagonize or promote tumorigenesis (3). The mapping and understanding of the interplay between cancer cells and other constituents of the cancer microenvironment is thus fundamental for the clinical management of this disease.
The study of cancers as complex systems is further complicated by cancer heterogeneity that can occur at different levels; intratumorally, between lesions, and across patients. Intratumoral heterogeneity involves the near-stochastic generation of both genetic (e.g., mutations, chromosomal aberrations) and epigenetic (e.g., DNA methylation, chromatin remodeling, post-translational modification of histones) modifications. Within tumors, distinct niches can favor the outgrowth of different cancer cell clones that acquired characteristics compatible with regional microenvironments (e.g., nutrient and oxygen availability, exposure to immune cells). Other intrinsic sources of heterogeneity such as self-renewal of cancer cells and cell differentiation processes contribute further to intratumoral heterogeneity (4, 5). In addition, the immune system is a major part of the tumor microenvironment and contains many different types of adaptive (e.g., CD4+ and CD8+ T lymphocytes) and innate (e.g., macrophages and innate lymphoid cells) immune cells that also contribute to cancer heterogeneity (6). Their location within a tumor has been shown to significantly impact their anti- or pro-tumorigenic effects (7). In addition, the density of immune cell infiltration in tumors is a well-known determinant for the prognosis of cancer patients (8). Inter-lesional heterogeneity can be observed between multiple primary tumors at time of diagnosis, between a primary tumor and metastasis, and between different metastatic niches in individual patients. They can be a result of the outgrowth of subclones that can be (epi)genetically distinguished by mutations or structural variations (9). Moreover, the structure and composition of the cancer microenvironment can vary between the primary tumor and metastases. Upon extravasation, cancer cells from primary tumors are exposed to different types of immune cells, stromal cells, platelets, and metabolic stress, and have to adapt to the new tissue microenvironment. As such, the metastatic tissue (“soil”) plays a critical role in regulating the growth of metastases (“seed”) (10). Finally, interpatient heterogeneity is, on top of the aforementioned variables, also fueled by distinct germline genetic backgrounds and environmental and stochastic factors that can affect cancer progression but also immunity.
Major challenges in the field of cancer research are the identification of predictive biomarkers to select patients that are likely to respond to specific treatments, the detection of mechanisms of resistance to therapy, and the development of novel treatments to improve cancer survival. Here, we review the rise of cutting-edge multidimensional technologies such as spectral flow cytometry, multiparameter immunofluorescence, (imaging) mass cytometry, single-cell RNA-sequencing (scRNA-seq), and RNA spatial profiling that may play a crucial role to address the former problems. We will discuss how multi-omics of dissociated cells as well as of spatial data can be obtained (Figure 1A) and the importance of integrating them to reveal the full cellular landscape of the cancer microenvironment (Figures 1B,C). For example, single-cell data of dissociated cells can be used as guide for cell type identification in spatial data (11) and, vice versa, spatial data can be used to predict the location of dissociated cells based on the similarity of their expression profiles to spatially-mapped data (12–14) (Figure 1B). In addition, mapping can be used to predict the spatial profile of genes or proteins which have not been experimentally measured to expand the coverage of spatial data (Figure 1C) (15–17).
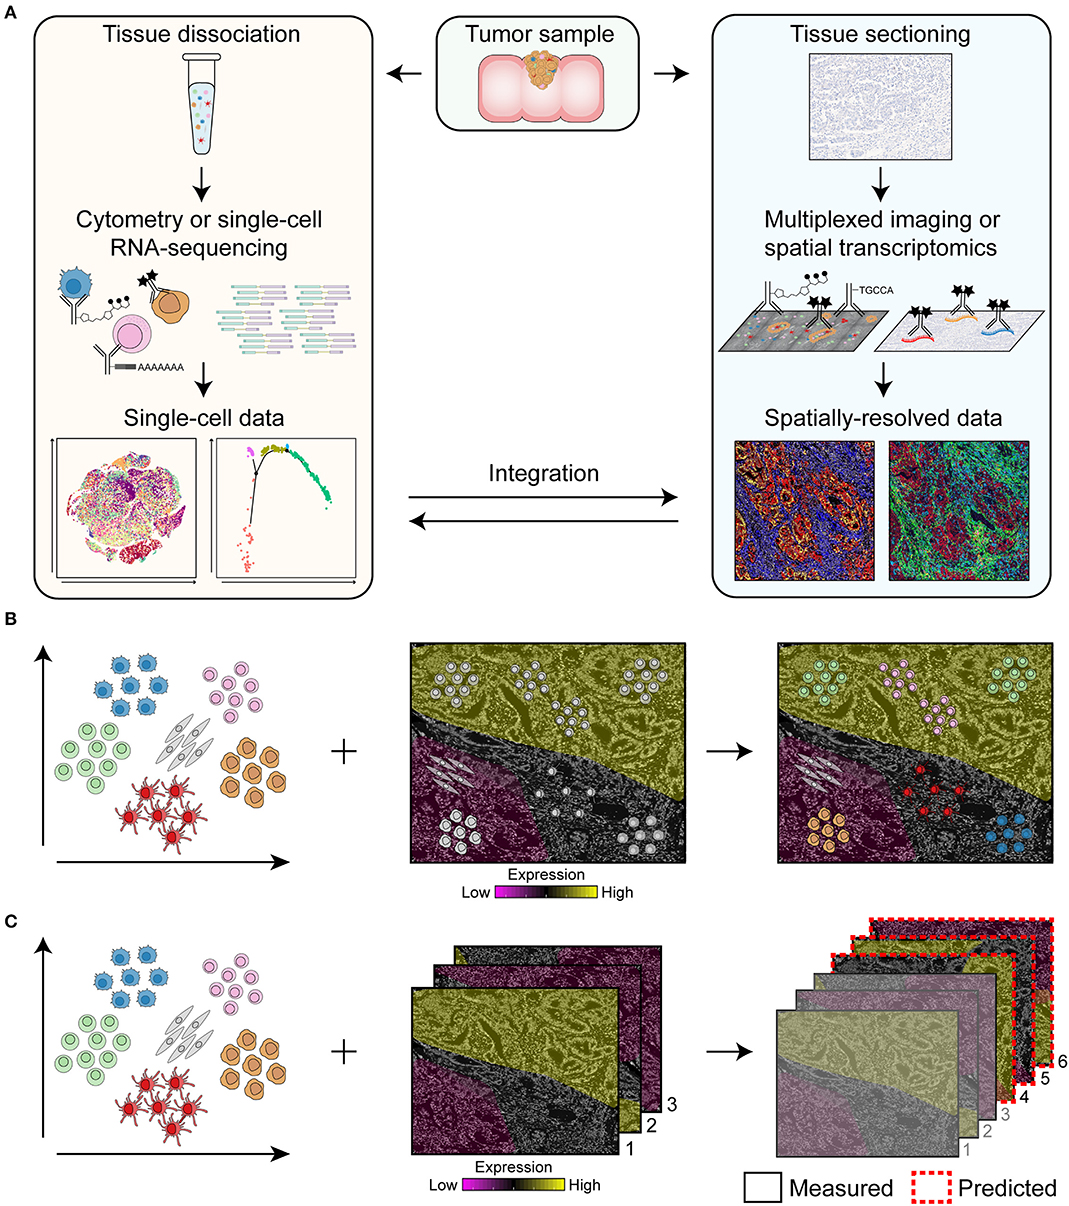
Figure 1. Overview of the pipeline for the integration of single-cell data of dissociated cells and spatially-resolved data. (A) Single-cell data can be obtained by flow and mass cytometry that make use of antibodies coupled to fluorochromes or heavy metal isotopes, respectively, for the immunodetection of dissociated cells. For single-cell RNA-sequencing, antibodies coupled to oligonucleotides can be used to simultaneously retrieve information on protein and RNA expression of single cells. Spatially-resolved data can be obtained by multiplexed imaging or spatial transcriptomics by immunodetection of tissue sections with antibodies coupled to fluorochromes, heavy metal isotopes or oligonucleotides. Integration of single-cell data of dissociated cells with spatially-resolved data will reveal the full cellular landscape of the cancer microenvironment. (B,C) Integration approaches for single-cell data of dissociated cells and spatially-resolved data. Single-cell data of dissociated cells can be used as guide for cell type identification in spatial data and, vice versa, spatially-resolved data can be used to predict the location of dissociated cells based on the similarity of their expression profiles to spatially-mapped data (B). In addition, single-cell data can be used to predict the spatial profile of genes or proteins in the samples that have not been measured to expand the coverage of spatial data (C). Based on samples that have been measured (i.e., sample 1, 2, and 3), the expression of genes or proteins in sample 4, 5, and 6 can be predicted.
Multidimensional Single-Cell Technologies and Their Strengths and Weaknesses
Single-Cell DNA- and RNA-Sequencing
Next-generation sequencing (NGS) approaches have revolutionized our ability to generate high-throughput genomic data where individual RNA and DNA molecules are represented by sequencing reads thereby retaining information on genotypes, phenotypes, cellular states, and sub-clonal alterations. Traditional molecular profiling has, until recently, largely relied on the analysis of bulk cell populations. Deep sequencing of DNA and RNA from tissues enabled reconstruction of “average” genomes and “average” transcriptomes that could then be deconstructed by employing bioinformatic algorithms to perform clonal evolution analysis or determine the composition of cancer microenvironments (18–21). For an unbiased and systematic characterization of cells, high-throughput single-cell DNA- and RNA-sequencing have emerged as powerful tools. With single-cell DNA-sequencing, the genomic heterogeneity of tissues can be explored in detail. It can be used to detect nucleotide variations and chromosomal copy number alterations as well as more complex genomic rearrangements and cellular fractions. Single-cell genome sequencing involves whole-genome amplification of single cells, of which the three main methods are MDA (22), MALBAC (23), and DOP-PCR (24). In 2011, the first study of DNA-sequencing of human breast cancer single cells was published (25), which was followed by many single-cell studies charting genetic heterogeneity within individual tumors as well as between primary tumors and their metastases, thereby allowing for a detailed understanding of the evolution processes occurring in a tumor. Single-cell DNA-sequencing has myriad applications in cancer research including examining intratumoral heterogeneity (26–28), investigating clonal evolution during tumorigenic processes (25, 29–32), tracing metastatic dissemination (33), genomic profiling of circulating tumor cells (34–36), measuring mutation rates (37), and gain insight into resistance to therapy (38). By defining, in detail, the genetic composition of tumors, the rationalization of targeted cancer therapies is made possible. However, drawbacks of single-cell DNA-sequencing methods are non-uniform coverage and allelic dropout events as well as artifacts introduced during genomic amplification, all of which contribute to a high rate of false negative and false positive findings (39).
The first single-cell RNA-sequencing (scRNA-seq) experiment was published in 2009 by Tang and colleagues who profiled the transcriptome of a single cell from early embryonic development (40). Rapid technological advances resulted in an exponential increase in the number of cells that can be studied by scRNA-seq analyses (41). Just 8 years later, 10x Genomics published a scRNA-seq dataset of more than one million individual cells from embryonic mice brains (42). There are many different scRNA-seq library preparation platforms, which can be categorized into plate-based, droplet-based, and microwell-based (41). The selection of the method depends on the research question, the number of input cells, the sequencing depth, the need for full-length coverage of transcriptomes, and costs, among others [reviewed by (43, 44)]. ScRNA-seq has demonstrated to be a powerful technique to decipher cancer biology. In 2012, Ramskold et al. applied scRNA-seq to study circulating tumor cells in melanoma, and could identify potential biomarkers for melanoma as well as SNPs and mutations in this relatively rare circulating tumor cell population (45). Thereafter, scRNA-seq has been used to study the microenvironment of several cancer types including prostate cancer (46), breast cancer (47), glioma (48–50), renal cancer (51), lung cancer (52), melanoma (53–56), colorectal cancer (57–59), pancreatic ductal adenocarcinoma (60), liver cancer (61), head and neck cancer (62), leukemia (63), and glioma (64). A pioneering study that applied scRNA-seq to primary glioblastomas uncovered inherent variability in oncogenic signaling, proliferation, immune responses, and regulators of stemness across cells sorted from five tumors (48). However, this study was restricted to cancer cells and did not further investigate other cell types of the cancer microenvironment. Subsequently, another scRNA-seq study examined distinct genotypic and phenotypic states of malignant, immune, stromal, and endothelial cells of melanomas from 19 patients (53). They identified cell states linked to resistance to targeted therapy, interactions between stromal factors and immune cell abundance, and potential biomarkers for distinguishing dysfunctional and cytotoxic T cells. A recent study in colorectal cancer broadened such scRNA-seq analysis by including a comparison of primary tumors to matched normal mucosa samples (58). By projecting their scRNA-seq data to a large reference panel, the authors identified distinct subtypes of cancer-associated fibroblasts and new expression signatures that were predictive of prognosis in colorectal cancer. Further, scRNA-seq has been applied to investigate changes in the tumor microenvironment of cancer patients treated with immune checkpoint blockade to find signatures associated with positive responses to this therapy (65, 66).
Currently scRNA-seq can be combined with sequencing of T cell receptor and immunoglobulin repertoires thereby allowing to connect information of B- and T cell specificity and phenotype. High-throughput single-cell B cell receptor sequencing of more than 250,000 B cells from different species has recently been pioneered to obtain paired antibody heavy- and light chain information at the single-cell level, and revealed a rapid discovery of antigen-reactive antibody candidates (67). By a novel approach called RAGE-seq (Repertoire and Gene Expression by Sequencing), gene expression profiles can be paired with targeted full-length mRNA transcripts providing BCR and TCR sequences (68). This method has been applied to study cells from the primary tumor and tumor-associated lymph node of a breast cancer patient and demonstrated the ability to track clonally related lymphocytes across tissues and link TCR and BCR clonotypes with gene expression features (68). A limitation of scRNA-seq is that RNA levels are not fully representative of protein amounts. The advent of CITE-seq, REAP-seq, and Abseq overcame this limitation by enabling simultaneous detection of gene expression and protein levels in single cells by combining oligonucleotide-labeled antibodies against cell surface proteins with transcriptome profiling of thousands of single cells in parallel (69–71). scRNA-seq, when employed in a discovery setting, can inform on the best markers to be used for the study of specific populations by complementary technologies such as flow or mass cytometry. However, aspects of sample preparation and handling have been shown to induce significant alterations in the transcriptome (72). Furthermore, throughput is limited by cost, protocol complexity, available sequencing depth, and dropout events. Together, this can affect the downstream analysis pipeline such as clustering of cell populations and the inference of cellular relationships.
Computational analysis of scRNA-seq data is challenging and involves multiple steps, e.g., quality control, normalization, clustering, and identification of differentially expressed genes and/or trajectory inferences. Multiple unsupervised clustering analyses are available to identify putative cell types, of which graph-based clustering is most widely used (73). For each of these steps, numerous computational tools are available, but in addition software packages have implemented the entire clustering workflow such as Seurat (16), scanpy (74), and SINCERA (75).
Single-Cell Epigenetic Characterization
Although most high-throughput profiling studies to date have focused on DNA, RNA, and protein expression, recent progress in studying the epigenetic regulation of gene expression, at single-cell level, has been made. Over the last decades, methods have been developed including ATAC-seq to measure chromatin accessibility (76), bisulfite sequencing to measure DNA methylation (77), ChIC-sequencing to measure histone modifications (78), and chromosome conformation capture (3C) to analyze the spatial organization of chromatin in a cell (79). Several studies revealed epigenetic programs that regulate T cell differentiation and dysfunction in tumors. Analysis of chromatin accessibility by ATAC-seq revealed that CD8+ T cell dysfunction is accompanied with a broad remodeling of the enhancer landscape and transcription factor binding as compared to functional CD8+ T cells in tumors (80–83). Also, an increased chromatin accessibility at the enhancer site of the PDCD1 gene (encoding for PD-1) has been found in the context of dysfunctional CD8+ T cells (82). In addition, studies have applied epigenetics to determine mechanisms of resistance to cancer immunotherapies by characterizing chromatin regulators of intratumoral T cell dysfunction before and after PD-1, PD-L1, or CTLA-4 blockade therapy (84, 85). Lastly, DNA hypermethylation may result in the inactivation of genes, such as mismatch repair gene MLH1 associated with microsatellite instability in colorectal cancer (86). Until recently, studies on epigenetic modifications depended on correlations between bulk cell populations. Since 2013, with the development of single-cell technologies, epigenomic techniques have been modified for application to single cells to study cell-to-cell variability in for instance chromatin organization in hundreds or thousands of single cells simultaneously. Several single-cell epigenomic techniques have been reported on recently, including measurements of DNA methylation patterns (scRRBS, scBS-seq, scWHBS) (87–89), chromatin accessibility (scATAC-seq) (90), chromosomal conformations (scHi-C) (91), and histone modifications (scChIC-seq) (92). A recent study applied scATAC-seq to characterize chromatin profiles of more than 200,000 single cells in peripheral blood and basal cell carcinoma. By analyzing tumor biopsies before and after PD-1 blockade therapy, Satpathy et al. could identify chromatin regulators of therapy-responsive T cell subsets at the level of individual genes and regulatory DNA elements in single cells (93). Interestingly, variability in histone modification patterns in single cells have also been studied by mass cytometry, which was denominated EpiTOF (94). In this way, Cheung et al. identified a variety of different cell-type and lineage-specific profiles of chromatin marks that could predict the identity of immune cells in humans. Lastly, scATAC-seq has been combined with scRNA-seq and CITE-seq analyses to find distinct and shared molecular mechanisms of leukemia (95). These single-cell strategies will allow to further understand how the epigenome drives differentiation at the single-cell level and unravel drivers of epigenetic states that could be used as target for the treatment of cancer. Additionally, these methods may be used to measure genome structure in single cells to define the 3D structure of the genome. However, for many of these single-cell epigenetic techniques, disadvantages are the low coverage of regulatory regions such as enhancers (scRRBS), low coverage of sequencing reads (scChiP-seq, scATAC-seq), and low sequencing resolution (scHi-C) (96, 97).
Single-Cell Protein Measurements
Flow cytometry has been, in the past decades, the method of choice for high-throughput analysis of protein expression in single cells. The number of markers that can be simultaneously assayed was limited to ~14 markers due to the broad emission spectra of the fluorescent dyes. Recent developments with spectral flow cytometer machines enable the detection of up to 34 markers in a single experiment by measuring the full spectra from each cell, which are unmixed by reference spectra of the fluorescent dyes and the autofluorescence spectrum (98). Fluorescence emission is registered by detectors consisting of avalanche photodiodes instead of photomultiplier tubes used in conventional flow cytometry. A variety of cellular features can be detected by flow cytometry including DNA and RNA content, cell cycle stage, detailed immunophenotypes, apoptotic states, activation of signaling pathways, and others [reviewed by (99)]. This technique has thus been paramount in characterizing cell types, revealing the existence of previously unrecognized cell subsets, and for the isolation of functionally distinct cell subsets for the characterization of tumors. However, the design of multiparameter flow cytometry antibody panels is a challenging and laborious task, and most flow cytometry studies have so far focused on the in-depth analysis of specific cellular lineages, instead of a broad and system-wide approach.
In 2009, the advent of a new cytometry methodology, mass cytometry (CyTOF, cytometry by time-of-flight), overcame the limitation of spectral overlap by using metal-isotope-conjugated antibodies to detect antigens (100). The metal isotopes attached to each cell are distinguished by mass and quantified in a quadrupole time-of-flight mass spectrometer. A mass cytometer is theoretically capable of detecting over 100 parameters per cell, but current chemical methods limit its use to ~40–50 parameters, simultaneously. Mass cytometry has expanded the breadth of single-cell data in each experiment, making it highly suitable for systems-level analyses such as immunophenotyping of cancer microenvironments. By allowing the examination of large datasets at single-cell resolution, mass cytometry can be applied for the discovery of novel cell subsets as well as for the detection and identification of rare cells. Further advantages of mass cytometry are the irrelevance of autofluorescence, the low biological background as heavy metals are not naturally present in biological systems, and limited signal spillover between heavy metals, thereby reducing the complexity of panel design. Conversely, as compared to flow cytometry, mass cytometry suffers from a higher cell loss during acquisition, is more expensive, and is low-throughput, with a flow rate of up to 500 cells per sec as compared to thousands of cells per sec in flow cytometry. In addition, cells cannot be sorted for further analysis and forward- and side-scattered light is not detected.
Several studies have applied mass cytometry to further characterize immune cell profiles in peripheral blood or tissues from patients with breast cancer (101), renal cancer (102), melanoma (55, 56, 103–105), lung cancer (52, 106, 107), glioma (49, 50), colorectal cancer (57, 106, 108, 109), liver cancer (61, 110), ovarian cancer (111), and myeloma (112–115), among others. In addition to characterizing immune cell profiles of different tissue types, mass cytometry has also been used to characterize immunophenotypes in tumors and monitor changes during immunotherapy (56, 103–105, 114). In this way, factors that influence response to immunotherapy can be investigated and mechanisms at play during treatment can be characterized. This information can be used to understand and facilitate the identification and classification of responder vs. non-responders to cancer immunotherapy. Most of the studies so far have focused on the CTLA-4 and PD-1/PD-L1 axis of cancer immunotherapy, but novel immunotherapeutic targets such as co-inhibitory molecules LAG-3 or TIM-3 or co-stimulatory molecules such as OX40 and GITR are currently being explored in mice models and clinical trials (116). Moreover, mass cytometry has been employed to study antigen-specific T cells with a multiplex MHC class I tetramer staining approach, which has led to the identification of phenotypes associated with tumor antigen-specific T cells (106). Most studies applied mass cytometry for measuring cell surface or intracellular markers, but it can also be used to evaluate cell signaling processes relying on the analysis of protein phosphorylation (117). Altogether, these studies showed that immune responses in cancer are extremely diverse, within tumors from individual patients as well as between patients with equivalent tumor types. Hence, finding clinically-relevant characteristics based on overall differences can be challenging because of inter-patient variability; differences between cancer patients can be so large that they compromise the discovery of biomarkers.
Because the number of potential phenotypes (resulting from the combination of different markers) increases exponentially with the rise in number of antibodies being measured simultaneously, computational tools for the analysis and visualization of multidimensional data have become key in this field. Traditional workflows for analyzing flow cytometry datasets by manual gating are not efficient to capture the phenotypic differences in mass cytometry and complex flow cytometry data and suffer from individual user bias. In addition, flow and mass cytometry datasets can easily contain millions of cells, illustrating the need for scalable clustering algorithms for efficient analysis. Current single-cell computational tools employed for complex flow cytometry and mass cytometry datasets include unsupervised clustering-based algorithms such as SPADE (118), Phenograph (119), and FlowSOM (120). However, these clustering-based tools do not provide single-cell resolution of the data. On the other hand, non-linear dimensionality reduction-based algorithms such as t-SNE (121) are widely used tools but limited by the number of cells that they can analyze simultaneously, resulting in down-sampled datasets and non-classified cells. Recently, a hierarchical approach of the t-SNE dimensionality-reduction-based technique, HSNE, was described to be scalable to tens of millions of cells (122, 123). In addition, a novel algorithm has recently been implemented in the single-cell analysis field as a dimensionality reduction tool, called uniform manifold approximation and projection (UMAP) (124).
Spatially-Resolved Data
Most of the multidimensional single-cell techniques such as flow cytometry, mass cytometry, and scRNA-seq require cellular dissociation to obtain cell suspensions prior to measuring the individual cells. Different dissociation methods are used, both mechanical and enzymatic, and may result in the loss of certain cell types and affect the expression of specific cell surface markers. Moreover, tissue specimens are often contaminated with blood or other tissues that are processed along with the tissue of interest. As such, not all subsets identified in single-cell data may be representative of the sample of interest. Another key limitation is the lack of information on spatial localization and cellular interactions within a tissue. Analysis of tissue sections by traditional IHC- and immunofluorescence-based methods are useful in providing spatial information (125), but are severely limited in the number of markers that can be measured simultaneously. Recent technological advances have greatly expanded the number of markers that can be captured on tissue slides. For instance, by applying the principles of secondary ion mass spectrometry to image antibodies conjugated to heavy metal isotopes in tissue sections with imaging mass cytometry (IMC) (126) and multiplexed ion beam imaging by time-of-flight (MIBI-TOF) (127). In both imaging approaches, conventional IHC workflows are used but with metal-isotope-conjugated antibodies that are detected through a time-of-flight mass spectrometer. In IMC, a pulsed laser is used to ablate a tissue section by rasterizing over a selected region of interest. The liberated antibody-bound ions are subsequently introduced into the inductively coupled plasma time-of-flight mass spectrometer. IMC can currently image up to 40 proteins with a subcellular resolution of 1 μm. The principle of MIBI-TOF is similar, but it makes use of a time-of-flight mass spectrometer equipped with a duoplasmatron primary oxygen ion beam rather than a laser. It currently enables simultaneous imaging of 36 proteins at resolutions down to 260 nm (128). Both techniques are, however, low-throughput due to the relatively long imaging time of 2 h per field of 1 mm2 in IMC and 1 h 12 min per field of 1 mm2 in MIBI-TOF (129). IMC has been applied to study tumor heterogeneity in several types of cancers, such as pancreatic cancer (130), biliary tract cancer (131), breast cancer (126, 132, 133), and colorectal cancer (108, 134). MIBI-TOF has been used to study the tumor-immune microenvironment of breast cancer (127, 128, 135, 136) and the metabolic state of T cells in colorectal cancer (109). These spatially-resolved, single-cell analyses have great potential to characterize the spatial inter- and intratumoral phenotypic heterogeneity, which can guide cancer diagnosis, prognosis and the selection of treatment. A recent study was able to extend IMC data by integration with genomic characterization of breast tumors and could, in this way, investigate the effect of genomic alterations on multidimensional tumor phenotypes of breast cancer (137).
Other multiplexed imaging techniques such as the Digital Spatial Profiling (DSP) system from NanoString and co-detection by indexing (CODEX) make use of DNA oligonucleotides. In DSP, antibodies or probes are tagged with unique ultraviolet-photocleavable DNA oligos that are released after ultraviolet exposure in specific ROIs and quantified (138). It enables simultaneous detection of up to 40 proteins or over 90 RNA targets from a tissue section and theoretically allows unlimited multiplexing using the NGS readout, but is time-consuming, does not allow for a reconstruction of the image, and has a lower resolution (10 μm) (129). In CODEX, antibodies conjugated to unique oligonucleotide sequences are detected in a cyclic manner by sequential primer extension with fluorescent dye-labeled nucleotides. CODEX currently allows the detection of over 50 markers with an automated fluidic setup platform including a three-color fluorescence microscope (139). Of note, throughput is limited by sequential detection of antibody binding. A disadvantage of CODEX, but also of IMC, is the lack of signal amplification which hampers the detection of lowly abundant antigens. A novel imaging technique, called Immuno-SABER, overcame this limitation by implementing a signal amplification step using primer exchange reactions. Immuno-SABER makes use of multiple DNA-barcoded primary antibodies that are hybridized to orthogonal single-stranded DNA concatemers, generated via primer exchange reactions (140). These primer exchange reactions allow multiplexed signal amplification with rapid exchange cycles of fluorophore-bearing imager strands. The Nanostring DSP platform has been used to study the tumor microenvironment and the outcome of various clinical trials of combination therapy for melanoma (141–144), interactions between macrophages and lymphocytes in metastatic uveal melanoma (145), immune cell subsets in lung cancer (129, 143), and tumor microenvironments of different metastases in prostate cancer (146). CODEX has been applied to study the immune tumor microenvironment of colorectal cancer patients with 56 protein markers simultaneously (147).
These multiplexed imaging techniques can be applied to snap-frozen as well as FFPE samples that are usually stored in clinical repositories. However, they raise new analysis challenges such as the visualization of 40 markers simultaneously, the image segmentation for cell determination, and algorithms for image-based expression profiles. To understand the tissue architecture, it is necessary to have prior knowledge on which cell types can be present and what their physical relationship to one another could be. Several computational approaches have been developed to enable data analysis of spatially-resolved multiplexed tissue measurements including HistoCAT (148) and ImaCytE (149). These approaches apply cell segmentation masks [using a combination of Ilastik (150) and CellProfiler (151)] to extract single-cell data from each image, which allow for deep characterization using multidimensional reduction tools such as t-SNE combined with the assessment of spatial localization and cellular interactions. In addition to cell-based analysis such imaging technologies also allow the employment of pixel-based analysis that do not depend on cell segmentation.
Integration of single cell transcriptome profiles with their spatial position in tissue context can be achieved by labeling of DNA, RNA, or probes using in situ hybridization (ISH). Traditional ISH techniques have been improved to allow the detection of single molecules, named single-molecule fluorescence ISH (smFISH) that can be used to quantitate RNA transcripts at single-cell resolution within a tissue context (152, 153). However, only a small number of genes can be measured simultaneously and a main limitation is the lack of cellular resolution to hundreds of micrometers. To improve the throughput, several highly multiplex methods of in situ RNA visualization have been developed such as osmFISH (154), sequential FISH [seqFISH (155) and seqFISH+ (156)] and error-robust FISH [MERFISH (157)]. These allow the subcellular detection of 100–10,000 transcripts simultaneously in single cells in situ by using sequential rounds of hybridization with temporal barcodes for each transcript, but require a high number of probes and are time-consuming. Furthermore, ISH can suffer from probe-specific noise due to sequence specificity and background binding. Another approach which may be more applicable for tumors is in situ RNA sequencing on tissue sections. STARmap (158) and FISSEQ (159) can profile a few hundreds to thousands of transcripts by using enzymatic amplification methods, but at lower resolution and sensitivity compared to seqFISH and MERFISH. Spatial Transcriptomics (160) and Slide-seq (161) can profile whole transcriptomes by using spatially barcoded oligo-dT microarrays. The spatial transcriptomics method has been used to study and visualize the distribution of mRNAs within tissue sections of breast cancer (160, 162), metastatic melanoma (56, 163), prostate cancer (164), and pancreatic cancer (165). These studies highlight the potential of gene expression profiling of cancer tissue sections to reveal the complex transcriptional landscape in its spatial context to gain insight into tumor progression and therapy outcome.
Integration of Transcriptomic, (EPI)Genomic, Proteomic, and Spatially-Resolved Single-Cell Data
Traditionally, each type of single-cell data has been considered independently to investigate a biological system. However, cancer is a spatially-organized system composed of many distinct cell types (Figure 2A). These different cell types including immune cells, stromal cells, and malignant cells can be visualized and investigated in an interactive manner (Figure 2B). By applying multi-omics to individual cells in the cancer microenvironment, the molecular landscape of every cell (44) can be defined with its proteome (proteins), transcriptome (RNA sequence), genome (DNA sequence), epigenome (DNA methylation, chromatin accessibility), and spatial localization (x, y, z-coordinates) (Figure 2C). Integrating these different molecular layers for each cell will allow a detailed profiling of cancer as a complex biological system (Figure 2D). Data integration approaches have classically been categorized in three groups: early (concatenation-based), intermediate (transformation-based), and late (model-based) stage integration (166). Early or intermediate stage integration approaches are more powerful than late stage integration since they can capture interactions between different molecular data-types. However, such approaches are also more challenging methodologically given the different data distributions across data types.
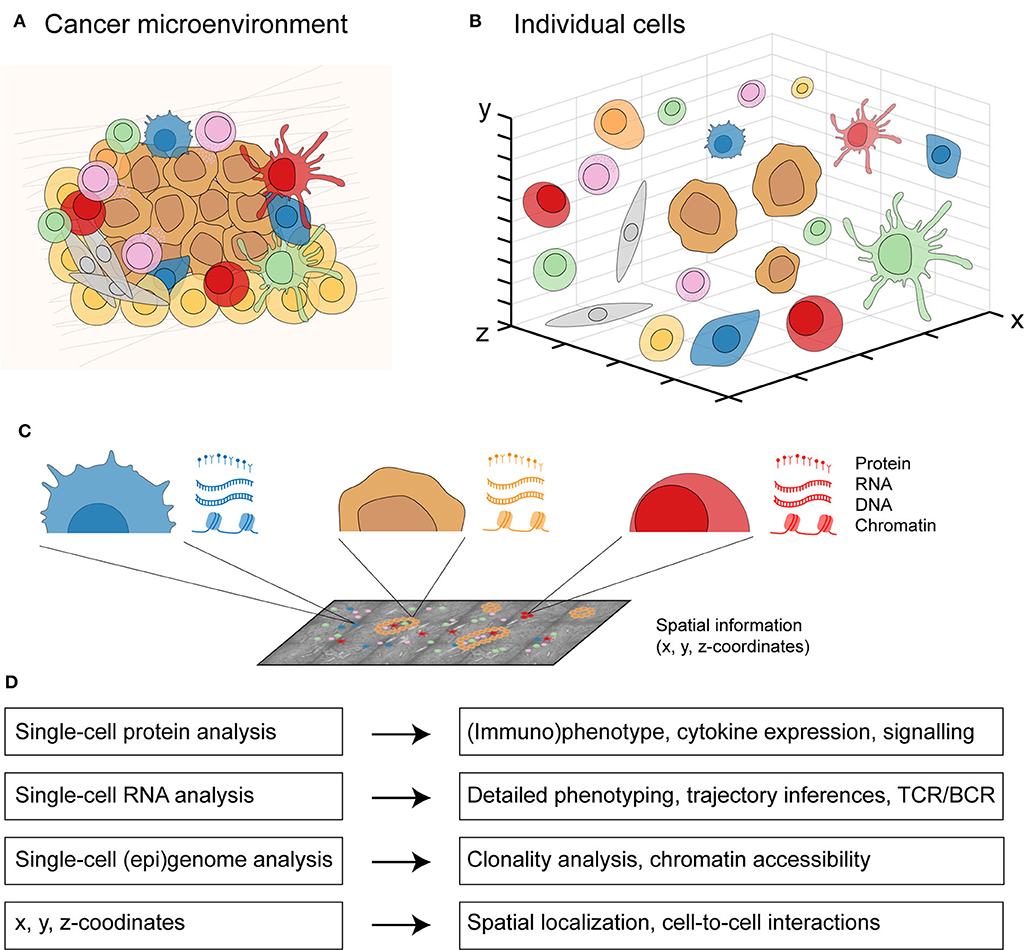
Figure 2. An integrated multicellular model of cancer. (A) From cells in a spatially-organized cancer microenvironment to (B) a three-dimensional view of individual cells. (C) From each individual cell in the cancer microenvironment, protein expression can be measured by single-cell protein analysis, RNA expression by single-cell RNA analysis, DNA and chromatin expression by single-cell (epi)genome analysis, and the x, y, z-coordinates with spatially-resolved analysis. (D) Integrating all four molecular layers for each cell will allow a detailed profiling from individual cell-to-cell interactions to whole tissue context.
A number of studies have used complementary forms of multidimensional analysis on the same sample type in the context of cancer. We have performed a search strategy in PubMed, Web of Science, and Embase databases to find studies that have used mass cytometry in concert with scRNA-seq in the context of human cancer (Supplementary Table 1). An overview of the eight relevant studies that applied mass cytometry together with scRNA-seq to study human cancer and their integration stage is shown in Table 1. In addition, we performed a search strategy in PubMed, Web of Science, and Embase databases on studies that applied single-cell mass cytometry in concert with spatially-resolved data obtained by IMC or MIBI-TOF in human cancer (Supplementary Table 1). An overview of the two relevant studies and their integration stage is shown in Table 2. Notably, all different multidimensional datasets in these studies were analyzed separately and follow a late (model-based) stage integration. Only Goveia and colleagues applied an integration of clustered mass cytometry and scRNA-seq data (107). They merged scaled average gene expression data for each scRNA-seq cluster with scaled average protein expression data for each CyTOF cluster, an approach based on a recently described method from Giordani et al. (167). As they integrated the data only after clustering each modality separately, it is still considered late stage integration.
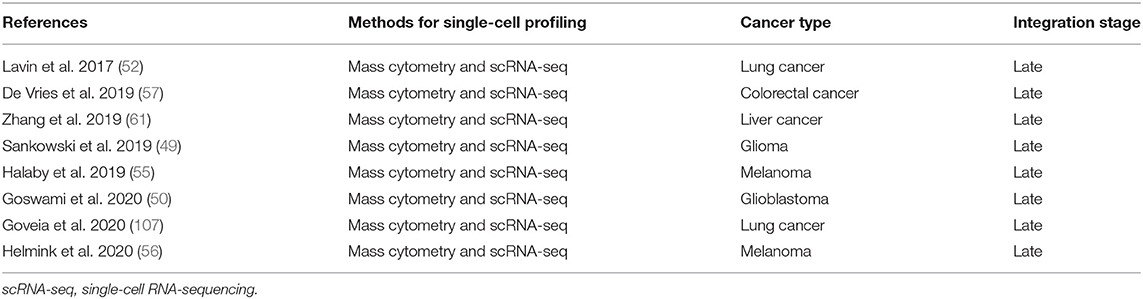
Table 1. Overview of studies applying mass cytometry together with single-cell RNA-sequencing to study human cancer heterogeneity.
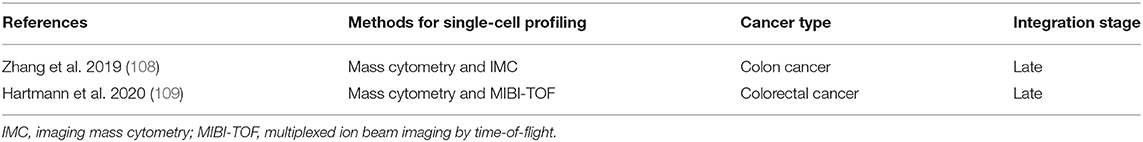
Table 2. Overview of studies applying mass cytometry together with imaging mass cytometry or MIBI-TOF to study human cancer heterogeneity.
Integrating multiple single-cell datasets is a challenging task because of the inherently high levels of noise and the large amount of missing data. Furthermore, the ever-expanding scale of single-cell experiments to millions of cells poses additional challenges. Several methods have been proposed to integrate multimodal single-cell data. State-of-the-art methods focus on embedding both spatial and standard datasets into a latent space using dimensionality reduction, such as Seurat (16), LIGER (17), and Harmony (168), or by employing factor analysis, such as MOFA (169), MOFA+ (170), scMerge (171), and scCoGAPS (172). In addition, a recent study introduced gimVI as a model for integrating spatial transcriptomics data with scRNA-seq data to impute missing gene expression measurements (15). Of note, most of the methods so far follow an intermediate or late integration approach (166). As such, these methods overcome challenges due to the different data distributions across data types, but they are less powerful in capturing interactions between different molecular data types.
Several methodologies have been developed to simultaneously acquire multiple measurements from the same cell (Box 1). Although obtaining simultaneous measurements from the same cell is becoming more feasible, it is still more common to perform subsequent measurements from the same sample (different sets of cells). Integrating spatial-based assays with mRNA or protein expression measurements can be beneficial for several reasons. For instance, spatial measurements are often limited in terms of the number of features they can assess simultaneously, although the latest generations of MERFISH and seqFISH(+) can measure around 10,000 transcripts per cell. By integrating these imaging techniques with scRNA-seq, the amount of biologically-relevant information can be enhanced. Moncada et al. presented an integration of scRNA-seq with the spatial transcriptomics method generated from the same sample to study pancreatic cancer (165). A clear challenge when integrating spatial protein (e.g., IMC, MIBI-TOF, CODEX) with scRNA-seq data is the need to model relationships between mRNA and protein expression levels, thus adding an extra layer of complexity. The advent of CITE-seq, combining antibody-based detection of protein markers with transcriptome profiling, could be used to bridge this gap since it allows simultaneous measurement of both mRNA and surface protein marker expression. We foresee an important role for CITE-seq data in the integration of IMC, MIBI-TOF, and CODEX spatial data with scRNA-seq data. Recently, the integration of CITE-seq with CODEX as well as with IMC has been pioneered by Govek et al. (173).
Box 1. Methods for the integration of transcriptomic, (epi)genomic, and proteomic single-cell data.
The analysis of protein expression has been extended to include transcript measurements at the single-cell level. CITE-seq (69), REAP-seq (70), and PLAYR (180) can be used to detect mRNA and protein levels simultaneously in single-cells. In CITE-seq and REAP-seq, oligonucleotide-labeled antibodies are used to integrate cellular protein and transcriptome measurements. In PLAYR, mass spectrometry is used to simultaneously analyze the transcriptome and protein expression levels. The analysis of mRNA expression and methylation status in single cells can be achieved by scM&Tseq (181). In addition, mRNA expression and chromatin accessibility of single cells can be analyzed by sci-CAR (182), SNARE-seq (183), and Paired-seq (184). Chromatin organization and DNA methylation from a single nucleus can jointly be profiled by snm3C-seq (185). DR-seq (186) and G&T-seq (187) can assay genomic DNA and mRNA expression simultaneously in single cells, allowing correlations between genomic aberrations and transcriptional levels. Moreover, recent studies have reported on the development of single-cell triple-omics sequencing techniques, such as scTrio-seq (188) and scNMT-seq (189). In scTrio-seq, the transcriptome, genome, and DNA methylome of individual cells are jointly captured. Lastly, scNMT-seq jointly profiles transcription, DNA methylation, and chromatin accessibility, allowing for a thorough investigation of different epigenomic layers with transcriptional status.
Potential Avenues of How the Integrated Data Will Help to Shed Light on the Complex Role of the Microenvironment in Cancer
Cancer heterogeneity has long been recognized as a factor complicating the study and treatment of cancer but, until recently, it was difficult to account for in cancer research. The advent of multidimensional single-cell technologies has shed light on the tremendous cellular diversity that exists in cancer tissues and heterogeneity across patients. Moving forward, it will be important to work on the integration of available (spectral) flow cytometry, mass cytometry, scRNA-seq, and spatially-resolved datasets to investigate commonalities and differences in cellular landscapes between cancer tissues. Multiple flow and mass cytometry datasets can be matched if they include a shared marker set between panels, thereby extending the number of markers per cell and allowing meta-analysis of different mass cytometry datasets with a common core of markers (174). In addition, cell-type references from different single-cell datasets can improve the functional characterization of cells (175). Such a system-wide approach will improve insights into how different components of the cancer microenvironment interact in a tissue context. This requires an extensive collaboration between multi-disciplinary research fields such as oncology, immunology, pathology, and bioinformatics.
Nevertheless, the development and widespread use of innovative methodologies also implies the development of analytical tools for the interpretation of complex datasets and their standardization across laboratories. Furthermore, systems-level analyses challenge a researcher's capacity to reconnect findings to their biological relevance. Studies should focus on the removal of unwanted variation and experimental noise in high-throughput single-cell technologies as well as the development of cell-type references, such as the Human Cell Atlas (176) and the Allen Brain Atlas (177) principles. We need to further develop algorithms to integrate data from different imaging and non-imaging single-cell technologies. Alternatively, technological developments should allow the acquisition of molecular profiles from single cells without the need of dissociating them from their tissue context. Lastly, it would be of great value to correlate multi-omics techniques with cell-to-cell signaling networks such as CellPhoneDB (178) and NicheNet (179). We expect that this integrated and comprehensive data can be used to create a multicellular model of cancer, from single cells to its tissue context, to understand and exploit cancer heterogeneity for improved precision medicine for cancer patients.
How will such system-wide approaches contribute toward more effective therapies for the treatment of cancer? With the advent of targeted therapy and immunotherapy, remarkable advances have been made that changed the management of oncologic treatment for a significant number of patients. However, still only a minority of cancer patients benefit from these therapies, and resistance to treatment remains a major complication in the clinical management of advanced cancer patients. Integrated multi-omics data can help to improve our understanding of the variability in treatment response and resistance mechanisms. By linking detailed molecular and immunological profiles of cells in the cancer microenvironment with sensitivity to specific therapies, potential targets for cancer treatments and associated biomarkers can be identified. This would also support a rational selection of patients that are most likely to benefit from specific treatments. Furthermore, integrated multi-omics data has the potential to guide the development of alternative therapies, for instance through the identification of resistance mechanisms. We expect that such system-wide approaches, with technologies that include spatial information, will become standard methodologies in cancer research in the coming years.
Author Contributions
NV and AM performed the bibliographic research for the manuscript and designed the figures. NV, AM, FK, and NM jointly wrote the manuscript. All authors contributed to the article and approved the submitted version.
Funding
The authors acknowledge funding from the European Commission under a MSCA-ITN award (675743: ISPIC), the KWF Bas Mulder Award UL (2015-7664), the ZonMw Veni grant (916171144), and the European Research Council (ERC) under the European Union's Horizon 2020 Research and Innovation Programme (grant agreement no. 852832).
Conflict of Interest
The authors declare that the research was conducted in the absence of any commercial or financial relationships that could be construed as a potential conflict of interest. The handling editor declared a past co-authorship with one of the authors NM.
Acknowledgments
We thank J.W. Schoones from Walaeus library of Leiden University Medical Center for his help with developing the literature search strategies and M.E. Ijsselsteijn from the Department of Pathology of Leiden University Medical Center for providing imaging mass cytometry images of colorectal cancer.
Supplementary Material
The Supplementary Material for this article can be found online at: https://www.frontiersin.org/articles/10.3389/fonc.2020.01254/full#supplementary-material
References
2. Hanahan D, Weinberg RA. Hallmarks of cancer: the next generation. Cell. (2011) 144:646–74. doi: 10.1016/j.cell.2011.02.013
3. Schreiber RD, Old LJ, Smyth MJ. Cancer immunoediting: integrating immunity's roles in cancer suppression and promotion. Science. (2011) 331:1565–70. doi: 10.1126/science.1203486
4. Vladoiu MC, El-Hamamy I, Donovan LK, Farooq H, Holgado BL, Sundaravadanam Y, et al. Childhood cerebellar tumours mirror conserved fetal transcriptional programs. Nature. (2019) 572:67–73. doi: 10.1038/s41586-019-1158-7
5. Tirosh I, Venteicher AS, Hebert C, Escalante LE, Patel AP, Yizhak K, et al. Single-cell RNA-seq supports a developmental hierarchy in human oligodendroglioma. Nature. (2016) 539:309–13. doi: 10.1038/nature20123
6. Fridman WH, Pages F, Sautes-Fridman C, Galon J. The immune contexture in human tumours: impact on clinical outcome. Nat Rev Cancer. (2012) 12:298–306. doi: 10.1038/nrc3245
7. Binnewies M, Roberts EW, Kersten K, Chan V, Fearon DF, Merad M, et al. Understanding the tumor immune microenvironment (TIME) for effective therapy. Nat Med. (2018) 24:541–50. doi: 10.1038/s41591-018-0014-x
8. Fridman WH, Zitvogel L, Sautes-Fridman C, Kroemer G. The immune contexture in cancer prognosis and treatment. Nat Rev Clin Oncol. (2017) 14:717–34. doi: 10.1038/nrclinonc.2017.101
9. Angelova M, Mlecnik B, Vasaturo A, Bindea G, Fredriksen T, Lafontaine L, et al. Evolution of metastases in space and time under immune selection. Cell. (2018) 175:751–65.e16. doi: 10.1016/j.cell.2018.09.018
10. Paget S. The distribution of secondary growths in cancer of the breast. Lancet. (1889) 133:571–3. doi: 10.1016/S0140-6736(00)49915-0
11. Qian X, Harris KD, Hauling T, Nicoloutsopoulos D, Muñoz-Manchado AB, Skene N, et al. Probabilistic cell typing enables fine mapping of closely related cell types in situ. Nat Methods. (2019) 17:101–6. doi: 10.1038/s41592-019-0631-4
12. Satija R, Farrell JA, Gennert D, Schier AF, Regev A. Spatial reconstruction of single-cell gene expression data. Nat Biotechnol. (2015) 33:495–502. doi: 10.1038/nbt.3192
13. Achim K, Pettit J-B, Saraiva LR, Gavriouchkina D, Larsson T, Arendt D, et al. High-throughput spatial mapping of single-cell RNA-seq data to tissue of origin. Nat Biotechnol. (2015) 33:503–9. doi: 10.1038/nbt.3209
14. Nitzan M, Karaiskos N, Friedman N, Rajewsky N. Gene expression cartography. Nature. (2019) 576:132–7. doi: 10.1038/s41586-019-1773-3
15. Lopez R, Nazaret A, Langevin M, Samaran J, Regier J, Jordan MI, et al. A joint model of unpaired data from scRNA-seq and spatial transcriptomics for imputing missing gene expression measurements. arXiv. (2019). arXiv:1905.02269.
16. Stuart T, Butler A, Hoffman P, Hafemeister C, Papalexi E, Mauck WM, et al. Comprehensive integration of single-cell data. Cell. (2019) 177:1888–902.e21. doi: 10.1016/j.cell.2019.05.031
17. Welch JD, Kozareva V, Ferreira A, Vanderburg C, Martin C, Macosko EZ. Single-cell multi-omic integration compares and contrasts features of brain cell identity. Cell. (2019) 177:1873–87.e17. doi: 10.1016/j.cell.2019.05.006
18. Newman AM, Liu CL, Green MR, Gentles AJ, Feng W, Xu Y, et al. Robust enumeration of cell subsets from tissue expression profiles. Nat Methods. (2015) 12:453–7. doi: 10.1038/nmeth.3337
19. Finotello F, Mayer C, Plattner C, Laschober G, Rieder D, Hackl H, et al. Molecular and pharmacological modulators of the tumor immune contexture revealed by deconvolution of RNA-seq data. Genome Med. (2019) 11:34. doi: 10.1186/s13073-019-0655-5
20. Gerlinger M, Rowan AJ, Horswell S, Math M, Larkin J, Endesfelder D, et al. Intratumor heterogeneity and branched evolution revealed by multiregion sequencing. N Engl J Med. (2012) 366:883–92. doi: 10.1056/NEJMoa1113205
21. Thorsson V, Gibbs DL, Brown SD, Wolf D, Bortone DS, Ou Yang TH, et al. The immune landscape of cancer. Immunity. (2018) 48:812–30.e14. doi: 10.1016/j.immuni.2018.03.023
22. Dean FB, Nelson JR, Giesler TL, Lasken RS. Rapid amplification of plasmid and phage DNA using Phi 29 DNA polymerase and multiply-primed rolling circle amplification. Genome Res. (2001) 11:1095–9. doi: 10.1101/gr.180501
23. Zong C, Lu S, Chapman AR, Xie XS. Genome-wide detection of single-nucleotide and copy-number variations of a single human cell. Science. (2012) 338:1622–6. doi: 10.1126/science.1229164
24. Telenius H, Carter NP, Bebb CE, Nordenskjöld M, Ponder BA, Tunnacliffe A. Degenerate oligonucleotide-primed PCR: general amplification of target DNA by a single degenerate primer. Genomics. (1992) 13:718–25. doi: 10.1016/0888-7543(92)90147-K
25. Navin N, Kendall J, Troge J, Andrews P, Rodgers L, McIndoo J, et al. Tumour evolution inferred by single-cell sequencing. Nature. (2011) 472:90–4. doi: 10.1038/nature09807
26. Xu X, Hou Y, Yin X, Bao L, Tang A, Song L, et al. Single-cell exome sequencing reveals single-nucleotide mutation characteristics of a kidney tumor. Cell. (2012) 148:886–95. doi: 10.1016/j.cell.2012.02.025
27. Francis JM, Zhang C-Z, Maire CL, Jung J, Manzo VE, Adalsteinsson VA, et al. EGFR variant heterogeneity in glioblastoma resolved through single-nucleus sequencing. Cancer Discov. (2014) 4:956–71. doi: 10.1158/2159-8290.CD-13-0879
28. Gawad C, Koh W, Quake SR. Dissecting the clonal origins of childhood acute lymphoblastic leukemia by single-cell genomics. Proc Natl Acad Sci USA. (2014) 111:17947–52. doi: 10.1073/pnas.1420822111
29. Casasent AK, Schalck A, Gao R, Sei E, Long A, Pangburn W, et al. Multiclonal invasion in breast tumors identified by topographic single cell sequencing. Cell. (2018) 172:205–17.e12. doi: 10.1016/j.cell.2017.12.007
30. Yu C, Yu J, Yao X, Wu WKK, Lu Y, Tang S, et al. Discovery of biclonal origin and a novel oncogene SLC12A5 in colon cancer by single-cell sequencing. Cell Res. (2014) 24:701–12. doi: 10.1038/cr.2014.43
31. Hughes AEO, Magrini V, Demeter R, Miller CA, Fulton R, Fulton LL, et al. Clonal architecture of secondary acute myeloid leukemia defined by single-cell sequencing. PLoS Genet. (2014) 10:e1004462. doi: 10.1371/journal.pgen.1004462
32. Jan M, Snyder TM, Corces-Zimmerman MR, Vyas P, Weissman IL, Quake SR, et al. Clonal evolution of preleukemic hematopoietic stem cells precedes human acute myeloid leukemia. Sci Transl Med. (2012) 4:149ra18. doi: 10.1126/scitranslmed.3004315
33. Leung ML, Davis A, Gao R, Casasent A, Wang Y, Sei E, et al. Single-cell DNA sequencing reveals a late-dissemination model in metastatic colorectal cancer. Genome Res. (2017) 27:1287–99. doi: 10.1101/gr.209973.116
34. Heitzer E, Auer M, Gasch C, Pichler M, Ulz P, Hoffmann EM, et al. Complex tumor genomes inferred from single circulating tumor cells by array-CGH and next-generation sequencing. Cancer Res. (2013) 73:2965–75. doi: 10.1158/0008-5472.CAN-12-4140
35. Lohr JG, Adalsteinsson VA, Cibulskis K, Choudhury AD, Rosenberg M, Cruz-Gordillo P, et al. Whole-exome sequencing of circulating tumor cells provides a window into metastatic prostate cancer. Nat Biotechnol. (2014) 32:479–84. doi: 10.1038/nbt.2892
36. Ni X, Zhuo M, Su Z, Duan J, Gao Y, Wang Z, et al. Reproducible copy number variation patterns among single circulating tumor cells of lung cancer patients. Proc Natl Acad Sci USA. (2013) 110:21083–8. doi: 10.1158/1538-7445.AM2014-3577
37. Wang Y, Waters J, Leung ML, Unruh A, Roh W, Shi X, et al. Clonal evolution in breast cancer revealed by single nucleus genome sequencing. Nature. (2014) 512:155–60. doi: 10.1038/nature13600
38. Suzuki A, Matsushima K, Makinoshima H, Sugano S, Kohno T, Tsuchihara K, et al. Single-cell analysis of lung adenocarcinoma cell lines reveals diverse expression patterns of individual cells invoked by a molecular target drug treatment. Genome Biol. (2015) 16:66. doi: 10.1186/s13059-015-0636-y
39. Wang Y, Navin NE. Advances and applications of single-cell sequencing technologies. Mol Cell. (2015) 58:598–609. doi: 10.1016/j.molcel.2015.05.005
40. Tang F, Barbacioru C, Wang Y, Nordman E, Lee C, Xu N, et al. mRNA-Seq whole-transcriptome analysis of a single cell. Nat Methods. (2009) 6:377–82. doi: 10.1038/nmeth.1315
41. Svensson V, Vento-Tormo R, Teichmann SA. Exponential scaling of single-cell RNA-seq in the past decade. Nat Protoc. (2018) 13:599–604. doi: 10.1038/nprot.2017.149
42. Genomics X. 10X Genomics Single Cell Gene Expression Datasets. (2017). Available online at: https://support.10xgenomics.com/single-cell-gene-expression/datasets (accessed February 27, 2020).
43. Hwang B, Lee JH, Bang D. Single-cell RNA sequencing technologies and bioinformatics pipelines. Exp Mol Med. (2018) 50:96. doi: 10.1038/s12276-018-0071-8
44. Wagner A, Regev A, Yosef N. Revealing the vectors of cellular identity with single-cell genomics. Nat Biotechnol. (2016) 34:1145–60. doi: 10.1038/nbt.3711
45. Ramsköld D, Luo S, Wang Y-C, Li R, Deng Q, Faridani OR. Full-length mRNA-Seq from single-cell levels of RNA and individual circulating tumor cells. Nat Biotechnol. (2012) 30:777–82. doi: 10.1038/nbt.2282
46. Miyamoto DT, Zheng Y, Wittner BS, Lee RJ, Zhu H, Broderick KT, et al. RNA-Seq of single prostate CTCs implicates noncanonical Wnt signaling in antiandrogen resistance. Science. (2015) 349:1351–6.
47. Brady SW, McQuerry JA, Qiao Y, Piccolo SR, Shrestha G, Jenkins DF, et al. Combating subclonal evolution of resistant cancer phenotypes. Nat Commun. (2017) 8:1231. doi: 10.1038/s41467-017-01174-3
48. Patel AP, Tirosh I, Trombetta JJ, Shalek AK, Gillespie SM, Wakimoto H, et al. Single-cell RNA-seq highlights intratumoral heterogeneity in primary glioblastoma. Science. (2014) 344:1396–401. doi: 10.1126/science.1254257
49. Sankowski R, Böttcher C, Masuda T, Geirsdottir L, Sagar Sindram E, et al. Mapping microglia states in the human brain through the integration of high-dimensional techniques. Nat Neurosci. (2019) 22:2098–110. doi: 10.1038/s41593-019-0532-y
50. Goswami S, Walle T, Cornish AE, Basu S, Anandhan S, Fernandez I, et al. Immune profiling of human tumors identifies CD73 as a combinatorial target in glioblastoma. Nat Med. (2020) 26:39–46. doi: 10.1038/s41591-019-0694-x
51. Kim K-T, Lee HW, Lee H-O, Song HJ, Jeong DE, Shin S, et al. Application of single-cell RNA sequencing in optimizing a combinatorial therapeutic strategy in metastatic renal cell carcinoma. Genome Biol. (2016) 17:80. doi: 10.1186/s13059-016-0945-9
52. Lavin Y, Kobayashi S, Leader A, Amir ED, Elefant N, Bigenwald C, et al. Innate immune landscape in early lung adenocarcinoma by paired single-cell analyses. Cell. (2017) 169:750–65.e17. doi: 10.1016/j.cell.2017.04.014
53. Tirosh I, Izar B, Prakadan SM, Wadsworth MH 2nd, Treacy D, Trombetta JJ, et al. Dissecting the multicellular ecosystem of metastatic melanoma by single-cell RNA-seq. Science. (2016) 352:189–96. doi: 10.1126/science.aad0501
54. Li H, van der Leun AM, Yofe I, Lubling Y, Gelbard-Solodkin D, van Vries NL, van Unen V, Ijsselsteijn ME, Abdelaal T, van der Breggen R, Farina Sarasqueta A, et al. High-dimensional cytometric analysis of colorectal cancer reveals novel mediators of antitumour immunity. Gut. (2019) 69:691–703. doi: 10.1136/gutjnl-2019-318672
55. Halaby MJ, Hezaveh K, Lamorte S, Ciudad MT, Kloetgen A, MacLeod BL, et al. GCN2 drives macrophage and MDSC function and immunosuppression in the tumor microenvironment. Sci Immunol. (2019) 4:eaax8189. doi: 10.1126/sciimmunol.aax8189
56. Helmink BA, Reddy SM, Gao J, Zhang S, Basar R, Thakur R, et al. B cells and tertiary lymphoid structures promote immunotherapy response. Nature. (2020) 577:549–55. doi: 10.1038/s41586-019-1922-8
57. de Vries NL, van Unen V, Ijsselsteijn ME, Abdelaal T, van der Breggen R, Farina Sarasqueta A, et al. High-dimensional cytometric analysis of colorectal cancer reveals novel mediators of antitumour immunity. Gut. (2019) 69:691–703. doi: 10.1136/gutjnl-2019-318672
58. Li H, Courtois ET, Sengupta D, Tan Y, Chen KH, Goh JJL, et al. Reference component analysis of single-cell transcriptomes elucidates cellular heterogeneity in human colorectal tumors. Nat Genet. (2017) 49:708–18. doi: 10.1038/ng.3818
59. Zhang Y, Zheng L, Zhang L, Hu X, Ren X, Zhang Z. Deep single-cell RNA sequencing data of individual T cells from treatment-naïve colorectal cancer patients. Sci Data. (2019) 6:131. doi: 10.1038/s41597-019-0131-5
60. Elyada E, Bolisetty M, Laise P, Flynn WF, Courtois ET, Burkhart RA, et al. Cross-species single-cell analysis of pancreatic ductal adenocarcinoma reveals antigen-presenting cancer-associated fibroblasts. Cancer Discov. (2019) 9:1102–23. doi: 10.1158/2159-8290.CD-19-0094
61. Zhang Q, Lou Y, Yang J, Wang J, Feng J, Zhao Y, et al. Integrated multiomic analysis reveals comprehensive tumour heterogeneity and novel immunophenotypic classification in hepatocellular carcinomas. Gut. (2019) 68:2019–31. doi: 10.1136/gutjnl-2019-318912
62. Puram SV, Tirosh I, Parikh AS, Patel AP, Yizhak K, Gillespie S, et al. Single-cell transcriptomic analysis of primary and metastatic tumor ecosystems in head and neck cancer. Cell. (2017) 171:1611–24.e24. doi: 10.1016/j.cell.2017.10.044
63. Giustacchini A, Thongjuea S, Barkas N, Woll PS, Povinelli BJ, Booth CAG, et al. Single-cell transcriptomics uncovers distinct molecular signatures of stem cells in chronic myeloid leukemia. Nat Med. (2017) 23:692–702. doi: 10.1038/nm.4336
64. Filbin MG, Tirosh I, Hovestadt V, Shaw ML, Escalante LE, Mathewson ND, et al. Developmental and oncogenic programs in H3K27M gliomas dissected by single-cell RNA-seq. Science. (2018) 360:331–5. doi: 10.1126/science.aao4750
65. House IG, Savas P, Lai J, Chen AXY, Oliver AJ, Teo ZL, et al. Macrophage-derived CXCL9 and CXCL10 are required for antitumor immune responses following immune checkpoint blockade. Clin Cancer Res. (2020) 26:487–504. doi: 10.1158/1078-0432.CCR-19-1868
66. Jerby-Arnon L, Shah P, Cuoco MS, Rodman C, Su MJ, Melms JC, et al. A cancer cell program promotes T cell exclusion and resistance to checkpoint blockade. Cell. (2018) 175:984–97.e24. doi: 10.1016/j.cell.2018.09.006
67. Goldstein LD, Chen YJ, Wu J, Chaudhuri S, Hsiao YC, Schneider K, et al. Massively parallel single-cell B-cell receptor sequencing enables rapid discovery of diverse antigen-reactive antibodies. Commun Biol. (2019) 2:304. doi: 10.1038/s42003-019-0551-y
68. Singh M, Al-Eryani G, Carswell S, Ferguson JM, Blackburn J, Barton K, et al. High-throughput targeted long-read single cell sequencing reveals the clonal and transcriptional landscape of lymphocytes. Nat Commun. (2019) 10:3120. doi: 10.1038/s41467-019-11049-4
69. Stoeckius M, Hafemeister C, Stephenson W, Houck-Loomis B, Chattopadhyay PK, Swerdlow H, et al. Simultaneous epitope and transcriptome measurement in single cells. Nat Methods. (2017) 14:865–8. doi: 10.1038/nmeth.4380
70. Peterson VM, Zhang KX, Kumar N, Wong J, Li L, Wilson DC, et al. Multiplexed quantification of proteins and transcripts in single cells. Nat Biotechnol. (2017) 35:936–9. doi: 10.1038/nbt.3973
71. Shahi P, Kim SC, Haliburton JR, Gartner ZJ, Abate AR. Abseq: ultrahigh-throughput single cell protein profiling with droplet microfluidic barcoding. Sci Rep. (2017) 7:44447. doi: 10.1038/srep44447
72. van den Brink SC, Sage F, Vértesy Á, Spanjaard B, Peterson-Maduro J, Baron CS, et al. Single-cell sequencing reveals dissociation-induced gene expression in tissue subpopulations. Nat Methods. (2017) 14:935–6. doi: 10.1038/nmeth.4437
73. Kiselev VY, Andrews TS, Hemberg M. Challenges in unsupervised clustering of single-cell RNA-seq data. Nat Rev Genet. (2019) 20:273–82. doi: 10.1038/s41576-018-0088-9
74. Wolf FA, Angerer P, Theis FJ. SCANPY: large-scale single-cell gene expression data analysis. Genome Biol. (2018) 19:15. doi: 10.1186/s13059-017-1382-0
75. Guo M, Wang H, Potter SS, Whitsett JA, Xu Y. SINCERA: a pipeline for single-cell RNA-seq profiling analysis. PLoS Comput Biol. (2015) 11:e1004575. doi: 10.1371/journal.pcbi.1004575
76. Buenrostro JD, Giresi PG, Zaba LC, Chang HY, Greenleaf WJ. Transposition of native chromatin for fast and sensitive epigenomic profiling of open chromatin, DNA-binding proteins and nucleosome position. Nat Methods. (2013) 10:1213–8. doi: 10.1038/nmeth.2688
77. Frommer M, McDonald LE, Millar DS, Collis CM, Watt F, Grigg GW, et al. A genomic sequencing protocol that yields a positive display of 5-methylcytosine residues in individual DNA strands. Proc Natl Acad Sci USA. (1992) 89:1827–31. doi: 10.1073/pnas.89.5.1827
78. Schmid M, Durussel T, Laemmli UK. ChIC and ChEC; genomic mapping of chromatin proteins. Mol Cell. (2004) 16:147–57. doi: 10.1016/S1097-2765(04)00540-4
79. Dekker J, Rippe K, Dekker M, Kleckner N. Capturing chromosome conformation. Science. (2002) 295:1306–11. doi: 10.1126/science.1067799
80. Mognol GP, Spreafico R, Wong V, Scott-Browne JP, Togher S, Hoffmann A, et al. Exhaustion-associated regulatory regions in CD8+ tumor-infiltrating T cells. Proc Natl Acad Sci USA. (2017) 114:E2776–e85. doi: 10.1073/pnas.1620498114
81. Philip M, Fairchild L, Sun L, Horste EL, Camara S, Shakiba M, et al. Chromatin states define tumour-specific T cell dysfunction and reprogramming. Nature. (2017) 545:452–6. doi: 10.1038/nature22367
82. Sen DR, Kaminski J, Barnitz RA, Kurachi M, Gerdemann U, Yates KB, et al. The epigenetic landscape of T cell exhaustion. Science. (2016) 354:1165–9. doi: 10.1126/science.aae0491
83. Pauken KE, Sammons MA, Odorizzi PM, Manne S, Godec J, Khan O, et al. Epigenetic stability of exhausted T cells limits durability of reinvigoration by PD-1 blockade. Science. (2016) 354:1160–5. doi: 10.1126/science.aaf2807
84. Pan D, Kobayashi A, Jiang P, Ferrari de Andrade L, Tay RE, Luoma AM, et al. A major chromatin regulator determines resistance of tumor cells to T cell-mediated killing. Science. (2018) 359:770–5. doi: 10.1126/science.aao1710
85. Miao D, Margolis CA, Gao W, Voss MH, Li W, Martini DJ, et al. Genomic correlates of response to immune checkpoint therapies in clear cell renal cell carcinoma. Science. (2018) 359:801–6. doi: 10.1126/science.aan5951
86. Deng G, Peng E, Gum J, Terdiman J, Sleisenger M, Kim YS. Methylation of hMLH1 promoter correlates with the gene silencing with a region-specific manner in colorectal cancer. Br J Cancer. (2002) 86:574–9. doi: 10.1038/sj.bjc.6600148
87. Guo H, Zhu P, Wu X, Li X, Wen L, Tang F. Single-cell methylome landscapes of mouse embryonic stem cells and early embryos analyzed using reduced representation bisulfite sequencing. Genome Res. (2013) 23:2126–35. doi: 10.1101/gr.161679.113
88. Smallwood SA, Lee HJ, Angermueller C, Krueger F, Saadeh H, Peat J, et al. Single-cell genome-wide bisulfite sequencing for assessing epigenetic heterogeneity. Nat Methods. (2014) 11:817–20. doi: 10.1038/nmeth.3035
89. Farlik M, Sheffield NC, Nuzzo A, Datlinger P, Schönegger A, Klughammer J, et al. Single-cell DNA methylome sequencing and bioinformatic inference of epigenomic cell-state dynamics. Cell Rep. (2015) 10:1386–97. doi: 10.1016/j.celrep.2015.02.001
90. Buenrostro JD, Wu B, Litzenburger UM, Ruff D, Gonzales ML, Snyder MP, et al. Single-cell chromatin accessibility reveals principles of regulatory variation. Nature. (2015) 523:486–90. doi: 10.1038/nature14590
91. Nagano T, Lubling Y, Stevens TJ, Schoenfelder S, Yaffe E, Dean W, et al. Single-cell Hi-C reveals cell-to-cell variability in chromosome structure. Nature. (2013) 502:59–64. doi: 10.1038/nature12593
92. Ku WL, Nakamura K, Gao W, Cui K, Hu G, Tang Q, et al. Single-cell chromatin immunocleavage sequencing (scChIC-seq) to profile histone modification. Nat Methods. (2019) 16:323–5. doi: 10.1038/s41592-019-0361-7
93. Satpathy AT, Granja JM, Yost KE, Qi Y, Meschi F, McDermott GP, et al. Massively parallel single-cell chromatin landscapes of human immune cell development and intratumoral T cell exhaustion. Nat Biotechnol. (2019) 37:925–36. doi: 10.1038/s41587-019-0206-z
94. Cheung P, Vallania F, Warsinske HC, Donato M, Schaffert S, Chang SE, et al. Single-cell chromatin modification profiling reveals increased epigenetic variations with aging. Cell. (2018) 173:1385–97.e14. doi: 10.1016/j.cell.2018.03.079
95. Granja JM, Klemm S, McGinnis LM, Kathiria AS, Mezger A, Corces MR, et al. Single-cell multiomic analysis identifies regulatory programs in mixed-phenotype acute leukemia. Nat Biotechnol. (2019) 37:1458–65. doi: 10.1038/s41587-019-0332-7
96. Lo PK, Zhou Q. Emerging techniques in single-cell epigenomics and their applications to cancer research. J Clin Genom. (2018) 1. doi: 10.4172/jcg.1000103
97. Clark SJ, Lee HJ, Smallwood SA, Kelsey G, Reik W. Single-cell epigenomics: powerful new methods for understanding gene regulation and cell identity. Genome Biol. (2016) 17:72. doi: 10.1186/s13059-016-0944-x
98. Futamura K, Sekino M, Hata A, Ikebuchi R, Nakanishi Y, Egawa G, et al. Novel full-spectral flow cytometry with multiple spectrally-adjacent fluorescent proteins and fluorochromes and visualization of in vivo cellular movement. Cytometry A. (2015) 87:830–42. doi: 10.1002/cyto.a.22725
99. Irish JM, Doxie DB. High-dimensional single-cell cancer biology. Curr Top Microbiol Immunol. (2014) 377:1–21. doi: 10.1007/82_2014_367
100. Bandura DR, Baranov VI, Ornatsky OI, Antonov A, Kinach R, Lou X, et al. Mass cytometry: technique for real time single cell multitarget immunoassay based on inductively coupled plasma time-of-flight mass spectrometry. Anal Chem. (2009) 81:6813–22. doi: 10.1021/ac901049w
101. Wagner J, Rapsomaniki MA, Chevrier S, Anzeneder T, Langwieder C, Dykgers A, et al. A single-cell atlas of the tumor and immune ecosystem of human breast cancer. Cell. (2019) 177:1330–45.e18. doi: 10.1016/j.cell.2019.03.005
102. Chevrier S, Levine JH, Zanotelli VRT, Silina K, Schulz D, Bacac M, et al. An immune atlas of clear cell renal cell carcinoma. Cell. (2017) 169:736–49.e18. doi: 10.1016/j.cell.2017.04.016
103. Wei SC, Levine JH, Cogdill AP, Zhao Y, Anang N-AAS, Andrews MC, et al. Distinct cellular mechanisms underlie anti-CTLA-4 and anti-PD-1 checkpoint blockade. Cell. (2017) 170:1120–33.e17. doi: 10.1016/j.cell.2017.07.024
104. Krieg C, Nowicka M, Guglietta S, Schindler S, Hartmann FJ, Weber LM, et al. High-dimensional single-cell analysis predicts response to anti-PD-1 immunotherapy. Nat Med. (2018) 24:144–53. doi: 10.1038/nm.4466
105. Spitzer MH, Carmi Y, Reticker-Flynn NE, Kwek SS, Madhireddy D, Martins MM, et al. Systemic immunity is required for effective cancer immunotherapy. Cell. (2017) 168:487–502.e15. doi: 10.1016/j.cell.2016.12.022
106. Simoni Y, Becht E, Fehlings M, Loh CY, Koo SL, Teng KWW, et al. Bystander CD8+ T cells are abundant and phenotypically distinct in human tumour infiltrates. Nature. (2018) 557:575–9. doi: 10.1038/s41586-018-0130-2
107. Goveia J, Rohlenova K, Taverna F, Treps L, Conradi L-C, Pircher A, et al. An integrated gene expression landscape profiling approach to identify lung tumor endothelial cell heterogeneity and angiogenic candidates. Cancer Cell. (2020) 37:21–36.e13. doi: 10.1016/j.ccell.2019.12.001
108. Zhang T, Lv J, Tan Z, Wang B, Warden AR, Li Y, et al. Immunocyte profiling using single-cell mass cytometry reveals EpCAM+ CD4+ T cells abnormal in colon cancer. Front Immunol. (2019) 10:1571. doi: 10.3389/fimmu.2019.01571
109. Hartmann FJ, Mrdjen D, McCaffrey E, Glass DR, Greenwald NF, Bharadwaj A, et al. Multiplexed single-cell metabolic profiles organize the spectrum of cytotoxic human T cells. bioRxiv. (2020). doi: 10.1101/2020.01.17.909796
110. Chew V, Lai L, Pan L, Lim CJ, Li J, Ong R, et al. Delineation of an immunosuppressive gradient in hepatocellular carcinoma using high-dimensional proteomic and transcriptomic analyses. Proc Natl Acad Sci USA. (2017) 114:E5900–9. doi: 10.1073/pnas.1706559114
111. Gonzalez VD, Samusik N, Chen TJ, Savig ES, Aghaeepour N, Quigley DA, et al. Commonly occurring cell subsets in high-grade serous ovarian tumors identified by single-cell mass cytometry. Cell Rep. (2018) 22:1875–88. doi: 10.1016/j.celrep.2018.01.053
112. Baughn LB, Sachs Z, Noble-Orcutt KE, Mitra A, Van Ness BG, Linden MA. Phenotypic and functional characterization of a bortezomib-resistant multiple myeloma cell line by flow and mass cytometry. Leuk Lymphoma. (2017) 58:1931–40. doi: 10.1080/10428194.2016.1266621
113. Hansmann L, Blum L, Ju C-H, Liedtke M, Robinson WH, Davis MM. Mass cytometry analysis shows that a novel memory phenotype B cell is expanded in multiple myeloma. Cancer Immunol Res. (2015) 3:650–60. doi: 10.1158/2326-6066.CIR-14-0236-T
114. Adams HC 3rd, Stevenaert F, Krejcik J, Van der Borght K, Smets T, Bald J, et al. High-parameter mass cytometry evaluation of relapsed/refractory multiple myeloma patients treated with daratumumab demonstrates immune modulation as a novel mechanism of action. Cytometry A. (2019) 95:279–89. doi: 10.1002/cyto.a.23693
115. Marsh-Wakefield F, Kruzins A, McGuire HM, Yang S, Bryant C, Fazekas de St, Groth B, et al. Mass cytometry discovers two discrete subsets of CD39−Treg which discriminate MGUS from multiple myeloma. Front Immunol. (2019) 10:1596. doi: 10.3389/fimmu.2019.01596
116. Marin-Acevedo JA, Dholaria B, Soyano AE, Knutson KL, Chumsri S, Lou Y. Next generation of immune checkpoint therapy in cancer: new developments and challenges. J Hematol Oncol. (2018) 11:39. doi: 10.1186/s13045-018-0582-8
117. Bodenmiller B, Zunder ER, Finck R, Chen TJ, Savig ES, Bruggner RV, et al. Multiplexed mass cytometry profiling of cellular states perturbed by small-molecule regulators. Nat Biotechnol. (2012) 30:858–67. doi: 10.1038/nbt.2317
118. Qiu P, Simonds EF, Bendall SC, Gibbs KD Jr, Bruggner RV, et al. Extracting a cellular hierarchy from high-dimensional cytometry data with SPADE. Nat Biotechnol. (2011) 29:886–91. doi: 10.1038/nbt.1991
119. Levine JH, Simonds EF, Bendall SC, Davis KL, Amir el AD, Tadmor MD, et al. Data-driven phenotypic dissection of AML reveals progenitor-like cells that correlate with prognosis. Cell. (2015) 162:184–97. doi: 10.1016/j.cell.2015.05.047
120. Van Gassen S, Callebaut B, Van Helden MJ, Lambrecht BN, Demeester P, Dhaene T, et al. FlowSOM: using self-organizing maps for visualization and interpretation of cytometry data. Cytometry A. (2015) 87:636–45. doi: 10.1002/cyto.a.22625
121. van der Maaten LJP, Hinton GE. Visualizing high-dimensional data using t-SNE. J Mach Learn Res. (2008) 9:2579–605.
122. Pezzotti N, Höllt T, Lelieveldt B, Eisemann E, Vilanova A. Hierarchical stochastic neighbor embedding. Comput Graph Forum. (2016) 35:21–30. doi: 10.1111/cgf.12878
123. van Unen V, Hollt T, Pezzotti N, Li N, Reinders MJT, Eisemann E, et al. Visual analysis of mass cytometry data by hierarchical stochastic neighbour embedding reveals rare cell types. Nat Commun. (2017) 8:1740. doi: 10.1038/s41467-017-01689-9
124. Becht E, McInnes L, Healy J, Dutertre C-A, Kwok IWH, Ng LG, et al. Dimensionality reduction for visualizing single-cell data using UMAP. Nat Biotechnol. (2018). doi: 10.1038/nbt.4314. [Epub ahead of print].
125. Ijsselsteijn ME, Brouwer TP, Abdulrahman Z, Reidy E, Ramalheiro A, Heeren AM, et al. Cancer immunophenotyping by seven-colour multispectral imaging without tyramide signal amplification. J Pathol Clin Res. (2019) 5:3–11. doi: 10.1002/cjp2.113
126. Giesen C, Wang HA, Schapiro D, Zivanovic N, Jacobs A, Hattendorf B, et al. Highly multiplexed imaging of tumor tissues with subcellular resolution by mass cytometry. Nat Methods. (2014) 11:417–22. doi: 10.1038/nmeth.2869
127. Angelo M, Bendall SC, Finck R, Hale MB, Hitzman C, Borowsky AD, et al. Multiplexed ion beam imaging of human breast tumors. Nat Med. (2014) 20:436–42. doi: 10.1038/nm.3488
128. Keren L, Bosse M, Thompson S, Risom T, Vijayaragavan K, McCaffrey E, et al. MIBI-TOF: a multiplexed imaging platform relates cellular phenotypes and tissue structure. Sci Adv. (2019) 5:eaax5851. doi: 10.1126/sciadv.aax5851
129. Decalf J, Albert ML, Ziai J. New tools for pathology: a user's review of a highly multiplexed method for in situ analysis of protein and RNA expression in tissue. J Pathol. (2019) 247:650–61. doi: 10.1002/path.5223
130. Chang Q, Ornatsky OI, Siddiqui I, Loboda A, Baranov VI, Hedley DW. Imaging mass cytometry. Cytometry A. (2017) 91:160–9. doi: 10.1002/cyto.a.23053
131. Umemoto K, Togashi Y, Arai Y, Nakamura H, Takahashi S, Tanegashima T, et al. The potential application of PD-1 blockade therapy for early-stage biliary tract cancer. Int Immunol. (2019) 32:273–81. doi: 10.1093/intimm/dxz080
132. Jackson HW, Fischer JR, Zanotelli VRT, Ali HR, Mechera R, Soysal SD, et al. The single-cell pathology landscape of breast cancer. Nature. (2020) 578:615–20. doi: 10.1038/s41586-019-1876-x
133. Schulz D, Zanotelli VRT, Fischer JR, Schapiro D, Engler S, Lun XK, et al. Simultaneous multiplexed imaging of mRNA and proteins with subcellular resolution in breast cancer tissue samples by mass cytometry. Cell Syst. (2018) 6:25–36.e5. doi: 10.1016/j.cels.2017.12.001
134. Ijsselsteijn ME, van der Breggen R, Farina Sarasqueta A, Koning F, de Miranda NFCC. A 40-marker panel for high dimensional characterization of cancer immune microenvironments by imaging mass cytometry. Front Immunol. (2019) 10:2534. doi: 10.3389/fimmu.2019.02534
135. Keren L, Bosse M, Marquez D, Angoshtari R, Jain S, Varma S, et al. A structured tumor-immune microenvironment in triple negative breast cancer revealed by multiplexed ion beam imaging. Cell. (2018) 174:1373–87.e19. doi: 10.1016/j.cell.2018.08.039
136. Rost S, Giltnane J, Bordeaux JM, Hitzman C, Koeppen H, Liu SD. Multiplexed ion beam imaging analysis for quantitation of protein expression in cancer tissue sections. Lab Invest J Tech Methods Pathol. (2017) 97:992–1003. doi: 10.1038/labinvest.2017.50
137. Ali HR, Jackson HW, Zanotelli VRT, Danenberg E, Fischer JR, Bardwell H, et al. Imaging mass cytometry and multiplatform genomics define the phenogenomic landscape of breast cancer. Nat Cancer. (2020) 1:163–75. doi: 10.1038/s43018-020-0026-6
138. Merritt CR, Ong GT, Church S, Barker K, Geiss G, Hoang M, et al. High multiplex, digital spatial profiling of proteins and RNA in fixed tissue using genomic detection methods. Methods Mol Biol. (2019) 2055:563–83. doi: 10.1101/559021
139. Goltsev Y, Samusik N, Kennedy-Darling J, Bhate S, Hale M, Vazquez G, et al. Deep profiling of mouse splenic architecture with CODEX multiplexed imaging. Cell. (2018) 174:968–81.e15. doi: 10.1016/j.cell.2018.07.010
140. Saka SK, Wang Y, Kishi JY, Zhu A, Zeng Y, Xie W, et al. Immuno-SABER enables highly multiplexed and amplified protein imaging in tissues. Nat Biotechnol. (2019) 37:1080–90. doi: 10.1038/s41587-019-0207-y
141. Cabrita R, Lauss M, Sanna A, Donia M, Skaarup Larsen M, Mitra S, et al. Tertiary lymphoid structures improve immunotherapy and survival in melanoma. Nature. (2020) 577:561–5. doi: 10.1038/s41586-019-1914-8
142. Amaria RN, Reddy SM, Tawbi HA, Davies MA, Ross MI, Glitza IC, et al. Neoadjuvant immune checkpoint blockade in high-risk resectable melanoma. Nat Med. (2018) 24:1649–54. doi: 10.1038/s41591-018-0197-1
143. Toki MI, Merritt CR, Wong PF, Smithy JW, Kluger HM, Syrigos KN, et al. High-plex predictive marker discovery for melanoma immunotherapy-treated patients using digital spatial profiling. Clin Cancer Res. (2019) 25:5503–12. doi: 10.1158/1078-0432.CCR-19-0104
144. Blank CU, Rozeman EA, Fanchi LF, Sikorska K, van de Wiel B, Kvistborg P, et al. Neoadjuvant versus adjuvant ipilimumab plus nivolumab in macroscopic stage III melanoma. Nat Med. (2018) 24:1655–61. doi: 10.1038/s41591-018-0198-0
145. Figueiredo CR, Kalirai H, Sacco JJ, Azevedo RA, Duckworth A, Slupsky JR, et al. Loss of BAP1 expression is associated with an immunosuppressive microenvironment in uveal melanoma, with implications for immunotherapy development. J Pathol. (2020) 250:420–39. 1002/path.5384. doi: 10.1002/path.5384
146. Ihle CL, Provera MD, Straign DM, Smith EE, Edgerton SM, Van Bokhoven A, et al. Distinct tumor microenvironments of lytic and blastic bone metastases in prostate cancer patients. J Immunother Cancer. (2019) 7:293. doi: 10.1186/s40425-019-0753-3
147. Schürch CM, Bhate S, Barlow GL, Phillips DJ, Noti L, Zlobec I, et al. Coordinated Cellular Neighborhoods orchestrate antitumoral immunity at the colorectal cancer invasive front cell. bioRxiv. (2019). doi: 10.1101/743989
148. Schapiro D, Jackson HW, Raghuraman S, Fischer JR, Zanotelli VRT, Schulz D, et al. histoCAT: analysis of cell phenotypes and interactions in multiplex image cytometry data. Nat Methods. (2017) 14:873–6. doi: 10.1038/nmeth.4391
149. Somarakis A, Van Unen V, Koning F, Lelieveldt BPF, Hollt T. ImaCytE: visual exploration of cellular microenvironments for imaging mass cytometry data. IEEE Trans Vis Comput Graph. (2019). doi: 10.1109/TVCG.2019.2931299. [Epub ahead of print].
150. Sommer C, Straehle C, Köthe U, Hamprecht FA. Ilastik: interactive learning and segmentation toolkit. In: 2011 IEEE International Symposium on Biomedical Imaging: From Nano to Macro. (2011). doi: 10.1109/ISBI.2011.5872394
151. Carpenter AE, Jones TR, Lamprecht MR, Clarke C, Kang IH, Friman O, et al. CellProfiler: image analysis software for identifying and quantifying cell phenotypes. Genome Biol. (2006) 7:R100. doi: 10.1186/gb-2006-7-10-r100
152. Femino AM, Fay FS, Fogarty K, Singer RH. Visualization of single RNA transcripts in situ. Science. (1998) 280:585–90. doi: 10.1126/science.280.5363.585
153. Raj A, van den Bogaard P, Rifkin SA, van Oudenaarden A, Tyagi S. Imaging individual mRNA molecules using multiple singly labeled probes. Nat Methods. (2008) 5:877–9. doi: 10.1038/nmeth.1253
154. Codeluppi S, Borm LE, Zeisel A, La Manno G, van Lunteren JA, Svensson CI, et al. Spatial organization of the somatosensory cortex revealed by osmFISH. Nat Methods. (2018) 15:932–5. doi: 10.1038/s41592-018-0175-z
155. Lubeck E, Coskun AF, Zhiyentayev T, Ahmad M, Cai L. Single-cell in situ RNA profiling by sequential hybridization. Nat Methods. (2014) 11:360–1. doi: 10.1038/nmeth.2892
156. Eng C-HL, Lawson M, Zhu Q, Dries R, Koulena N, Takei Y, et al. Transcriptome-scale super-resolved imaging in tissues by RNA seqFISH. Nature. (2019) 568:235–9. doi: 10.1038/s41586-019-1049-y
157. Chen KH, Boettiger AN, Moffitt JR, Wang S, Zhuang X. RNA imaging. Spatially resolved, highly multiplexed RNA profiling in single cells. Science (New York, NY). (2015) 348:aaa6090. doi: 10.1126/science.aaa6090
158. Wang X, Allen WE, Wright MA, Sylwestrak EL, Samusik N, Vesuna S, et al. Three-dimensional intact-tissue sequencing of single-cell transcriptional states. Science. (2018) 361:eaat5691. doi: 10.1126/science.aat5691
159. Lee JH, Daugharthy ER, Scheiman J, Kalhor R, Ferrante TC, Terry R, et al. Fluorescent in situ sequencing (FISSEQ) of RNA for gene expression profiling in intact cells and tissues. Nat Protoc. (2015) 10:442–58. doi: 10.1038/nprot.2014.191
160. Ståhl PL, Salmén F, Vickovic S, Lundmark A, Navarro JF, Magnusson J, et al. Visualization and analysis of gene expression in tissue sections by spatial transcriptomics. Science. (2016) 353:78–82. doi: 10.1126/science.aaf2403
161. Rodriques SG, Stickels RR, Goeva A, Martin CA, Murray E, Vanderburg CR, et al. Slide-seq: a scalable technology for measuring genome-wide expression at high spatial resolution. Science. (2019) 363:1463–7. doi: 10.1126/science.aaw1219
162. Vickovic S, Eraslan G, Salmen F, Klughammer J, Stenbeck L, Schapiro D, et al. High-definition spatial transcriptomics for in situ tissue profiling. Nat Methods. (2019) 16:987–90. doi: 10.1038/s41592-019-0548-y
163. Thrane K, Eriksson H, Maaskola J, Hansson J, Lundeberg J. Spatially resolved transcriptomics enables dissection of genetic heterogeneity in stage III cutaneous malignant melanoma. Cancer Res. (2018) 78:5970–9. doi: 10.1158/0008-5472.CAN-18-0747
164. Berglund E, Maaskola J, Schultz N, Friedrich S, Marklund M, Bergenstråhle J, et al. Spatial maps of prostate cancer transcriptomes reveal an unexplored landscape of heterogeneity. Nat Commun. (2018) 9:2419. doi: 10.1038/s41467-018-04724-5
165. Moncada R, Barkley D, Wagner F, Chiodin M, Devlin JC, Baron M, et al. Integrating microarray-based spatial transcriptomics and single-cell RNA-seq reveals tissue architecture in pancreatic ductal adenocarcinomas. Nat Biotechnol. (2020) 38:333–42. doi: 10.1038/s41587-019-0392-8
166. Ritchie MD, Holzinger ER, Li R, Pendergrass SA, Kim D. Methods of integrating data to uncover genotype-phenotype interactions. Nat Rev Genet. (2015) 16:85–97. doi: 10.1038/nrg3868
167. Giordani L, He GJ, Negroni E, Sakai H, Law JYC, Siu MM, et al. High-dimensional single-cell cartography reveals novel skeletal muscle-resident cell populations. Mol Cell. (2019) 74:609–21.e6. doi: 10.1016/j.molcel.2019.02.026
168. Korsunsky I, Millard N, Fan J, Slowikowski K, Zhang F, Wei K, et al. Fast, sensitive and accurate integration of single-cell data with Harmony. Nat Methods. (2019) 16:1289–96. doi: 10.1038/s41592-019-0619-0
169. Argelaguet R, Velten B, Arnol D, Dietrich S, Zenz T, Marioni JC, et al. Multi-omics factor analysis-a framework for unsupervised integration of multi-omics data sets. Mol Syst Biol. (2018) 14:e8124. doi: 10.15252/msb.20178124
170. Argelaguet R, Arnol D, Bredikhin D, Deloro Y, Velten B, Marioni JC, et al. MOFA+: a probabilistic framework for comprehensive integration of structured single-cell data. Genome Biol. (2019) 21:111. doi: 10.1101/837104
171. Lin Y, Ghazanfar S, Wang KYX, Gagnon-Bartsch JA, Lo KK, Su X, et al. scMerge leverages factor analysis, stable expression, and pseudoreplication to merge multiple single-cell RNA-seq datasets. Proc Natl Acad Sci USA. (2019) 116:9775–84. doi: 10.1073/pnas.1820006116
172. Stein-O'Brien GL, Clark BS, Sherman T, Zibetti C, Hu Q, Sealfon R, et al. Decomposing cell identity for transfer learning across cellular measurements, platforms, tissues, and species. Cell Syst. (2019) 8:395–411.e8. doi: 10.1016/j.cels.2019.04.004
173. Govek KW, Troisi EC, Miao Z, Woodhouse S, Camara PG. Single-cell transcriptomic analysis of mIHC images via antigen mapping. bioRxiv. (2020). doi: 10.1101/672501
174. Abdelaal T, Hollt T, van Unen V, Lelieveldt BPF, Koning F, Reinders MJT, et al. CyTOFmerge: Integrating mass cytometry data across multiple panels. Bioinformatics. (2019) 35:4063–71. doi: 10.1093/bioinformatics/btz180
175. Gomes T, Teichmann SA, Talavera-López C. Immunology driven by large-scale single-cell sequencing. Trends Immunol. (2019) 40:1011–21. doi: 10.1016/j.it.2019.09.004
176. Regev A, Teichmann SA, Lander ES, Amit I, Benoist C, Birney E, et al. The human cell atlas. Elife. (2017) 6:e27041. doi: 10.7554/eLife.27041
177. Lein ES, Hawrylycz MJ, Ao N, Ayres M, Bensinger A, Bernard A, et al. Genome-wide atlas of gene expression in the adult mouse brain. Nature. (2007) 445:168–76. doi: 10.1038/nature05453
178. Efremova M, Vento-Tormo M, Teichmann SA, Vento-Tormo R. CellPhoneDB v2.0: Inferring cell-cell communication from combined expression of multi-subunit receptor-ligand complexes. Nat Protoc. (2019) 15:1484–506. doi: 10.1038/s41596-020-0292-x
179. Bonnardel J, T'Jonck W, Gaublomme D, Browaeys R, Scott CL, Martens L, et al. Stellate cells, hepatocytes, and endothelial cells imprint the kupffer cell identity on monocytes colonizing the liver macrophage niche. Immunity. (2019) 51:638–54.e9. doi: 10.1016/j.immuni.2019.08.017
180. Frei AP, Bava F-A, Zunder ER, Hsieh EWY, Chen S-Y, Nolan GP, et al. Highly multiplexed simultaneous detection of RNAs and proteins in single cells. Nat Methods. (2016) 13:269–75. doi: 10.1038/nmeth.3742
181. Angermueller C, Clark SJ, Lee HJ, Macaulay IC, Teng MJ, Hu TX, et al. Parallel single-cell sequencing links transcriptional and epigenetic heterogeneity. Nat Methods. (2016) 13:229–32. doi: 10.1038/nmeth.3728
182. Cao J, Cusanovich DA, Ramani V, Aghamirzaie D, Pliner HA, Hill AJ, et al. Joint profiling of chromatin accessibility and gene expression in thousands of single cells. Science. (2018) 361:1380–5. doi: 10.1126/science.aau0730
183. Chen S, Lake BB, Zhang K. High-throughput sequencing of the transcriptome and chromatin accessibility in the same cell. Nat Biotechnol. (2019) 37:1452–7. doi: 10.1038/s41587-019-0290-0
184. Zhu C, Yu M, Huang H, Juric I, Abnousi A, Hu R, et al. An ultra high-throughput method for single-cell joint analysis of open chromatin and transcriptome. Nat Struct Mol Biol. (2019) 26:1063–70. doi: 10.1038/s41594-019-0323-x
185. Lee D-S, Luo C, Zhou J, Chandran S, Rivkin A, Bartlett A, et al. Simultaneous profiling of 3D genome structure and DNA methylation in single human cells. Nat Methods. (2019) 16:999–1006. doi: 10.1038/s41592-019-0547-z
186. Dey SS, Kester L, Spanjaard B, Bienko M, van Oudenaarden A. Integrated genome and transcriptome sequencing of the same cell. Nat Biotechnol. (2015) 33:285–9. doi: 10.1038/nbt.3129
187. Macaulay IC, Haerty W, Kumar P, Li YI, Hu TX, Teng MJ, et al. G&T-seq: parallel sequencing of single-cell genomes and transcriptomes. Nat Methods. (2015) 12:519–22. doi: 10.1038/nmeth.3370
188. Hou Y, Guo H, Cao C, Li X, Hu B, Zhu P, et al. Single-cell triple omics sequencing reveals genetic, epigenetic, and transcriptomic heterogeneity in hepatocellular carcinomas. Cell Res. (2016) 26:304–19. doi: 10.1038/cr.2016.23
Keywords: cancer microenvironment, single-cell, data integration, multi-omics, mass cytometry, spatial analysis, immunophenotyping
Citation: de Vries NL, Mahfouz A, Koning F and de Miranda NFCC (2020) Unraveling the Complexity of the Cancer Microenvironment With Multidimensional Genomic and Cytometric Technologies. Front. Oncol. 10:1254. doi: 10.3389/fonc.2020.01254
Received: 01 April 2020; Accepted: 17 June 2020;
Published: 23 July 2020.
Edited by:
Francesca Finotello, Innsbruck Medical University, AustriaReviewed by:
Itai Yanai, New York University, United StatesChristina Stuelten, National Cancer Institute (NCI), United States
Pablo G. Camara, University of Pennsylvania, United States
Copyright © 2020 de Vries, Mahfouz, Koning and de Miranda. This is an open-access article distributed under the terms of the Creative Commons Attribution License (CC BY). The use, distribution or reproduction in other forums is permitted, provided the original author(s) and the copyright owner(s) are credited and that the original publication in this journal is cited, in accordance with accepted academic practice. No use, distribution or reproduction is permitted which does not comply with these terms.
*Correspondence: Noel F. C. C. de Miranda, Ti5GLmRlX01pcmFuZGFAbHVtYy5ubA==