 Shuang Qin1,2
 Ming Yi
 Qian Chu
 Kongming Wu
- 1Department of Oncology, Tongji Hospital of Tongji Medical College, Huazhong University of Science and Technology, Wuhan, China
- 2Department of Radiation Oncology, Hubei Cancer Hospital, Tongji Medical College, Huazhong University of Science and Technology, Wuhan, China
- 3Department of Molecular Pathology, The Affiliated Cancer Hospital of Zhengzhou University & Henan Cancer Hospital, Zhengzhou, China
Background: T cell immunoglobulin and mucin-domain containing molecule-3 (TIM-3), a novel emerging immune checkpoint molecule, was reported to express both on various kinds of immune cells and tumor cells. Many previous studies have investigated the prognostic significance of TIM-3 in cancer. However, the sample number from single study was limited and results remained controversial.
Methods: We searched PubMed, Web of Science, and Embase databases for publications concerning TIM-3 expression in solid cancers up to March 2020. The correlations between TIM-3 and survival as well as clinical-pathological features were analyzed. Pooled hazard ratios (HRs), odds ratios (ORs), and 95% confidence interval (CI) were estimated by either fixed or random effects models.
Results: A total of 3,072 patients were included in our meta-analysis. The result suggested that TIM-3 protein overexpression was relevant to poor overall survival (HR = 1.73, 95% CI = 1.39–2.15, P < 0.001). Moreover, TIM-3 was shown to be connected with lymph node metastasis (N+ vs. N-, OR = 1.59, 95% CI = 1.10–2.29, P = 0.013), tumor grade (G2-3 vs. G1, OR = 1.68, 95% CI = 1.21–2.34, P = 0.002), as well as PD-1 expression (PD-1high vs. PD-1low, OR = 3.26, 95% CI = 2.20–4.82, P < 0.001). In database test, significant correlations between high TIM-3 mRNA expression and poor overall survival for patients with non-small cell lung cancer and gastric cancer were observed (HR = 1.46, 95% CI = 1.23–1.72, P < 0.001; HR = 1.41, 95% CI = 1.12–1.77, P = 0.0038).
Conclusion: Our meta-analysis highlights that TIM-3 has the potential to serve as a prognostic marker and a valuable therapeutic target in solid tumors.
Introduction
Cancer is the leading cause of death all over the world (1). Although tremendous advances with regard to diagnostic technology and therapeutic approaches have been achieved in recent decades, the outcome of most cancers is still far from satisfactory, especially in late stages. Therefore, identifying novel biomarkers which can better predict cancer progression and prognosis is of great value.
T cell immunoglobulin and mucin-domain containing molecule-3 (TIM-3), also called hepatitis A virus cellular receptor 2 (HAVCR2), is a member of the TIM gene family (2). Kuchroo's group firstly explored the function of TIM-3, and described it as a cell surface molecule which can distinguish T helper 1 (Th1) cells and Th2 cells (3). This gene family is named as TIM on account of these proteins are expressed by T cells and encompass an immunoglobulin variable region (IgV)-like domain and a mucin-like domain (4).
In addition to its well-known expression on T cells (3, 5, 6), TIM-3 has also expressed on other cells, such as dendritic cells (DCs), monocytes, and natural killer (NK) cells (7). Recently, a growing body of evidence has shown that the expression of TIM-3 is upregulated in a series of cancers, like colorectal cancer (CRC) (8), gastric cancer (GC) (9), hepatocellular carcinoma (HCC) (10), non-small cell lung cancer (NSCLC) (11), clear cell renal cell carcinomas (RCC) (12), bladder urothelial carcinoma (BUC) (13), prostate cancer (14), and leukemic stem cells (15). There are at least 4 ligands binding to the IgV domain of TIM-3: galectin-9, phosphatidylserine, high-mobility group protein B1 (HMGB1), and carcinoembryonic antigen cell adhesion molecule 1 (Ceacam-1) (16, 17). An in-depth study conducted by Li et al. illustrated that TIM-3 was expressed on tumor-infiltrating CD4+ and CD8+ T cells in HBV-associated HCC. TIM-3+ T cells expressed surface markers for senescence and exhibited decreased proliferative ability. They further demonstrated that the blockade of TIM-3/galectin-9 signaling by anti-TIM-3 monoclonal antibody (mAb) can restore the function of effector T cells, increasing the production of interleukin 2 (IL-2) and IFN-γ (10). Nowadays, several anti-TIM-3 mAbs were currently in clinical trials, including TSR-022, MBG453, and Sym023 (18). Elevated TIM-3 level was related to patients clinical-pathological and prognosis. It was reported that high TIM-3 expression was positively correlated with tumor size, TNM staging and distant metastasis in CRC (8). In the meanwhile, elevated TIM-3 was detected in prostate cancer patients with higher clinical stage (19). In some types of cancers, high expression of TIM-3 has been associated with poor prognosis, while in others the opposite relationship has been observed. For example, Yang et al. reported that high TIM-3 expression was correlated with poor survival in BUC, and it was also related to another immune checkpoint molecule programmed cell death protein-1 (PD-1) (13). On the contrary, Wu et al. found that low expression of TIM-3 in prostate cancer was an independent prognostic factor of bad prognosis (14). Thus, the prognostic value of TIM-3 to predict the outcome in various cancers is controversial. In this setting, we conducted this meta-analysis in order to gain a comprehensive understanding of the prognostic effect of TIM-3 on patients with solid cancers.
Methods
Search Strategy
Our meta-analysis was performed in accordance with the Preferred Reporting Items for Systematic Reviews and Meta-Analyses (PRISMA) statement (20). Relevant studies which were published before March 2020, were searched through electronic platforms of PubMed, Web of Science, and Embase databases by two authors (Shuang Qin and Bing Dong) independently. The following keywords were used for our search: “TIM-3,” “TIM3,” “T cell immunoglobulin and mucin-domain containing molecule-3,” “HAVCR2,” “hepatitis A virus cellular receptor 2,” “cancer,” “carcinoma,” “tumor,” “prognostic,” “survival,” “prognosis,” “recurrence,” “outcome,” and “mortality.” Furthermore, reference lists were screened manually to identify potentially related studies. The researches included were restricted to study on human published in English. Any disagreements were settled by discussion and consensus between the two authors.
Inclusion and Exclusion Criteria
Publications were included in our meta-analysis if they met the following criteria: [1] A definite source of the study was reported; [2] The sample size was more than 30; [3] The expressions of TIM-3 in tumor cells and/or tumor infiltrating lymphocytes (TILs) were measured by immunohistochemical (IHC) staining; [4] The relationships between TIM-3 and overall survival (OS)/disease-free survival (DFS)/progression-free survival (PFS) were described; [5] Hazard ratio (HR) and 95% confidence interval (CI) were reported, or with essential data to calculate it; [6] Studies were published in English. Studies were excluded if they were: (a) duplicate studies; (b) case reports, review articles, letters, conference abstracts, animal studies, or meta-analysis; (c) unpublished data.
Data Extraction
The following information was recorded: first author, year of publication, patient source, sample size, cancer type, detection of method, expression location, cut-off value, median follow-up, outcome, method to estimate HR (univariate and multivariate analysis), and HR ratio. Multivariate Cox analysis should be given priority if available, or univariate hazard analysis was instead (21). For studies that presented only Kaplan-Meier curves, Engauge Digitizer (version 4.1) was used to extract the survival data and estimate HRs with 95% CIs calculated by Tierney's method (22). Two investigators reviewed the eligible articles independently, then compared their datasets. Any discrepancy between the reviewers was resolved by discussion.
Quality Assessment
To control the quality of each study, all included articles were scored according to the Newcastle-Ottawa Quality Assessment Scale (NOS) by two investigators independently (23). The NOS criteria was scored on three domains: selection of participants, comparability, and clinical outcome. The score range of NOS was from 0 to 9 (9 as the best), and study with score ≥6 was considered as a high-quality. The mean value of all included studies was a score of 7.6 (ranging from 6 to 9), indicating high quality and good methodology.
TIM-3 mRNA Expression Profile and Prognosis
An online analysis tool Kaplan-Meier plotter was used to evaluate the effect of TIM-3 mRNA expression levels on OS of NSCLC (24), GC (25), and breast cancer (26) (http://kmplot.com/analysis/). The affymetrix probe ID for TIM-3 was 1554285_at. The follow-up time threshold was set as 120 months. The Kaplan-Meier survival curves downloaded from the website were resized in Adobe Illustrator CS6.
Statistical Methods
Meta-analysis was performed by STATA software package (version 12.0) (Stata Corp LP, College Station, TX, USA). Cut-off value of TIM-3 extracted from the articles has divided patients into high and low groups. HR and relative 95% CI obtained from the individual study were pooled into a summary HRs to assess the impact of TIM-3 on survival outcome (OS, PFS, and DFS). In addition, odds ratios (ORs) and corresponding 95% CIs were used to measure the relationship between TIM-3 expression and the clinicopathological features. HR or OR higher than 1 indicated a worse prognosis or a significant correlation between TIM-3 and clinical-pathological parameters, respectively. If 95% CI did not include the value 1, the pooled result was considered statistically significant. Heterogeneity among researches were tested using the chi-square-based Q-test and I2 test. PH value < 0.05 or I2 > 50% was defined as a significant heterogeneity, then a random effects model was applied to calculate the pooled effect. Otherwise, a fixed effects model was applied. Subgroup analyses were conducted to explore the source of heterogeneity. Begg's and Egger's tests were used to depict the publication bias of all enrolled studies (P > 0.05 indicating no publication bias) (27). Additionally, sensitivity analysis was utilized to check the stability of the pooled results and to identify possible explanations for the observed heterogeneity. All P-values were two-sided.
Results
Study Selection
A flow diagram showing the study selection was presented in Figure 1. A total of 1,138 articles were obtained by using the described searching strategy mentioned above. 937 articles were excluded on account of duplication. The remaining 201 records were screened on the base of title, abstract, and full-text. Finally, we retained 21 manuscripts to investigate the correlation between TIM-3 expression and patient survival in various solid malignant tumors (9–14, 28–42).
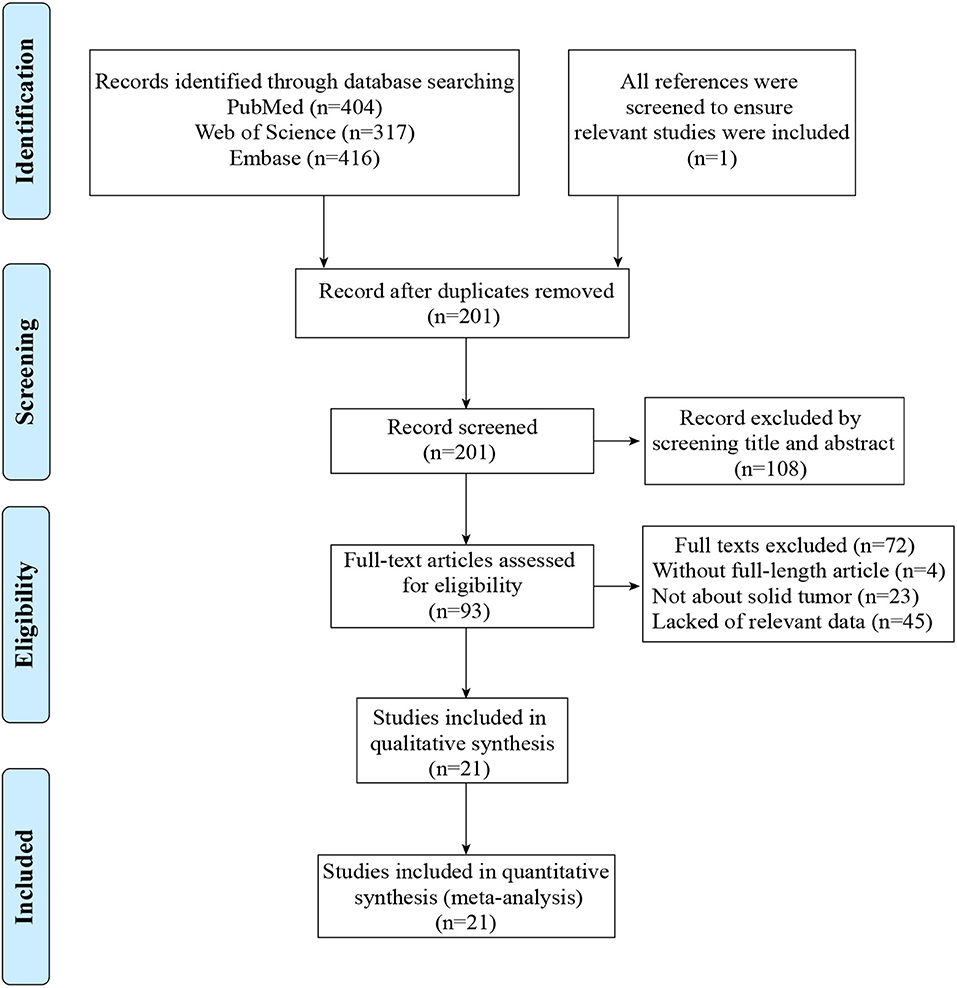
Figure 1. Flow diagram for the process of studies selection.
Study Characteristics
A total of 3,072 patients, ranging from 30 to 587 patients per study, were involved in our meta-analysis. Among all eligible studies, 13 studies focused on the TIM-3 expression on tumor cells (10–14, 28–33, 36, 39), six studies centered on the TIM-3 expression on TILs (9, 34, 35, 37, 38, 40), one study combined the TIM-3 expression on tumor cells and TILs (41), and one study analyzed the TIM-3 expression on tumor cells and TILs separately (42). All researches utilized the IHC techniques to detect the expression level of TIM-3. The studies were published from 2012 to 2019 with the patients from China (n = 17), Japan (n = 1), Korea (n = 2), and Poland (n = 1). The type of carcinoma included HCC, CRC, BUC, esophageal squamous cell carcinoma (ESCC), NSCLC, GC, RCC, cervical cancer, breast cancer, pancreatic cancer, prostate cancer, osteosarcoma, and skull base chordoma. The cut-off value of each study was not exactly the same. Among all included studies, eight studies reported the HRs and 95% CIs directly. In the remaining 13 studies, HRs and 95% CIs were estimated from survival curves. OS was reported in all studies, while DFS and PFS were addressed in seven and one study, respectively. Additionally, 13 studies showed the association between TIM-3 and clinical-pathological characteristics. The details regarding the characteristics of the 21 eligible studies were listed in Table 1.
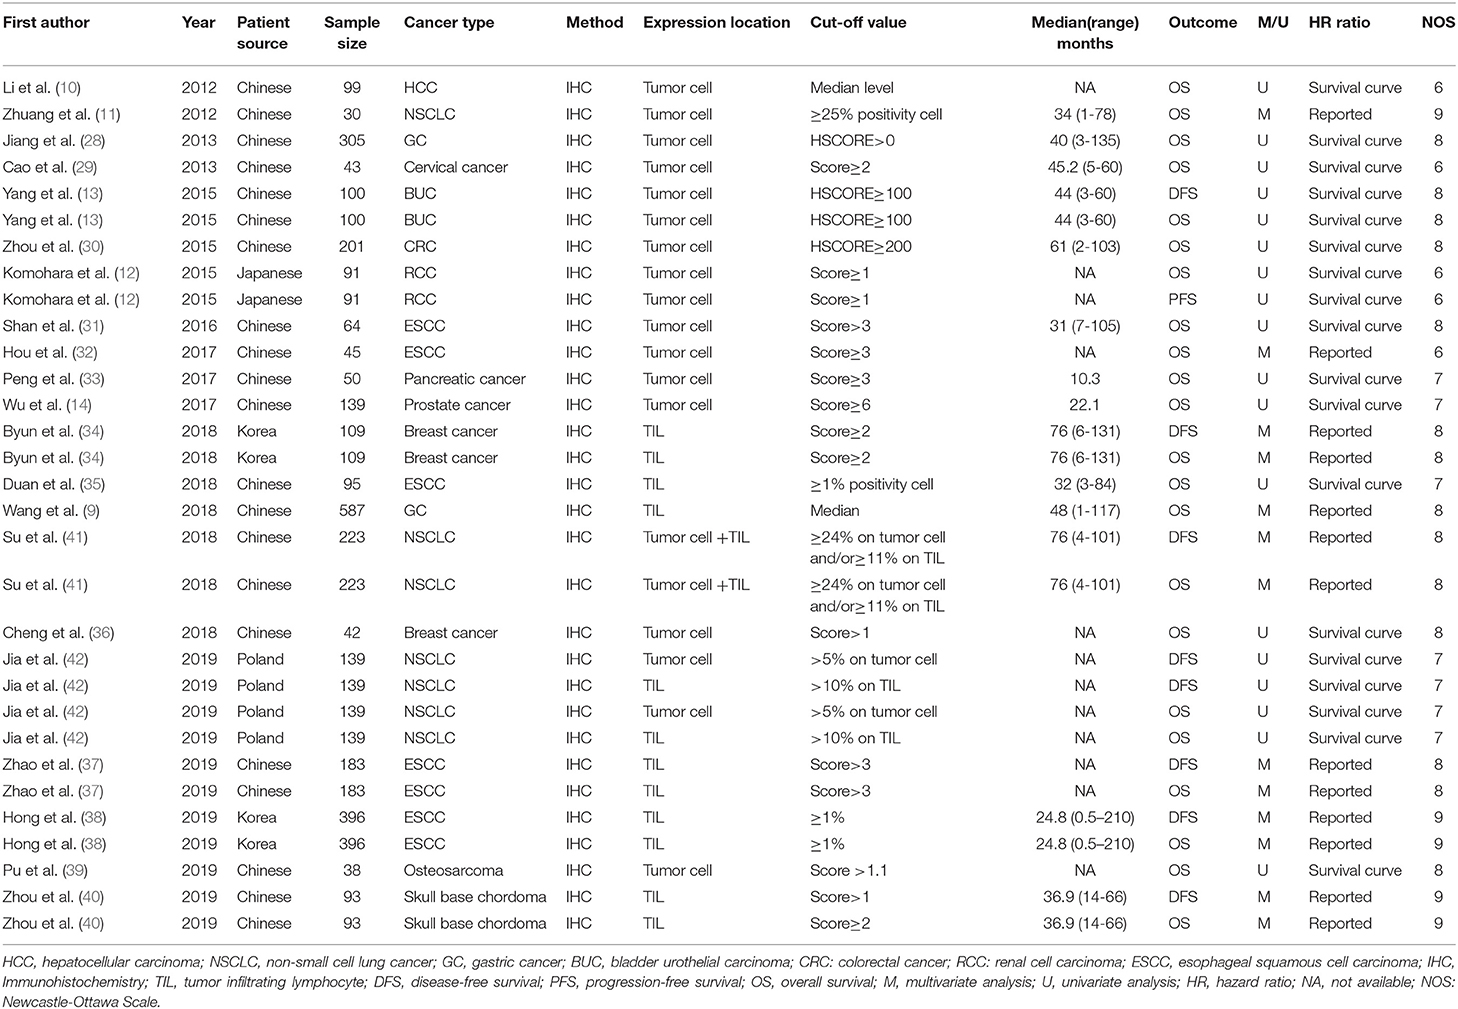
Table 1. Main characteristics of the studies included in the meta-analysis.
Association of TIM-3 Expression With Overall Survival
All included studies supplied suitable data to analyze the association between TIM-3 on tumor cells/TILs and OS. The main results of this meta-analysis were listed in Table 2. As the heterogeneity test reported a PH <0.001 and I2 value of 60.5%, we used a random effects model to pool the HR. As shown in Figure 2A, TIM-3 upregulation was significantly associated with a worse OS in patients with solid cancer (HR = 1.73; 95% CI = 1.39–2.15; P < 0.001). In order to seek the source of inter-study heterogeneity, subgroup analysis was further performed based on the expression position, cancer type, sample size, and method to estimate HR (Table 2). Overexpressions of TIM-3 on tumor cells were significantly related to unfavorable OS (HR = 2.10; 95% CI = 1.57–2.80; P < 0.001) (Figure 3). The TIM-3 expression on TILs showed a tendency of increased risk of short OS, however, the association did not research a statistical difference (HR = 1.34; 95% CI = 0.94–1.92; P = 0.105). Elevated TIM-3 as a negative predictor on OS was confirmed in patients with ESCC (HR = 1.70; 95% CI = 1.08–2.70; P = 0.023), NSCLC (HR = 2.35; 95% CI = 1.71–3.24; P < 0.001), GC (HR = 1.45; 95% CI = 1.19–1.77; P < 0.001) and other types of cancers (HR = 1.83; 95% CI = 1.25–2.68; P = 0.002), but not in patients with breast cancer (HR = 0.27; 95% CI = 0.02–3.10; P = 0.292).
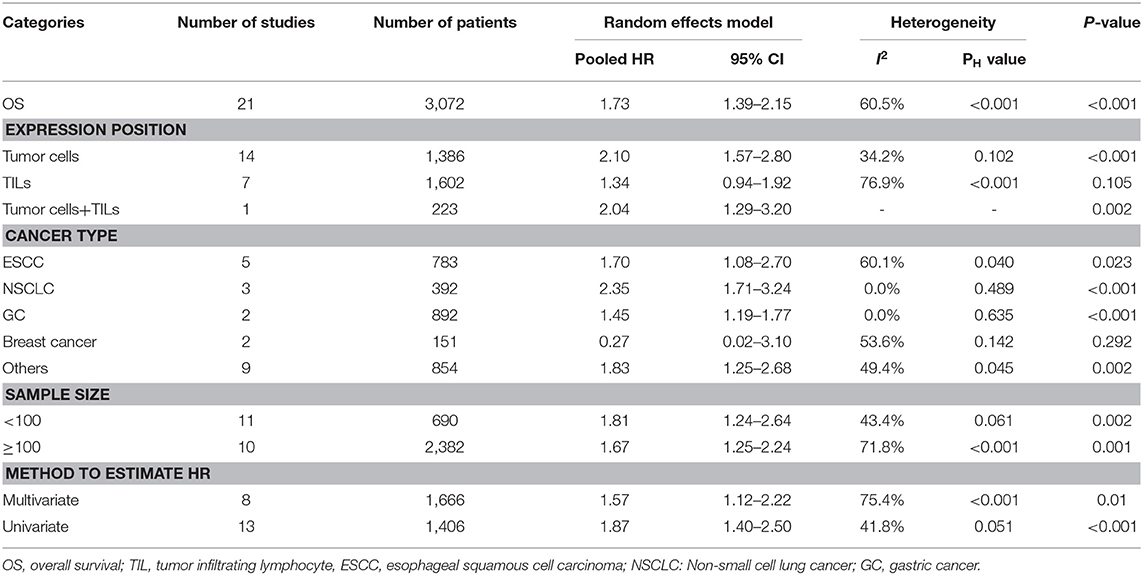
Table 2. Pooled HRs for OS and subgroup analysis of TIM-3 expression in solid cancer patients.
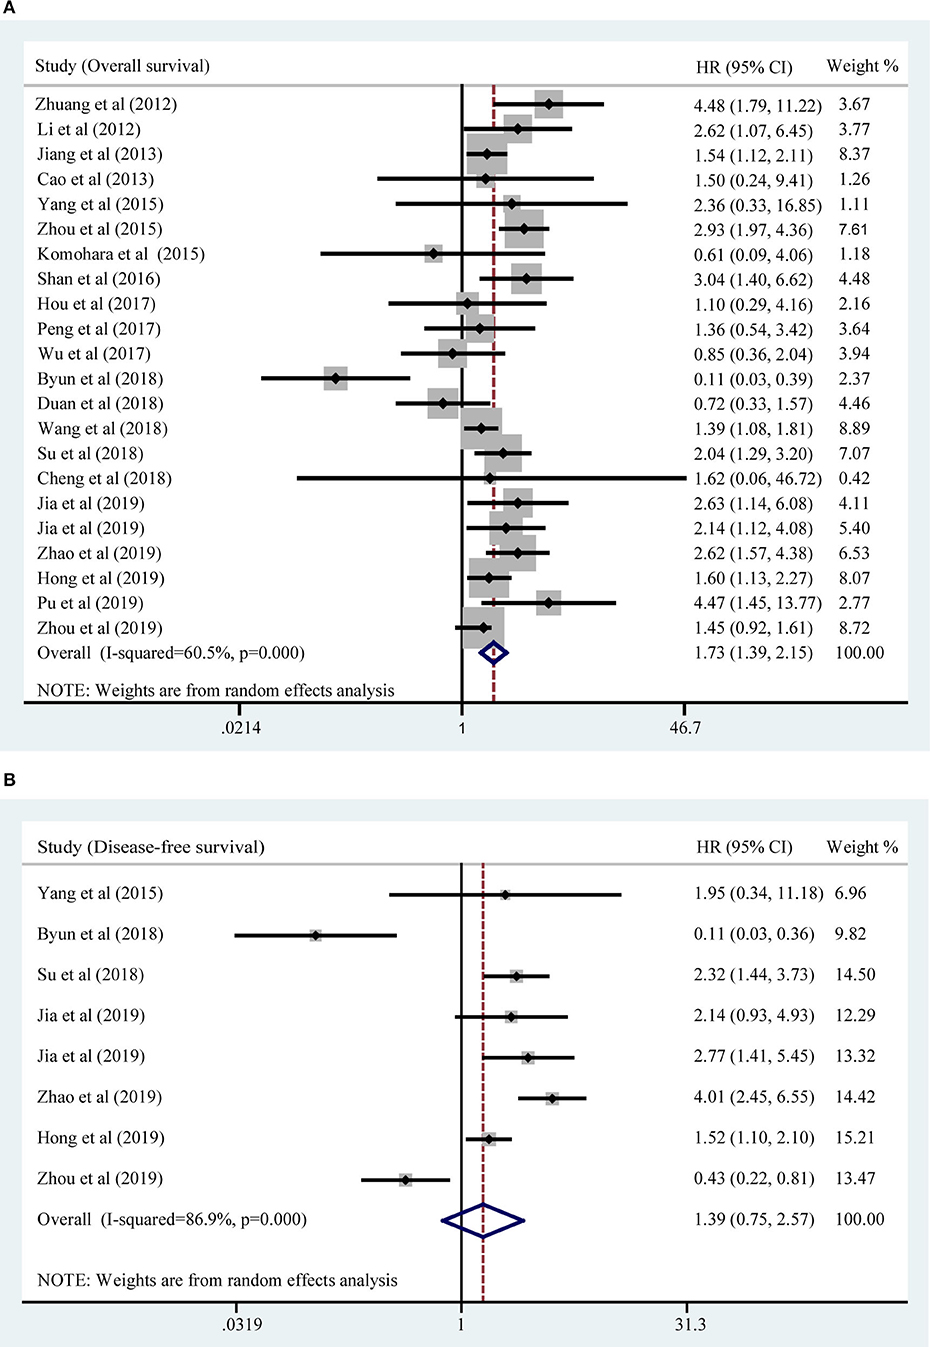
Figure 2. Forest plot of HR for the association of TIM-3 overexpression and OS (A) and DFS (B).
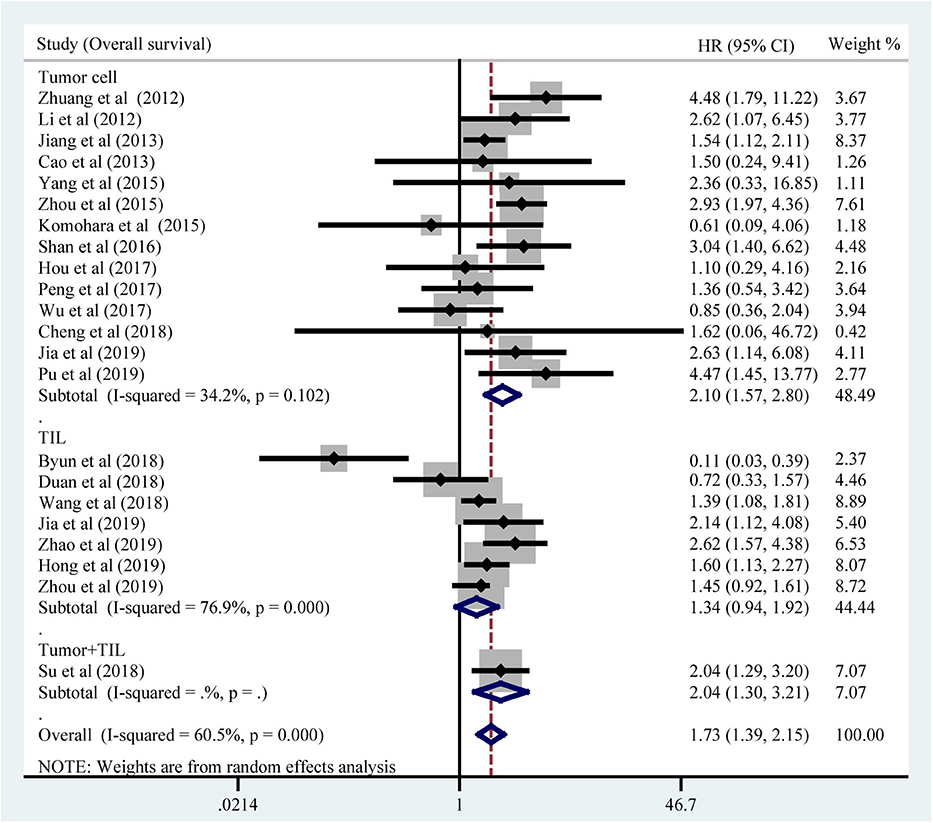
Figure 3. Subgroup analysis of the association betweenTIM-3 and OS in tumor cells and TILs.
Association of TIM-3 Expression With DFS
Seven studies comprising 1,243 patients assessed the link between TIM-3 and DFS in cancer patients, among which one study presented the data about the TIM-3 on tumor cells and TILs separately. A random effects model was used on account of the obvious heterogeneity among these studies (I2 = 86.9%, PH <0.001). The result showed that TIM-3 expression was not associated with DFS (HR = 1.39; 95% CI = 0.75–2.57; P = 0.297) (Figure 2B). Subsequently, subgroup analysis was performed (Table 3). We observed that elevated TIM-3 expression was correlated significantly with short DFS in NSCLC patients (HR = 2.40; 95% CI = 1.69–3.41; P < 0.001) and high level of TIM-3 significantly correlated with short DFS in study where HR was extrapolated by univariate analysis (HR = 2.45; 95% CI = 1.48–4.05; P < 0.001). As PFS was reported in only one related study, it was insufficient to conduct a meta-analysis.
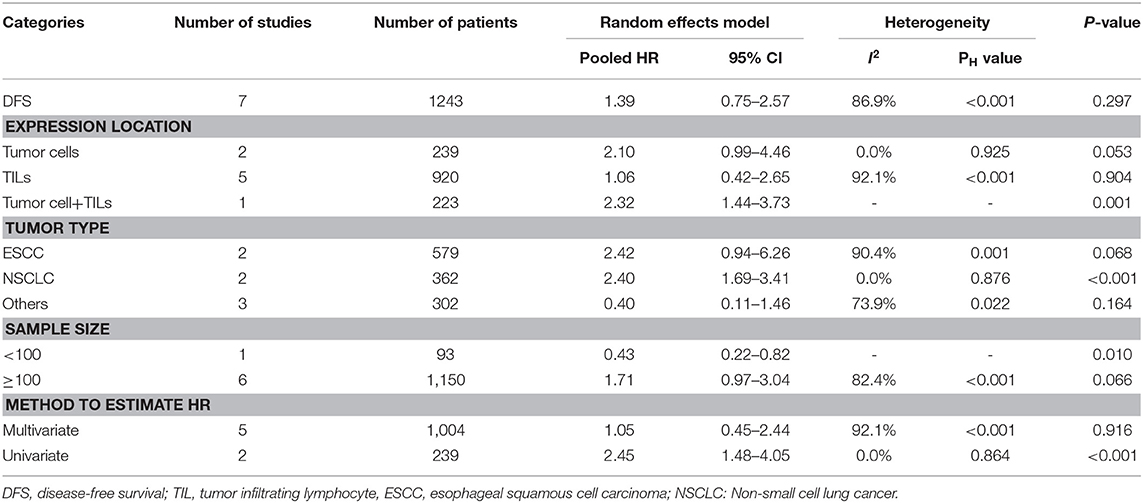
Table 3. Pooled HRs for DFS and subgroup analysis of TIM-3 expression in solid cancer patients.
Association of TIM-3 With Clinicopathological Parameters
Relevant data were utilized to extrapolate the relationship between TIM-3 and ten clinical-pathological features. These parameters included gender, age, T stage, lymph node metastasis, tumor grade, TNM stage, smoking history, distant metastasis, vascular invasion, and PD-1 expression. The overall results were showed in Table 4 in detail. The synthesized data indicated that TIM-3 expression had no obvious association with patients' sex, age, T stage, smoking history, or vascular invasion. However, significant connections were presented between TIM-3 and lymph node metastasis (OR = 1.59; 95% CI = 1.10–2.29; P = 0.013), tumor grade (OR = 1.68; 95% CI = 1.21–2.34; P = 0.002), as well as PD-1 expression (OR = 3.26; 95% CI = 2.20–4.82; P < 0.001).
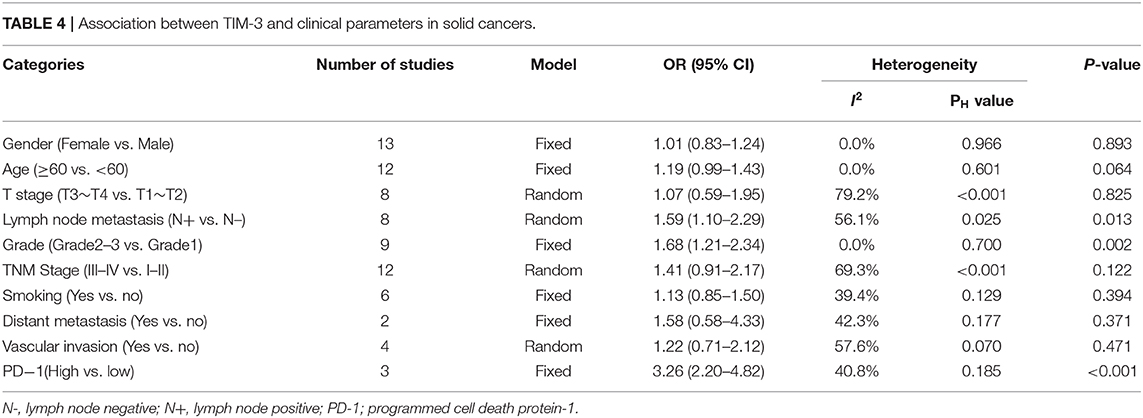
Table 4. Association between TIM-3 and clinical parameters in solid cancers.
Sensitivity Analysis
Sensitivity analysis was conducted to assess the influence of each study on the synthetic results of meta-analysis by omitting one study at a time. As shown in Figures 4A,B, there was no significant change after omitting any single study for the effect of TIM-3 expression on OS or DFS, indicating the stability of our meta-analysis.
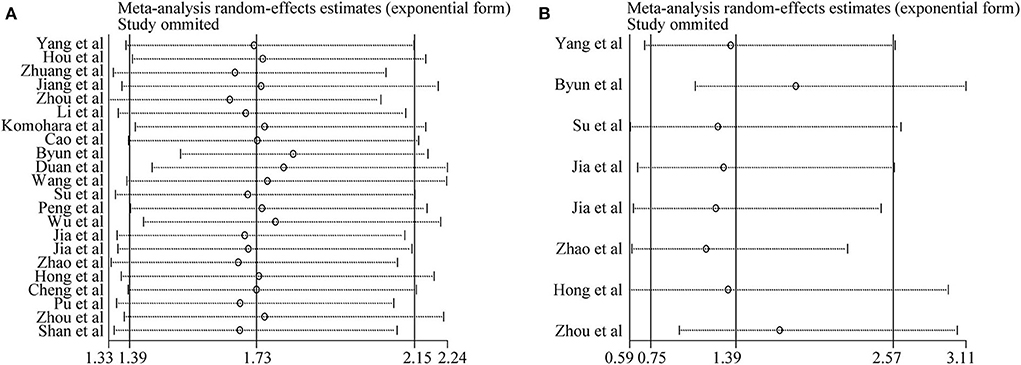
Figure 4. Sensitivity analysis of pooled HRs on the association between TIM-3 expression and OS (A) as well as DFS (B).
Publication Bias
Both Begg's test and Egger's test were used to evaluate publication bias of OS and DFS analysis. The shape of funnel plot did not appear dissymmetric, and Egger's test also showed no publication bias among the studies analyzing the association of TIM-3 expression and OS (Figures 5A,B). No significant asymmetry was observed in the funnel plot for the relation of TIM-3 expression with DFS (P = 0.536, Figure 5C). Moreover, the conclusion was confirmed by Egger's tests (P = 0.465, Figure 5D). Hence, publication bias was not presented in our meta-analysis.
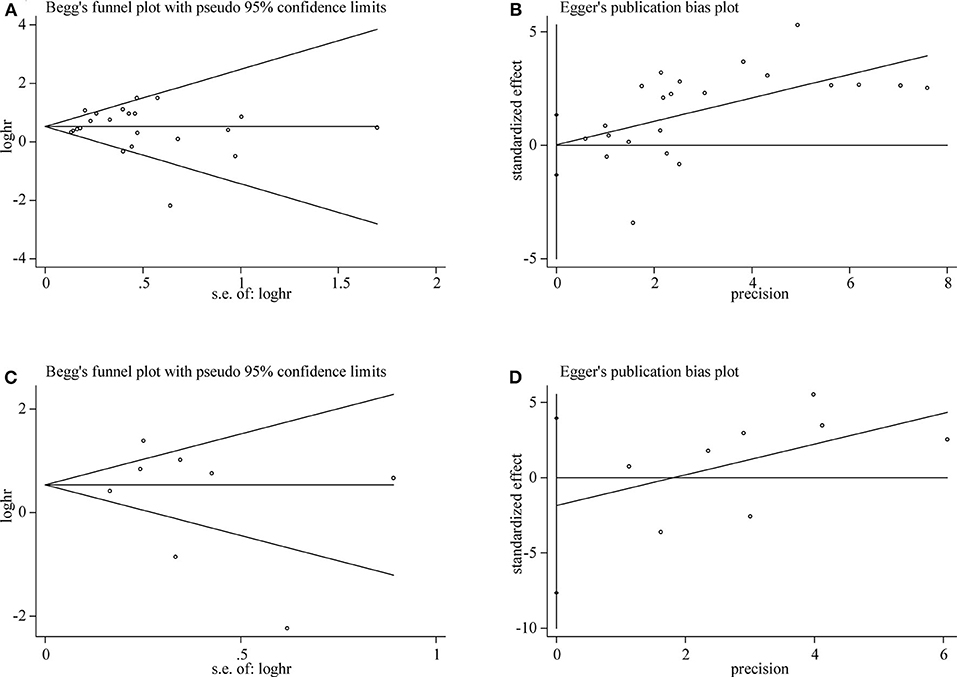
Figure 5. Publication bias detected by Begg's test and Egger's test. Begg's (A) and Egger's (B) test for OS. Begg's (C) and Egger's (D) test for DFS.
Expression of TIM-3 mRNA and Prognosis in Database Test
For OS, a significant correlation was revealed between high TIM-3 mRNA expression and poor OS in patients with NSCLC (HR = 1.46, P < 0.001) (Figure 6A) and GC (HR = 1.41, P = 0.0038) (Figure 6B), but not in patients with breast cancer (HR = 0.79, P = 0.51) (Figure 6C). The results of TIM-3 mRNA expression adopted from public database were in accordance with those of our combined result of subgroup analysis of TIM-3 protein abundance based on cancer type.
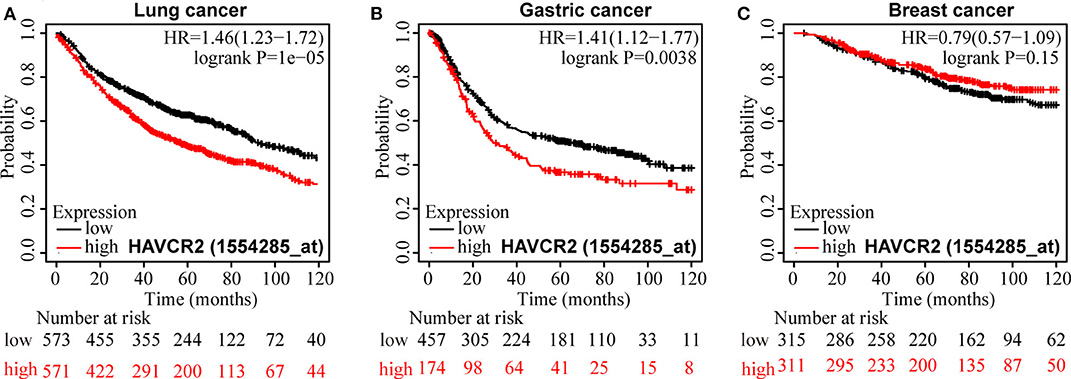
Figure 6. Kaplan-Meier survival curves for OS according to TIM-3 mRNA expression in patients with NSCLC (A), GC (B), and breast cancer (C).
Discussion
The identification of TIM gene family was found in searching for asthma susceptibility genes (4). TIM genes family is located on human chromosome 5q33—a region which has been repeatedly linked to allergic and autoimmune diseases (43–45). TIM-3 blockade exacerbated the disease phenotype in experimental allergic encephalomyelitis animal models, indicating TIM-3 as a negative regulatory molecule (3). TIM-3 is widely expressed on immune cells, such as T cells, NK cells (46), DCs and monocytes/macrophages (47, 48). The results of Yan et al. strongly suggested that increased TIM-3 expression in monocytes/tumor-associated macrophages was positively correlated with higher tumor grades and the poor survival in patients with HCC (48). In the most recent, TIM-3 expression had also been reported on malignant tumor cells, such as melanoma (49), CRC (8), GC (9), and HCC (10). Ma's group thoroughly delineated that tumor cell-intrinsic TIM-3 exerted protumoral activity via NF-κB/IL-6/STAT3 axis (50). Xiao et al. demonstrated that intrinsic expression of TIM-3 in nasopharyngeal carcinoma (NPC) cells promoted epithelial-mesenchymal transition of NPC through SMAD7/SMAD2/SNAIL1 axis (51). In these cancers, the prognostic significance of TIM-3 was evaluated, but there was no consistence on the relationship between the expression of TIM-3 detected by IHC and survival in patients.
Our meta-analysis, including 3,072 cases from 21 published studies, calculated a combined HR of 1.73 (95% CI = 1.39–2.15; P < 0.001), which supported that high TIM-3 expression was correlated with poor OS. However, a significant heterogeneity in OS across the included studies was existed. Thus, we performed sensitivity analysis to ascertain the cause for heterogeneity. The result suggested that pooled HR was not clearly influenced by any single study. We further performed subgroup analysis. Interestingly, subgroup analysis showed that TIM-3 overexpression on tumor cells was associated with poor OS, but the association between TIM-3 expression on TILs and OS didn't reach a statistical significance. TIM-3 was mainly expressed on immune cells with lower expression in tumor cells (9, 42). It seems that the expression of TIM-3 on tumor cells has greater prognosis value, but the exact mechanism needs further investigation. In the subgroup analysis based on cancer types, TIM-3 showed the inconsistent prognostic effects. Elevated TIM-3 expression was connected with poor OS in ESCC, NSCLC, GC, and other cancers, but was not in breast cancer. We noticed that one study conducted by Byun et al. (34) selected a special type of breast cancer—triple-negative breast cancer. This study indicated that TIM-3 expression on TILs was a positive prognosticator. So, lack of consistency of these studies may be due to the different features of various tumors and the distinct expression location.
Furthermore, we adopted Kaplan-Meier plotter to explore the prognostic value of TIM-3 mRNA in lung cancer, GC, and breast cancer with the public database from GEO and TCGA to verify our finding. It demonstrated that the OS of lung cancer and GC patients with high TIM-3 was extremely poor, which was in accordance with our pooled HR results, suggesting that TIM-3 mRNA expression reflected protein abundance. Besides, for DFS, elevated expression of TIM-3 didn't affect prognosis. But in subgroup of NSCLC and univariate analysis, TIM-3 was found to be correlated with poor DFS. As the studies involved in the analysis of DFS were relative deficiency, the conclusion was not convincing. As only one study reported the relationship between PFS and TIM-3, we could not calculate the pooled HR. Moreover, we stratified the variables by clinicopathological features, a higher level of TIM-3 showed a significant correlation with poor differentiation, lymph node metastasis, and higher PD-1 expression.
PD-1(CD279), an immune checkpoint molecule belonging to the CD28 superfamily, suppresses the activation and function of T cells by binding with its ligands PD-L1 and PD-L2 (52, 53). Immune checkpoint blockade therapy targeted PD-1/PD-L1 was one of the most well-established immunotherapies (54). Nevertheless, drug resistance remains a daunting challenge (55). Now, TIM-3 is classified as negative immune checkpoint molecule similar to PD-1. Studies have shown that the majority of TIM-3+TILs co-expressed PD-1, indicating a potential synergistic effect between these two negative immune checkpoints (10, 56). TIM-3+PD-1+TILs reflected a more exhausted phenotype as defined by failure to proliferate and secret less IFN-γ, IL-2 and tumor necrosis factor-α (57, 58). Encouragingly, the evidence from preclinical studies showed that dual blockade of TIM-3 and PD-1 pathway effectively restricted tumor growth (59). Nowadays, several anti-TIM-3 mAbs were evaluated in clinical trials as a monotherapy or in combination with PD-1/PD-L1 mAbs (18, 60).
A meta-analysis of the association between TIM-3 expression and cancer prognosis had been previously reported by Zhang et al. (61). They collected seven studies in seven different cancer types that involved 869 patients and the result indicated that high TIM-3 expression was significantly correlated to poor OS. Additionally, higher TIM-3 expression was associated with advanced tumor stage in their analysis (61). Compared with the previous study, our meta-analysis has several advantages as well as limitations. Our meta-analysis reviewed the role of TIM-3 in both OS and DFS in more cancer types. Besides, we conducted the subgroup analysis which was not performed before. Furthermore, to ensure the credibility of results, we have expanded the number of studies for analysis.
Although we have made every effort to conduct a comprehensive analysis, some limitations still exist in our meta-analysis inevitably. Firstly, most of the subjects were from East Asia, which could have resulted in selection bias. Thus, the conclusion should be reassessed in European patients. Secondly, the number of eligible studies included in PFS and DFS were relatively small, which may cause heterogeneity. More studies are needed to explore the relationship among TIM-3, DFS, and PFS. Thirdly, although all studies employed IHC, the antibodies they used were not exactly the same, and the threshold value was inconsistent among trials, which may contribute to the observed heterogeneity. Establishment of the unified cut-off value should be further explored. Finally, some studies didn't provide the HRs directly, so we extracted HRs and 95% CIs based on survival curves, which may influence the accuracy of data.
Conclusion
In summary, our meta-analysis illustrated that TIM-3 expressions on tumor cells were significantly associated with poor OS but not DFS in most human solid cancers. TIM-3 expression was also positively connected with lymph node metastasis, tumor grade, and PD-1 expression. It seems that TIM-3 is not merely an indicator of tumor prognosis but also a promising therapeutic target for solid tumors. Due to the inevitable limitations, our results should be interpreted with caution and further prospective multicenter studies with larger sample size will be necessary to determine the role of TIM-3 in both the prognostic prediction and targeted therapy for various types of cancers.
Data Availability Statement
All datasets presented in this study are included in the article/supplementary material.
Author Contributions
SQ analyzed the data and wrote the manuscript. SQ and BD searched and collected the literatures. MY and QC contributed to statistical analysis. KW designed the study and revised the manuscript. All authors participated in the discussion, read, and approved the final manuscript.
Funding
This work was supported by the National Natural Science Foundation of China Nos. 81874120 and 81572608, by Wuhan Science and Technology Bureau (No. 2017060201010170), and also in part by National Cancer Center Climbing Foundation Key project (NCC201816B046).
Conflict of Interest
The authors declare that the research was conducted in the absence of any commercial or financial relationships that could be construed as a potential conflict of interest.
References
1. Bray F, Ferlay J, Soerjomataram I, Siegel RL, Torre LA, Jemal A. Global cancer statistics 2018: GLOBOCAN estimates of incidence and mortality worldwide for 36 cancers in 185 countries. CA Cancer J Clin. (2018) 68:394–424. doi: 10.3322/caac.21492
2. Kuchroo VK, Umetsu DT, DeKruyff RH, Freeman GJ. The TIM gene family: emerging roles in immunity and disease. Nat Rev Immunol. (2003) 3:454–62. doi: 10.1038/nri1111
3. Monney L, Sabatos CA, Gaglia JL, Ryu A, Waldner H, Chernova T, et al. Th1-specific cell surface protein Tim-3 regulates macrophage activation and severity of an autoimmune disease. Nature. (2002) 415:536–41. doi: 10.1038/415536a
4. McIntire JJ, Umetsu SE, Akbari O, Potter M, Kuchroo VK, Barsh GS, et al. Identification of Tapr (an airway hyperreactivity regulatory locus) and the linked Tim gene family. Nat Immunol. (2001) 2:1109–16. doi: 10.1038/ni739
5. Sakuishi K, Ngiow SF, Sullivan JM, Teng MW, Kuchroo VK, Smyth MJ, et al. TIM3(+)FOXP3(+) regulatory T cells are tissue-specific promoters of T-cell dysfunction in cancer. Oncoimmunology. (2013) 2:e23849. doi: 10.4161/onci.23849
6. Nakae S, Iwakura Y, Suto H, Galli SJ. Phenotypic differences between Th1 and Th17 cells and negative regulation of Th1 cell differentiation by IL-17. J Leukocyte Biol. (2007) 81:1258–68. doi: 10.1189/jlb.1006610
7. Khan M, Arooj S, Wang H. NK cell-based immune checkpoint inhibition. Front Immunol. (2020) 11:167. doi: 10.3389/fimmu.2020.00167
8. Yu MM, Lu B, Liu YC, Mei Y, Wang LJ, Zhang P. Tim-3 is upregulated in human colorectal carcinoma and associated with tumor progression. Mol Med Rep. (2017) 15:689–95. doi: 10.3892/mmr.2016.6065
9. Wang Y, Zhao E, Zhang Z, Zhao G, Cao H. Association between Tim3 and Gal9 expression and gastric cancer prognosis. Oncol Rep. (2018) 40:2115–26. doi: 10.3892/or.2018.6627
10. Li H, Wu K, Tao KX, Chen LB, Zheng QC, Lu XM, et al. Tim-3/galectin-9 signaling pathway mediates T-cell dysfunction and predicts poor prognosis in patients with hepatitis B virus-associated hepatocellular carcinoma. Hepatology. (2012) 56:1342–51. doi: 10.1002/hep.25777
11. Zhuang XW, Zhang XN, Xia XY, Zhang CJ, Liang XH, Gao LF, et al. Ectopic expression of TIM-3 in lung cancers: a potential independent prognostic factor for patients with NSCLC. Am J Clin Pathol. (2012) 137:978–85. doi: 10.1309/AJCP9Q6OVLVSHTMY
12. Komohara Y, Morita T, Annan DA, Horlad H, Ohnishi K, Yamada S, et al. The coordinated actions of TIM-3 on cancer and myeloid cells in the regulation of tumorigenicity and clinical prognosis in clear cell renal cell carcinomas. Cancer Immunol Res. (2015) 3:999–1007. doi: 10.1158/2326-6066.CIR-14-0156
13. Yang M, Yu Q, Liu J, Fu W, Cao Y, Yu L, et al. T-cell immunoglobulin mucin-3 expression in bladder urothelial carcinoma: clinicopathologic correlations and association with survival. J Surg Oncol. (2015) 112:430–5. doi: 10.1002/jso.24012
14. Wu JL, Lin GW, Zhu Y, Zhang HL, Shi GH, Shen YJ, et al. Low TIM3 expression indicates poor prognosis of metastatic prostate cancer and acts as an independent predictor of castration resistant status. Sci Rep. (2017) 7:8869. doi: 10.1038/s41598-017-09484-8
15. Jan M, Chao MP, Cha AC, Alizadeh AA, Gentles AJ, Weissman IL, et al. Prospective separation of normal and leukemic stem cells based on differential expression of TIM3, a human acute myeloid leukemia stem cell marker. Proc Natl Acad Sci USA. (2011) 108:5009–14. doi: 10.1073/pnas.1100551108
16. Liu F, Liu Y, Chen Z. Tim-3 expression and its role in hepatocellular carcinoma. J Hematol Oncol. (2018) 11:126. doi: 10.1186/s13045-018-0667-4
17. Das M, Zhu C, Kuchroo VK. Tim-3 and its role in regulating anti-tumor immunity. Immunol Rev. (2017) 276:97–111. doi: 10.1111/imr.12520
18. Qin S, Xu L, Yi M, Yu S, Wu K, Luo S. Novel immune checkpoint targets: moving beyond PD-1 and CTLA-4. Mol Cancer. (2019) 18:155. doi: 10.1186/s12943-019-1091-2
19. Lan Y, Hu X, Jiang K, Yuan W, Zheng F, Chen H. Significance of the detection of TIM-3 and FOXJ1 in prostate cancer. J BUON. (2017) 22:1017–21.
20. Moher D, Liberati A, Tetzlaff J, Altman DG. Preferred reporting items for systematic reviews and meta-analyses: the PRISMA statement. PLoS Med. (2009) 6:e1000097. doi: 10.1371/journal.pmed.1000097
21. Ye Z, Zheng Z, Li X, Zhu Y, Zhong Z, Peng L, et al. B7-H3 overexpression predicts poor survival of cancer patients: a meta-analysis. Cell Physiol Biochem. (2016) 39:1568–80. doi: 10.1159/000447859
22. Tierney JF, Stewart LA, Ghersi D, Burdett S, Sydes MR. Practical methods for incorporating summary time-to-event data into meta-analysis. Trials. (2007) 8:16. doi: 10.1186/1745-6215-8-16
23. Stang A. Critical evaluation of the Newcastle-Ottawa scale for the assessment of the quality of nonrandomized studies in meta-analyses. Eur J Epidemiol. (2010) 25:603–5. doi: 10.1007/s10654-010-9491-z
24. Gyorffy B, Surowiak P, Budczies J, Lanczky A. Online survival analysis software to assess the prognostic value of biomarkers using transcriptomic data in non-small-cell lung cancer. PLoS ONE. (2013) 8:e82241. doi: 10.1371/journal.pone.0082241
25. Szasz AM, Lanczky A, Nagy A, Forster S, Hark K, Green JE, et al. Cross-validation of survival associated biomarkers in gastric cancer using transcriptomic data of 1,065 patients. Oncotarget. (2016) 7:49322–33. doi: 10.18632/oncotarget.10337
26. Gyorffy B, Lanczky A, Eklund AC, Denkert C, Budczies J, Li Q, et al. An online survival analysis tool to rapidly assess the effect of 22,277 genes on breast cancer prognosis using microarray data of 1,809 patients. Breast Cancer Res Treat. (2010) 123:725–31. doi: 10.1007/s10549-009-0674-9
27. Egger M, Smith GD, Schneider M, Minder C. Bias in meta-analysis detected by a simple, graphical test. BMJ. (1997) 315:629–34. doi: 10.1136/bmj.315.7109.629
28. Jiang J, Jin MS, Kong F, Cao D, Ma HX, Jia Z, et al. Decreased galectin-9 and increased Tim-3 expression are related to poor prognosis in gastric cancer. PLoS ONE. (2013) 8:e81799. doi: 10.1371/journal.pone.0081799
29. Cao Y, Zhou X, Huang X, Li Q, Gao L, Jiang L, et al. Tim-3 expression in cervical cancer promotes tumor metastasis. PLoS ONE. (2013) 8:e53834. doi: 10.1371/journal.pone.0053834
30. Zhou EC, Huang Q, Wang J, Fang CF, Yang LL, Zhu M, et al. Up-regulation of Tim-3 is associated with poor prognosis of patients with colon cancer. Int J Clin Exp Pathol. (2015) 8:8018–27.
31. Shan B, Man H, Liu J, Wang L, Zhu T, Ma M, et al. TIM-3 promotes the metastasis of esophageal squamous cell carcinoma by targeting epithelial-mesenchymal transition via the Akt/GSK-3beta/Snail signaling pathway. Oncol Rep. (2016) 36:1551–61. doi: 10.3892/or.2016.4938
32. Hou N, Ma J, Li W, Zhao L, Gao Q, Mai L. T-cell immunoglobulin and mucin domain-containing protein-3 and galectin-9 protein expression: potential prognostic significance in esophageal squamous cell carcinoma for Chinese patients. Oncol Lett. (2017) 14:8007–13. doi: 10.3892/ol.2017.7188
33. Peng PJ, Li Y, Sun S. On the significance of Tim-3 expression in pancreatic cancer. Saudi J Biol Sci. (2017) 24:1754–7. doi: 10.1016/j.sjbs.2017.11.006
34. Byun KD, Hwang HJ, Park KJ, Kim MC, Cho SH, Ju MH, et al. T-cell immunoglobulin mucin 3 expression on tumor infiltrating lymphocytes as a positive prognosticator in triple-negative breast cancer. J Breast Cancer. (2018) 21:406–14. doi: 10.4048/jbc.2018.21.e61
35. Duan JJ, Xie YW, Qu LJ, Wang LX, Zhou SK, Wang Y, et al. A nomogram-based immunoprofile predicts overall survival for previously untreated patients with esophageal squamous cell carcinoma after esophagectomy. J Immunother Cancer. (2018) 6:100. doi: 10.1186/s40425-018-0418-7
36. Cheng S, Han F, Xu Y, Qu T, Ju Y. Expression of Tim-3 in breast cancer tissue promotes tumor progression. Int J Clin Exp Pathol. (2018) 11:1157–66.
37. Zhao Y, Chen D, Wang W, Zhao T, Wen J, Zhang F, et al. Significance of TIM-3 expression in resected esophageal squamous cell carcinoma. Ann Thorac Surg. (2020) 109:1551–7. doi: 10.1016/j.athoracsur.2019.12.017
38. Hong MH, Shin SJ, Shin SK, Kim DJ, Zo JI, Shim YM, et al. High CD3 and ICOS and low TIM-3 expression predict favourable survival in resected oesophageal squamous cell carcinoma. Sci Rep. (2019) 9:20197. doi: 10.1038/s41598-019-56828-7
39. Pu FF, Chen FX, Zhang ZC, Qing XC, Lin H, Zhao L, et al. TIM-3 expression and its association with overall survival in primary osteosarcoma. Oncol Lett. (2019) 18:5294–300. doi: 10.3892/ol.2019.10855
40. Zhou JP, Jiang Y, Zhang HY, Chen L, Luo P, Li L, et al. Clinicopathological implications of TIM3(+) tumor-infiltrating lymphocytes and the miR-455-5p/Galectin-9 axis in skull base chordoma patients. Cancer Immunol Immun. (2019) 68:1157–69. doi: 10.1007/s00262-019-02349-1
41. Su H, Xie HK, Dai CY, Ren YJ, She YL, Xu L, et al. Characterization of TIM-3 expression and its prognostic value in patients with surgically resected lung adenocarcinoma. Lung Cancer. (2018) 121:18–24. doi: 10.1016/j.lungcan.2018.04.009
42. Jia K, He Y, Dziadziuszko R, Zhao S, Zhang X, Deng J, et al. T cell immunoglobulin and mucin-domain containing-3 in non-small cell lung cancer. Transl Lung Cancer Res. (2019) 8:895–906. doi: 10.21037/tlcr.2019.11.17
43. Onengut-Gumuscu S, Concannon P. Mapping genes for autoimmunity in humans: type 1 diabetes as a model. Immunol Rev. (2002) 190:182–94. doi: 10.1034/j.1600-065X.2002.19014.x
44. Encinas JA, Kuchroo VK. Mapping and identification of autoimmunity genes. Curr Opin Immunol. (2000) 12:691–7. doi: 10.1016/S0952-7915(00)00164-3
45. Meyers JH, Sabatos CA, Chakravarti S, Kuchroo VK. The TIM gene family regulates autoimmune and allergic diseases. Trends Mol Med. (2005) 11:362–9. doi: 10.1016/j.molmed.2005.06.008
46. Tan S, Xu Y, Wang Z, Wang T, Du X, Song X, et al. Tim-3 hampers tumor surveillance of liver-resident and conventional NK cells by disrupting PI3K signaling. Cancer Res. (2020) 80:1130–42. doi: 10.1158/0008-5472.CAN-19-2332
47. Yoneda A, Jinushi M. T cell immunoglobulin domain and mucin domain-3 as an emerging target for immunotherapy in cancer management. ImmunoTargets Ther. (2013) 2:135–41. doi: 10.2147/ITT.S38296
48. Yan W, Liu X, Ma H, Zhang H, Song X, Gao L, et al. Tim-3 fosters HCC development by enhancing TGF-β-mediated alternative activation of macrophages. Gut. (2015) 64:1593–604. doi: 10.1136/gutjnl-2014-307671
49. Wiener Z, Kohalmi B, Pocza P, Jeager J, Tolgyesi G, Toth S, et al. TIM-3 is expressed in melanoma cells and is upregulated in TGF-beta stimulated mast cells. J Invest Dermatol. (2007) 127:906–14. doi: 10.1038/sj.jid.5700616
50. Zhang H, Song Y, Yang H, Liu Z, Gao L, Liang X, et al. Tumor cell-intrinsic Tim-3 promotes liver cancer via NF-κB/IL-6/STAT3 axis. Oncogene. (2018) 37:2456–68. doi: 10.1038/s41388-018-0140-4
51. Xiao YY, Qing JL, Li BX, Chen LY, Nong SZ, Yang WH, et al. TIM-3 participates in the invasion and metastasis of nasopharyngeal carcinoma via SMAD7/SMAD2/SNAIL1 axis-mediated epithelial-mesenchymal transition. OncoTargets Ther. (2020) 13:1993–2006. doi: 10.2147/OTT.S237222
52. Okazaki T, Honjo T. PD-1 and PD-1 ligands: from discovery to clinical application. Int Immunol. (2007) 19:813–24. doi: 10.1093/intimm/dxm057
53. Berger KN, Pu JJ. PD-1 pathway and its clinical application: a 20year journey after discovery of the complete human PD-1 gene. Gene. (2018) 638:20–5. doi: 10.1016/j.gene.2017.09.050
54. Yi M, Jiao D, Xu H, Liu Q, Zhao W, Han X, et al. Biomarkers for predicting efficacy of PD-1/PD-L1 inhibitors. Mol Cancer. (2018) 17:129. doi: 10.1186/s12943-018-0864-3
55. Zhao X, Subramanian S. Intrinsic resistance of solid tumors to immune checkpoint blockade therapy. Cancer Res. (2017) 77:817–22. doi: 10.1158/0008-5472.CAN-16-2379
56. Topalian SL, Drake CG, Pardoll DM. Immune checkpoint blockade: a common denominator approach to cancer therapy. Cancer Cell. (2015) 27:450–61. doi: 10.1016/j.ccell.2015.03.001
57. Fourcade J, Sun Z, Benallaoua M, Guillaume P, Luescher IF, Sander C, et al. Upregulation of Tim-3 and PD-1 expression is associated with tumor antigen-specific CD8+ T cell dysfunction in melanoma patients. J Exp Med. (2010) 207:2175–86. doi: 10.1084/jem.20100637
58. Hahn AW, Gill DM, Pal SK, Agarwal N. The future of immune checkpoint cancer therapy after PD-1 and CTLA-4. Immunotherapy. (2017) 9:681–92. doi: 10.2217/imt-2017-0024
59. Sakuishi K, Apetoh L, Sullivan JM, Blazar BR, Kuchroo VK, Anderson AC. Targeting Tim-3 and PD-1 pathways to reverse T cell exhaustion and restore anti-tumor immunity. J Exp Med. (2010) 207:2187–94. doi: 10.1084/jem.20100643
60. Solinas C, De Silva P, Bron D, Willard-Gallo K, Sangiolo D. Significance of TIM3 expression in cancer: from biology to the clinic. Semin Oncol. (2019) 46:372–9. doi: 10.1053/j.seminoncol.2019.08.005
Keywords: TIM-3, solid tumor, prognosis, overall survival, meta-analysis
Citation: Qin S, Dong B, Yi M, Chu Q and Wu K (2020) Prognostic Values of TIM-3 Expression in Patients With Solid Tumors: A Meta-Analysis and Database Evaluation. Front. Oncol. 10:1288. doi: 10.3389/fonc.2020.01288
Received: 08 May 2020; Accepted: 22 June 2020;
Published: 04 August 2020.
Edited by:
Alexandr Bazhin, LMU Munich University Hospital, GermanyReviewed by:
Mazdak Ganjalikhani Hakemi, Isfahan University of Medical Sciences, IranLifen Gao, Shandong University, China
Copyright © 2020 Qin, Dong, Yi, Chu and Wu. This is an open-access article distributed under the terms of the Creative Commons Attribution License (CC BY). The use, distribution or reproduction in other forums is permitted, provided the original author(s) and the copyright owner(s) are credited and that the original publication in this journal is cited, in accordance with accepted academic practice. No use, distribution or reproduction is permitted which does not comply with these terms.
*Correspondence: Kongming Wu, d3VrbV9sYWJAMTYzLmNvbQ==