 Yi-Qing Jiang1†Qin Gao1†Han Chen1Xiang-Xiang Shi1
 Jing-Bo Wu1
 Yue Chen2Yan Zhang2
 Hao-Wen Pang1*
 Sheng Lin1,2*
- 1Department of Oncology, The Affiliated Hospital of Southwest Medical University, Luzhou, China
- 2Nuclear Medicine and Molecular Imaging Key Laboratory of Sichuan Province, The Affiliated Hospital of Southwest Medical University, Luzhou, China
Background: Positron emission tomography is known to provide more accurate estimates than computed tomography when staging non–small cell lung cancer. The aims of this prospective study were to contrast the short-term efficacy of the two imaging methods while evaluating the effects of hypo-fractionated radiotherapy in non-small cell lung cancer, and to establish a short-term efficacy prediction model based on the radiomics features of positron emission tomography.
Methods: This nonrandomized-controlled trial was conducted from March 2015 to June 2019. Thirty-one lesions of 30 patients underwent the delineation of the regions of interest on positron emission tomography and computed tomography 1 month before, and 3 months after hypo-fractionated radiotherapy. Each patient was evaluated for the differences in local objective response rate between the two images. The Kaplan Meier method was used to analyze the local objective response and subsequent survival duration of the two imaging methods. The 3D Slicer was used to extract the radiomics features based on positron emission tomography. Least absolute shrinkage and selection operator regression was used to eliminate redundant features, and logistic regression analysis was used to develop the curative-effect-predicting model, which was displayed through a radiomics nomogram. Receiver operating characteristic curve and decision curve were used to evaluate the accuracy and clinical usefulness of the prediction model.
Results: Positron emission tomography-based local objective response rate was significantly higher than that based on computed tomography [70.97% (22/31) and 12.90% (4/31), respectively (p<0.001)]. The mean survival time of responders and non-responders assessed by positron emission tomography was 28.6 months vs. 11.4 months (p=0.29), whereas that assessed by computed tomography was 24.5 months vs. 26 months (p=0.66), respectively. Three radiomics features were screened to establish a personalized prediction nomogram with high area under curve (0.94, 95% CI 0.85–0.99, p<0.001). The decision curve showed a high clinical value of the radiomics nomogram.
Conclusions: We recommend positron emission tomography for evaluating the short-term efficacy of hypo-fractionated radiotherapy in non-small cell lung cancer, and that the radiomics nomogram could be an important technique for the prediction of short-term efficacy, which might enable an improved and precise treatment.
Registration number/URL: ChiCTR1900027768/http://www.chictr.org.cn/showprojen.aspx?proj=46057
Introduction
Lung cancer is the most common cancer type and the leading cause of cancer-associated mortality worldwide (1). Hypo-fractionated radiotherapy (HFRT) includes stereotactic body radiation therapy (SBRT) and hypo-fractionated brachytherapy, both of which deliver a high biologically effective dose (BED) to the tumor while minimizing toxicity to the normal tissues. Therefore, HFRT can prompt superior local control and improved survival (2).
Currently, lung cancer treatment efficacy evaluation is mostly based on computed tomography (CT) (3). However, CT being a structural imaging, has limited value in the detection of an early response to therapy, and the tumors could be obscured by atelectasis and radiation pneumonitis (4). Instead, functional imaging with 18F-fludeoxyglucose positron emission tomography (18F-FDG PET) may promote accurate and early assessment of therapy response (5–7). In addition, recent studies have demonstrated that radiomics has been successfully used to stage the tumor, assess the side effects, and predict the clinical endpoints in lung cancer (8–10). However, to our knowledge, few studies have focused on contrasting the efficacy of PET and CT in peripheral non-small cell lung cancer (NSCLC) after HFRT treatment as well as on the development of a prediction model of local short-term efficacy based on PET radiomics.
Therefore, the main objectives of this prospective trial were to investigate the differences between short-term efficacy of PET and CT while evaluating the effects of HFRT in peripheral NSCLC, and to screen the efficacy-related radiomics features of PET imaging and use those to establish a prediction model.
Materials and Methods
Patients
PET imaging was performed as a part of the phase I/II clinical trial (Clinicaltrials.gov number: ChiCTR1900027768) that evaluated the efficacy of HFRT in patients with pathologically confirmed NSCLC. The patients who underwent HFRT for primary NSCLC (T2-4N0-3M0-1) at our hospital, between March 2015 and June 2019 were enrolled in this study. Eventually, 31 lesions of 30 patients underwent serial 18F-FDG PET/CT 1 month before HFRT and 3 months after HFRT on the same scanner. The TNM stage was designated according to the American Joint Committee on Cancer Staging 8th edition (AJCC) (11). The N and M staging was based on pre-treatment PET/CT and magnetic resonance imaging (MRI). Additionally, all patients underwent pathological diagnosis for the lung lesion before undergoing treatment. The first follow-up imaging examination was performed 4–12 weeks after radiotherapy. After that, patients were monitored every three months in the first year, every six months in the next two years, and once a year thereafter. Because the patients lived in remote places, the scan was occasionally performed outside these limits. The study was approved by the Research Ethics Committee of the Affiliated Hospital of Southwest Medical University (Date of approval by ethics committee and approval number: 2013-8-26, and KY2019276, respectively) and conducted in accordance with the Declaration of Helsinki (as revised in 2013) and its later amendments or comparable ethical standards. Written informed consent was obtained from all individual participants included in the study.
Treatment
All patients were treated with radiotherapy planning system (TPS) (Oncentra 4.3, Elekta, Sweden). Then, 19 out of 30 patients were treated with hypo-fractionated brachytherapy, delivered with an 192Ir source from a MicroSelectron afterloader (Elekta Brachytherapy, Elekta AB, Stockholm, Sweden), and these patients were administered a single dose of 30Gy, as recommended by a previous clinical trial (12). The remaining 11 patients were treated with SBRT that was delivered in 3–5 fractions to a total of 23–50Gy. After radiotherapy, concurrent platinum-based doublet adjuvant chemotherapy was allowed. In addition to cisplatin (or carboplatin), a second concurrent nonplatinum agent was required (e.g., paclitaxel, etoposide).
PET and CT Scanning Acquisition and Processing
Patients fasted for at least 6 h before 18F-FDG was administered. The patient’s blood glucose level should have been ≤ 11 mmol/L. The PET-CT was performed according to the European Association of Nuclear Medicine (EANM) guidelines version 1.0 (13). A whole-body PET-CT (Philips Gemini TF/16; Philips, Cleveland, Ohio, USA) was performed after the intravenous administration of 18F-FDG (5.55 MB q/kg). Then, low-dose helical CT transmission scanning (pitch, 0.813; current, 100 mAs; peak voltage, 120 kV; slice thickness, 5.0 mm) was performed with attenuation correction and lesion localization. PET was then performed at 1.5 min per bed position and used 19–21 bed positions. 18F-PET/CT scanning was performed from the vertex of the head to the feet. In order to reduce the impact of respiratory motion on image acquisition and ensure the credibility of the research results, chest scans were conducted after having the patients hold their breath.
Assessment of Local Objective Response Rate
The PET-only and CT-only images were both sent to the three-dimensional (3D) radiotherapy planning system (TPS) (Oncentra 4.3, Elekta, Sweden) via the local area network. One physician with more than 15 years of experience with PET and CT in peripheral lung cancer and regions of interest (ROI) definition performed the analyses after being blinded to the patient outcome data. Nodal disease was not included in the analysis. PET-based ROI delineation was carried out before and after HFRT with standard uptake value (SUV) of 2.5 as the initial threshold (14, 15). Mean standard uptake value (SUVmean), maximum standard uptake value (SUVmax), metabolic tumor volume (MTV), and longest diameter (Dmax) were calculated for the ROI based on PET. CT-based ROI was manually drawn by the same physician with lung windows (window width, 1600 Hounsfield units [HU]; window level, 600 HU). Volume and longest diameter from the ROI based on CT were also calculated. CT-only scans were assessed for response using Response evaluation criteria in solid tumors (RECIST1.1) (16) after the treatment, and PET-based response criteria used in this study were according to the European Organization for Research and Treatment of Cancer (EORTC) (17) that were based on an assessment of the SUVmax measured through ROI analysis. The terms for the response categories were the same for both CT and PET: complete response (CR), partial response (PR), stable disease (SD), and progressive disease (PD).
Radiomic Processing
The workflow for radiomic processing included the following four steps: image acquisition and reconstruction, image segmentation, feature extraction, and data analysis (18, 19). The first two steps involving collection of PET images and delineation of the ROI were described in the above section. The feature extraction and definition in this study were consistent with the Imaging Biomarker Standardization Initiative (IBSI) (20). The feature extraction process was divided into image processing and feature calculation. For each ROI based on PET image, a resampled 4×4×4 mm3 voxel size and a bin width of 25 were applied (21). After image processing, Due to the characteristics of medical images, filter properties are important for image analysis methods. Filtering properties including geometric invariances for medical image analysis directional sensitivity, combining directional sensitivity and invariance to local rotations, spectral coverage (22). We used wavelet which is a filtering method based on a collection with eight combinations of applying either a high or a low pass filter and cover the entire image spectrum as study filter. Wavelets families contains the following wavelet groups: “haar,” “db,” “sym,” “coif,” “bior,” “rbio,” “dmey” (22). After those, all feature classes with the exception of shape can be calculated on the original image and a derived image which obtained by applying wavelets filter. Feature extraction was based on the 3Dslicer platform and used the pyradiomics package, which is available at: http://PyRadiomics.readthedocs.io/en/latest/, accessed June 30, 2019 (23).
Statistical Analysis
We assessed the differences between all parameters observed by CT and PET using the Wilcoxon signed-rank test or paired t test after ascertaining whether the parameters were normally distributed using the Shapiro-Wilks test. The delta-parameters of the CT and PET were identified by the prefix “Δ.”
Tumor response to HFRT was analyzed using PET and CT independently. Patients were then grouped as responders (CR+PR) or non-responders (SD+PD). The difference of ORR between PET and CT was assessed using the Mann-Whitney U test. The Kaplan Meier method was used to analyze the local objective response and subsequent survival duration of the two imaging methods.
The least absolute shrinkage and selection operator (LASSO) regression analysis was used to screen out the radiomics features related to responders, and logistic regression analysis was used to develop the curative-effect-predicting model. To assess the probability of short-term efficacy in individuals, we built the radiomics nomogram based on multivariable logistic analysis. Receiver operating characteristic (ROC) curve and area under the curve (AUC) were used to assess the accuracy of the prediction model. To ensure radiomic robustness, we performed 1,000 bootstrap resamples to check the agreement between our prediction based on radiomics and actual observation. The net benefit was quantified by the decision curve analysis to determine the clinical applicability of the PET-based radiomics nomogram prediction model.
All statistical analyses were performed using SPSS, Version 17.0 software (SPSS, Inc., Chicago, IL) and R software, version 3.6.3 (R Foundation for Statistical Computing, Vienna, Austria), using the glmnet, rms, and pROC analysis packages for Windows. The level of statistical significance was defined as a p value less than 0.05 based on 2-sided tests.
Results
Baseline Characteristics and Follow-Up
From March 2015 to June 2019, 30 patients with peripheral NSCLC were enrolled. The baseline clinical characteristics of these patients are listed in Tables 1 and 2.
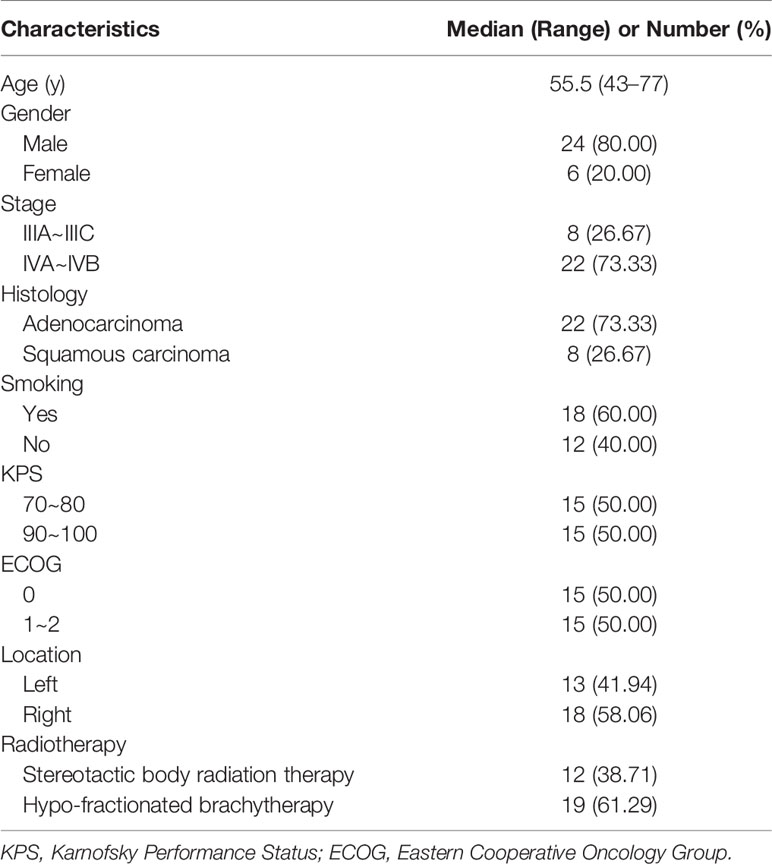
Table 1 Characteristics of the patients.
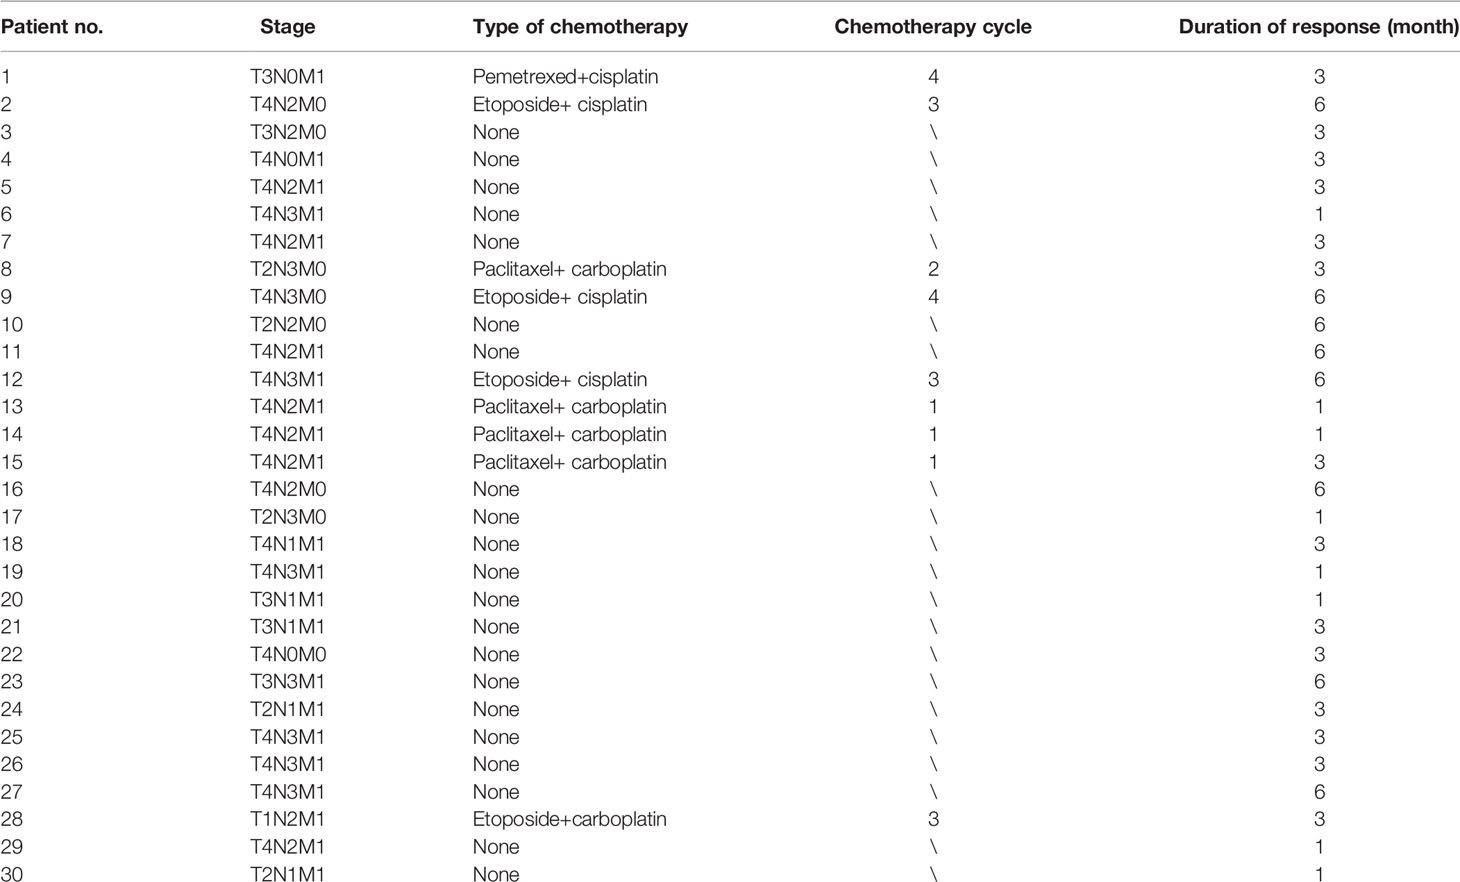
Table 2 Patient TNM staging, duration and type of chemotherapy, and duration of response.
Survival was measured from the date of completing radiotherapy to the date of death from any cause since April 2020. Patients who were still alive at the date of last contact were censored at deadline. Only one patient was lost to follow-up before the deadline date; nine patients died and the rest were still alive. Estimated median follow-up duration was 16 months.
Comparison of PET- and CT-based Response Assessments
The PET based efficacy in all 31 lesions was assessed as CR (n=0), PR (n=22), SD (n=6), and PD (n=3), while the same according to CT was CR (n=0), PR (n=4), SD (n=23) and PD (n=4). Comparisons for all patients are shown in Figure 1. For these patients assessable by both PET and CT, there was a poor agreement between the two assessments, with a weighted kappa value of 0.114. A significantly higher number of patients were regarded as responders on PET than on CT in the patients assessable by both techniques (22 vs. four patients respectively; p<0.001). All differences between parameters observed by CT and PET are listed in Table 3. A representative case of an individual patient exemplifying the different CT and PET/CT response is shown in Figure 2.
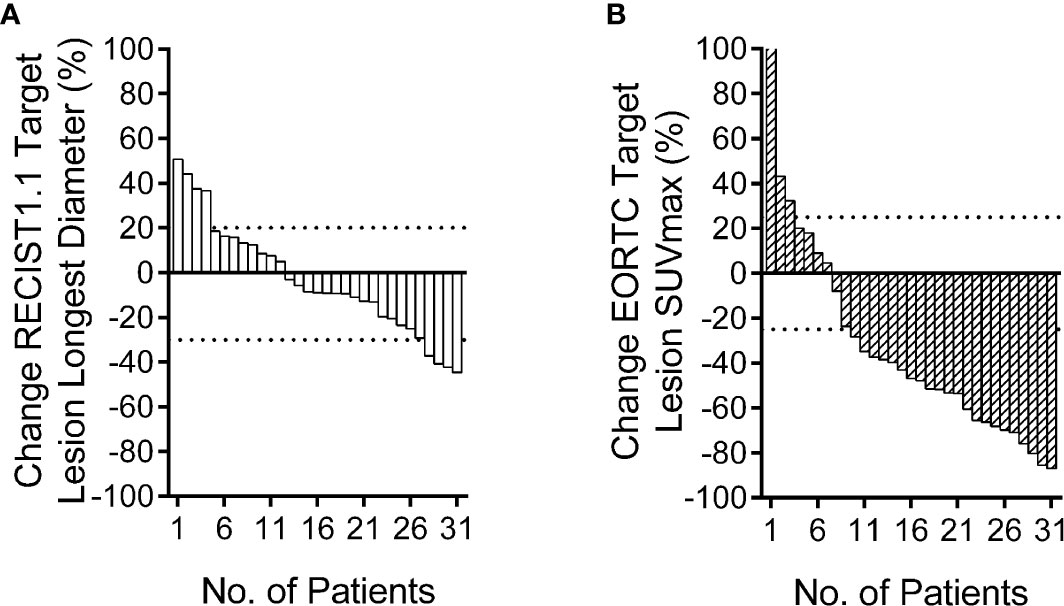
Figure 1 Relative change rate of longest diameter and maximum standard uptake value (SUVmax) in each patient. Best overall response waterfall plots, in which computed tomography (CT) (A) is based on the rate of longest diameter changes, according to RECIST 1.1, and positron emission tomography (PET) (B) is based on the rate of SUVmax changes, according to European Organization for Research and Treatment of Cancer (EORTC). The top dotted line represents progressive disease, the bottom dotted line represents partial response, or complete response, while, stable disease is represented by the area between the two dotted lines.
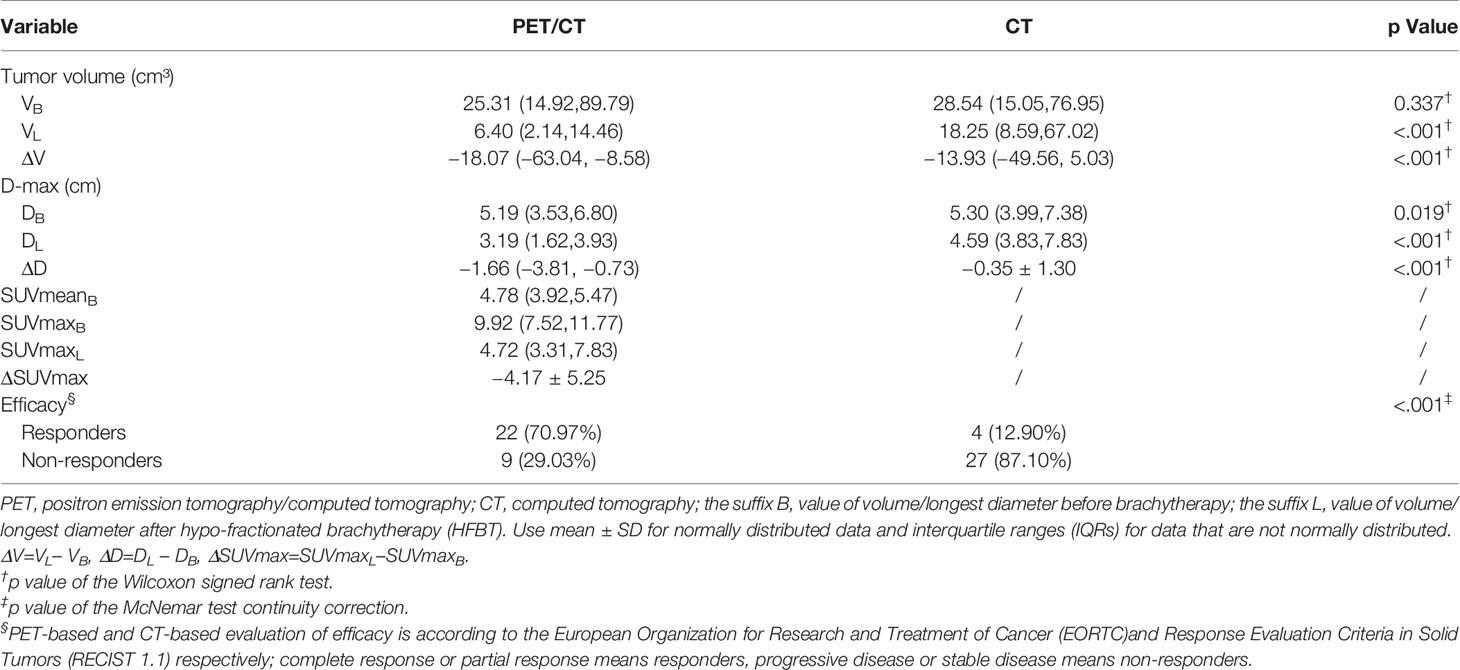
Table 3 Comparison of difference variables and short-term efficacy assessment based on PET and CT.
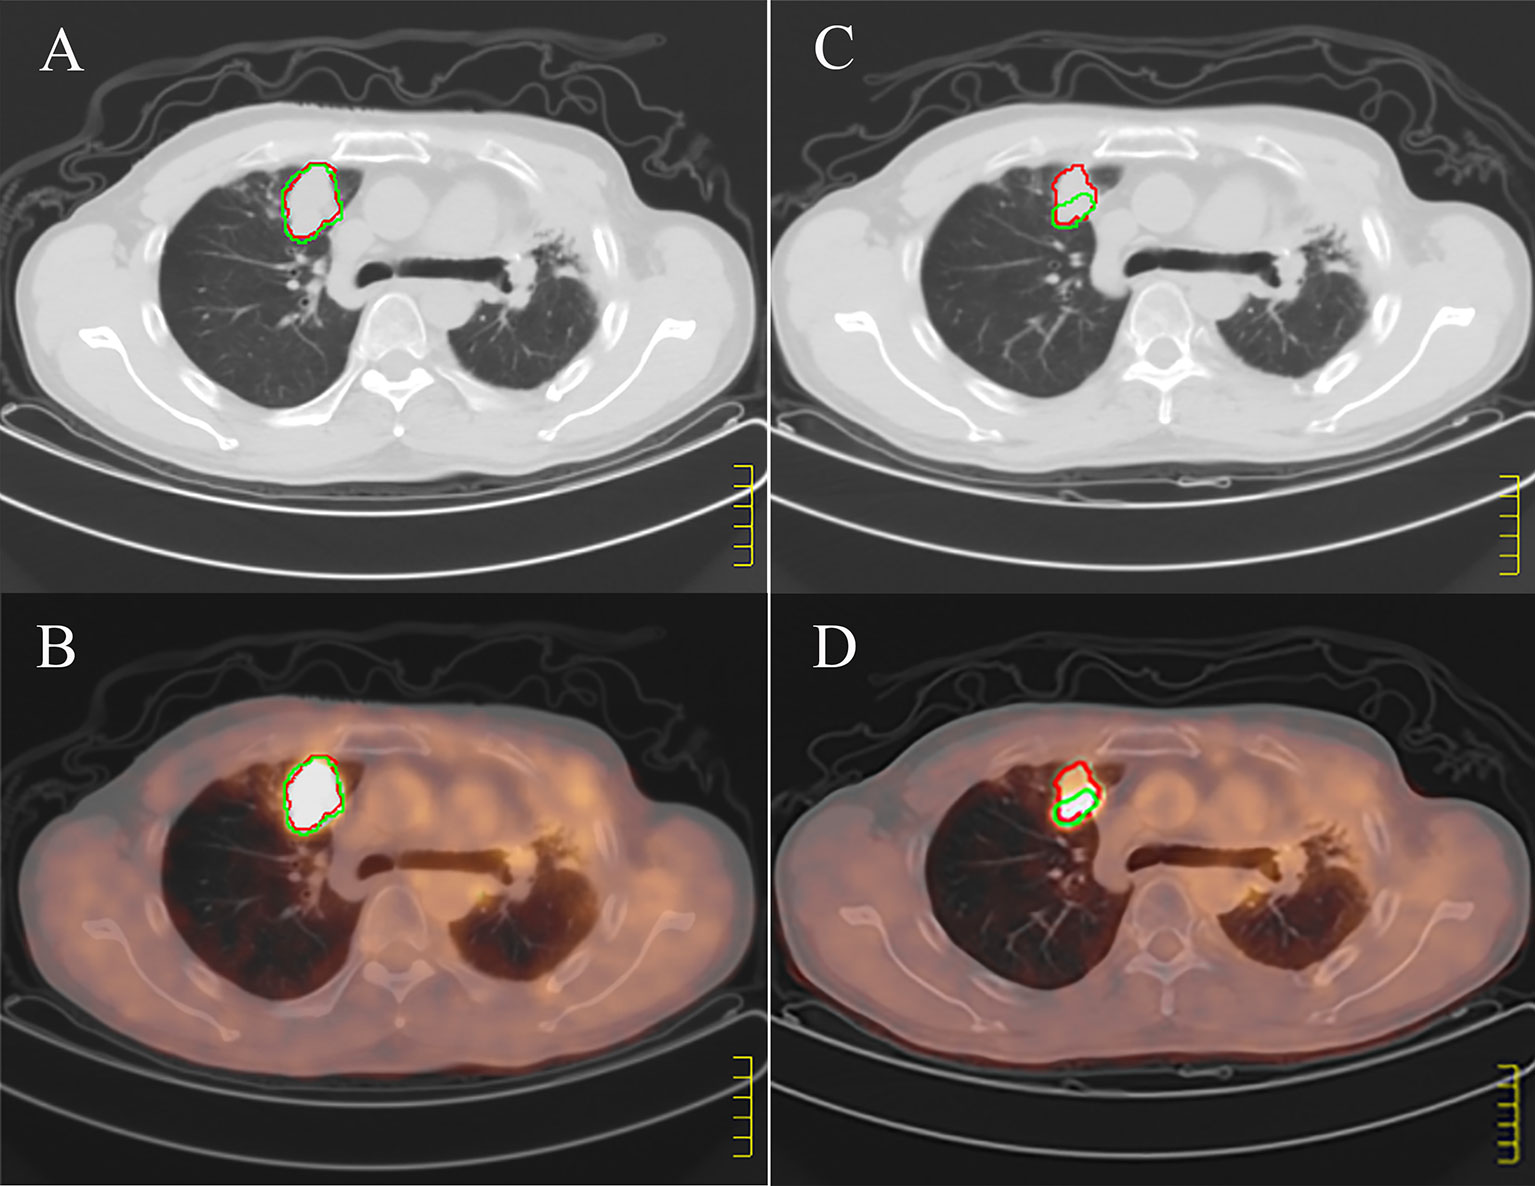
Figure 2 Example of discordant positron emission tomography (PET/CT) and computed tomography (CT). (A, B) show pretreatment CT and PET/CT images respectively, and (C, D) show CT and PET/CT images of the large tumors 3 months after treatment. The red regions of interest (ROI) is manually segmented based on CT, and the green ROI is delineated according to SUV value higher than 2.5 based on PET. According to the images before and after treatment, CT shows stable disease; PET/CT shows partial response.
Effect of Chemotherapy on Treatment Evaluation
In order to explore the effect of chemotherapy after radiotherapy on the evaluation of short-term efficacy, the patients were divided into two groups: post radiotherapy chemotherapy group (Chemotherapy) and non-chemotherapy treatment group (None). The difference of curative effect between the two groups was compared. The results showed that there was no significant difference between the patients receiving chemotherapy and those who did not receive chemotherapy (Figure 3, p=0.374), that is, no matter whether chemotherapy was carried out after radiotherapy, the short-term efficacy evaluation of patients had no influence.
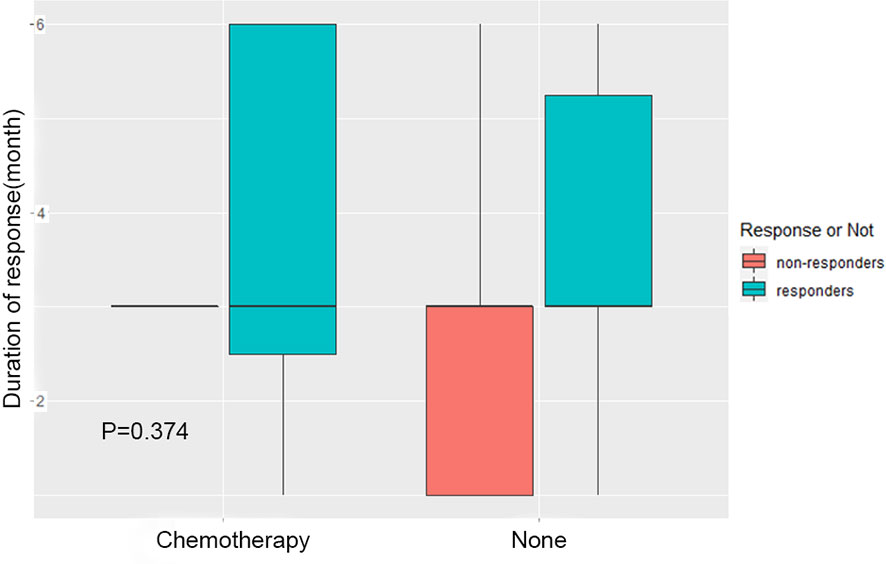
Figure 3 Effect of chemotherapy on treatment evaluation. The patients were divided into two groups: chemotherapy group after radiotherapy (Chemotherapy) and group without chemotherapy after radiotherapy (None). The difference of short-term efficacy between the two groups was compared.
Prognostic Significance of Response Assessments
The mean survival time of responders and non-responders assessed by PET was 28.6 months vs. 11.4 months, whereas that assessed by CT was 24.5 months vs. 26 months, respectively. In PET assessment, the survival duration of responders was longer than that of non-responders, whereas CT assessment had the opposite result. Thus, the PET responses seem to be stronger prognostic indicators than the CT responses. However, neither the PET nor CT scan assessments of response had a significant difference in subsequent survival duration between the responders and non-responders (Figures 4A, B).
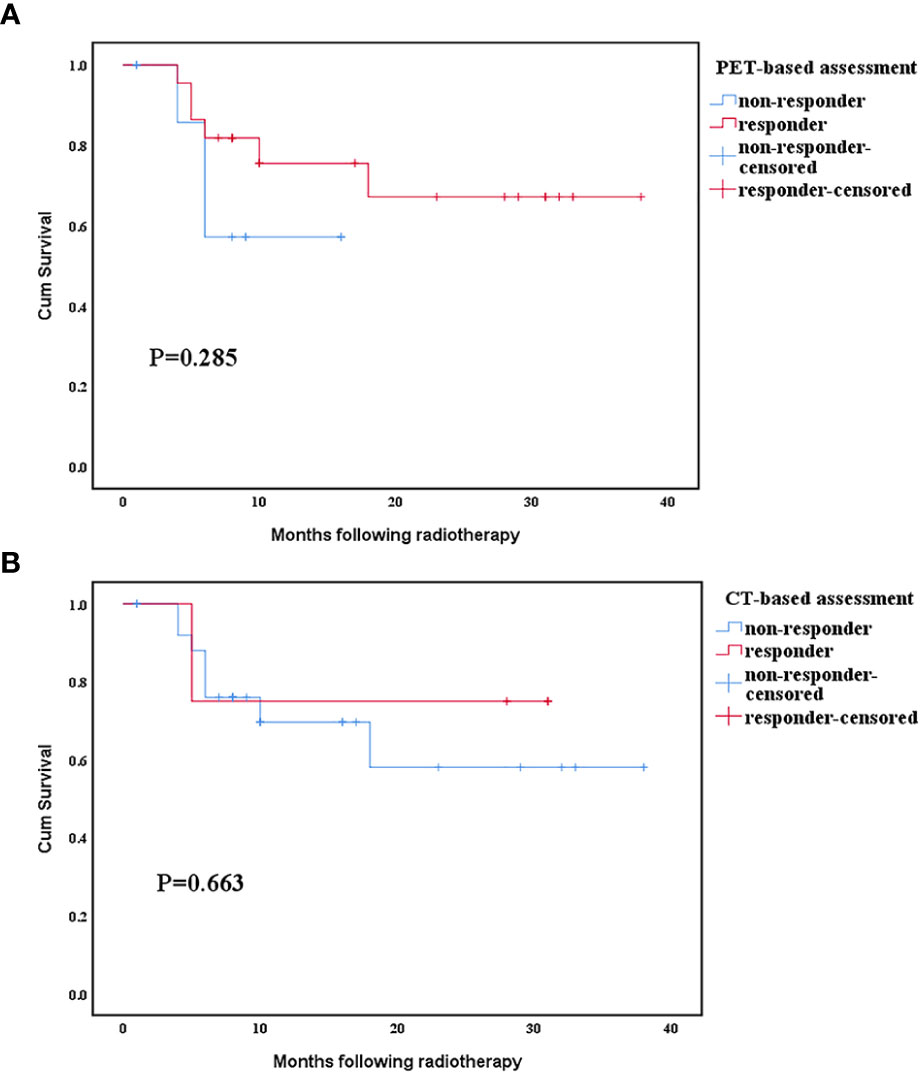
Figure 4 Relationship between survival time and response evaluated by positron emission tomography (PET) and computed tomography (CT) scan. (A) Comparison of positron emission tomography scan response categories. (B) Comparison of computed tomography scan response categories.
Radiomics Feature Selection and Response Prediction
All 851 radiomics features were extracted, including Shape features, First Order statistical features, Gray Level Co-occurrence Matrix (GLCM) features, Gray Level Dependence Matrix (GLDM) features, Gray Level Run Length Matrix (GLRLM) features, Gray Level Size Zone Matrix (GLSZM) features, and Neighboring Gray Tone Difference Matrix (NGTDM) features. Among the radiological features, 851 features were reduced to three potential predictors based on 31 lesions (Figure 5), which were Busyness of NGTDM of wavelet-LHL, Short Run High Gray Level Emphasis of GLRLM of wavelet-LHH, and Median of First order of wavelet-HHH. These three features were used to establish a model that is presented as a nomogram in Figure 6. Based on the ROC curve analysis, the model with high AUC (0.94, 95% CI 0.85–0.99, p<0.001) is presented in Figure 7A, and the decision curve analysis for the model is presented in Figure 7B. The decision curve indicates that if the threshold probability of a patient is 40%, then the use of radiographs from the current study to predict treatment outcomes would add more benefits than the “treat-all-patients” or “treat-none” options.
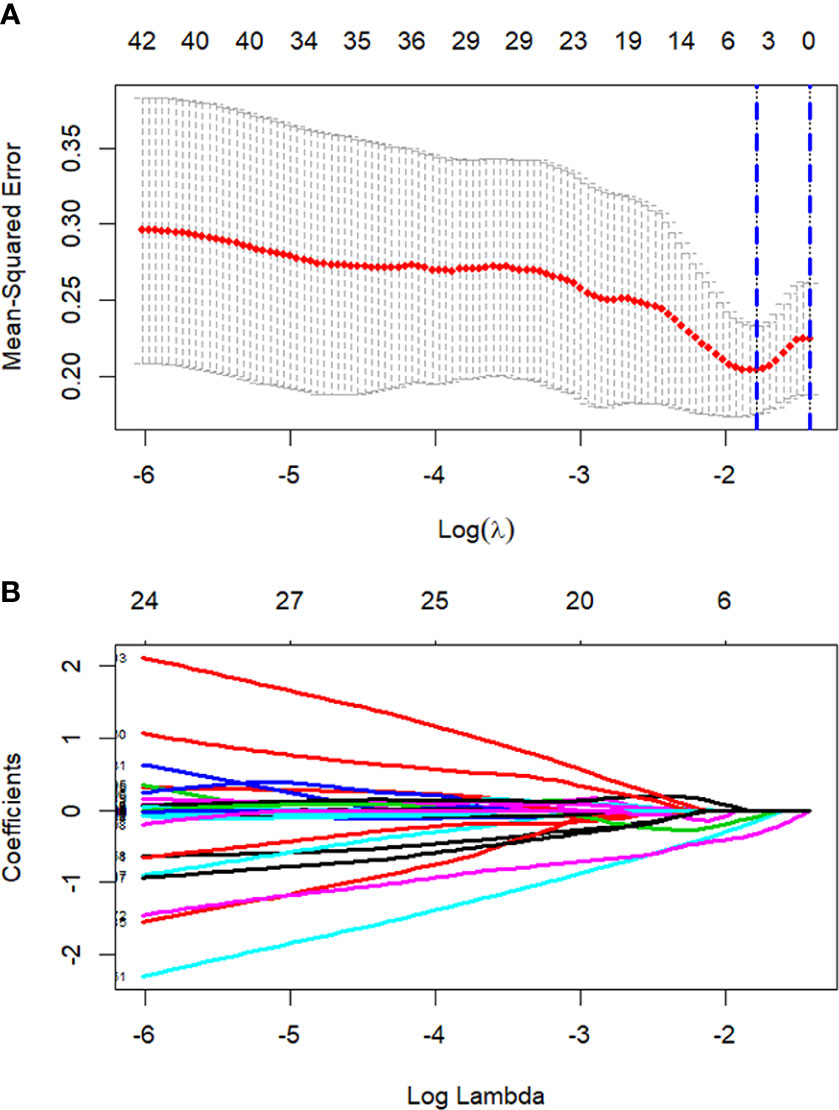
Figure 5 Process of LASSO regression screening of radiomics features. Screening radiomics features using the least absolute shrinkage and selection operator (LASSO) binary logistic regression model. (A) Tuning parameter (λ) in the LASSO model used 5-fold cross-validation. Dotted vertical lines are drawn by using the minimum criteria and the 1 standard error of the minimum criteria. (B) 851 normalized lasso coefficient plots of radiomics features. When log (λ) takes the minimum criteria, three non-zero coefficients are selected.
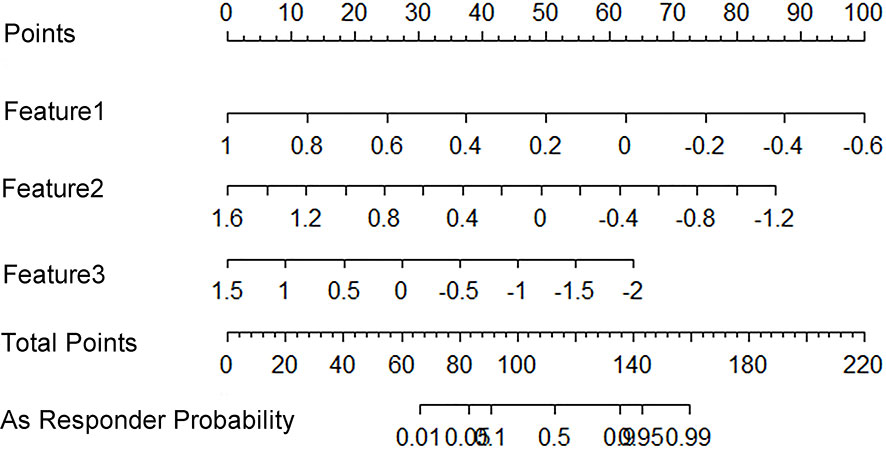
Figure 6 A radiomics nomogram that predicts the probability of effective treatment. Feature1: Wavelet.LHL_NGTDM_Busyness; Feature2: Wavelet.LHH_GLRLM_ShortRunHighGrayLevelEmphasis; Feature3: Wavelet.HHH_Firstorder_Median.

Figure 7 Receiver operating characteristic (ROC) and decision curve for the model. The ROC curve (A) shows the prediction accuracy of the model (AUC 0.94, 95% CI 0.85–0.99, p < 0.001). In the decision curve (B), the red line represents the radiomics nomogram. The gray line represents the assumption that all patients were responders. The thin black line represents the assumption that all patients were non-responders.
Discussion
Currently, CT is the recommended method for response assessment in NSCLC as per the RECIST guidelines. There is insufficient standardization or evidence to abandon anatomical assessment of tumor burden, or to determine if it is appropriate to replace the unidimensional anatomic assessment with either volumetric anatomical assessment or functional assessment with PET (16). Some studies have revealed that PET has better evaluation validity than CT in patients with both NSCLC (7) and small cell lung cancer (24). Our data revealed that among such patients, who are assessable by both techniques, more patients were regarded as responders on PET than on CT. The local ORR of patients according to PET was 70.97%, whereas the corresponding CT evaluation found that to be 12.90%. Moreover, when the efficacy evaluation was compared between CT and PET, only eight lesions (25.81%) were evaluated uniformly, of which, four were evaluated as PR and four were evaluated as SD. Some researchers have previously reported that PET/CT-derived tumor volumes were smaller than those derived by CT alone in case of locally advanced-stage peripheral lung cancer before radiotherapy treatment (25). However, we found that the volumes of ROIs, delineated by PET and CT before HFRT, were similar. In contrast, Dmax of ROIs delineated using PET before and after HFRT, and the volumes of ROIs after HFRT delineated using PET were significantly smaller than that of ROIs outlined using CT, as shown in Table 3, mainly because CT was not very sensitive to distinguish between atelectasis and lung cancer. Moreover, radiation therapy may result in radiation-induced lung opacity (RILO) on CT (5), such as ground-glass opacity, scar or fibrotic changes, consolidation with air-bronchogram, consolidation alone, and nodule. These RILOs may result in a larger size and diameter of the tumor being observed on the CT, which may overestimate the progressive disease during exclusive assessment of efficacy via the CT. A previous study had also suggested that the combined PET/CT to evaluate post-treatment response would increase the correct identification of patients with progressive disease after lung SBRT (26). While investigating the differences in the PET and CT based response assessment, we also report significant statistical differences between the two methods. As shown in Figure 1, only six patients were considered SD based on PET, whereas 23 patients were considered SD based on CT. According to our study, PET assessment is better than CT assessment in reflecting the prognosis of patients. Although there was no significant difference in the survival time between the two groups of patients, this may be due to the small sample size or short follow-up time. Based on the above data, we recommend that PET would be better than CT when evaluating the efficacy of HFRT in NSCLC, since the change in tumor volume may be slower than the metabolic change discernable by PET; additionally, CT scan may not accurately reflect the therapeutic effect on the tumor in time, which may lead to unnecessary overtreatment.
Since each patient’s sensitivity to treatment is inconsistent, the prognosis may be completely different even in patients who are in the same cancer stage and receive the same treatment (27). Therefore, early prediction of treatment response is particularly important for identifying patients who may or may not benefit from treatment.
FDG uptake is not only related to increased metabolism, but also to other physiological parameters, such as cell proliferation (28), perfusion, invasiveness, and hypoxia (29). Therefore, radiomics can obtain several data contained in the PET image through non-invasive means. Many quantitative features of PET can be calculated during treatment of the patient. This principle of extracting image features is termed as “radiomics” that has been recently studied in esophageal cancer (30), NSCLC (31, 32), breast cancer (33), nasopharyngeal carcinoma (34), and rectal cancer (35), and demonstrated its potential in predicting treatment efficacy or patient prognosis.
PET-based radiomics had a high sensitivity in AUC for predicting the efficacy of radiochemotherapy in esophageal cancer (76%–92%) (30). In the prediction of the efficacy of adjuvant therapy for rectal cancer, the AUC of radiomics based on PET and MRI was up to 0.86 (35). Our model based on PET radiomics has an AUC of 0.94, indicating that PET radiomics plays a significant role in predicting the treatment efficacy in non-small cell lung cancer. The most important use of nomograms is based on explaining the individual’s need for further treatment. Therefore, in order to prove its clinical value, we evaluated whether the radiomics nomogram assisted decision-making could add more benefits to the patients through the novel method of decision curve, which estimated the net benefit. (Net benefit was defined as the proportion of true positives minus the proportion of false positives, weighted by the relative harm of false-positive and false-negative results) (36).
The key to ensure the accuracy, generalization and repeatability of radiomics prediction is accurate and high repeatability ROI segmentation. In this study, all ROI are manually segmented. However, manual segmentation has the disadvantages of time-consuming and low repeatability of tumor volume description. Automatic or semi-automatic methods can make up for these defects. Recently, a lot of research on automatic segmentation is increasing rapidly. The fully automatic multi-mode PET/MRI segmentation method proposed by some scholars is an operator independent method, which can help clinicians to outline containing both metabolic and morphological information (37). Some studies have shown that, compared with traditional manual segmentation radiomics approaches, the survival model of automatic tumor segmentation based on neural network segmentation shows significantly higher predictive power (38). However, there is not enough evidence to prove that automatic segmentation can replace manual segmentation. We have only preliminarily discussed the prediction performance of manual segmentation. We will test accurate automatic segmentation methods for reliable segmentation.
Limitations and Conclusion
First, this study is based on a small-sample clinical trial to establish a training model. For the training sample size, some scholars suggest that for multiple regression, each prediction variable needs at least 10 observations to produce a reasonable and stable estimate (39). In our study, three features are selected as the final model, and the minimum data size is 30. Due to the limited sample size, in order to make the model more accurate, we use all the collected cases to establish the training set. Like the previous small sample study (40), this study uses bootstrap resampling method to extract multiple samples from the original samples, generate simulation data, and compare these data results with the actual results to prove the robustness of the statistical data. In order to better understand whether the different short-term efficacy evaluations obtained by the two imaging techniques are related to the patient’s long-term prognosis, we plan to increase the follow-up time to calculate the 3- or 5-year overall survival rates, and respective disease-free survival rates. Finally, our model needs to be validated through further prospective research, although it showed a high predictive power. Though we have accord with the requirement of the minimum sample size in training set and used LASSO regression to avoid overfitting (41), we still need to increase the sample size and set the training set to further avoid overfitting. We also plan to include more patients in further prospective studies, wherein some patients will continue to serve as the training set to increase the repeatability of the prediction performance of the model by expanding the sample size, while others will serve as the validation set to verify the accuracy of the verification model. The study provides further evidence to use PET to evaluate the efficacy in NSCLC. Our results show that early 18F-FDG-PET could be particularly useful for identifying early responders, allowing clinicians to avoid overtreatment, and that the radiomics nomogram could be an important technique for the prediction of short-term efficacy in patients with NSCLC, which might enable an improved and precise treatment (41).
Data Availability Statement
The original contributions presented in the study are included in the article/Supplementary Material. Further inquiries can be directed to the corresponding authors.
Ethics Statement
The studies involving human participants were reviewed and approved by the Affiliated Hospital of Southwest Medical University Clinical trial ethics committee. The patients/participants provided their written informed consent to participate in this study.
Author Contributions
Conception and design: SL, H-WP, and Y-QJ. Administrative support: SL and J-BW. Provision of study materials or patients: YC and YZ. Collection and assembly of data: HC, X-XS, and QG. Data analysis and interpretation: Y-QJ and HC. Manuscript writing: Y-QJ and H-WP. Final approval of manuscript: SL. All authors contributed to the article and approved the submitted version
Funding
This work was supported by the grants from the National Natural Science Foundation of China (no. 81201682), the Scientific Research Foundation of the Luzhou Science and Technology Bureau (no. 2016LZXNYD-J05), and the Southwest Medical University Foundation (no. 201617).
Conflict of Interest
The authors declare that the research was conducted in the absence of any commercial or financial relationships that could be construed as a potential conflict of interest.
Acknowledgments
We thank the patients who voluntarily participated in this study; Pei-Rong Ren for assessing the quality of the radiation therapy treatment plans; and Na Wang and Li-Shi Yang for providing language help and writing assistance. We would like to thank Editage (www.editage.cn) for the English language editing.
Supplementary Material
The Supplementary Material for this article can be found online at: https://www.frontiersin.org/articles/10.3389/fonc.2021.590836/full#supplementary-material
References
1. Bray F, Ferlay J, Soerjomataram I, Siegel RL, Torre LA, Jemal A. Global cancer statistics 2018: GLOBOCAN estimates of incidence and mortality worldwide for 36 cancers in 185 countries. CA Cancer J Clin (2018) 68(6):394–424. doi: 10.3322/caac.21492
2. Ouyang W, Yu J, Nuerjiang S, Li Z, Wang D, Wang X, et al. Stereotactic body radiotherapy improves the survival of patients with oligometastatic non-small cell lung cancer. Cancer Med (2019) 8(10):4605–14. doi: 10.1002/cam4.2366
3. Ettinger DS, Wood DE, Akerley W, Bazhenova LA, Borghaei H, Camidge DR, et al. Non-small cell lung cancer, version 1.2015. J Natl Compr Canc Netw (2014) 12(12):1738–61. doi: 10.6004/jnccn.2014.0176
4. Linda A, Trovo M, Bradley JD. Radiation injury of the lung after stereotactic body radiation therapy (SBRT) for lung cancer: a timeline and pattern of CT changes. Eur J Radiol (2011) 79(1):147–54. doi: 10.1016/j.ejrad.2009.10.029
5. Takeda A, Kunieda E, Fujii H, Yokosuka N, Aoki Y, Oooka Y, et al. Evaluation for local failure by 18F-FDG PET/CT in comparison with CT findings after stereotactic body radiotherapy (SBRT) for localized non-small-cell lung cancer. Lung Cancer (2013) 79(3):248–53. doi: 10.1016/j.lungcan.2012.11.008
6. Pastis NJ Jr, Greer TJ, Tanner NT, Wahlquist AE, Gordon LL, Sharma AK, et al. Assessing the usefulness of 18F-fluorodeoxyglucose PET-CT scan after stereotactic body radiotherapy for early-stage non-small cell lung cancer. Chest (2014) 146(2):406–11. doi: 10.1378/chest.13-2281
7. Manus MPM, Hicks RJ, Matthews JP, McKenzie A, Rischin D, Salminen EK, et al. Positron Emission Tomography Is Superior to Computed Tomography Scanning for Response-Assessment After Radical Radiotherapy or Chemoradiotherapy in Patients With Non–Small-Cell Lung Cancer. J Clin Oncol (2003) 21(7):1285–92. doi: 10.1200/jco.2003.07.054
8. Yuan M, Zhang YD, Pu XH, Zhong Y, Li H, Wu JF, et al. Comparison of a radiomic biomarker with volumetric analysis for decoding tumour phenotypes of lung adenocarcinoma with different disease-specific survival. Eur Radiol (2017) 27(11):4857–65. doi: 10.1007/s00330-017-4855-3
9. Flechsig P, Frank P, Kratochwil C, Antoch G, Rath D, Moltz J, et al. Radiomic Analysis using Density Threshold for FDG-PET/CT-Based N-Staging in Lung Cancer Patients. Mol Imag Biol (2017) 19(2):315–22. doi: 10.1007/s11307-016-0996-z
10. Yu W, Tang C, Hobbs BP, Li X, Koay EJ, Wistuba II, et al. Development and Validation of a Predictive Radiomics Model for Clinical Outcomes in Stage I Non-small Cell Lung Cancer. Int J Radiat Oncol Biol Phys (2018) 102(4):1090–7. doi: 10.1016/j.ijrobp.2017.10.046
11. Detterbeck FC, Boffa DJ, Kim AW, Tanoue LT. The Eighth Edition Lung Cancer Stage Classification. Chest (2017) 151(1):193–203. doi: 10.1016/j.chest.2016.10.010
12. Xiang L, Zhang JW, Lin S, Luo HQ, Wen QL, He LJ, et al. Computed Tomography-Guided Interstitial High-Dose-Rate Brachytherapy in Combination With Regional Positive Lymph Node Intensity-Modulated Radiation Therapy in Locally Advanced Peripheral Non-Small Cell Lung Cancer: A Phase 1 Clinical Trial. Int J Radiat Oncol Biol Phys (2015) 92(5):1027–34. doi: 10.1016/j.ijrobp.2015.04.019
13. Boellaard R, O’Doherty MJ, Weber WA, Mottaghy FM, Lonsdale MN, Stroobants SG, et al. FDG PET and PET/CT: EANM procedure guidelines for tumour PET imaging: version 1.0. Eur J Nucl Med Mol Imag (2010) 37(1):181–200. doi: 10.1007/s00259-009-1297-4
14. Hain SF, Curran KM, Beggs AD, Fogelman I, O’Doherty MJ, Maisey MN. FDG-PET as a “metabolic biopsy” tool in thoracic lesions with indeterminate biopsy. Eur J Nucl Med (2001) 28(9):1336–40. doi: 10.1007/s002590100563
15. Beggs AD, Hain SF, Curran KM, O’Doherty MJ. FDG-PET as a “metabolic biopsy” tool in non-lung lesions with indeterminate biopsy. Eur J Nucl Med Mol Imag (2002) 29(4):542–6. doi: 10.1007/s00259-001-0736-7
16. Eisenhauer EA, Therasse P, Bogaerts J, Schwartz LH, Sargent D, Ford R, et al. New response evaluation criteria in solid tumours: revised RECIST guideline (version 1.1). Eur J Cancer (2009) 45(2):228–47. doi: 10.1016/j.ejca.2008.10.026
17. Young H, Baum R, Cremerius U, Herholz K, Hoekstra O, Lammertsma AA, et al. Measurement of clinical and subclinical tumour response using [18F]-fluorodeoxyglucose and positron emission tomography review and 1999 EORTC recommendations. Eur J Cancer (1999) 35(13):1773–82. doi: 10.1016/S0959-8049(99)00229-4
18. Kumar V, Gu Y, Basu S, Berglund A, Eschrich SA, Schabath MB, et al. Radiomics: the process and the challenges. Magn Reson Imaging (2012) 30(9):1234–48. doi: 10.1016/j.mri.2012.06.010
19. Lambin P, Rios-Velazquez E, Leijenaar R, Carvalho S, van Stiphout RGPM, Granton P, et al. Radiomics: Extracting more information from medical images using advanced feature analysis. Eur J Cancer (2012) 48(4):441–6. doi: 10.1016/j.ejca.2011.11.036
20. Zwanenburg A, Vallieres M, Abdalah MA, Aerts H, Andrearczyk V, Apte A, et al. The Image Biomarker Standardization Initiative: Standardized Quantitative Radiomics for High-Throughput Image-based Phenotyping. Radiology (2020) 295(2):328–38. doi: 10.1148/radiol.2020191145
21. Zwanenburg A, Leger S, Vallières M, Löck S. Image biomarker standardisation initiative-feature definitions. arXiv preprint arXiv:1612.07003 (2016). doi: 10.17195/candat.2016.08.1
22. Depeursinge A, Andrearczyk V, Whybra P, van Griethuysen J, Müller H, Schaer R, et al. Standardised convolutional filtering for radiomics. arXiv preprint arXiv:2006.05470 (2020). Available at: https://www.researchgate.net/publication/342093302_Standardised_convolutional_filtering_for_radiomics
23. Fedorov A, Beichel R, Kalpathy-Cramer J, Finet J, Fillion-Robin JC, Pujol S, et al. 3D Slicer as an image computing platform for the Quantitative Imaging Network. Magn Reson Imaging (2012) 30(9):1323–41. doi: 10.1016/j.mri.2012.05.001
24. Fischer BM, Mortensen J, Langer SW, Loft A, Berthelsen AK, Daugaard G, et al. PET/CT imaging in response evaluation of patients with small cell lung cancer. Lung Cancer (2006) 54(1):41–9. doi: 10.1016/j.lungcan.2006.06.012
25. Bradley J, Bae K, Choi N, Forster K, Siegel BA, Brunetti J, et al. A phase II comparative study of gross tumor volume definition with or without PET/CT fusion in dosimetric planning for non-small-cell lung cancer (NSCLC): primary analysis of Radiation Therapy Oncology Group (RTOG) 0515. Int J Radiat Oncol Biol Phys (2012) 82(1):435–41. doi: 10.1016/j.ijrobp.2010.09.033
26. Dunlap NE, Yang W, McIntosh A, Sheng K, Benedict SH, Read PW, et al. Computed Tomography-Based Anatomic Assessment Overestimates Local Tumor Recurrence in Patients With Mass-like Consolidation After Stereotactic Body Radiotherapy for Early-Stage Non-Small Cell Lung Cancer. Int J Radiat OncologyBiologyPhysics (2012) 84(5):1071–7. doi: 10.1016/j.ijrobp.2012.01.088
27. Birim O, Kappetein AP, van Klaveren RJ, Bogers AJ. Prognostic factors in non-small cell lung cancer surgery. Eur J Surg Oncol (2006) 32(1):12–23. doi: 10.1016/j.ejso.2005.10.001
28. Vesselle H, Schmidt RA, Pugsley JM, Li M, Kohlmyer SG, Vallires E, et al. Lung cancer proliferation correlates with [F-18]fluorodeoxyglucose uptake by positron emission tomography. Clin Cancer Res (2000) 6(10):3837–44.
29. Rajendran JG, Schwartz DL, O’Sullivan J, Peterson LM, Ng P, Scharnhorst J, et al. Tumor hypoxia imaging with [F-18] fluoromisonidazole positron emission tomography in head and neck cancer. Clin Cancer Res (2006) 12(18):5435–41. doi: 10.1158/1078-0432.CCR-05-1773
30. Tixier F, Le Rest CC, Hatt M, Albarghach N, Pradier O, Metges JP, et al. Intratumor heterogeneity characterized by textural features on baseline 18F-FDG PET images predicts response to concomitant radiochemotherapy in esophageal cancer. J Nucl Med (2011) 52(3):369–78. doi: 10.2967/jnumed.110.082404
31. Ahn HK, Lee H, Kim SG, Hyun SH. Pre-treatment (18)F-FDG PET-based radiomics predict survival in resected non-small cell lung cancer. Clin Radiol (2019) 74(6):467–73. doi: 10.1016/j.crad.2019.02.008
32. Ohri N, Duan F, Snyder BS, Wei B, Machtay M, Alavi A, et al. Pretreatment 18F-FDG PET Textural Features in Locally Advanced Non-Small Cell Lung Cancer: Secondary Analysis of ACRIN 6668/RTOG 0235. J Nucl Med (2016) 57(6):842–8. doi: 10.2967/jnumed.115.166934
33. Antunovic L, De Sanctis R, Cozzi L, Kirienko M, Sagona A, Torrisi R, et al. PET/CT radiomics in breast cancer: promising tool for prediction of pathological response to neoadjuvant chemotherapy. Eur J Nucl Med Mol Imag (2019) 46(7):1468–77. doi: 10.1007/s00259-019-04313-8
34. Peng H, Dong D, Fang MJ, Li L, Tang LL, Chen L, et al. Prognostic Value of Deep Learning PET/CT-Based Radiomics: Potential Role for Future Individual Induction Chemotherapy in Advanced Nasopharyngeal Carcinoma. Clin Cancer Res (2019) 25(14):4271–9. doi: 10.1158/1078-0432.Ccr-18-3065
35. Giannini V, Mazzetti S, Bertotto I, Chiarenza C, Cauda S, Delmastro E, et al. Predicting locally advanced rectal cancer response to neoadjuvant therapy with (18)F-FDG PET and MRI radiomics features. Eur J Nucl Med Mol Imag (2019) 46(4):878–88. doi: 10.1007/s00259-018-4250-6
36. Balachandran VP, Gonen M, Smith JJ, DeMatteo RP. Nomograms in oncology: more than meets the eye. Lancet Oncol (2015) 16(4):e173–80. doi: 10.1016/S1470-2045(14)71116-7
37. Rundo L, Stefano A, Militello C, Russo G, Sabini MG, D’Arrigo C, et al. A fully automatic approach for multimodal PET and MR image segmentation in gamma knife treatment planning. Comput Methods Programs BioMed (2017) 144:77–96. doi: 10.1016/j.cmpb.2017.03.011
38. Baek S, He Y, Allen BG, Buatti JM, Smith BJ, Tong L, et al. Deep segmentation networks predict survival of non-small cell lung cancer. Sci Rep (2019) 9(1):17286. doi: 10.1038/s41598-019-53461-2
39. Chalkidou A, O’Doherty MJ, Marsden PK. False Discovery Rates in PET and CT Studies with Texture Features: A Systematic Review. PloS One (2015) 10(5):e0124165. doi: 10.1371/journal.pone.0124165
40. Gill AB, Rundo L, Wan JCM, Lau D, Zawaideh JP, Woitek R, et al. Correlating Radiomic Features of Heterogeneity on CT with Circulating Tumor DNA in Metastatic Melanoma. Cancers (Basel) (2020) 12(12):3493. doi: 10.3390/cancers12123493
Keywords: positron emission tomography, radiomics, non-small-cell lung cancer, computed tomography, hypo-fractionated radiotherapy
Citation: Jiang Y-Q, Gao Q, Chen H, Shi X-X, Wu J-B, Chen Y, Zhang Y, Pang H-W and Lin S (2021) Positron Emission Tomography-Based Short-Term Efficacy Evaluation and Prediction in Patients With Non-Small Cell Lung Cancer Treated With Hypo-Fractionated Radiotherapy. Front. Oncol. 11:590836. doi: 10.3389/fonc.2021.590836
Received: 03 August 2020; Accepted: 18 January 2021;
Published: 25 February 2021.
Edited by:
Luigi Aloj, University of Cambridge, United KingdomReviewed by:
Wei Huang, Shandong Academy of Medical Sciences (SDAMS), ChinaLeonardo Rundo, University of Cambridge, United Kingdom
Copyright © 2021 Jiang, Gao, Chen, Shi, Wu, Chen, Zhang, Pang and Lin. This is an open-access article distributed under the terms of the Creative Commons Attribution License (CC BY). The use, distribution or reproduction in other forums is permitted, provided the original author(s) and the copyright owner(s) are credited and that the original publication in this journal is cited, in accordance with accepted academic practice. No use, distribution or reproduction is permitted which does not comply with these terms.
*Correspondence: Hao-Wen Pang, aGFvd2VucGFuZ0Bmb3htYWlsLmNvbQ==; Sheng Lin, bHNsaW5zaGVuZ0AxNjMuY29t
†These authors have contributed equally to this work