 Ying Zou
 Yan Shi2†
 Zhi Yang
 Fang Sun
- 1Department of Radiology, First Teaching Hospital of Tianjin University of Traditional Chinese Medicine, Tianjin, China
- 2Department of Ultrasonography, Binzhou Medical University Hospital, Binzhou City, China
Current approaches to predict central cervical lymph node metastasis (CLNM) in patients with papillary thyroid carcinoma (PTC) have failed to identify patients who would benefit from preventive treatment. Machine learning has offered the opportunity to improve accuracy by comparing the different algorithms. We assessed which machine learning algorithm can best improve CLNM prediction. This retrospective study used routine ultrasound data of 1,364 PTC patients. Six machine learning algorithms were compared to predict the possibility of CLNM. Predictive accuracy was assessed by sensitivity, specificity, positive predictive value, negative predictive value, and the area under the curve (AUC). The patients were randomly split into the training (70%), validation (15%), and test (15%) data sets. Random forest (RF) led to the best diagnostic model in the test cohort (AUC 0.731 ± 0.036, 95% confidence interval: 0.664–0.791). The diagnostic performance of the RF algorithm was most dependent on the following five top-rank features: extrathyroidal extension (27.597), age (17.275), T stage (15.058), shape (13.474), and multifocality (12.929). In conclusion, this study demonstrated promise for integrating machine learning methods into clinical decision-making processes, though these would need to be tested prospectively.
Introduction
According to the American Cancer Society 2020 American Cancer Data Statistics, thyroid cancer incidence has accounted as the fifth leading cause of cancer in women (1), similar to China (2). Cervical lymph node metastasis is considered as a risk factor for recurrence (3, 4), of which central cervical lymph node metastasis (CLNM) is the most common (5). According to the American Thyroid Association (ATA) management guidelines for adult patients with thyroid cancer (6), whether there is CLNM or not directly affects the formulation of preoperative surgical procedures. Prophylactic central lymph node dissection (CLND) for cN0 papillary thyroid carcinoma (PTC) patients will undoubtedly cause excessive medical treatment. Therefore, it is of great significance to distinguish CLNM with non-invasive methods before surgery for the treatment and prognosis in PTC patients.
Ultrasound remains the most critical imaging modality in the evaluation of thyroid cancer according to the ATA Statement on Preoperative Imaging for Thyroid Cancer Surgery (7) due to its convenience, non-invasive, and non-radiation. However, it is challenging to detect CLNM due to the interference of the gas in the trachea and esophagus, and its diagnostic sensitivity is only about 20–40% (8–13).
In recent years, artificial intelligence (AI) in medicine has grown significantly as a state-of-the-art data analysis tool (14). In particular, radiology lends itself to AI because of its large digital data sets (15). Machine learning, a significant subset of AI, provides a great supporting role to improve diagnostic and prognostic accuracy (16). Recently, some studies have focused on machine learning to evaluate thyroid nodules (16–18) and lymph node metastasis in patients with thyroid cancer (19), and the highest area under the curve (AUC) can reach 0.953. The machine learning classifiers used in these studies include neural networks, decision trees, random forest (RF), and deep learning. However, few studies focus on comparing the diagnostic performance of various machine learning classifiers in evaluating CLNM in PTC patients.
In the current study, based on published literature (20–23), we hypothesized that the machine learning models based on ultrasound could achieve higher performance in predicting CLNM in PTC patients. The study’s purpose was, first, to develop machine learning-based models using six different classifiers to distinguish CLNM from non-CLNM based on preoperative ultrasound images. Second, to validate and test the diagnostic performance of the six models. Third, to compare the performance of six classifiers.
Materials and Methods
Patients Population
The research ethics committee of Binzhou Medical University Hospital approved this retrospective study (No. LW-024), and the requirement for written informed consent was waived since the retrospective nature. All the included data were anonymized. All patients’ medical records and ultrasound images were stored in the picture archiving and communication systems (PACS) of Binzhou Medical University Hospital. The clinicians could access the data by PACS. Considering patients’ privacy, you can contact the corresponding author to obtain all patients’ original data if necessary.
The clinical records of 1,679 patients who visited Binzhou Medical University Hospital between January 2017 and June 2020 were retrospectively analyzed. The patients were treated for thyroid nodules and classified as Bethesda Categories V (suspicious for malignancy, risk of malignancy 50–75%) and VI (malignancy, risk of malignancy 97–99%) confirmed by ultrasound-guided fine-needle aspiration biopsy (US-FNAB). All patients underwent total thyroidectomy or thyroid lobectomy. CLND was performed for patients with preoperative ultrasound, suggesting the possible presence of CLNM; for cN0 patients, who were without evidence from preoperative imaging examination, CLND was conducted to follow the patients’ wishes after communication with the patients. Patients who did not undergo CLND were excluded from this study. Meanwhile, according to the ATA guidelines (24), for the lateral cervical lymph nodes, whether to perform lateral cervical lymph node dissection was based on preoperative imaging data. The inclusion criteria were as follows: patients with PTC confirmed by postoperative pathology and complete postoperative pathological results. We excluded patients with medullary thyroid carcinoma (MTC) and follicular thyroid carcinoma (FTC), less than 18 years old, previous thyroid operation or other neck surgery, and a history of radiation therapy. After a strict inclusion and exclusion process (Figure 1), a total of 1,364 consecutive patients were included, which were randomly split into the training (70%), validation (15%), and test (15%) data sets by IBM SPSS Modeler software (version 18.0). Demographics, including sex, age, final surgical pathology diagnosis, were thoroughly reviewed from the medical records.
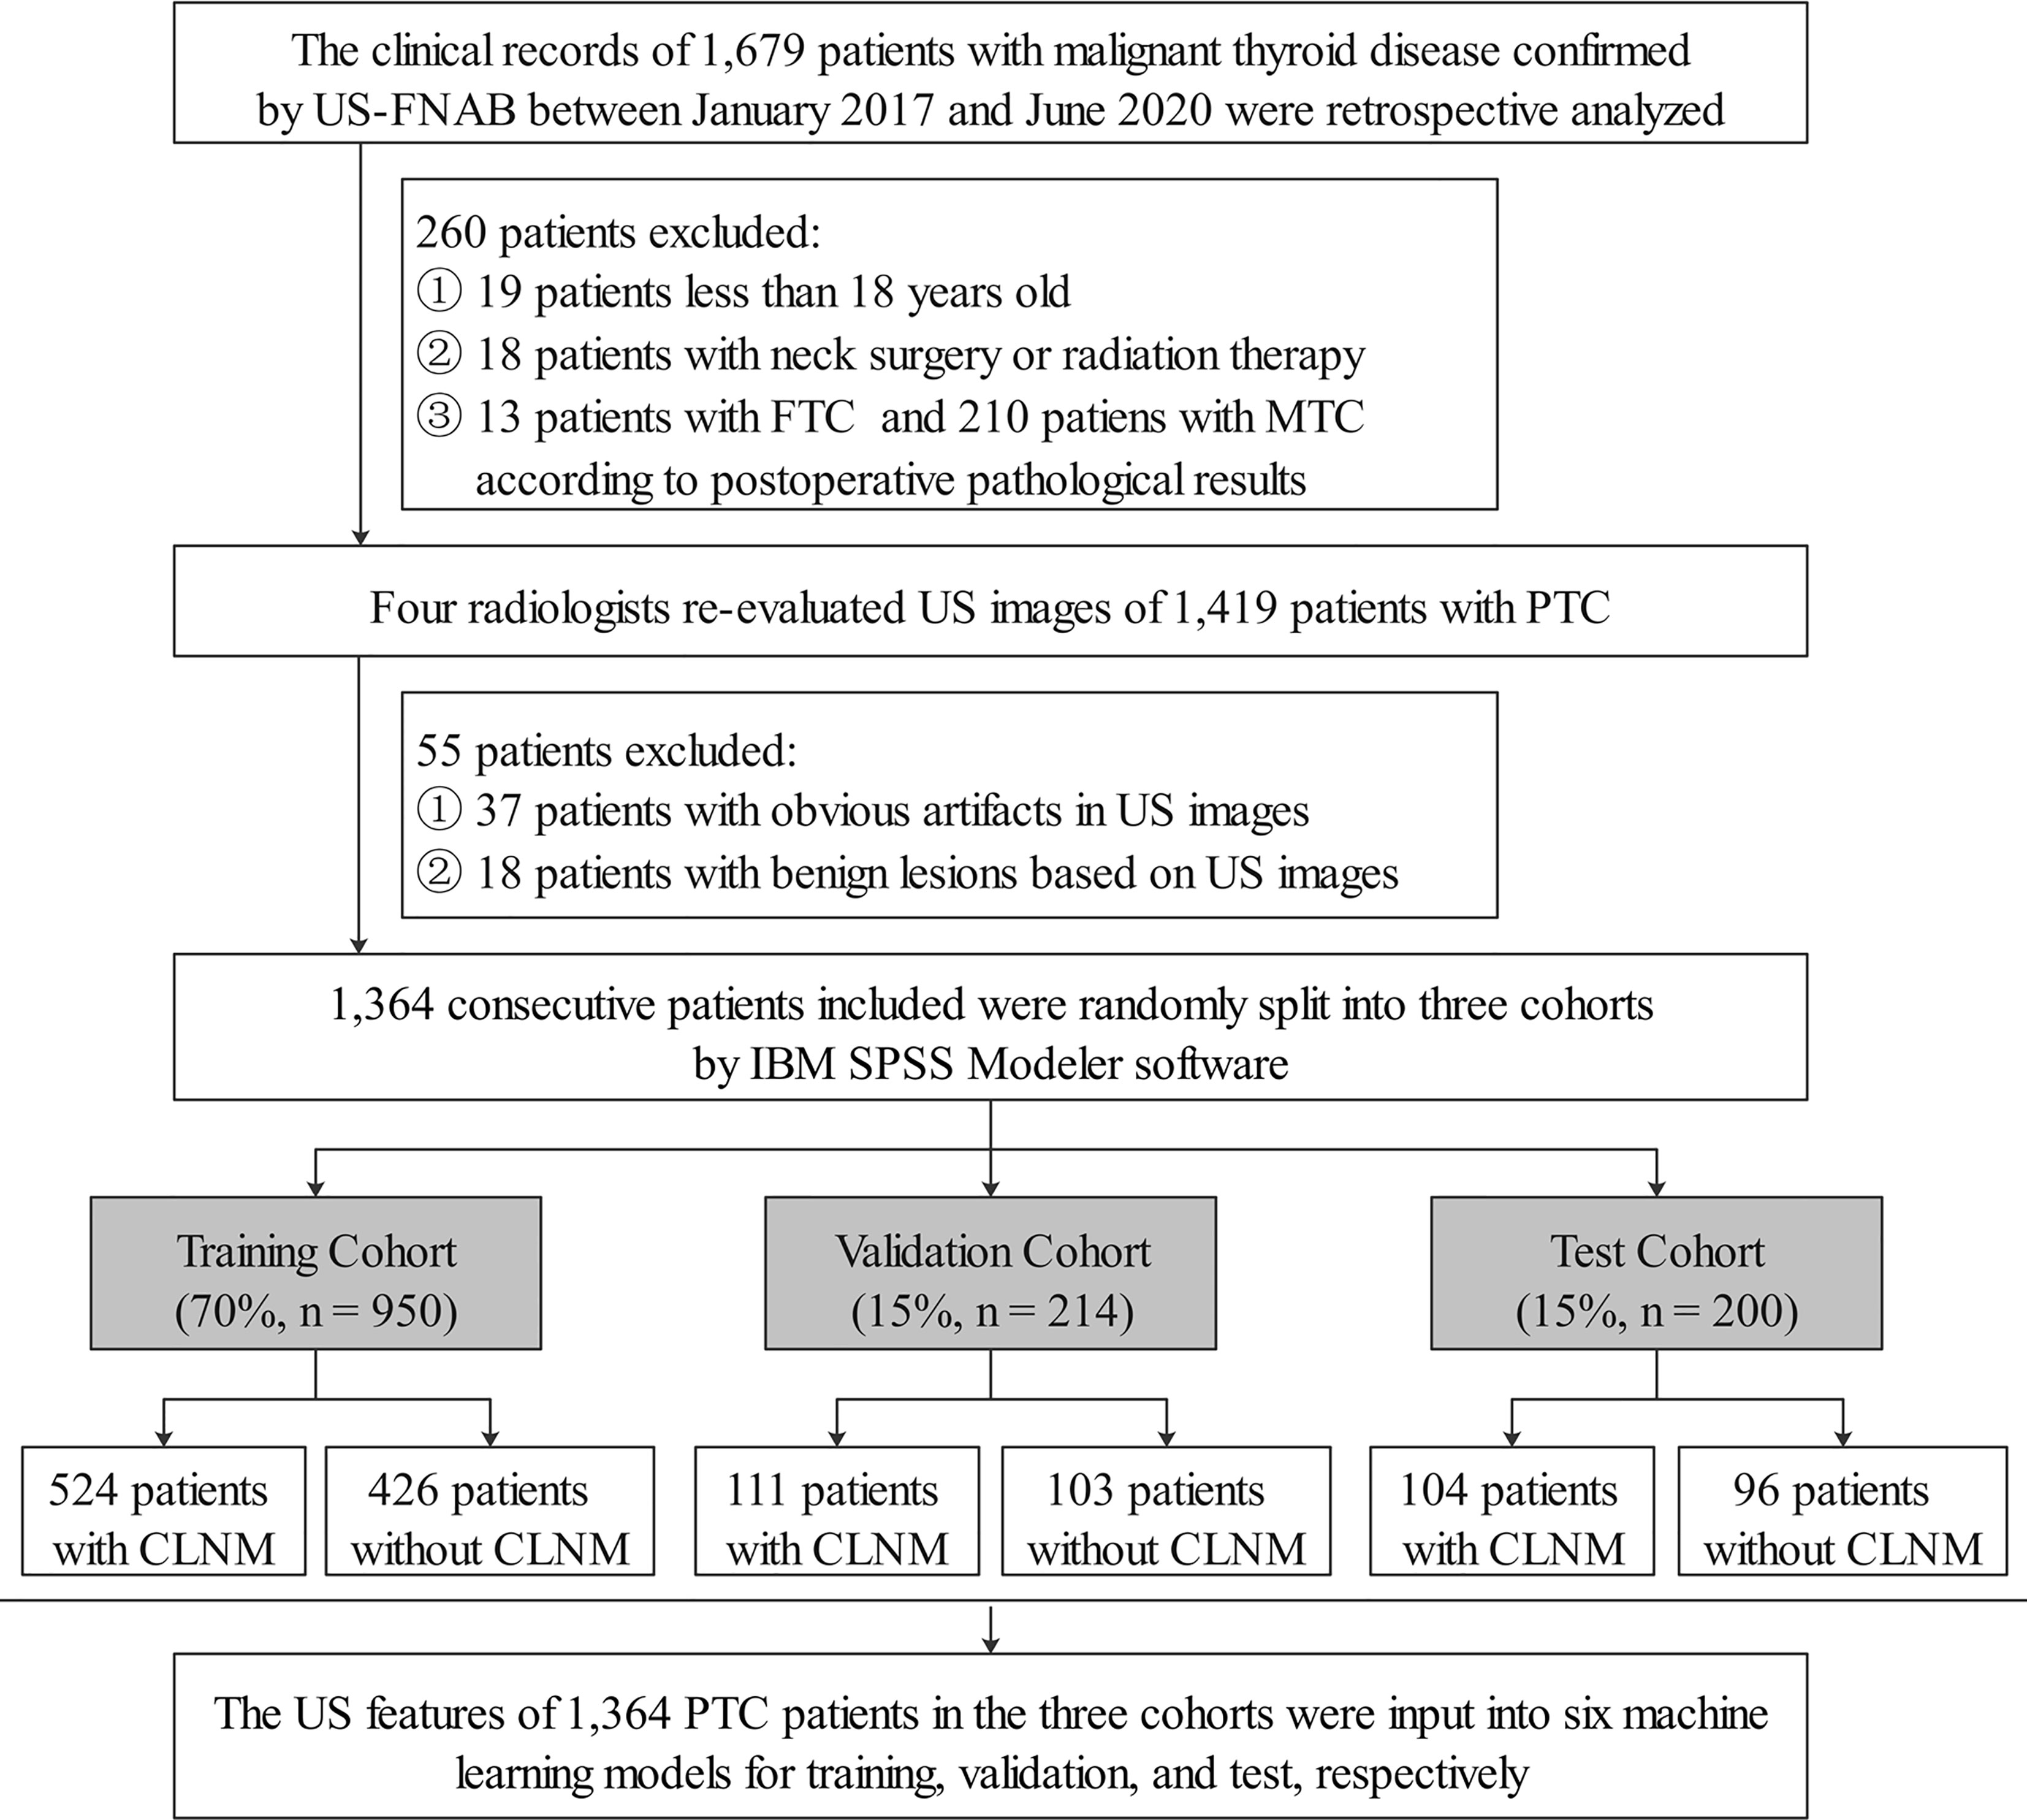
Figure 1 Flowchart showed inclusion and exclusion criteria of PTC patients in the current study. US-FNAB, ultrasound-guided fine-needle aspiration biopsy; FTC, follicular thyroid carcinoma; MTC, medullary thyroid carcinoma; US, ultrasound; PTC, papillary thyroid carcinoma; CLNM, central cervical lymph node metastasis.
Image Acquisition and Analysis
All data were scanned using six different Doppler ultrasonic diagnostic apparatuses. The detailed ultrasound examination protocol was provided in the Appendix. Specific ultrasound diagnostic criteria of malignant thyroid lesions were according to the white paper of the American College of Radiology (ACR) Thyroid Imaging, Reporting, and Data System (TI-RADS) committee (25). Specific evaluation parameters included: location, background, T stage (diameter), margin, shape, composition, echogenicity, calcification, extrathyroidal extension (ETE), and multifocality. The ultrasound images were re-evaluated by four radiologists with 11, 12, 13, and 15 years of experience in thyroid cancer ultrasound diagnosis, blinded to clinical information and pathological diagnosis. A week later, the four radiologists took a second measurement and performed intra-observer consistency analysis. When the four radiologists disagreed with some image feature, it would be resolved through consultation with the fifth radiologist with more than 20 years of ultrasound diagnosis experience. Meanwhile, the inter-observer consistency analysis was performed. Consistency analysis was done by Cohen’s Kappa.
Models Construction and Evaluation
By using the SPSS Modeler (version18.0, IBM, Armonk, New York), six classifiers, including decision tree (C5.0), logistic regression analysis (LRA), support vector machine (SVM), Bayesian network (BN), artificial neural network (ANN), and RF were used to establish the models. A brief description of these machine learning classifiers was shown in Table A.1. The parameters of classifiers played an essential role in the classification performance, and we set the parameters as follows to enhance the performance of each classifier: Boosting was used in the C5.0 algorithm to improve model accuracy; binomial logistic regression with backward selection was used in the LRA model; the radial basis function kernel was used as the kernel of the SVM, with the parameter C = 16, γ = 0.06 (1/number of features); BN adopted Markov chain structure and maximum likelihood parameter; a single-layered perceptron neural network for the ANN model consisted of one input layer, one or more hidden layers, and one output layer; 100 random tree number in RF model with the max feature included all the features input.
SPSS Modeler software randomly selected 70% of the data set as the training group and trained the model based on CLNM according to postoperative pathological results. 15% of the data set was applied as the validation group, and the remaining 15% was used as the test group to verify the trained model.
The data of the validation and test cohorts was input into the six machine learning models by SPSS Modeler to evaluate the diagnostic efficiency. Predictive performance was assessed using the receiver operating characteristic (ROC) curve, sensitivity, specificity, positive predictive value (PPV), and negative predictive value (NPV).
In addition, we further compared the concordance between the CLNM status as assessed by the best classifier in the six machine learning algorithms and the radiological CLNM status set at the time of the patient’s original treatment.
A power calculation was performed to ensure that both the validation and test data sets were sufficient to evaluate the AUC estimated from the training group.
Statistical Analysis
All the statistical analysis was performed with SPSS (version 25.0, IBM, Armonk, New York), SPSS Modeler (version 18.0), and Medcalc Statistical Software (version 18.2.1). SPSS Modeler, GraphPad prism 8.3.0, and Medcalc Statistical Software were used to draw graphs. A P-value <0.05 was considered to be statistically significant. Use χ2 test to compare the differences in count data. Medcalc Statistical Software was used to calculate the six models’ AUCs and evaluate the predictions. The DeLong method was used to compare the AUCs of the six machine learning classifiers. Cohen’s kappa value was used to analyze the concordance between the best classifier and the radiologist’s assessment of CLNM. PASS 15 (Power Analysis and Sample Size Software, 2017, NCSS, LLC. Kaysville, Utah, USA, ncss.com/software/pass) “Tests for One ROC Curve” function was used to perform power calculation.
Results
Patient Demographics and Ultrasound Features
A total of 1,364 consecutive patients with PTC based on postoperative pathological results from January 1, 2017 to June 30, 2020 in our hospital were included in this retrospective analysis. We divided the patients into three parts randomly by IBM SPSS Modeler software: approximately 70% were conducted as the training cohort, about 15% were conducted as the validation cohort, and the remaining around 15% were used as the test cohort. Ultimately, the training cohort consisted of 950 patients (mean age, 47.01 years ± 11.54), including 227 males (mean age, 46.21 years ± 12.74) and 723 females (mean age, 47.26 years ± 11.13); and the validation cohort consisted of 214 patients (mean age, 47.08 years ± 11.09), including 48 males (mean age, 47.41 years ± 12.52) and 166 females (mean age, 46.00 years ± 10.61). A total of 200 consecutive PTC patients (mean age, 47.07 ± 10.63), including 51 males (mean age, 45.33 years ± 9.95) and 149 females (mean age, 47.57 years ± 10.79), were collected to form the test cohort.
Dummy variables were grouped according to the 8th American Joint Committee on Cancer (AJCC) staging systems (26) and ACR TI-RADS (25), details as follows: location (left lobe, right lobe, or isthmus), background (homogeneous or heterogeneous), diameter (T1a = “≤1 cm”, T1b = “1–2 cm”, T2 = “2–4 cm”, ≥T3 = “>4 cm”), margin (smooth, ill-defined, or lobulated/irregular), shape (wider-than-tall or taller-than-wide), composition (cystic, spongiform, mixed, or solid), echogenicity (anechoic, hyper/isoechoic, hypoechoic or very hypoechoic), calcification (none/large comet-tail, macrocalcification, rim calcification, or microcalcification), ETE, and multifocality. No statistically significant difference was observed among the three cohorts (P >0.05). Cohen’s Kappa values of intra- and inter-observe consistency analyses were all >0.8, indicating a solid consistency. Baseline epidemiologic and ultrasonic characteristics for the three cohorts were shown in Table 1.
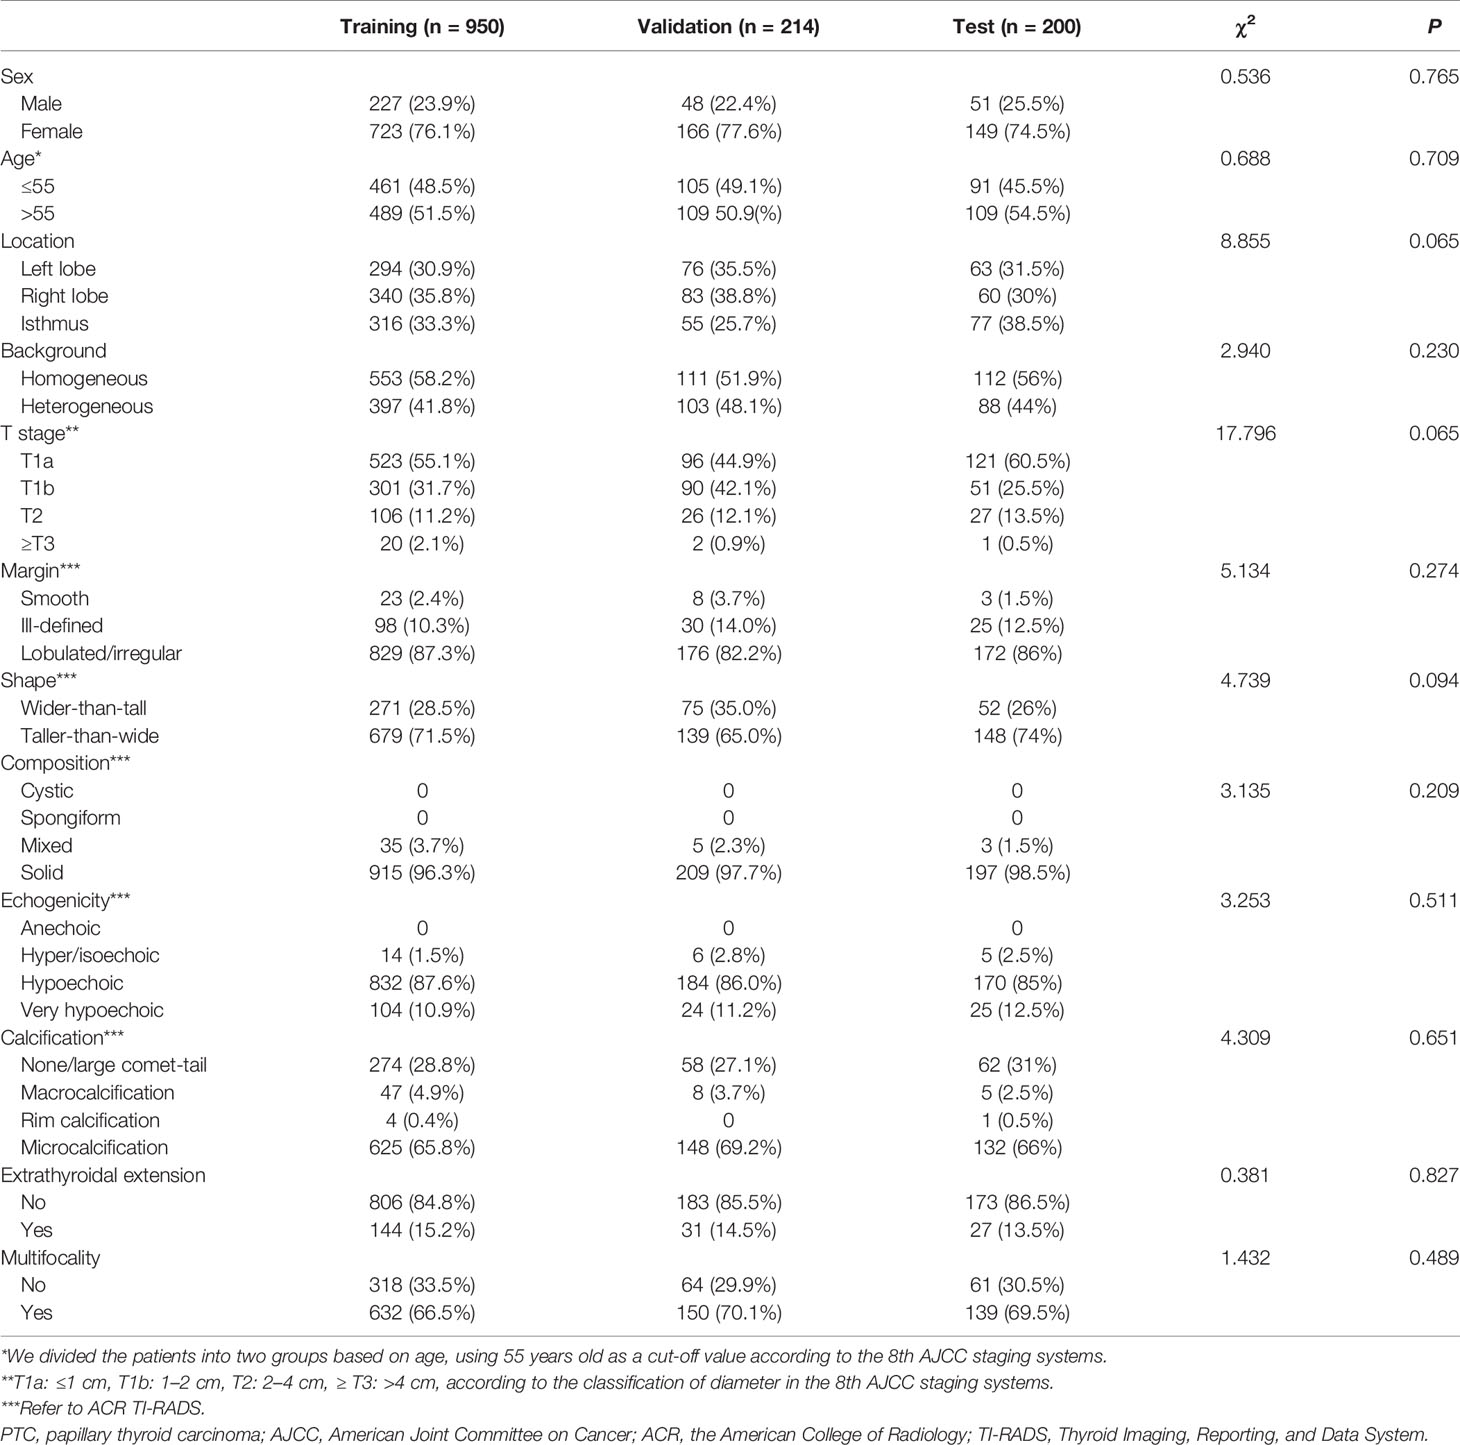
Table 1 Comparison of clinical and ultrasonic characteristics of the PTC patients in the training, validation, and test cohorts.
Diagnostic Performance of the Six Machine Learning Algorithms in the Training Cohort
The diagnostic performance of the six machine learning models was based on sex, age, and the ultrasound imaging features. In the training cohort, AUCs for C5.0, LRA, SVM, BN, ANN, and RF were 0.595 (95% confidence interval [CI]: 0.563–0.626), 0.732 (95% CI: 0.702–0.760), 0.776 (95% CI: 0.748–0.802), 0.748 (95% CI: 0.719–0.775), 0.731 (95% CI: 0.702–0.759), and 0.832 (95% CI: 0.807–0.855), respectively. Thus, the RF algorithm outperformed other machine learning algorithms in the training cohort (Table 2 and Figure A.1). Application of the six machine-learning algorithms in the validation and test cohorts yielded high AUCs of RF algorithm with 0.754 (95% CI: 0.690–0.810) and 0.731 (95% CI: 0.664–0.791), which also proved the best diagnostic performance of RF (Table 2, Figures 2, 3, and A.2). And the sensitivity, specificity, PPV, and NPV of the RF model in the validation cohort were 78.4% (95% CI: 69.6–85.6%), 68.0% (95% CI: 58.0–76.8%), 72.5% (95% CI: 66.2–78.0%), and 74.5% (95% CI: 66.6–81.0%), respectively. The sensitivity, specificity, PPV, and NPV of the RF model in the test cohort were 72.1% (95% CI: 62.5–80.5%), 67.7% (95% CI: 57.4–76.9%), 70.8% (95% CI: 63.9–76.8%), and 69.1% (95% CI: 61.5–75.9%), respectively (Table 3). The confusion matrices of the RF model in the training, validation, and test cohorts intuitively reflected the accuracy of the prediction (Figure A.3).
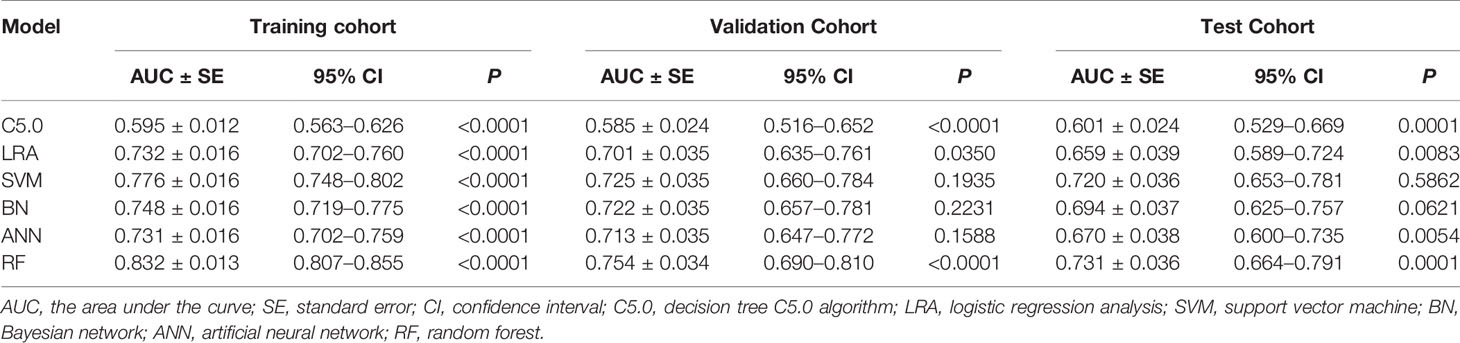
Table 2 Predictive performance of the six machine learning models for the training, validation, and test cohorts.
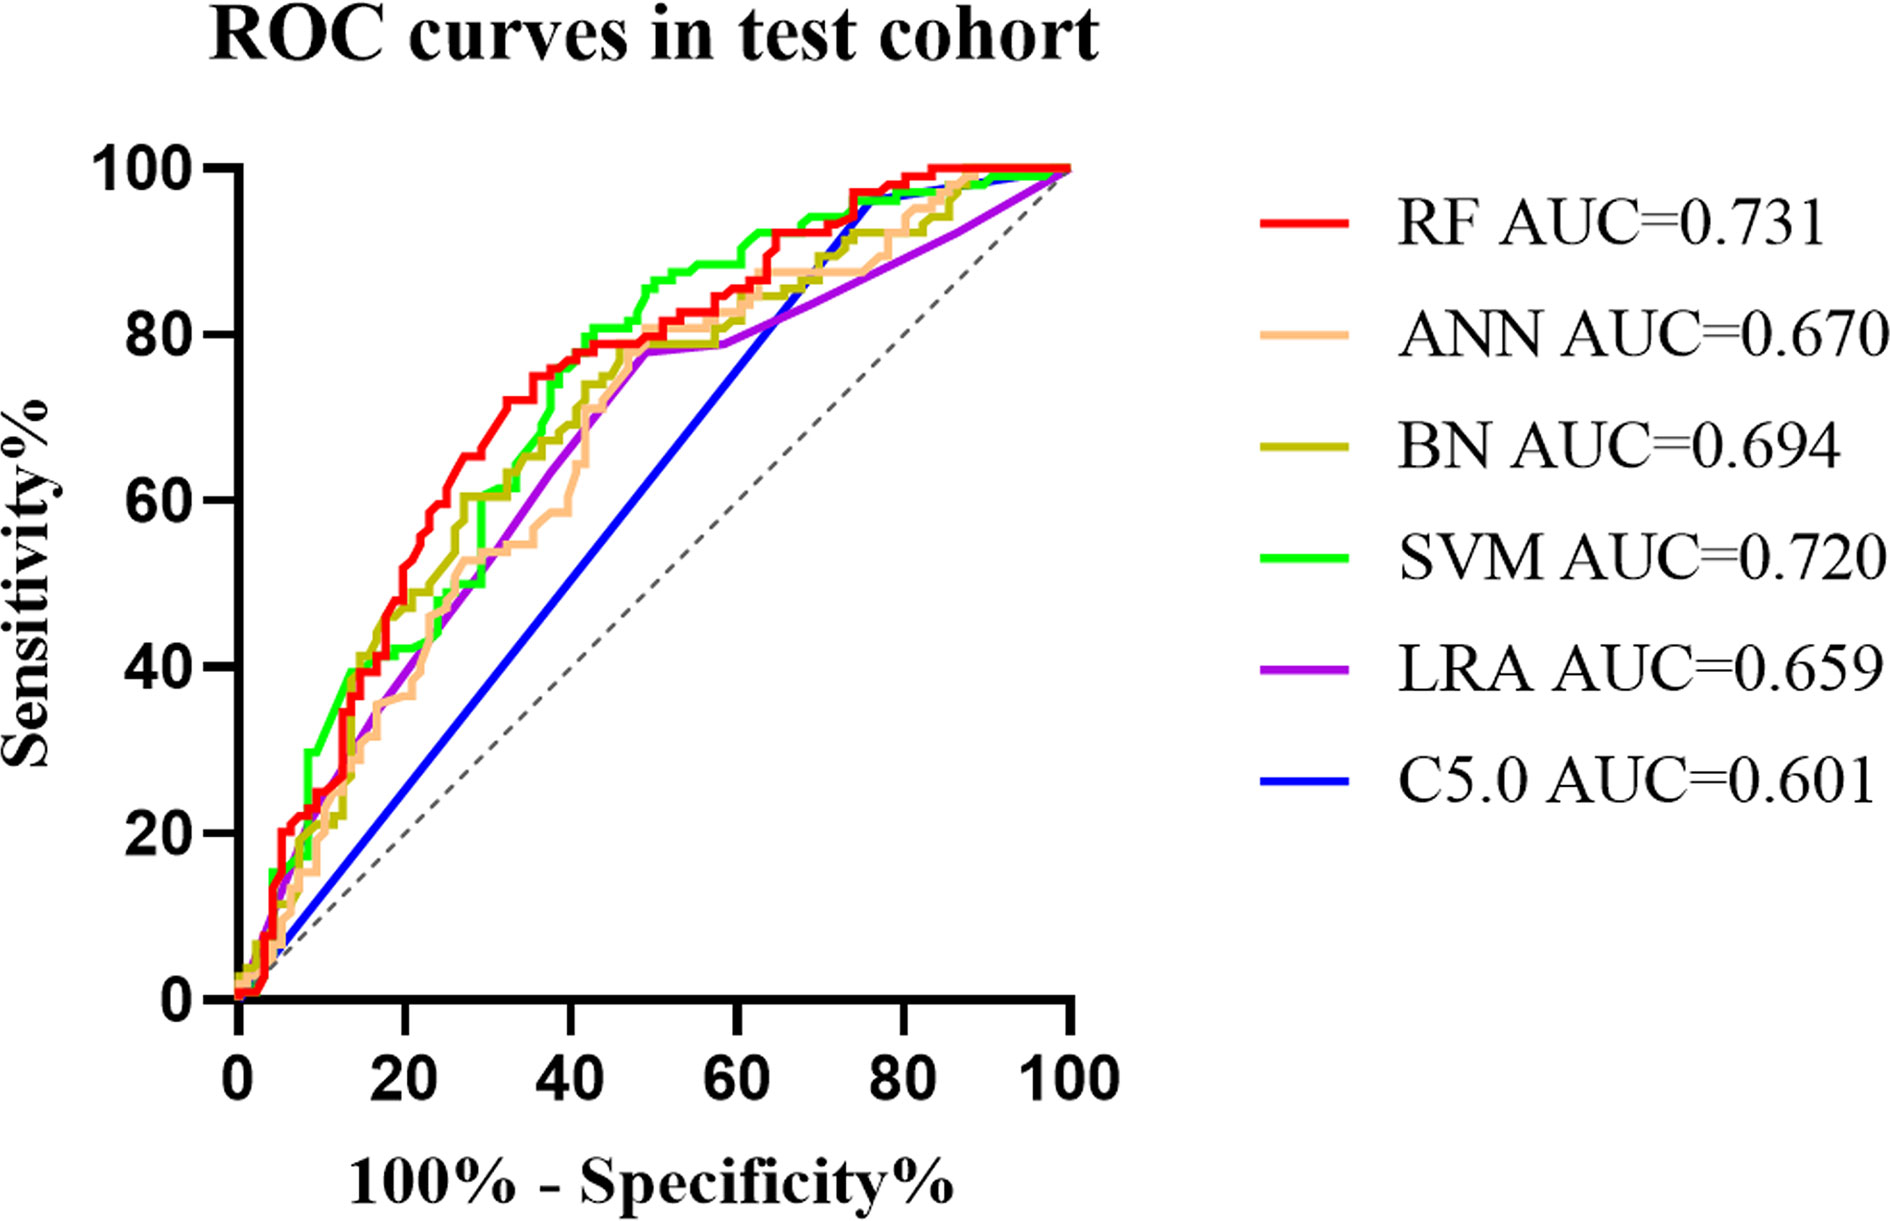
Figure 2 The mixed ROC curves of the six machine learning models in the test cohort. The RF algorithm had the highest AUC, indicating that it was the tremendous significance for the differentiation of CLNM and non-CLNM in patients with PTC. ROC, receiver operating characteristic; AUC, the area under the curve; C5.0, decision tree C5.0 algorithm; LRA, logistic regression analysis; SVM, support vector machine; BN, Bayesian network; ANN, artificial neural network; RF, random forest; CLNM, central cervical lymph node metastasis; PTC, papillary thyroid carcinoma.
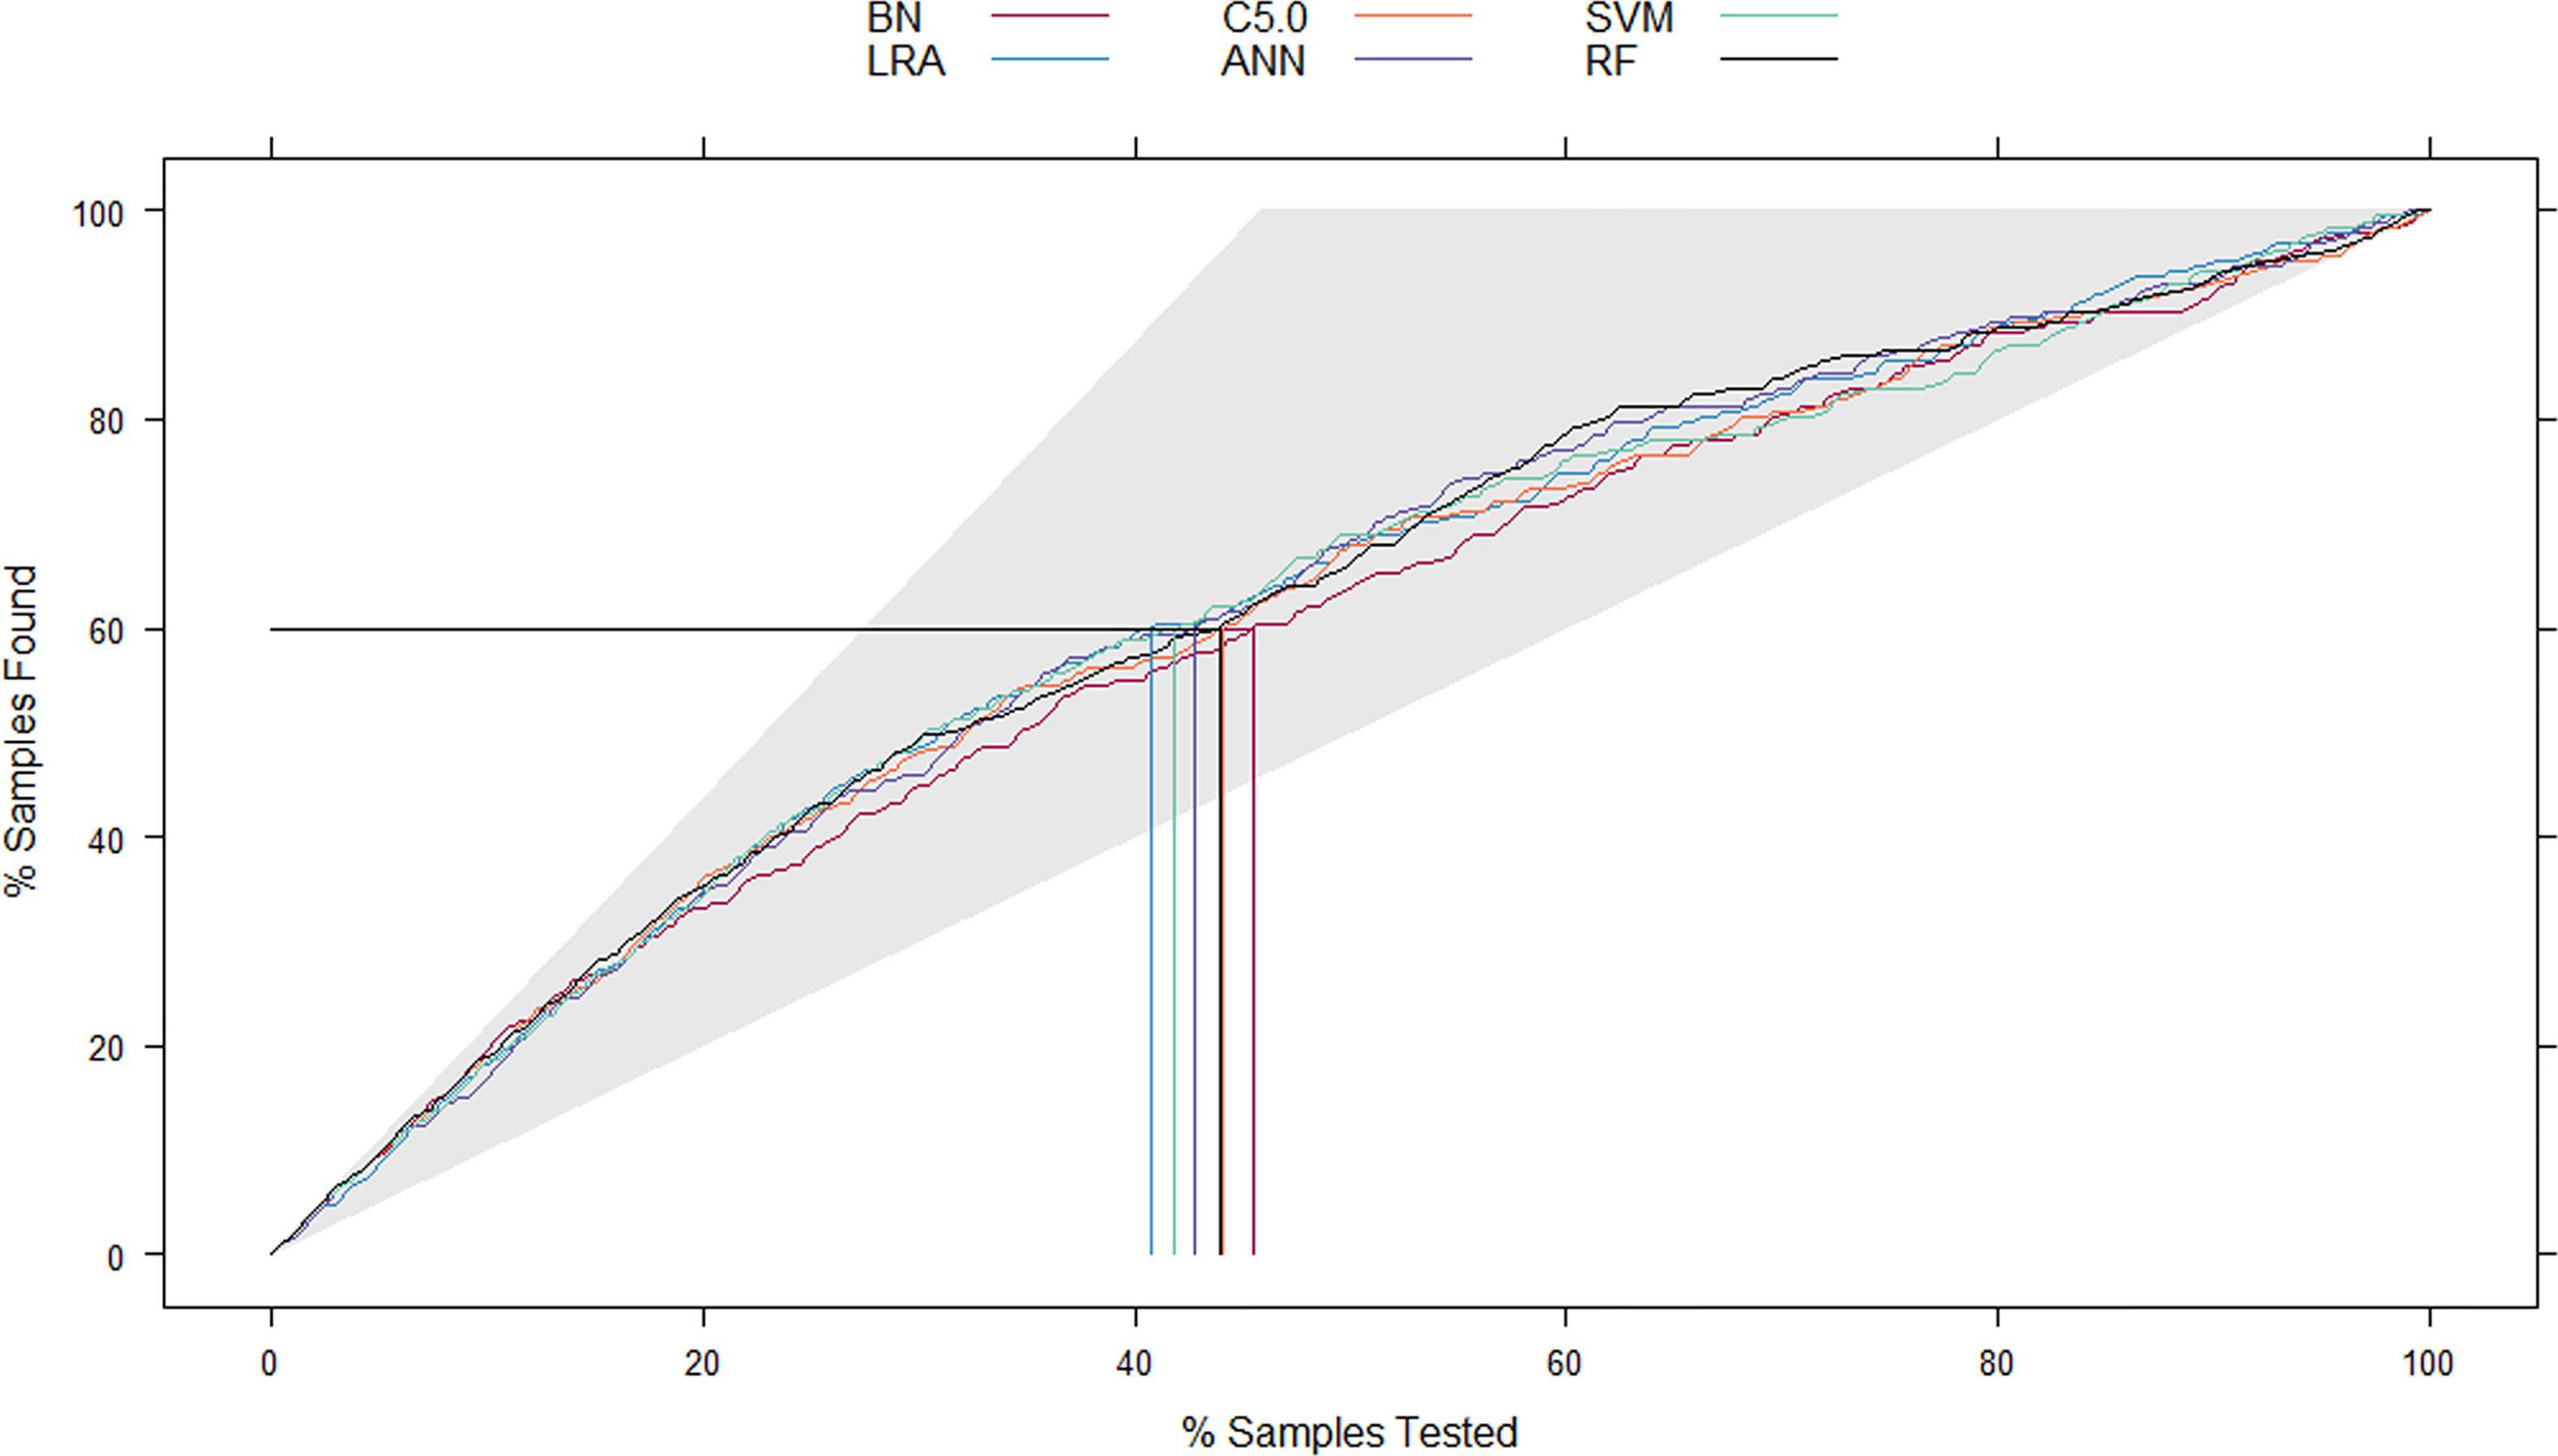
Figure 3 The mixed Lift curves of the six machine learning models in the test cohort. The Lift curve is one of the most commonly used methods for data mining classifiers. Unlike the ROC curve, Lift curve considers the classifier’s accuracy: the ratio of the number of positive classes obtains using the classifier to the number of positive classes obtains randomly without using the classifier. The Lift curve drawing process is similar to the ROC curve, and the difference is that Lift value and robust planar pose change in the opposite direction, which forms the opposite form of Lift curve and ROC curve. In the current mix Lift curves, RF also has the best diagnostic performance. ROC, receiver operating characteristic; RF, random forest.
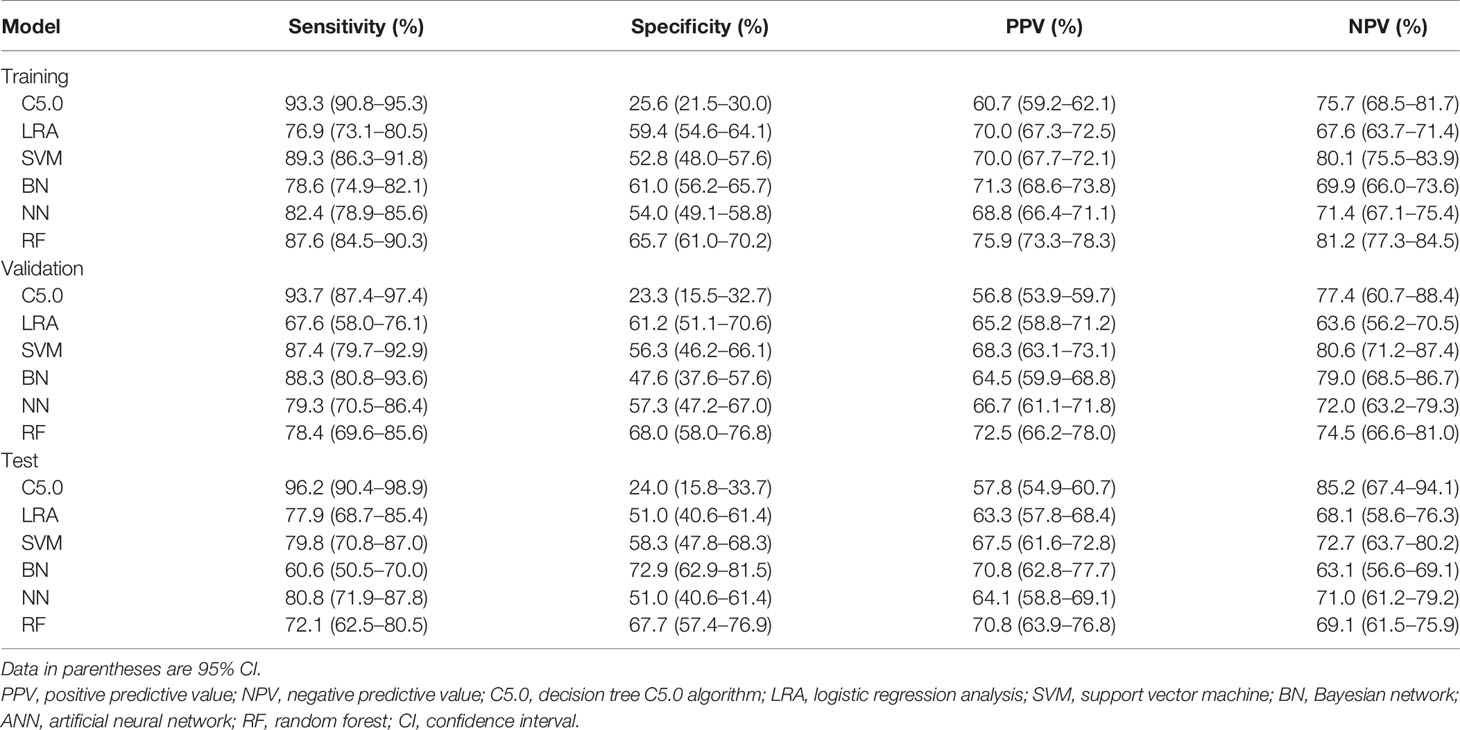
Table 3 Comparison the performance of the six machine learning models for the training, validation, and test cohorts.
Cohen’s kappa value was 0.847, indicating strong concordance between the RF classifier and the radiologist’s assessment of CLNM.
The Power Calculation
In the training set, the AUC of RF classifier was 0.832 (95% CI: 0.807–0.855), so we set the AUC0 = 0.83. In the validation and test sets, the AUCs were 0.754 (95% CI: 0.690–0.810) and 0.731 (95% CI: 0.664–0.791); so we set the AUC1 = 0.73-0.75, α = 0.05, False positive rate limited: 0.01–0.20. The result showed that when the target power was 0.80, the sample sizes of validation and test sets were 202 and 129, respectively. Therefore, both the validation and test sets were sufficient to evaluate the AUC estimated from the training set.
The Relative Importance of Each Feature Within the RF Algorithm
The diagnostic performance of the RF algorithm was most dependent on the following five top-rank features, according to their mean decrease in Gini: ETE (27.597), age (17.275), T stage (15.058), shape (13.474), and multifocality (12.929) (Figure 4). Together, all these features were the most critical factors in the RF algorithm’s diagnostic performance based on ultrasound features (Figure 5).
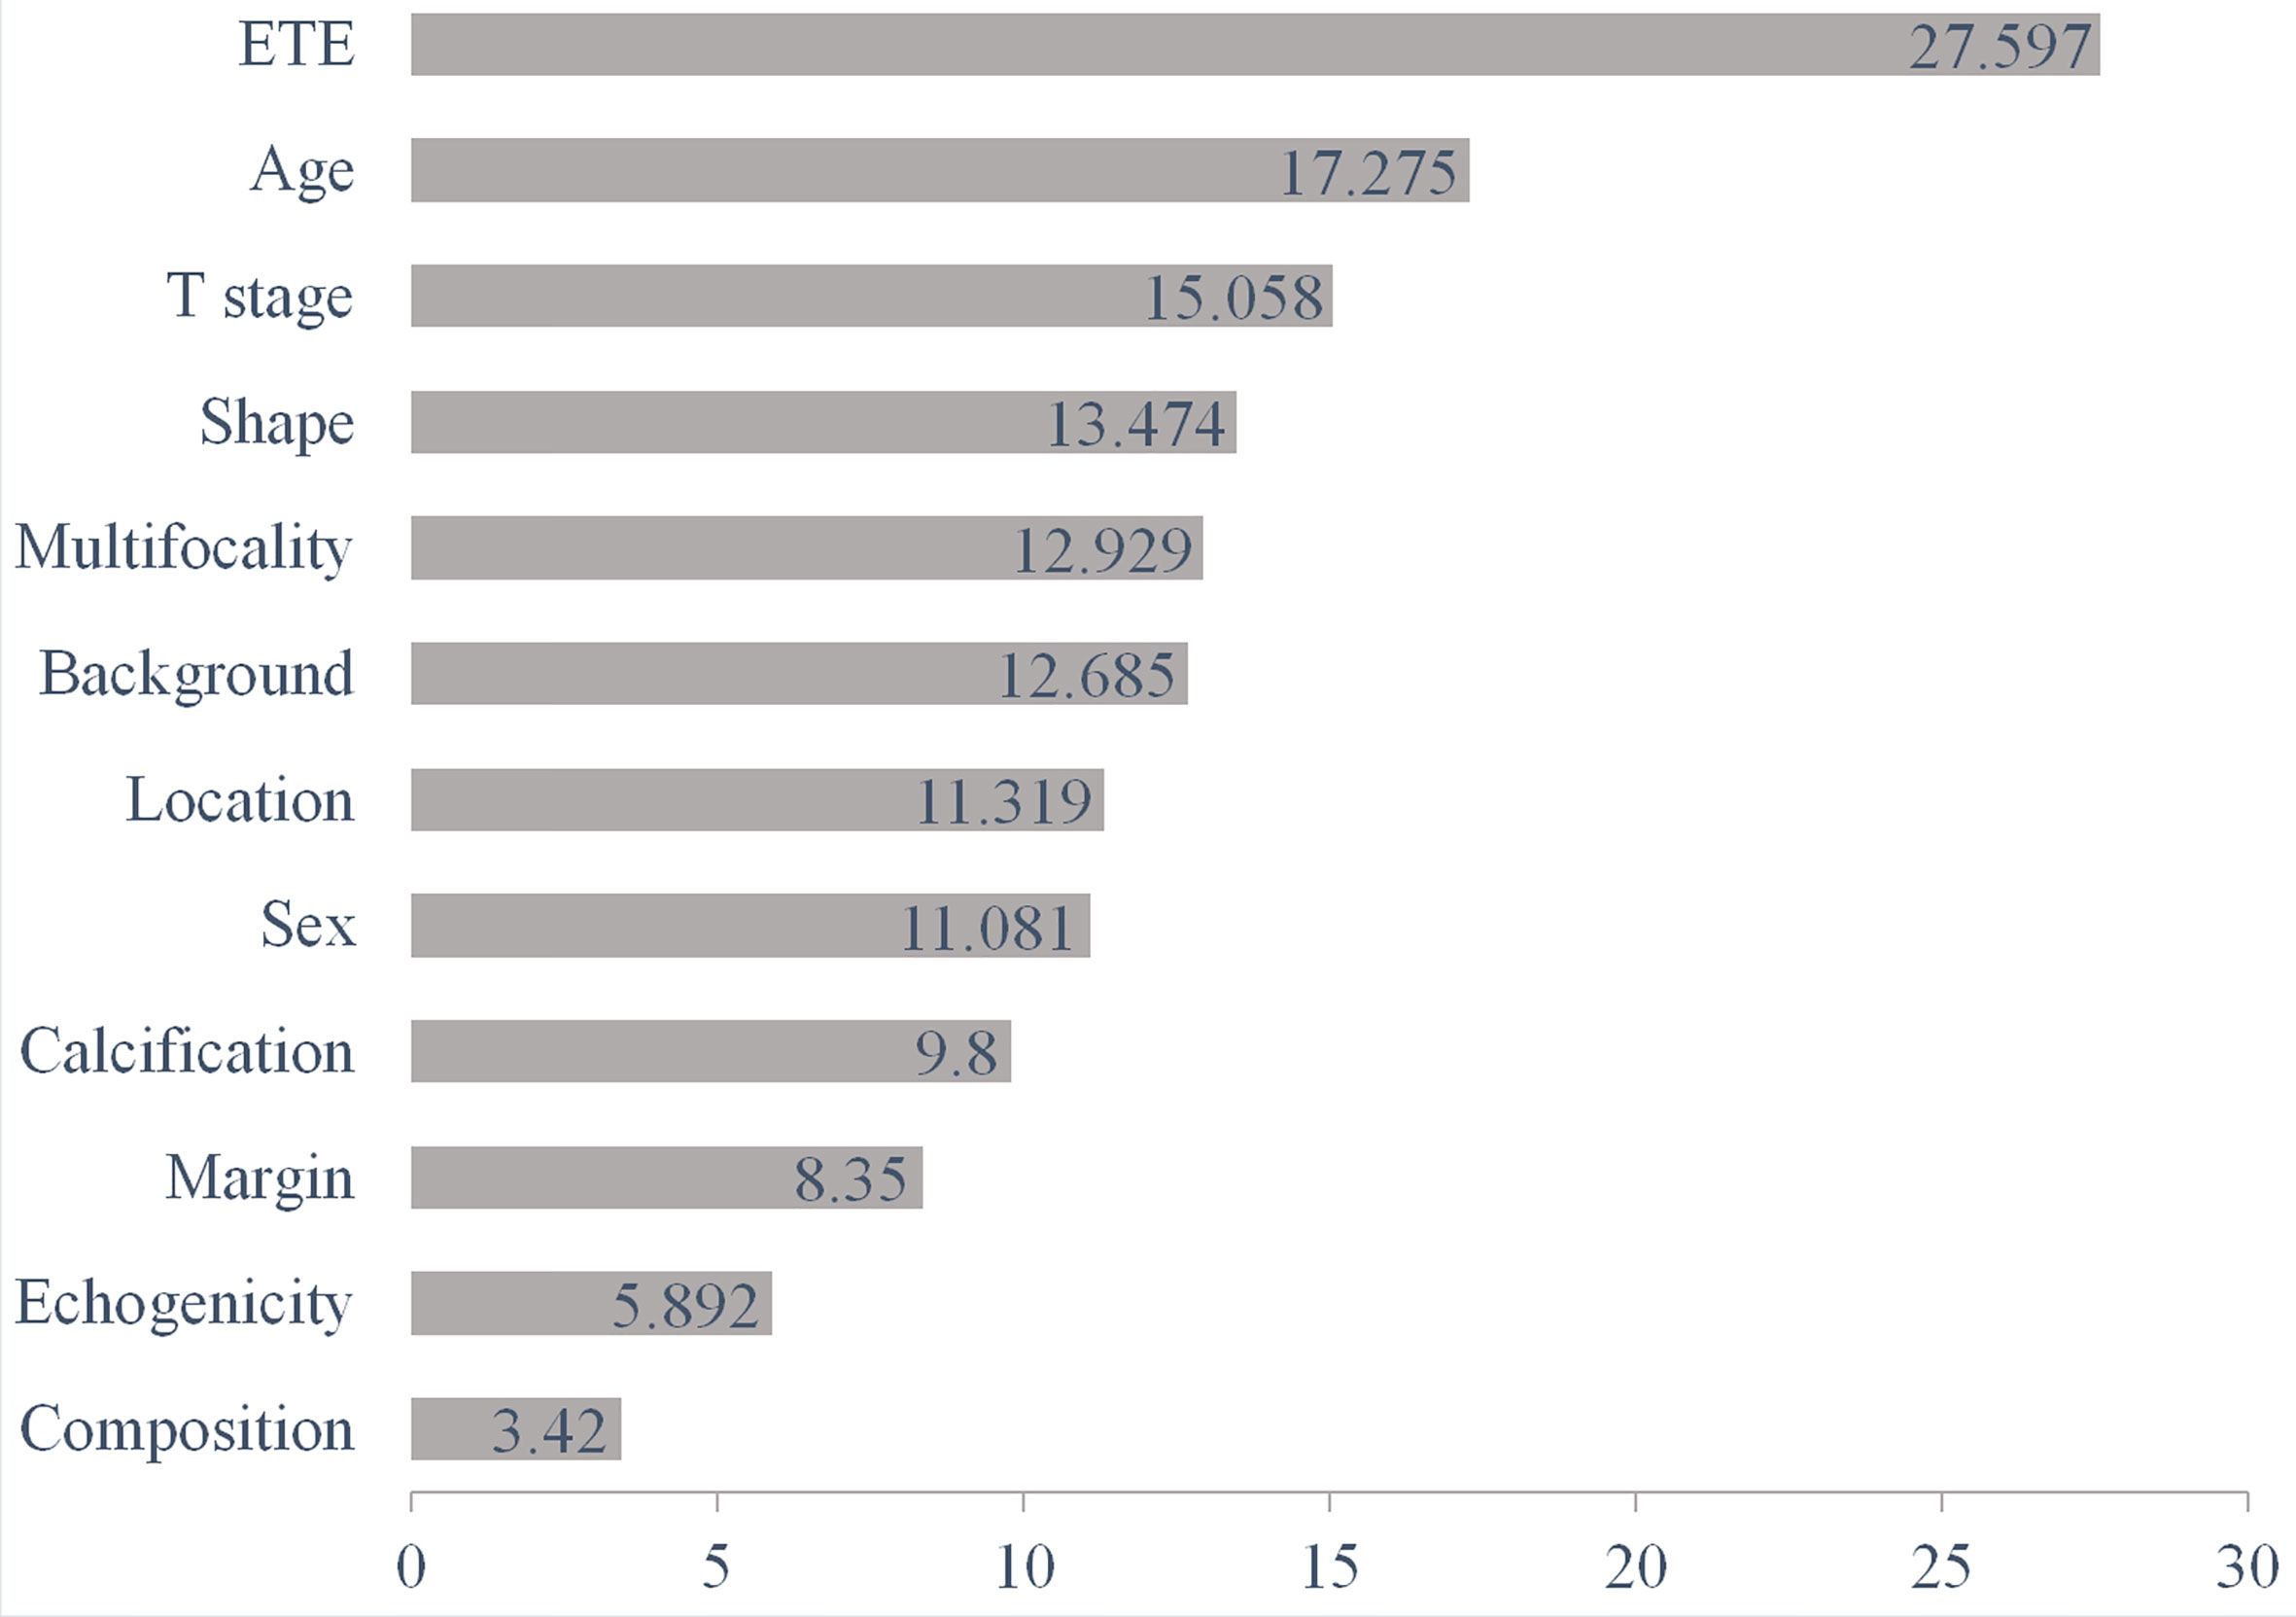
Figure 4 The diagnostic performance of the RF algorithm was most dependent on the following five top-rank features according to their mean decrease in Gini: ETE (27.597), age (17.275), T stage (15.058), shape (13.474), and multifocality (12.929). RF, random forest; ETE, extrathyroidal extension.
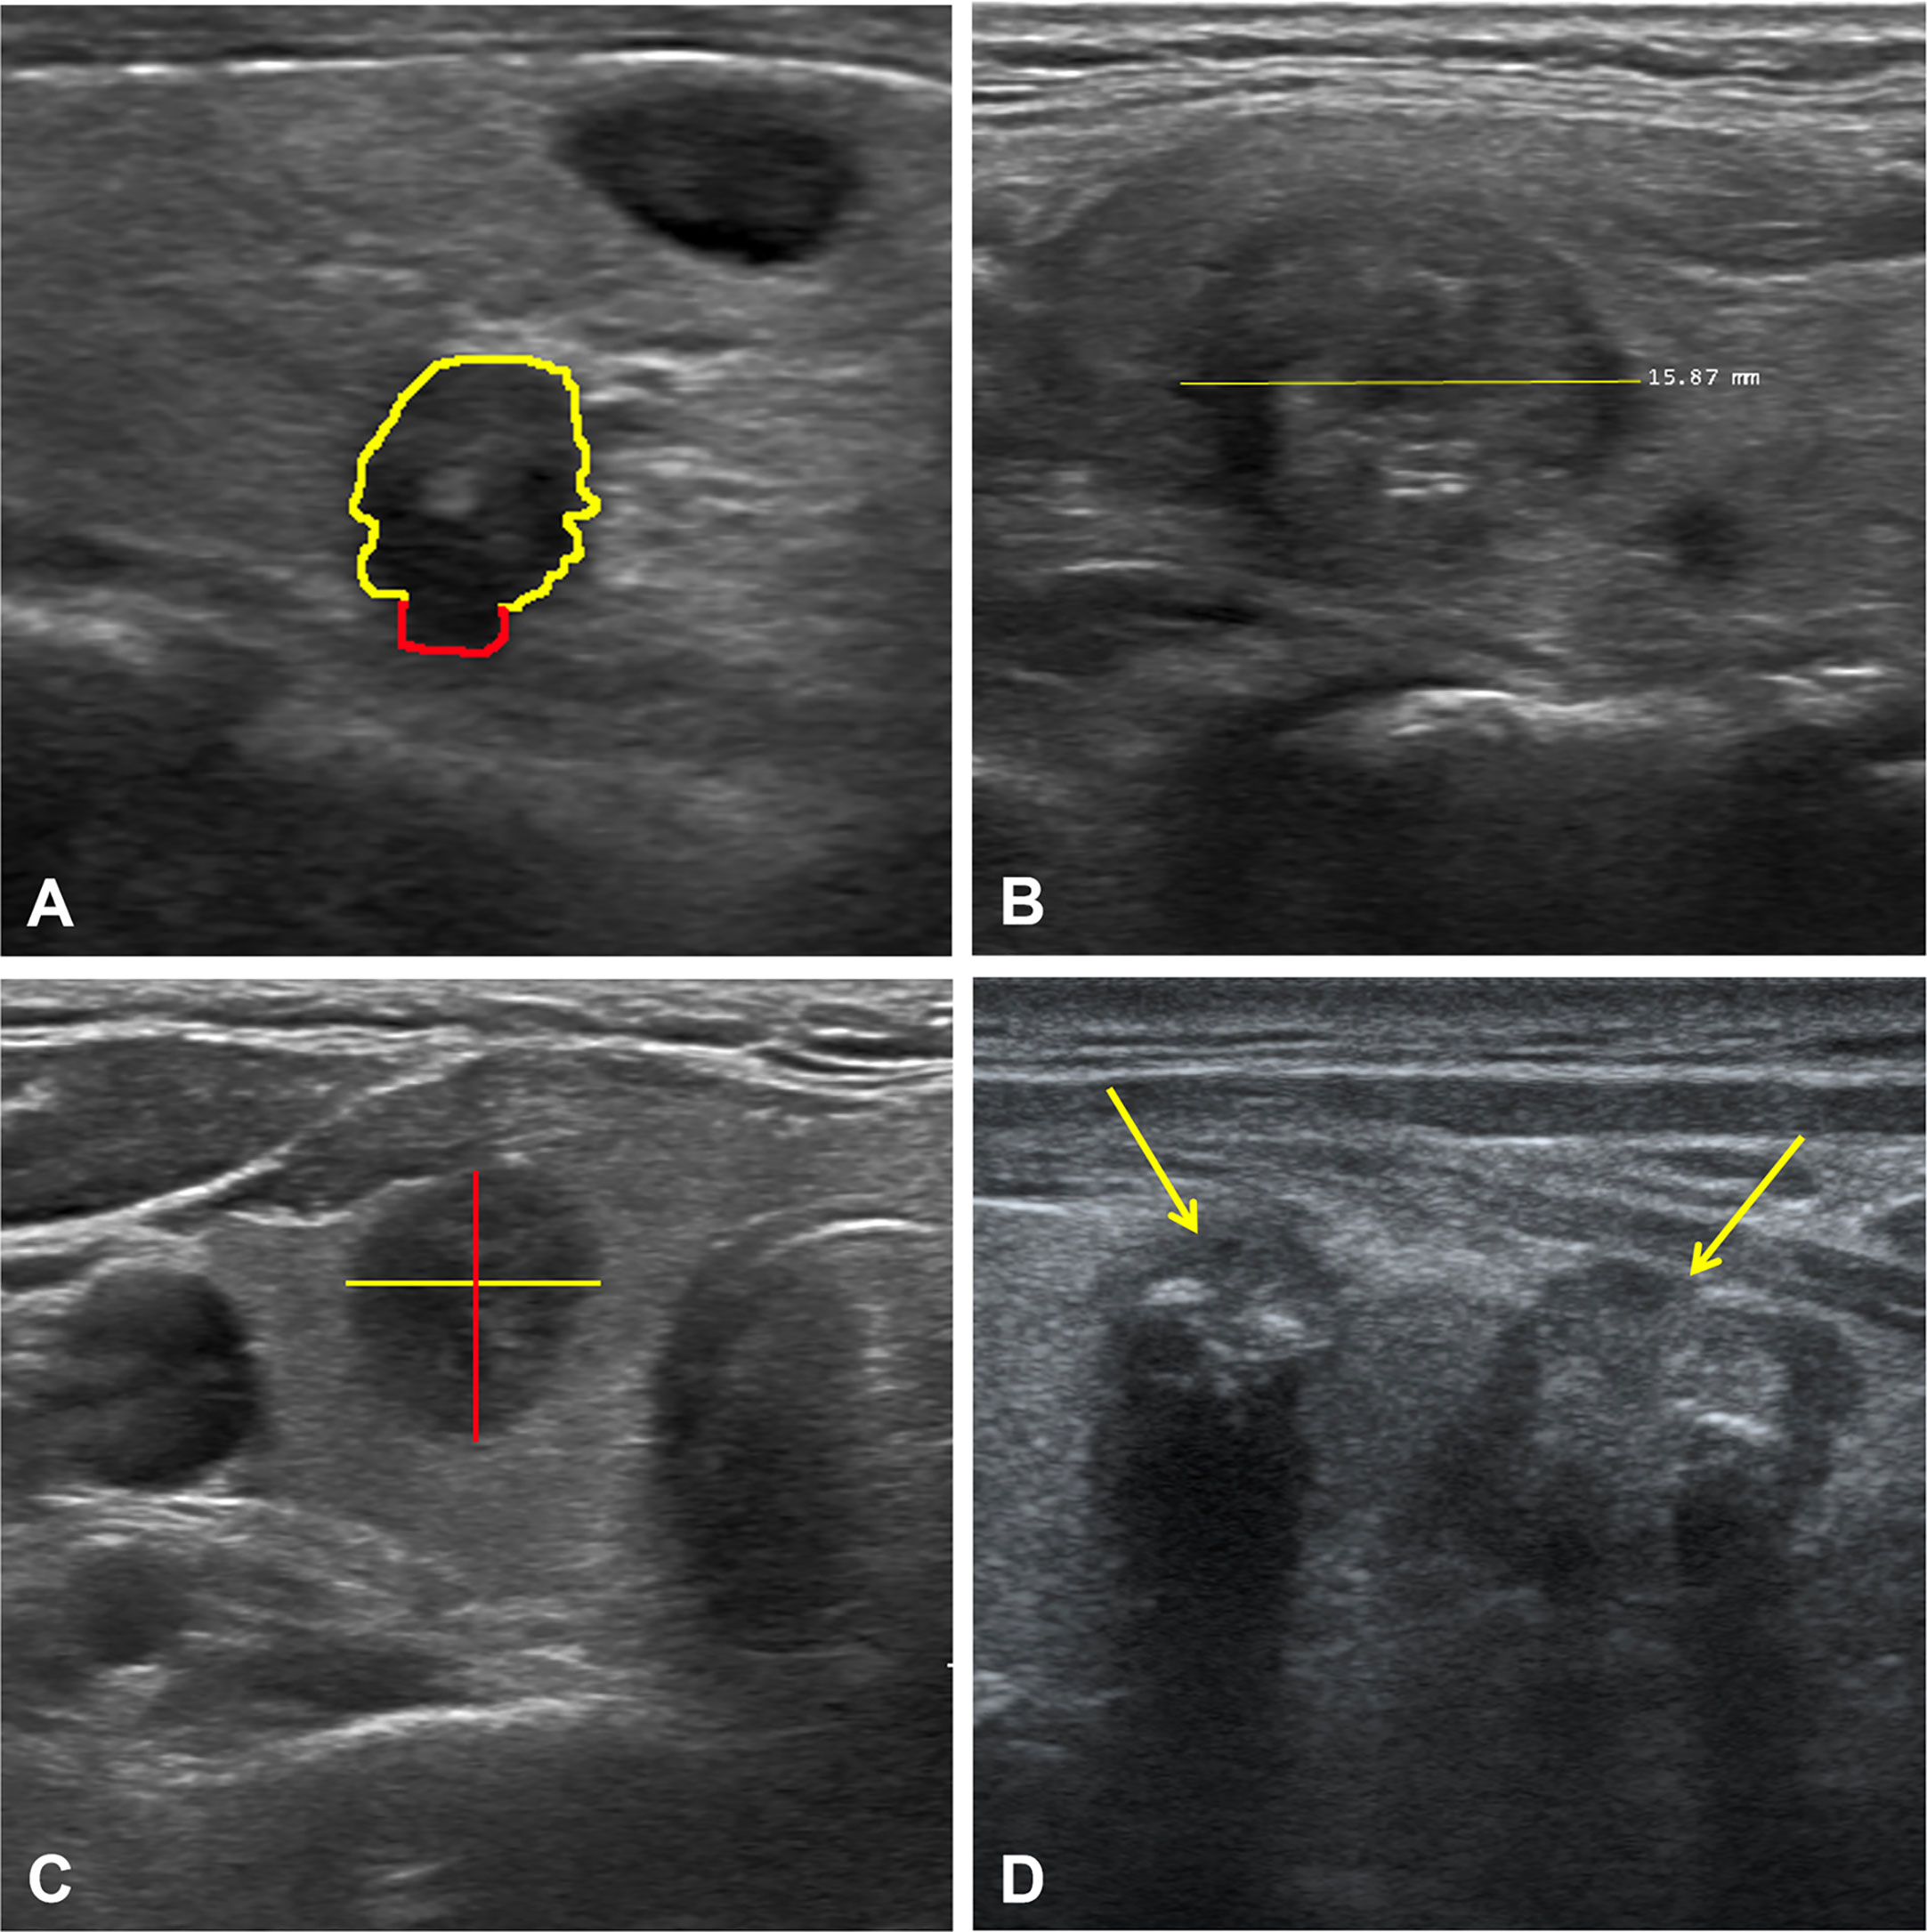
Figure 5 Ultrasound images of four representative cases. Case 1 (A): The nodule with extrathyroidal extension (red line). Case 2 (B): A solid nodule with a diameter of 1.6 cm. Case 3 (C): A hypoechoic nodule with taller-than-wide. Case 4 (D): Multifocality in the left lobe of the thyroid (yellow arrows). Together, all these features were the most essential factors in the diagnostic performance of the RF algorithm based on ultrasound features. RF, random forest.
Discussion
We developed six machine learning models in the current study to differentiate CLNM and non-CLNM in PTC patients based on preoperative ultrasound. There were three significant findings. First, the six machine learning models could distinguish CLNM from non-CLNM based on preoperative ultrasound images to some extent. Second, after comparing the six machine learning models, RF had the best prediction performance. Third, the five most important factors affecting RF’s diagnostic performance were ETE, age, T stage, shape, and multifocality.
Presently, there were many studies (27–32) on the differential diagnosis of benign and malignant thyroid nodules using machine learning, but there were only a few studies applying machine learning models to predict lymph node metastasis in PTC patients. Some studies (19, 33) exploited the deep learning model to diagnose cervical lymph node metastasis in thyroid cancer patients with computed tomography (CT), and the highest AUC was up to 90.4%. However, there is still controversy about whether or not to routinely perform CT examinations for patients with thyroid cancer internationally due to the possible impact on subsequent radioactive iodine treatment (34). Lee et al. (35) used a deep learning-based computer-aided diagnosis system for localization and diagnosis of metastatic lymph nodes in thyroid cancer patients on ultrasound, and the accuracy was up to 83.0%. But they did not compare multiple machine learning models’ performance in distinguishing metastatic lymph nodes in patients with thyroid cancer.
By training six popular machine learning classifiers based on preoperative ultrasound images to identify which one would best differentiate between CLNM and non-CLNM, we found that the RF algorithm performed best. The RF classifier was more reliable for determining CLNM by comparing it with single ultrasound features. RF was a well-known machine learning algorithm for classification tasks and had an inherent resistance to overfitting, which was an ensemble learning method. It chose random data points from the data set to build multiple decision trees and improved the final prediction performance. We applied stratified 10-fold cross-validation in the current study, which randomly divided all the data into ten parts and then held out 10% of the testing data, repeated ten times.
ETE, age, T stage, shape, and multifocality were the five most important factors affecting the CLNM diagnostic performance of RF. In our study, ETE and multifocality were also associated with CLNM, indicating that the tumor was much more aggressive, which was consistent with previous studies (36, 37). The age of 55 was considered a watershed age in the TNM staging system of the 8th AJCC (26). Li et al. (11) reported that life expectancy was reduced in patients with thyroid cancer ≥45 years (cut-off value determined by the 7th AJCC). CLNM was closely related to the patient’s prognosis. In the current study, age ≥55 years was a significant independent risk predictor of CLNM, which was consistent with the literature (38). The diameter was recognized as an independent risk factor for CLNM in patients with PTC (10, 11, 36), and our study got the same result. It may be attributed to the more extensive the tumors, the more aggressive and proliferative. Taller-than-wide was another specific for distinguishing CLNM from non-CLNM in patients with PTC, which conveyed that malignant nodules grew across regular tissue planes, while benign nodules grew parallel to normal tissue planes (36, 39).
There were five limitations in this study. First, because it was a retrospective study, it might result in a potential selection bias. Thus, a multi-center much larger sample size prospective clinical research was required in the future. Second, the images’ quality had some variability because four radiologists re-evaluated the ultrasound images; however, all radiologists had rich experience in ultrasound diagnosis of thyroid cancer and followed TI-RADS (25) for image evaluation. Third, only patients diagnosed with PTC for the first time were enrolled; however, the sonographic features of thyroid bed recurrences might be significantly different, which is one of our future research directions. Fourth, the ultrasound reporting was not standardized prospectively, i.e., ideally, each examination should follow the same procedure and record the same dataset. Fifth, external validation was needed to conduct to verify the accuracy and reliability of the machine learning models in the future.
In conclusion, our study revealed that the machine learning-assisted ultrasound examination yielded a satisfactory performance in diagnosing CLNM in patients with PTC. Among these six machine learning models, RF had the best prediction performance. To our knowledge, this was the first study involving multiple machine learning classifiers specific for CLNM based on ultrasound. We expected that a machine learning model with better performance could help distinguish metastatic lymph nodes on ultrasound and provide a simple method for clinical, surgical decision-making in the future.
Data Availability Statement
The raw data supporting the conclusions of this article will be made available by the authors, without undue reservation.
Ethics Statement
The studies involving human participants were reviewed and approved by the Binzhou Medical University Hospital. Written informed consent for participation was not required for this study in accordance with the national legislation and the institutional requirements.
Author Contributions
YZ, YS, JL, and FS contributed to the conception and design of the study and wrote the draft of the manuscript. GC and ML organized the database. YZ performed the statistical analysis. All authors contributed to the article and approved the submitted version.
Conflict of Interest
The authors declare that the research was conducted in the absence of any commercial or financial relationships that could be construed as a potential conflict of interest.
Acknowledgments
Thanks to Professor Shuang Xia of Tianjin First Central Hospital for her valuable comments and suggestions on the conception, revision, and submission of this article.
Supplementary Material
The Supplementary Material for this article can be found online at: https://www.frontiersin.org/articles/10.3389/fonc.2021.656127/full#supplementary-material
References
1. Siegel RL, Miller KD, Jemal A. Cancer Statistics, 2019. CA: Cancer J Clin (2019) 69(1):7–34. doi: 10.3322/caac.21551
2. Chen W, Zheng R, Baade PD, Zhang S, Zeng H, Bray F, et al. Cancer Statistics in China, 2015. CA: Cancer J Clin (2016) 66(2):115–32. doi: 10.3322/caac.21338
3. McLeod DS, Sawka AM, Cooper DS. Controversies in Primary Treatment of Low-Risk Papillary Thyroid Cancer. Lancet (London England) (2013) 381(9871):1046–57. doi: 10.1016/s0140-6736(12)62205-3
4. Aboelnaga EM, Ahmed RA. Difference Between Papillary and Follicular Thyroid Carcinoma Outcomes: An Experience From Egyptian Institution. Cancer Biol Med (2015) 12:53–9. doi: 10.7497/j.issn.2095-3941.2015.0005
5. Feng JW, Yang XH, Wu BQ, Sun DL, Jiang Y, Qu Z. Predictive Factors for Central Lymph Node and Lateral Cervical Lymph Node Metastases in Papillary Thyroid Carcinoma. Clin Trans Oncol (2019) 21(11):1482–91. doi: 10.1007/s12094-019-02076-0
6. Haugen BR. 2015 American Thyroid Association Management Guidelines for Adult Patients With Thyroid Nodules and Differentiated Thyroid Cancer: What is New and What has Changed? Cancer (2017) 123(3):372–81. doi: 10.1002/cncr.30360
7. Yeh MW, Bauer AJ, Bernet VA, Ferris RL, Loevner LA, Mandel SJ, et al. American Thyroid Association Statement on Preoperative Imaging for Thyroid Cancer Surgery. Thyroid (2015) 25(1):3–14. doi: 10.1089/thy.2014.0096
8. Zhang L, Yang J, Sun Q, Liu Y, Liang F, Liu Z, et al. Risk Factors for Lymph Node Metastasis in Papillary Thyroid Microcarcinoma: Older Patients With Fewer Lymph Node Metastases. Eur J Surg Oncol (2016) 42(10):1478–82. doi: 10.1016/j.ejso.2016.07.002
9. Cho SY, Lee TH, Ku YH, Kim HI, Lee GH, Kim MJ. Central Lymph Node Metastasis in Papillary Thyroid Microcarcinoma can be Stratified According to the Number, the Size of Metastatic Foci, and the Presence of Desmoplasia. Surgery (2015) 157(1):111–8. doi: 10.1016/j.surg.2014.05.023
10. Xu SY, Yao JJ, Zhou W, Chen L, Zhan WW. Clinical Characteristics and Ultrasonographic Features for Predicting Central Lymph Node Metastasis in Clinically Node-Negative Papillary Thyroid Carcinoma Without Capsule Invasion. Head Neck (2019) 41(11):3984–91. doi: 10.1002/hed.25941
11. Jianming L, Jibin L, Linxue Q. Suspicious Ultrasound Characteristics Correlate With Multiple Factors That Predict Central Lymph Node Metastasis of Papillary Thyroid Carcinoma: Significant Role of HBME-1. Eur J Radiol (2020) 123:108801. doi: 10.1016/j.ejrad.2019.108801
12. Xu JM, Xu XH, Xu HX, Zhang YF, Guo LH, Liu LN, et al. Prediction of Cervical Lymph Node Metastasis in Patients With Papillary Thyroid Cancer Using Combined Conventional Ultrasound, Strain Elastography, and Acoustic Radiation Force Impulse (ARFI) Elastography. Eur Radiol (2016) 26(8):2611–22. doi: 10.1007/s00330-015-4088-2
13. Zhan J, Diao X, Chen Y, Wang W, Ding H. Predicting Cervical Lymph Node Metastasis in Patients With Papillary Thyroid Cancer (PTC) - Why Contrast-Enhanced Ultrasound (CEUS) was Performed Before Thyroidectomy. Clin Hemorheol Microcirc (2019) 72(1):61–73. doi: 10.3233/CH-180454
14. West E, Mutasa S, Zhu Z, Ha R. Global Trend in Artificial Intelligence-Based Publications in Radiology From 2000 to 2018. AJR Am J Roentgenol (2019) 213(6):1204–6. doi: 10.2214/AJR.19.21346
15. Pesapane F, Codari M, Sardanelli F. Artificial Intelligence in Medical Imaging: Threat or Opportunity? Radiologists Again at the Forefront of Innovation in Medicine. Eur Radiol Exp (2018) 2(1):35. doi: 10.1186/s41747-018-0061-6
16. Zhao CK, Ren TT, Yin YF, Shi H, Wang HX, Zhou BY, et al. A Comparative Analysis of Two Machine Learning-based Diagnostic Patterns With ACR Ti-RADS for Thyroid Nodules: Diagnostic Performance and Unnecessary Biopsy Rate. Thyroid (2020) 31(3):470–81. doi: 10.1089/thy.2020.0305
17. Suh YJ, Choi YJ. Strategy to Reduce Unnecessary Surgeries in Thyroid Nodules With Cytology of Bethesda Category III (AUS/FLUS): A Retrospective Analysis of 667 Patients Diagnosed by Surgery. Endocrine (2020) 69(3):578–86. doi: 10.1007/s12020-020-02300-w
18. Zhang B, Tian J, Pei S, Chen Y, He X, Dong Y, et al. Machine Learning-Assisted System for Thyroid Nodule Diagnosis. Thyroid (2019) 29(6):858–67. doi: 10.1089/thy.2018.0380
19. Lee JH, Ha EJ, Kim JH. Application of Deep Learning to the Diagnosis of Cervical Lymph Node Metastasis From Thyroid Cancer With CT. Eur Radiol (2019) 29(10):5452–7. doi: 10.1007/s00330-019-06098-8
20. Zhu J, Zheng J, Li L, Huang R, Ren H, Wang D, et al. Application of Machine Learning Algorithms to Predict Central Lymph Node Metastasis in T1-T2, non-Invasive, and Clinically Node Negative Papillary Thyroid Carcinoma. Front Med (Lausanne) (2021) 8:635771. doi: 10.3389/fmed.2021.635771
21. Yu J, Deng Y, Liu T, Zhou J, Jia X, Xiao T, et al. Lymph Node Metastasis Prediction of Papillary Thyroid Carcinoma Based on Transfer Learning Radiomics. Nat Commun (2020) 11(1):4807. doi: 10.1038/s41467-020-18497-3
22. Wu Y, Rao K, Liu J, Han C, Gong L, Chong Y, et al. Machine Learning Algorithms for the Prediction of Central Lymph Node Metastasis in Patients With Papillary Thyroid Cancer. Front Endocrinol (Lausanne) (2020) 11:577537. doi: 10.3389/fendo.2020.577537
23. Masuda T, Nakaura T, Funama Y, Sugino K, Sato T, Yoshiura T, et al. Machine Learning to Identify Lymph Node Metastasis From Thyroid Cancer in Patients Undergoing Contrast-Enhanced CT Studies. Radiogr (Lond) (2021) S1078-8174(21):00024–9. doi: 10.1016/j.radi.2021.03.001
24. Haugen BR, Alexander EK, Bible KC, Doherty GM, Mandel SJ, Nikiforov YE, et al. 2015 American Thyroid Association Management Guidelines for Adult Patients With Thyroid Nodules and Differentiated Thyroid Cancer. Thyroid (2016) 26(1):1–33. doi: 10.1089/thy.2015.0020
25. Tessler FN, Middleton WD, Grant EG, Hoang JK, Berland LL, Teefey SA, et al. Acr Thyroid Imaging, Reporting and Data System (Ti-Rads): White Paper of the ACR Ti-RADS Committee. J Am Coll Radiol (2017) 14(5):587–95. doi: 10.1016/j.jacr.2017.01.046
26. Shteinshnaider M, Muallem Kalmovich L, Koren S, Or K, Cantrell D, Benbassat C. Reassessment of Differentiated Thyroid Cancer Patients Using the Eighth Tnm/Ajcc Classification System: A Comparative Study. Thyroid (2018) 28(2):201–9. doi: 10.1089/thy.2017.0265
27. Choi YJ, Baek JH, Park HS, Shim WH, Kim TY, Shong YK, et al. A Computer-Aided Diagnosis System Using Artificial Intelligence for the Diagnosis and Characterization of Thyroid Nodules on Ultrasound: Initial Clinical Assessment. Thyroid Res (2017) 27(4):546–52. doi: 10.1089/thy.2016.0372
28. Sollini M, Cozzi L, Chiti A, Kirienko M. Texture Analysis and Machine Learning to Characterize Suspected Thyroid Nodules and Differentiated Thyroid Cancer: Where do We Stand? Eur J Radiol (2018) 99:1–8. doi: 10.1016/j.ejrad.2017.12.004
29. Zhang B, Tian J, Pei S, Chen Y, He X, Dong Y, et al. Machine Learning-Assisted System for Thyroid Nodule Diagnosis. Thyroid Res (2019) 29(6):858–67. doi: 10.1089/thy.2018.0380
30. Jeong EY, Kim HL, Ha EJ, Park SY, Cho YJ, Han M. Computer-Aided Diagnosis System for Thyroid Nodules on Ultrasonography: Diagnostic Performance and Reproducibility Based on the Experience Level of Operators. Eur Radiol (2019) 29(4):1978–85. doi: 10.1007/s00330-018-5772-9
31. Zhao C-K, Ren T-T, Yin Y-F, Shi H, Wang H-X, Zhou B-Y, et al. A Comparative Analysis of Two Machine Learning-based Diagnostic Patterns With Thyroid Imaging Reporting and Data System for Thyroid Nodules: Diagnostic Performance and Unnecessary Biopsy Rate. Thyroid Res (2020) 31(3):470–81. doi: 10.1089/thy.2020.0305
32. Luo W, Zhang Y, Yuan J, Ang XY, Pang L, Ding L, et al. Differential Diagnosis of Thyroid Nodules Through a Combination of Multiple Ultrasonography Techniques: A Decision–Tree Model. Exp Ther Med (2020) 19:3675–83. doi: 10.3892/etm.2020.8621
33. Lee JH, Ha EJ, Kim D, Jung YJ, Heo S, Jang YH, et al. Application of Deep Learning to the Diagnosis of Cervical Lymph Node Metastasis From Thyroid Cancer With CT: External Validation and Clinical Utility for Resident Training. Eur Radiol (2020) 30(6):3066–72. doi: 10.1007/s00330-019-06652-4
34. Sohn SY, Choi JH, Kim NK, Joung JY, Cho YY, Park SM, et al. The Impact of Iodinated Contrast Agent Administered During Preoperative Computed Tomography Scan on Body Iodine Pool in Patients With Differentiated Thyroid Cancer Preparing for Radioactive Iodine Treatment. Thyroid (2014) 24(5):872–7. doi: 10.1089/thy.2013.0238
35. Lee JH, Baek JH, Kim JH, Shim WH, Chung SR, Choi YJ, et al. Deep Learning-Based Computer-Aided Diagnosis System for Localization and Diagnosis of Metastatic Lymph Nodes on Ultrasound: A Pilot Study. Thyroid (2018) 28(10):1332–8. doi: 10.1089/thy.2018.0082
36. Wei X, Wang M, Wang X, Zheng X, Li Y, Pan Y, et al. Prediction of Cervical Lymph Node Metastases in Papillary Thyroid Microcarcinoma by Sonographic Features of the Primary Site. Cancer Biol Med (2019) 16(3):587–94. doi: 10.20892/j.issn.2095-3941.2018.0310
37. Jiali M, Xiaofeng L, Fangxuan L, Juntian L, Sheng Z, Jing T. Ultrasound Features of Extranodal Extension in the Metastatic Cervical Lymph Nodes of Papillary Thyroid Cancer: A Case-Control Study. Cancer Biol Med (2018) 15(2):171–7. doi: 10.20892/j.issn.2095-3941.2017.0092
38. Jianyong L, Jinjing Z, Zhihui L, Tao W, Rixiang G, Jingqiang Z. A Nomogram Based on the Characteristics of Metastatic Lymph Nodes to Predict Papillary Thyroid Carcinoma Recurrence. Thyroid (2018) 28(3):301–10. doi: 10.1089/thy.2017.0422
Keywords: machine learning, papillary thyroid carcinoma, lymphatic metastasis, ultrasound, random forest
Citation: Zou Y, Shi Y, Liu J, Cui G, Yang Z, Liu M and Sun F (2021) A Comparative Analysis of Six Machine Learning Models Based on Ultrasound to Distinguish the Possibility of Central Cervical Lymph Node Metastasis in Patients With Papillary Thyroid Carcinoma. Front. Oncol. 11:656127. doi: 10.3389/fonc.2021.656127
Received: 20 January 2021; Accepted: 06 May 2021;
Published: 25 June 2021.
Edited by:
Ben O’Leary, Institute of Cancer Research (ICR), United KingdomReviewed by:
Giuseppe Mercante, Humanitas University, ItalyBenjamin Hunter, Imperial College London, United Kingdom
Copyright © 2021 Zou, Shi, Liu, Cui, Yang, Liu and Sun. This is an open-access article distributed under the terms of the Creative Commons Attribution License (CC BY). The use, distribution or reproduction in other forums is permitted, provided the original author(s) and the copyright owner(s) are credited and that the original publication in this journal is cited, in accordance with accepted academic practice. No use, distribution or reproduction is permitted which does not comply with these terms.
*Correspondence: Fang Sun, c3VuZmFuZ2RvY0AxNjMuY29t
†These authors share first authorship