 Wentao Mu
 Lingyu Guo
 Yang Liu4
 Shanglei Ning
- 1Department of Hepatobiliary and Pancreatic Surgery, The First Hospital of Jilin University, Changchun, China
- 2Department of Hepatobiliary Surgery, General Surgery, Qilu Hospital of Shandong University, Jinan, China
- 3Department of Urology, Second Affiliated Hospital of Xi’an Jiaotong University, Xi'an, China
- 4Department of Hepatobiliary Surgery, Taian City Central Hospital of Shandong Province, Tai'an, China
- 5Department of Colorectal and Anal Surgery, The First Affiliated Hospital of Shandong First Medical University, Jinan, China
Objective: The purpose of the study is to explore the potential competing endogenous RNA (ceRNA) network and investigate the molecular mechanism of long noncoding RNA (lncRNA) small nucleolar RNA host gene 1 (SNHG1) in hepatocellular carcinoma (HCC) development.
Methods: By analyzing the data of HCC in The Cancer Genome Atlas (TCGA) database, we included differentially expressed lncRNA and microRNA (miRNA) profiles and constructed ceRNA networks related to the prognosis of HCC patients. qRT-PCR, Western blotting, 3-(4,5-Dimethylthiazol-2-yl)-2,5-diphenyltetrazolium bromide (MTT), transwell assay, and the nude mouse model were employed to test the effects of SNHG1 and LMNB2 on tumor proliferation and growth in vitro and in vivo.
Results: In the study, we identified 115 messenger RNAs (mRNAs), 12 lncRNAs, and 37 miRNAs by intersecting differentially expressed genes (DEGs) in TCGA and StarBase databases. Then, SNHG1–miR-326–LMNB2 pathway came into notice after further survival analysis and hub gene screening. Our results showed that SNHG1 expression was upregulated significantly in HCC tissues and cell lines. Downregulation of both LMNB2, the target of miR-326 in HCC, and SNHG1 inhibited tumor proliferation and growth in vitro and in vivo. Furthermore, SNHG1 could regulate LMNB2 expression through binding to miR-326 in HCC cell lines.
Conclusion: SNHG1 is a promising prognostic factor in HCC, and the SNHG1–miR-326–LMNB2 axis may be a potential therapeutic target for HCC.
Introduction
Hepatocellular carcinoma (HCC) is the fourth most common cause of cancer-related death worldwide and the sixth leading cause of incident cancer cases (1, 2). The majority of HCC mainly occurs in patients with hepatitis B virus (HBV) infection, hepatitis C virus (HCV) infection, and alcohol abuse (3). Although the 5-year survival rate of early-stage HCC is about 60% these years, the prognosis of most patients with unresectable HCC is still very poor (4), despite recent advances in surgery and systematic therapy. Besides, HCC is a highly heterogeneous tumor that may be the main cause of treatment failure, so the biological diversity of HCC poses a considerable challenge for individualized therapy (5, 6). Therefore, it is urgent to explore the molecular mechanism of tumor progression and identify novel therapeutic targets for HCC.
Long noncoding RNAs (lncRNAs) are a set of RNA transcripts longer than 200 nucleotides that are not for translation but capable of regulating the expression of different genes (7). Emerging evidence has suggested that lncRNAs participate in tumor proliferation, invasion, apoptosis, and other biological processes (8–11). Generally, lncRNAs acted as a competing endogenous RNA (ceRNA) and bound with specific microRNA (miRNA), regulating the corresponding downstream messenger RNA (mRNA) translation (12–14). Although SNHG1 has been reported to function as an oncogene through sponging miR-195-5p (15), miR-377-3p (16), and miR-195 (17) in HCC, in the present study, we made use of The Cancer Genome Atlas (TCGA) database and identified a novel molecular mechanism of SNHG1 in HCC growth.
Our data demonstrated the crucial roles of SNHG1 in HCC proliferation and invasion in vitro and in vivo. Furthermore, we innovatively demonstrated that SNHG1 promoted HCC growth through competitively binding to microRNA-326 (miR-326) to regulate LMNB2 expression, which provided a novel insight into the mechanism of HCC progression.
Materials and Methods
Data Source
The published HCC cohort dataset, including gene expression profiles and relevant clinical information, can be downloaded from TCGA data portal (18). The clinical information of patients includes age, gender, preoperative diagnosis, Child–Pugh score of liver function, radical resection, postoperative pathological diagnosis, pathological grading and staging, survival time, last follow-up time, and so on. Only the survival time-related data in the complex clinical data are used, so only the data needed in the article are shown in (Supplementary Tables 1 and 2). Data acquisition and application were conducted in accordance with TCGA release guidelines and data access policy without additional approval from the local ethics committee.
Screening of Differentially Expressed mRNA, lncRNA, and miRNA
The limma package in R language (version 3.6.1) was subsequently used for the calculation of DEGs. Gene counts >0, the adjusted p value <0.05, and |log2 fold change|>1 were set as the cutoff criteria. Similarly, Differentially Expressed microRNAs (DEmiRs) were selected by the three cutoff values, Gene Counts >0, the adjusted p value <0.05, and |log2 fold change|>1. Heat maps and volcanic maps were drawn using R language. Then, the principal component analysis (PCA) figure about the samples was performed.
Function and Pathway Enrichment Analysis
In order to understand the biological functions of selected DEGs and DEmiRs, we performed the enrichment analysis of DEGs and DEmiRs in Gene Ontology (GO) terms and Kyoto Encyclopedia of Genes and Genomes (KEGG) Database Pathways. The clusterProfiler (version 3.12.0) (19) package in R language was used for revealing the roles of DEGs in biological process (BP), cellular component (CC), and molecular function (MF). The adjusted p value was less than 0.01 and considered statistically significant.
The ceRNA Network Construction
R language GDCRNATools package was used to search and match on StarBase database and find out the common miRNAs targeting mRNA and lncRNA (20, 21). The mRNA and lncRNA are negatively correlated with miRNA, but mRNA and lncRNA present a positive correlation. Hypergeometric distribution test was used to assess the importance between each pair of them. We used false discovery rate (FDR) to correct p values while FDR <0.05 is the cutoff value. Meanwhile, the regulation of similarity correlation with miRNAs (similarity of correlation between miRNA and lncRNA expression and correlation between miRNA and mRNA expression) is not equal to zero. All the competitive lncRNA and mRNA were mixed together after we identified them under the conditions above. Finally, ceRNA network diagram was established in the Cytoscape (3.7.2) for visualization.
Establishment of ceRNA Network Associated With Hepatocellular Carcinoma Patient Survival
In order to find out the survival-related lncRNA–miRNA–mRNA pathways, we conducted a single-factor survival analysis on each lncRNA, mRNA, and miRNA node in the ceRNA network. The node was marked in the ceRNA network diagram, and the survival-related ceRNA network was constructed through the survival-related node. Then, samples were divided into the high-expression group and the low-expression group according to the median expression of each gene. The Kaplan–Meier survival was used to evaluate the difference of overall survival (OS) time between the two groups. Finally the SNHG1–miR-326–LMNB2 pathway was selected, and the effects of this pathway were experimentally verified in our study.
Cell Lines
The human hepatocellular cancer cell lines (Huh7 and PLC) were obtained from the Cell Bank of Chinese Academy of Sciences, Shanghai Branch. The Huh7 and PLC cells were cultured in Dulbecco’s modified Eagle’s medium (DMEM) with 10% fetal bovine serum in 5% CO2 and 90% humidity at 37°C.
Cell Transduction
The lentivirus vectors (sh-SNHG1, sh-LMNB2) and small interfering RNAs (siRNAs) against human SNHG1 or LMNB2 were synthesized by GenePharma Co. Ltd. The stable Huh7 cells with SNHG1 and LMNB2 knocked down were generated using lentiviral vectors. Infected cells were then treated with puromycin (2 µg/ml) for 2 days, and surviving cells were maintained in complete medium with puromycin (0.5 µg/ml). The siRNAs were transfected into hepatocellular cancer cells using Lipofectamine 2000 (Thermo Fisher Scientific, Inc.) according to their instructions. Besides, miR-326 mimics, miR-326 inhibitors, and negative controls were purchased from GenePharma Co. Ltd. When the cell confluence reached 50%, oligonucleotide transfection was performed using Lipofectamine 2000 according to the manufacturer’s protocol.
Luciferase Reporter Assay
We constructed the wild-type plasmid SNHG1-WT and the mutant plasmid SNHG1-MUT. PLC and HuH7 cells that were seeded in 24-well plates were cotransfected with miR-326 mimic or negative control and wild-type or mutant plasmids using Lipofectamine 2000. The luciferase intensity on the microplate was measured with the Dual-Luciferase Reporter Assay System (Promega Corp.), and Renilla luciferase activity was normalized to firefly luciferase activity.
Western Blotting
The total protein was extracted from the cells using radioimmunoprecipitation assay lysis buffer with protease inhibitors. Each lane is loaded with the same amount of total protein (20 μg), and the sample is separated by 10% sodium dodecyl sulfate polyacrylamide gel electropheresis (SDS PAGE) and then transferred to a polyvinylidene fluoride membrane (Roche Diagnostics). After blocking with 5% skim milk at room temperature for 1 h, primary antibody LMNB2 (Abcam) or glyceraldehyde 3-phosphate dehydrogenase (GAPDH; Abcam) was used at 4°C overnight. Subsequently, the membranes were incubated with anti-rabbit (1:3,000, cat. no. 7074, Cell Signaling Technology, Inc.) horseradish peroxidase-conjugated secondary antibodies at 37°C for 1 h. Finally, ECL Western blot substrate (Promega corp.) and FluorChem E system (Protein Simple) were used to observe the immune response zone.
qPCR
According to the manufacturer’s protocol, TRIzol reagent (Thermo Fisher Scientific, Inc.) was used to extract total RNA from cells and tissues. The RNA purity was evaluated based on the A260/280 ratio. RNA was reverse transcribed into cDNA using miRNA first-strand cDNA synthesis kit [Accurate Biotechnology (Hunan) Co., Ltd.]. SYBR Green Premix Pro Taq HS qPCR Kit II [Accurate Biotechnology (Hunan) Co., Ltd.] was used for qPCR to detect the relative expression of the target gene. Thermal cycling conditions are as follows: Initial denaturation at 95°C for 30 sec; 40 cycles of 5 sec at 95°C; 1 min at 60°C and 72°C for 15 sec; with a final extension cycle at 72°C for 5 min. Finally, it step in the dissociation stage. The relative levels were calculated using the 2-ΔΔCq method. The endogenous control gene is GAPDH. The primer sequence is shown in Table 1.
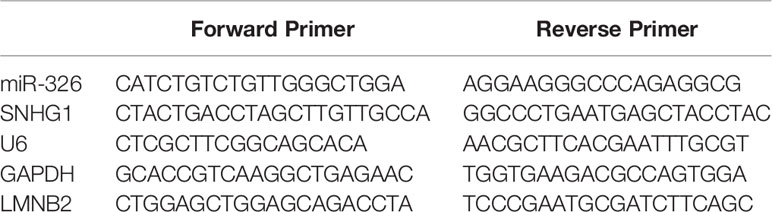
Table 1 qPCR primers.
Cell Migration and Invasion Assays
Cells (1 × 10⁵) were seeded in the upper chamber of a Boyden chamber (8 μm aperture) in 200 μl of serum-free medium (Corning Corporation). The lower chamber was filled with 700 μl containing 10% fetal bovine serum (Gibco) as a chemical attractant. After 24 h of incubation at 37°C, cells remaining on the upper side of the membrane were removed with a cotton swab, and the cells that had migrated to the lower side of the membrane were fixed with 70% ethanol for 20 min and stained with 0.1% crystal violet for 20 min at room temperature. Then, the cells were counted with an optical microscope. The method of the invasion test is similar to cell migration assay except that the Boyden chamber is covered with a matrix before seeding the cells.
Wound Healing Test
The cells were seeded in six-well plates and cultured to 80% confluence before we scratched the cell layer with a 20-μl pipette tip. The cells were then incubated in fresh medium containing 10% fetal bovine serum for 48 h. Scratches were observed under a fluorescence microscope after 24 and 48 h.
In Vivo Assay
Female nude mice (aged 5–6 weeks, weight 18–22 g) were purchased from Hangzhou Ziyuan Biology and bred in a 12-h light/dark cycle and sterile conditions (temperature 26°C–28°C, humidity 40%–60%) with free access to water and food. We injected 3 × 10⁶ cells into the fore limbs of nude mice to generate transplanted tumors and measure the tumor size with a caliper every 3 days. After 19 days, the mice were sacrificed, and tumor images were captured. Tumor volume was calculated with the formula: maximum diameter × (minimum diameter) 2 × 0.5.
Statistical Analysis
Statistical analysis was performed using SPSS 19.0 software (SPSS Inc., Chicago, IL, USA). The summary data are expressed as the mean ± standard error of the mean (SEM). We use the χ2 test, Student’s t-test, or one-way analysis of variance with the least significant difference correction to assess the differences between groups. Spearman rank correlation analysis was used to evaluate linear regression. p value less than 0.05 was considered to be statistically significant in all cases.
Ethics Approval and Consent to Participate
The study protocol was approved by the research ethics committee of the Qilu Hospital of Shandong University.
Results
Identification of Differentially Expressed Genes and Differentially Expressed microRNAs (DEmiR)
Firstly, 421 HCC patient samples with para-tumor tissue available from TCGA database were analyzed using R language tools. We used p value <0.05 and |log2 fold change|>1 as cutoffs to identify differential gene profiles. As a result, a total of 2,416 differentially expressed genes (DEGs), 2,181 differentially expressed mRNAs, and 148 differentially expressed lncRNAs were identified (Figures 1A–C). The green dots represent downregulated genes, and the red dots represent upregulated genes. Black dots represent genes without statistically significant change. The heatmap shows the DEGs between the primary tumor (red) and solid tissue normal (blue). Moreover, 131 differentially expressed miRNAs were screened using both R language and GDCRNATools (Figures 1D–F).
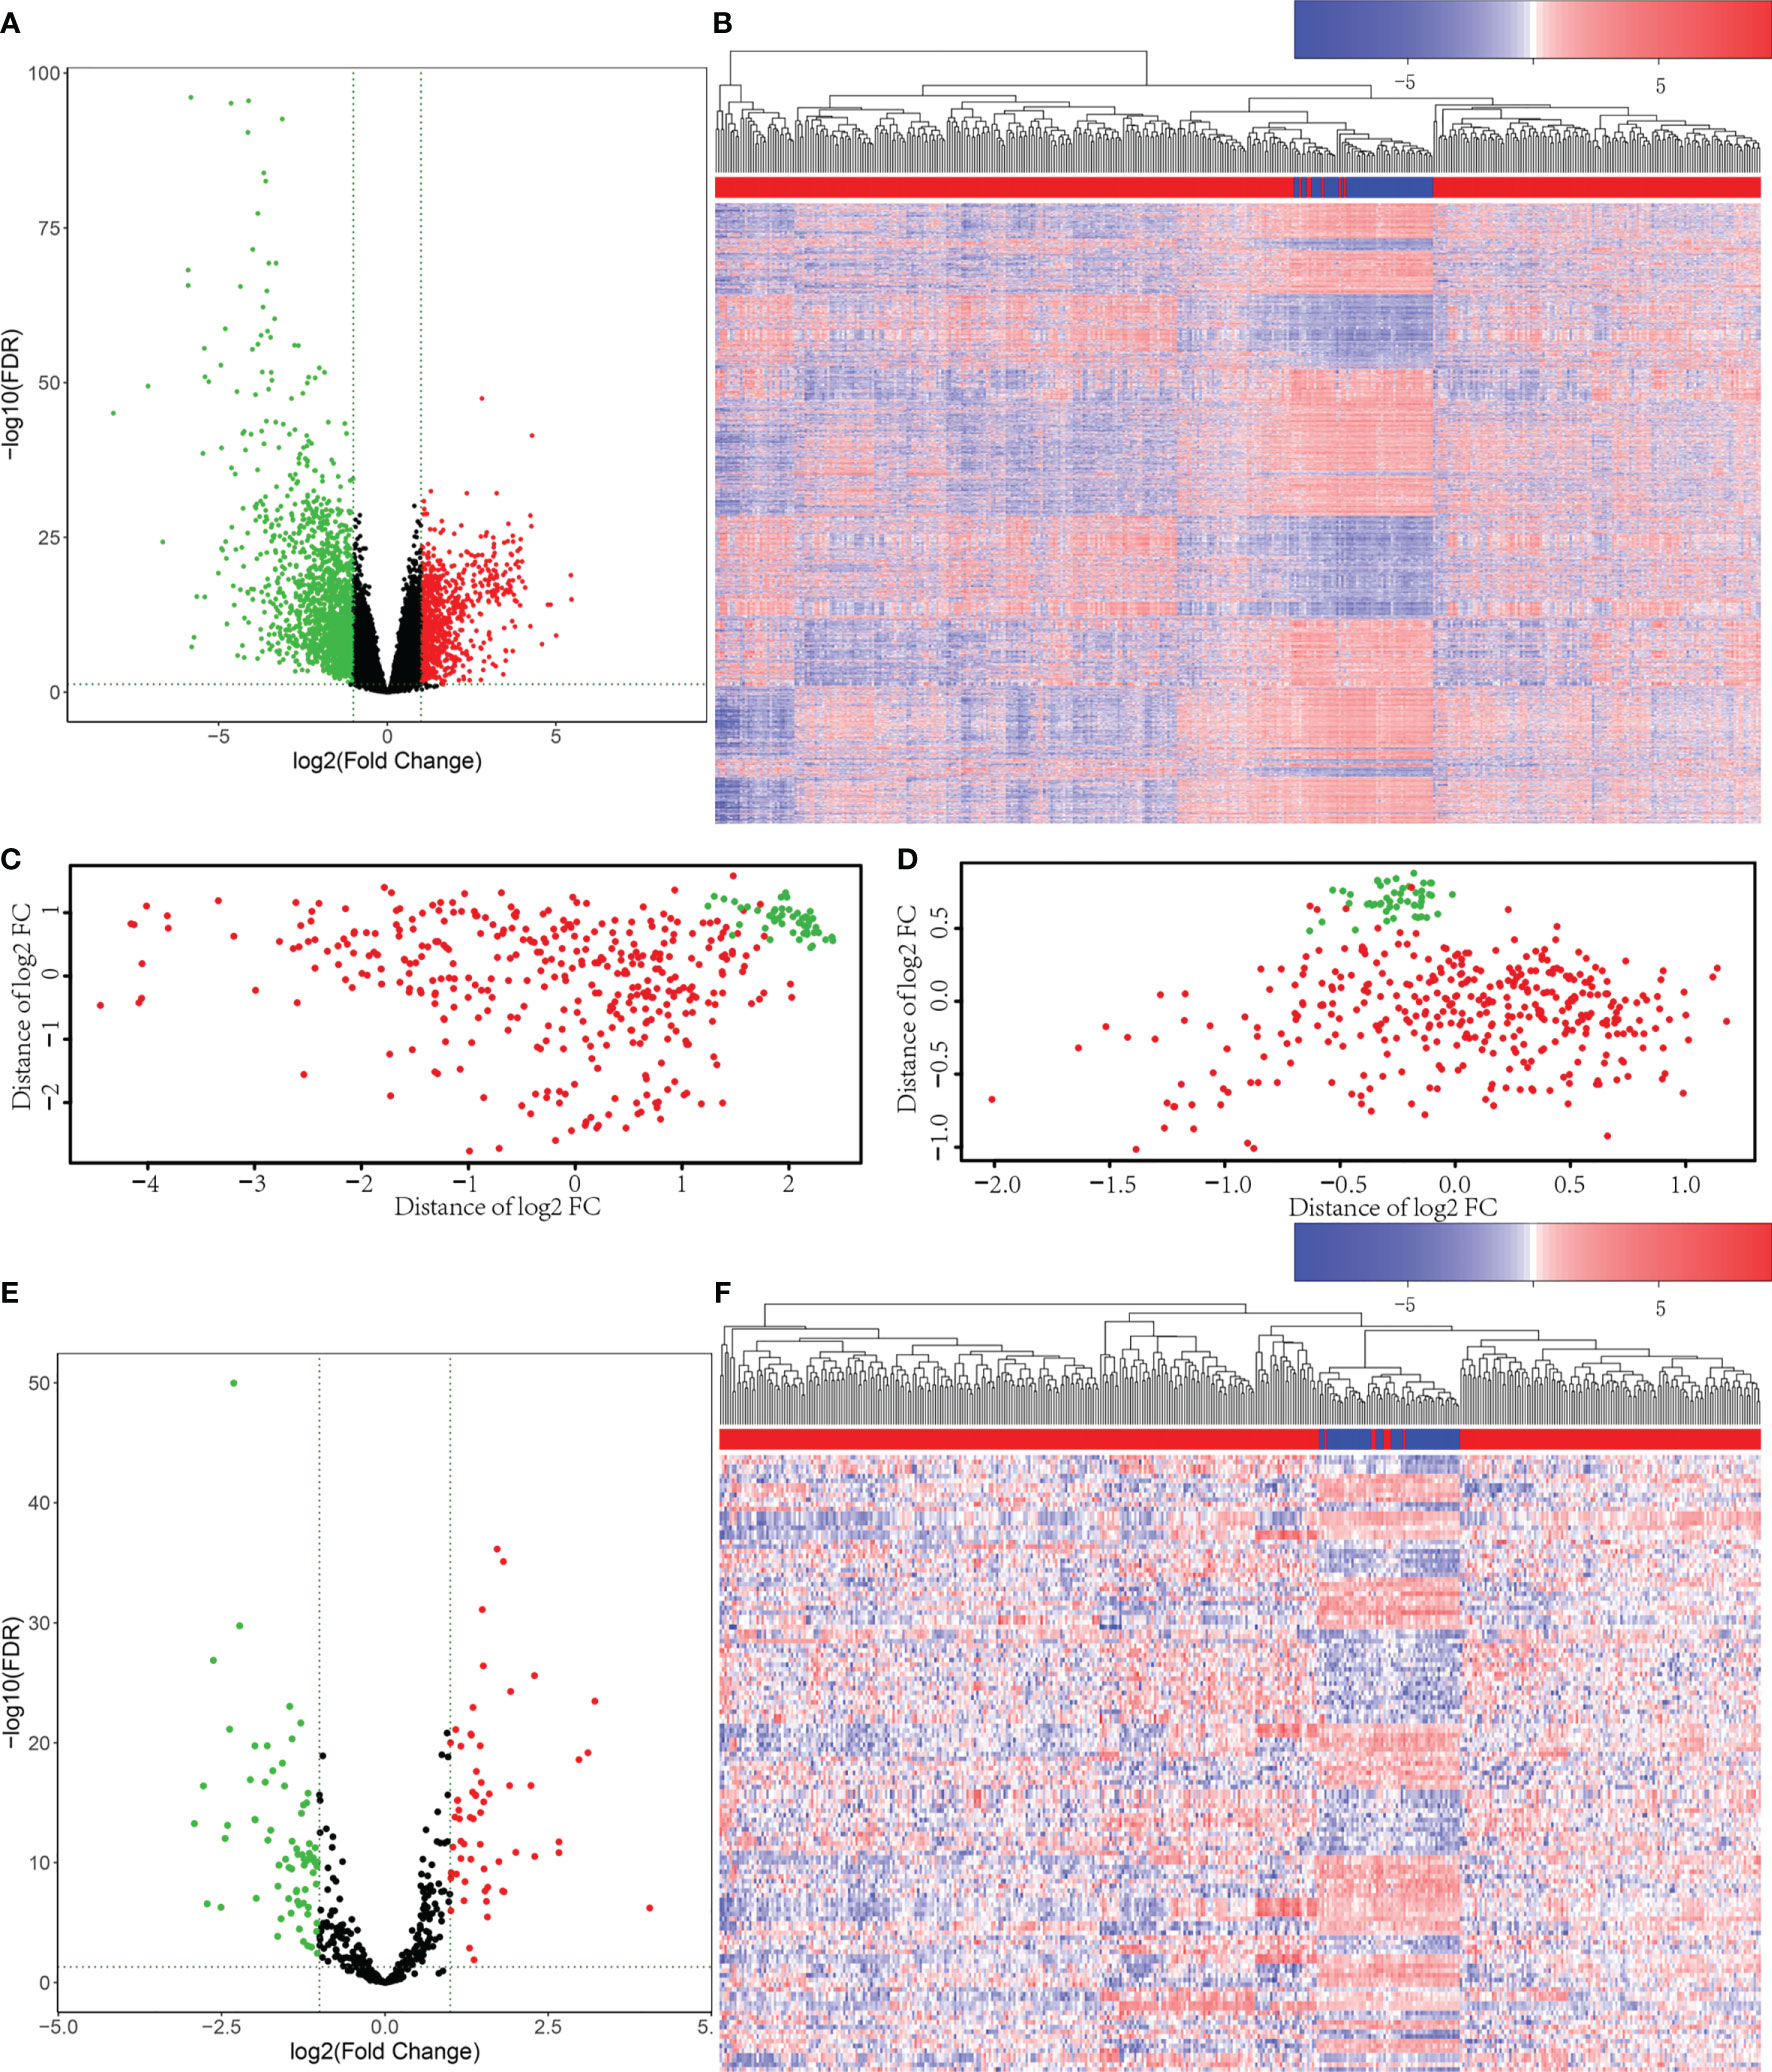
Figure 1 Differentially expressed mRNAs and miRNAs were selected from The Cancer Genome Atlas (TCGA) database. (A) Volcano plots for 2,416 differentially expressed genes (DEGs). The green dots represent downregulated genes, and the red dots represent upregulated genes. Black dots represent genes without statistically significant change (p < 0.05 and |log2 fold change|>1). (B) Heatmap for DEGs in primary tumor (red) compared with solid tissue normal (blue). (C) The principal component analysis (PCA) figure of the samples based on the differentially expressed mRNAs. (D) The PCA figure of the samples based on the differentially expressed miRNAs. (E) Volcano plots for the 131 Differentially Expressed microRNAs (DEmiRs). The green dots represent downregulated miRNAs, and the red dots represent upregulated miRNAs. Black dots represent miRNAs without statistically significant change (p < 0.05 and |log2 fold change|>1). (F) Heatmap for DEmiRs in primary tumor (red) compared with solid tissue normal (blue).
Gene Ontology Enrichment Analysis and Kyoto Encyclopedia of Genes and Genomes Enrichment Analysis
GO and KEGG enrichment analysis on these 2,416 DEGs was carried out to explore their functions (p value <0.01 was the cutoff value). The results showed that (Figure 2A) the differential genes mainly focus on the catabolic process of biological procedure extracellular matrix of cells and small molecular compounds bindings with the oxidative respiratory chains. Otherwise, KEGG enrichment analysis demonstrated that the differential genes concentrated upon the pathways participating in complement and coagulation cascades, cell cycle regulation, and cell metabolism (Figure 2B).
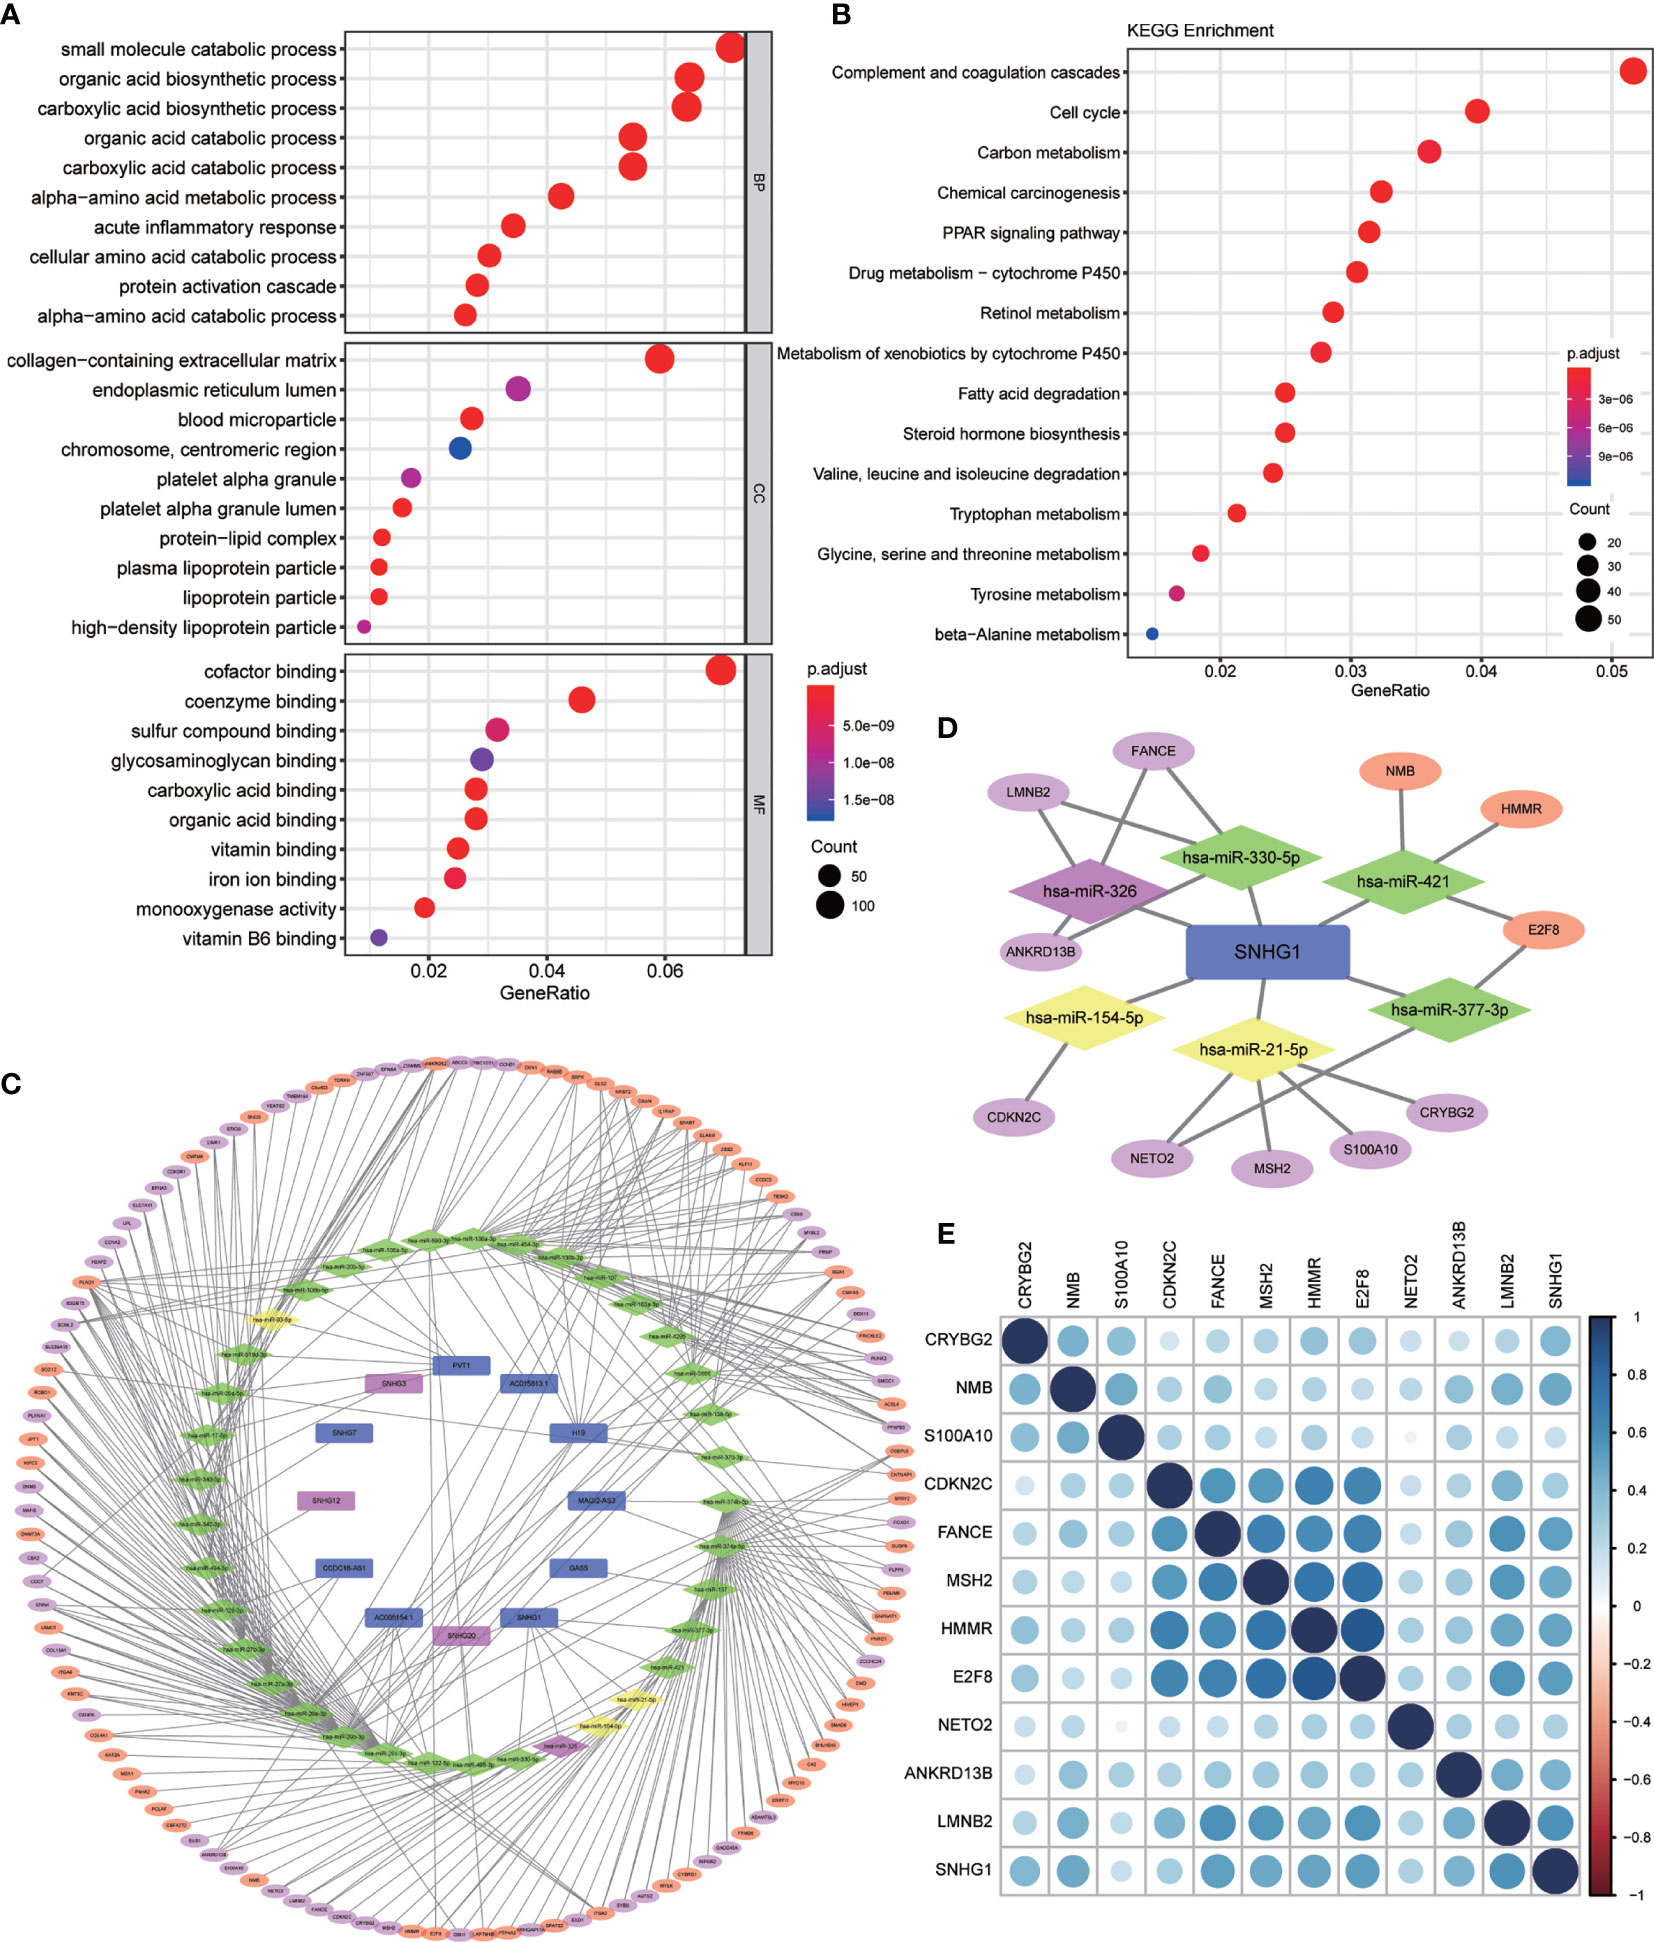
Figure 2 Differential gene enrichment analysis and pathway construction. (A) Gene Ontology (GO) enrichment analysis of differentially expressed genes (BP, biological process; CC, cellular component; MF, molecular function) (p < 0.01). (B) Kyoto Encyclopedia of Genes and Genomes (KEGG) pathway analysis of differentially expressed genes (p < 0.01). (C) Competing endogenous RNA (ceRNA) network was established by Cytoscape for differentially expressed lncRNA–miRNA–mRNA. (All lncRNA nodes and mRNA nodes were differentially expressed; purple nodes were associated with survival. Yellow miRNA nodes were differentially expressed.). (D) A total of six miRNAs and 11 mRNAs were identified from the lncRNA SNHG1-related network. (E) Heatmap for correlation matrix to visualize the gene expression correlation quantitatively.
Construction of the ceRNA Network
Based on the 2,181 differentially expressed mRNAs and 148 differentially expressed lncRNAs mentioned above, we constructed the ceRNA network containing 115 mRNAs, 12 lncRNAs, and 37 miRNAs, in which 343 different lncRNA–miRNA–mRNA pathways were also described (Figure 2C). Then, we intersected the selected 37 miRNAs with DEmiRs obtained previously and only four differentially expressed miRNAs including miR-326, miR-154-5p, miR-21-5p, and miR-93-5p were found, which means that these four miRNA-associated lncRNA–miRNA–mRNA pathways may function in HCC development.
Survival Analysis of Candidate lncRNA–miRNA–mRNA Pathway in Hepatocellular Carcinoma Patients
In order to evaluate the prognostic significance of the obtained ceRNA network, we used univariate survival analysis, Cox regression, and Kaplan–Meier survival analysis and found that only miR-326 was associated with HCC patient survival among the four potential miRNAs (p < 0.01) (Figure 3C). So, the lncRNA–miRNA–mRNA pathways that associated with miR-326 were extracted from ceRNA as a whole (Figure 2D). And the heatmap of correlation matrix was drawn to visualize the gene expression correlation quantitatively (Figure 2E). We evaluated the prognostic significance of SNHG family members, such as SNHG1 SNHG3, SNHG12, and SNHG20; although the p value for SNHG1 survival analysis is slightly greater than 0.05, the survival analysis p values for 25% and 75% of the quartile subgroups were both less than 0.05 (Figures 3A, B). Furthermore, previous studies have demonstrated that lncRNA SNHG1 predicted a poor prognosis in HCC (16, 22), and the diagram showed that lncRNA SNHG1 is a potential lncRNA in HCC progression. Although three candidate targets ANKRD13B, LMNB2, and FANCE, which were regulated by miR-326, were all associated with HCC patient survival (Figure 3D), only LMNB2 has been investigated in a hepatocellular cancer study before (23). Previous studies showed that ANKRD13B and FANCE were associated with epidermal growth factor receptor (EGFR) activation (24) and Fanconi anemia (25, 26), respectively. Furthermore, correlation analysis indicated both lncRNA SNHG1 and LMNB2 were negatively correlated with miR-326, but SNHG1 correlated with LMNB2 positively in HCC (Figures 4A–C).
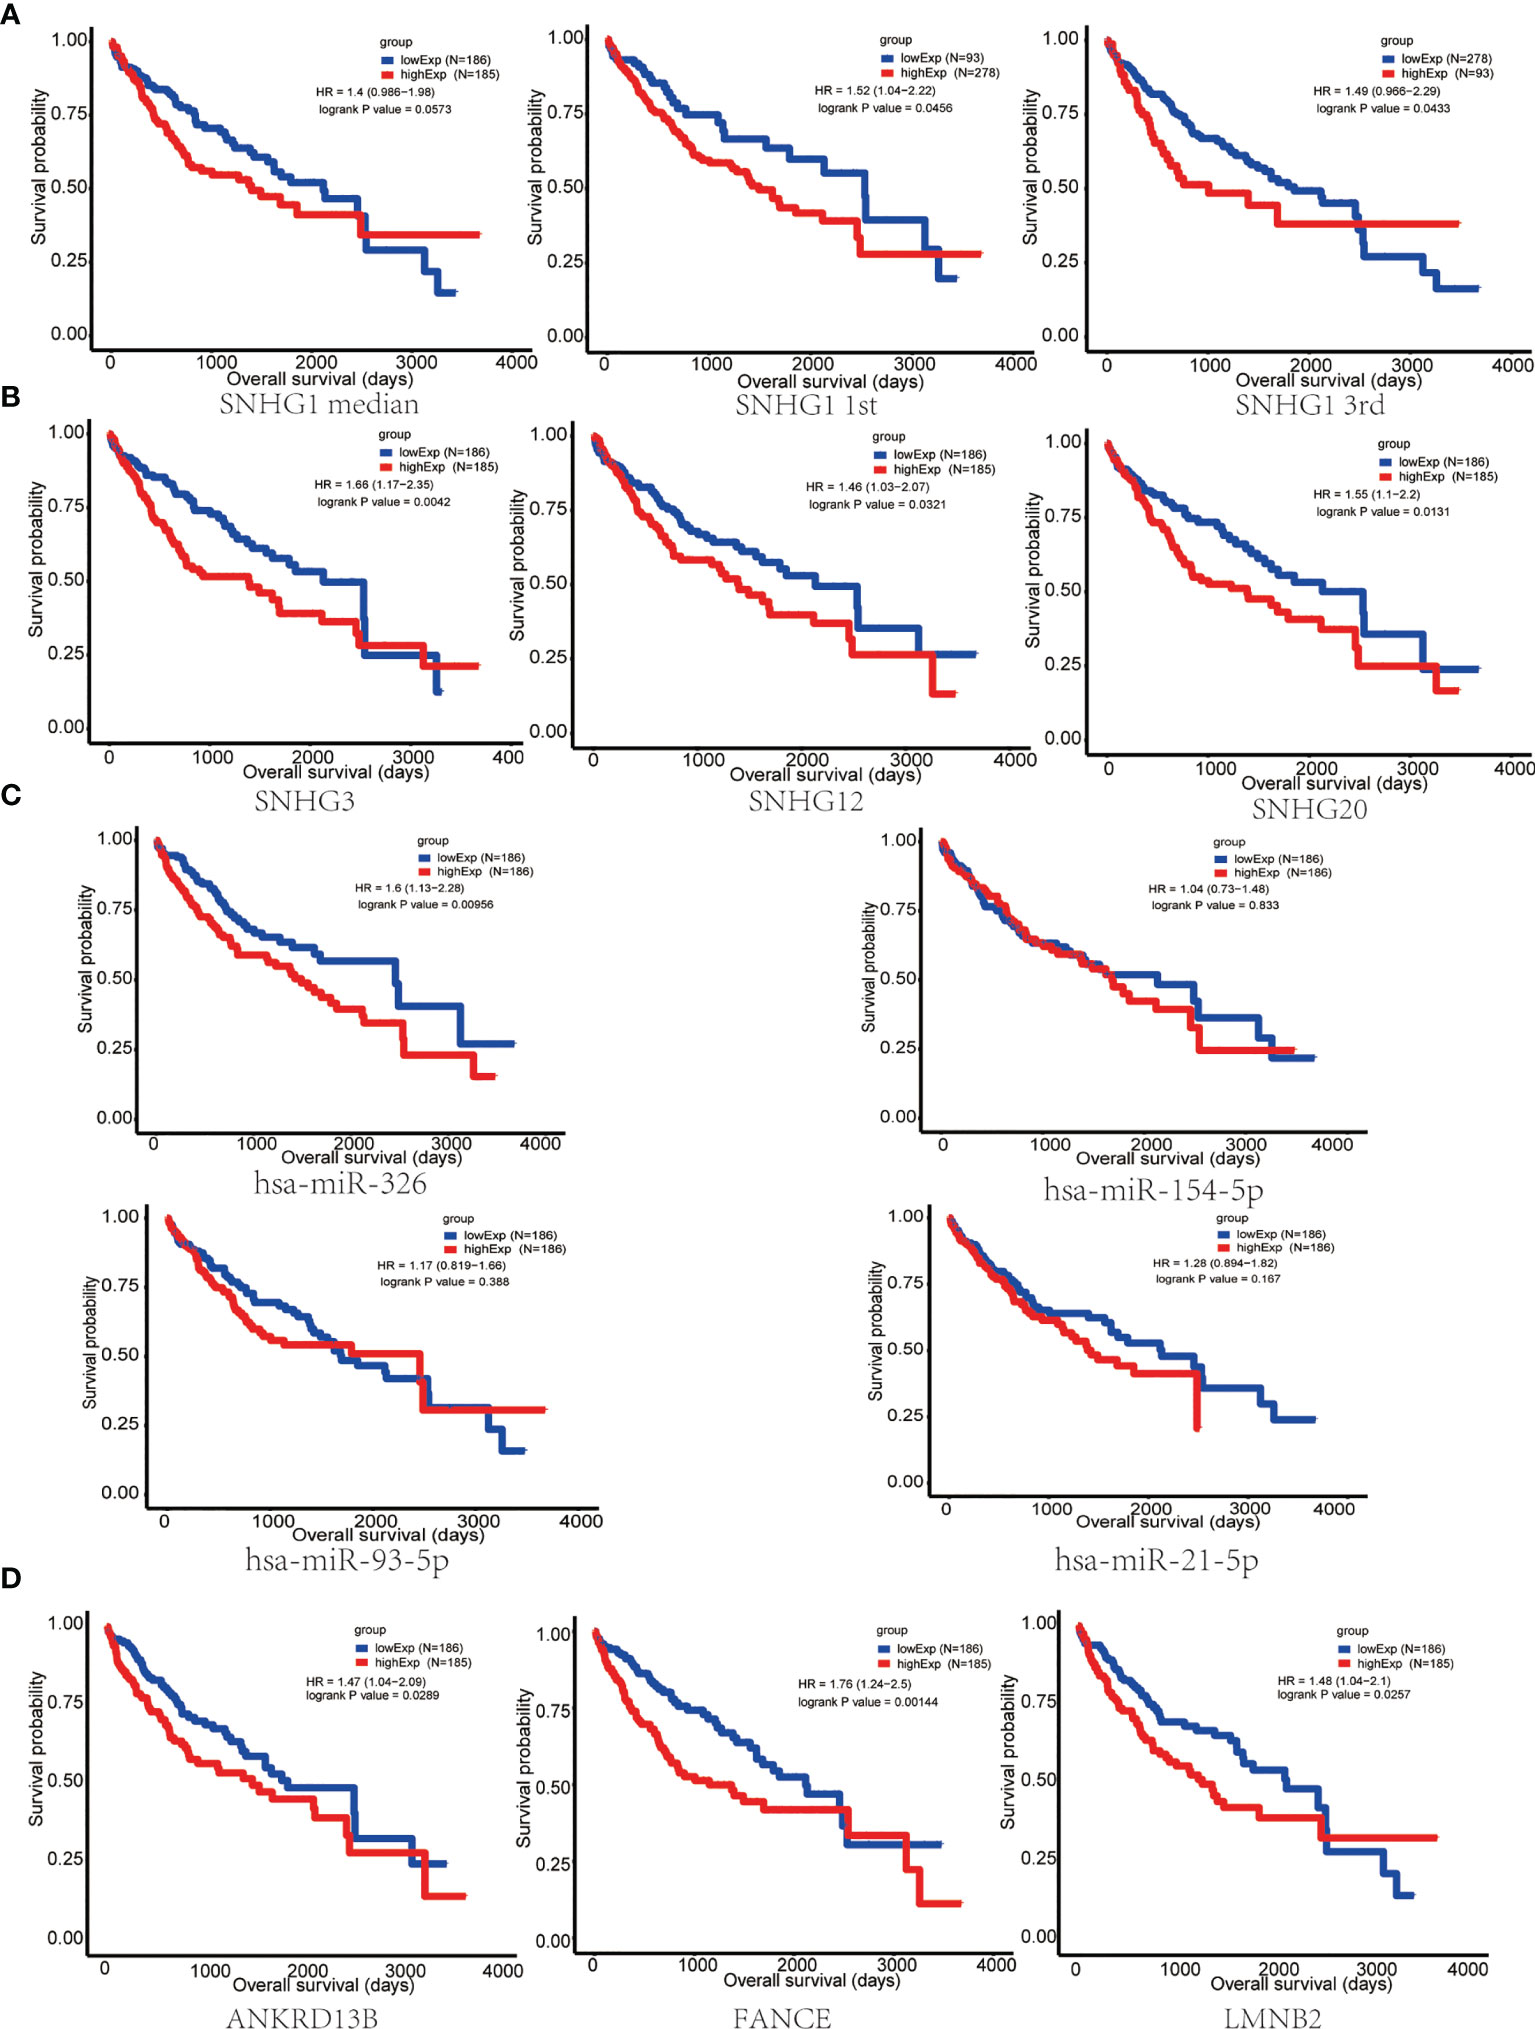
Figure 3 Survival analysis of key nodes in hepatocellular carcinoma (HCC). (A) Kaplan–Meier curve of HCC patients with low or high SNHG1 expression of the quartile subgroups. (B) SNHG3, SNHG12, and SNHG20 were significantly associated with the overall survival in patients with HCC, as detected using the Kaplan–Meier curve. (C) Kaplan–Meier curve of HCC patients with low or high expression of miR-326, miR-154-5p, miR-21-5p, and miR-93-5p. (D) The Kaplan–Meier curve showed that ANKRD13B, FANCE, and LMNB2 were significantly associated with the overall survival in patients with HCC.
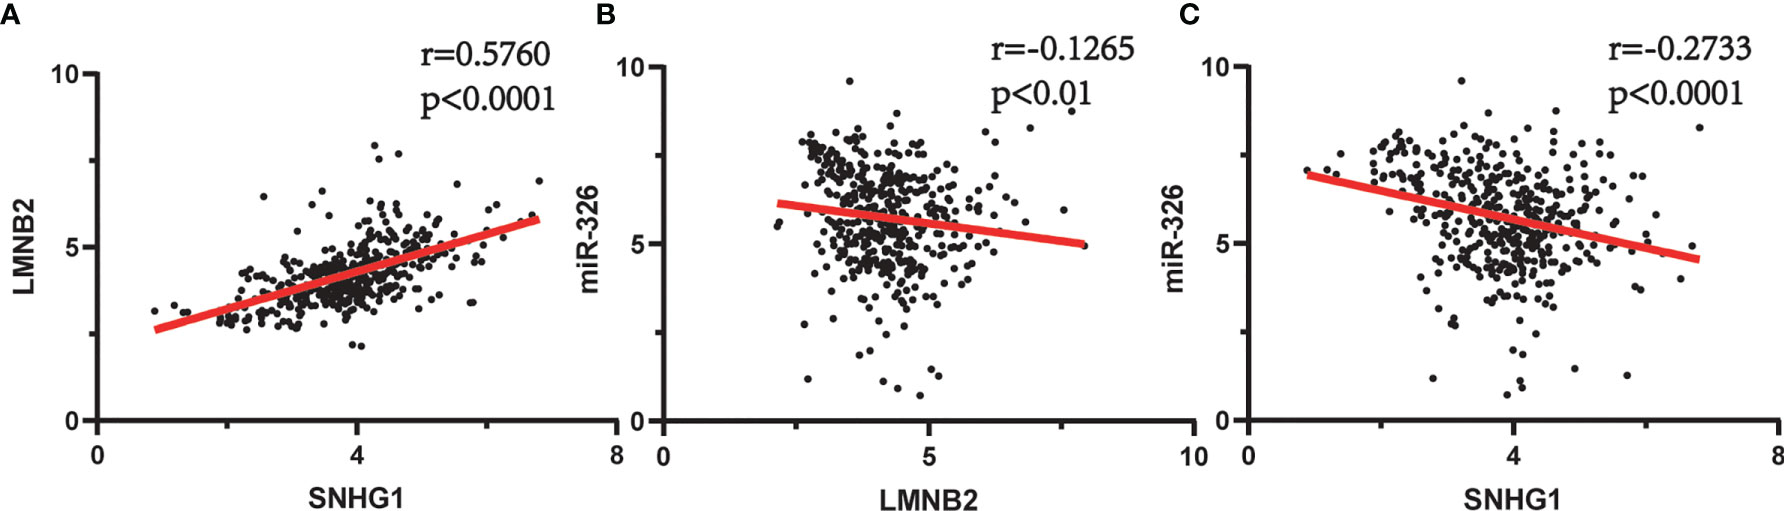
Figure 4 Spearman’s correlation analysis between SNHG1, miR-326, and LMNB2 in hepatocellular carcinoma (HCC). (A) SNHG1 is positively correlated with LMNB2 (r = 0.5760, p < 0.0001). (B) miR-326 is negatively correlated with LMNB2 (r = 0.1256, p < 0.01). (C) SNHG1 is negatively correlated with miR-326 (r = 0.2733, p < 0.0001).
SNHG1 Promotes the Proliferation, Migration, and Invasion of Hepatocellular Cancer Cells
Firstly, SNHG1 level were examined in five HCC cell lines. As shown in Figure 5A, Huh7 and PLC have a higher expression of SNHG1, so we chose the two cell lines for further research. Three independent siRNAs were designed to silence SNHG1 expression. The results showed that SNHG1 expression decreased significantly compared with control group (Figure 5B). MTT assay and colony formation demonstrated that SNHG1 silencing inhibited cell proliferation significantly (Figures 5C–F). The transwell assay indicated that knockdown of SNHG1 inhibited the migration and invasion of Huh7 and PLC cells (Figures 5G, H), and these results were confirmed in the wound healing experiment using both Huh7 and PLC cells (Figure 5I). The above results showed that SNHG1 promoted the proliferation, migration, and invasion of hepatocellular cancer cells.
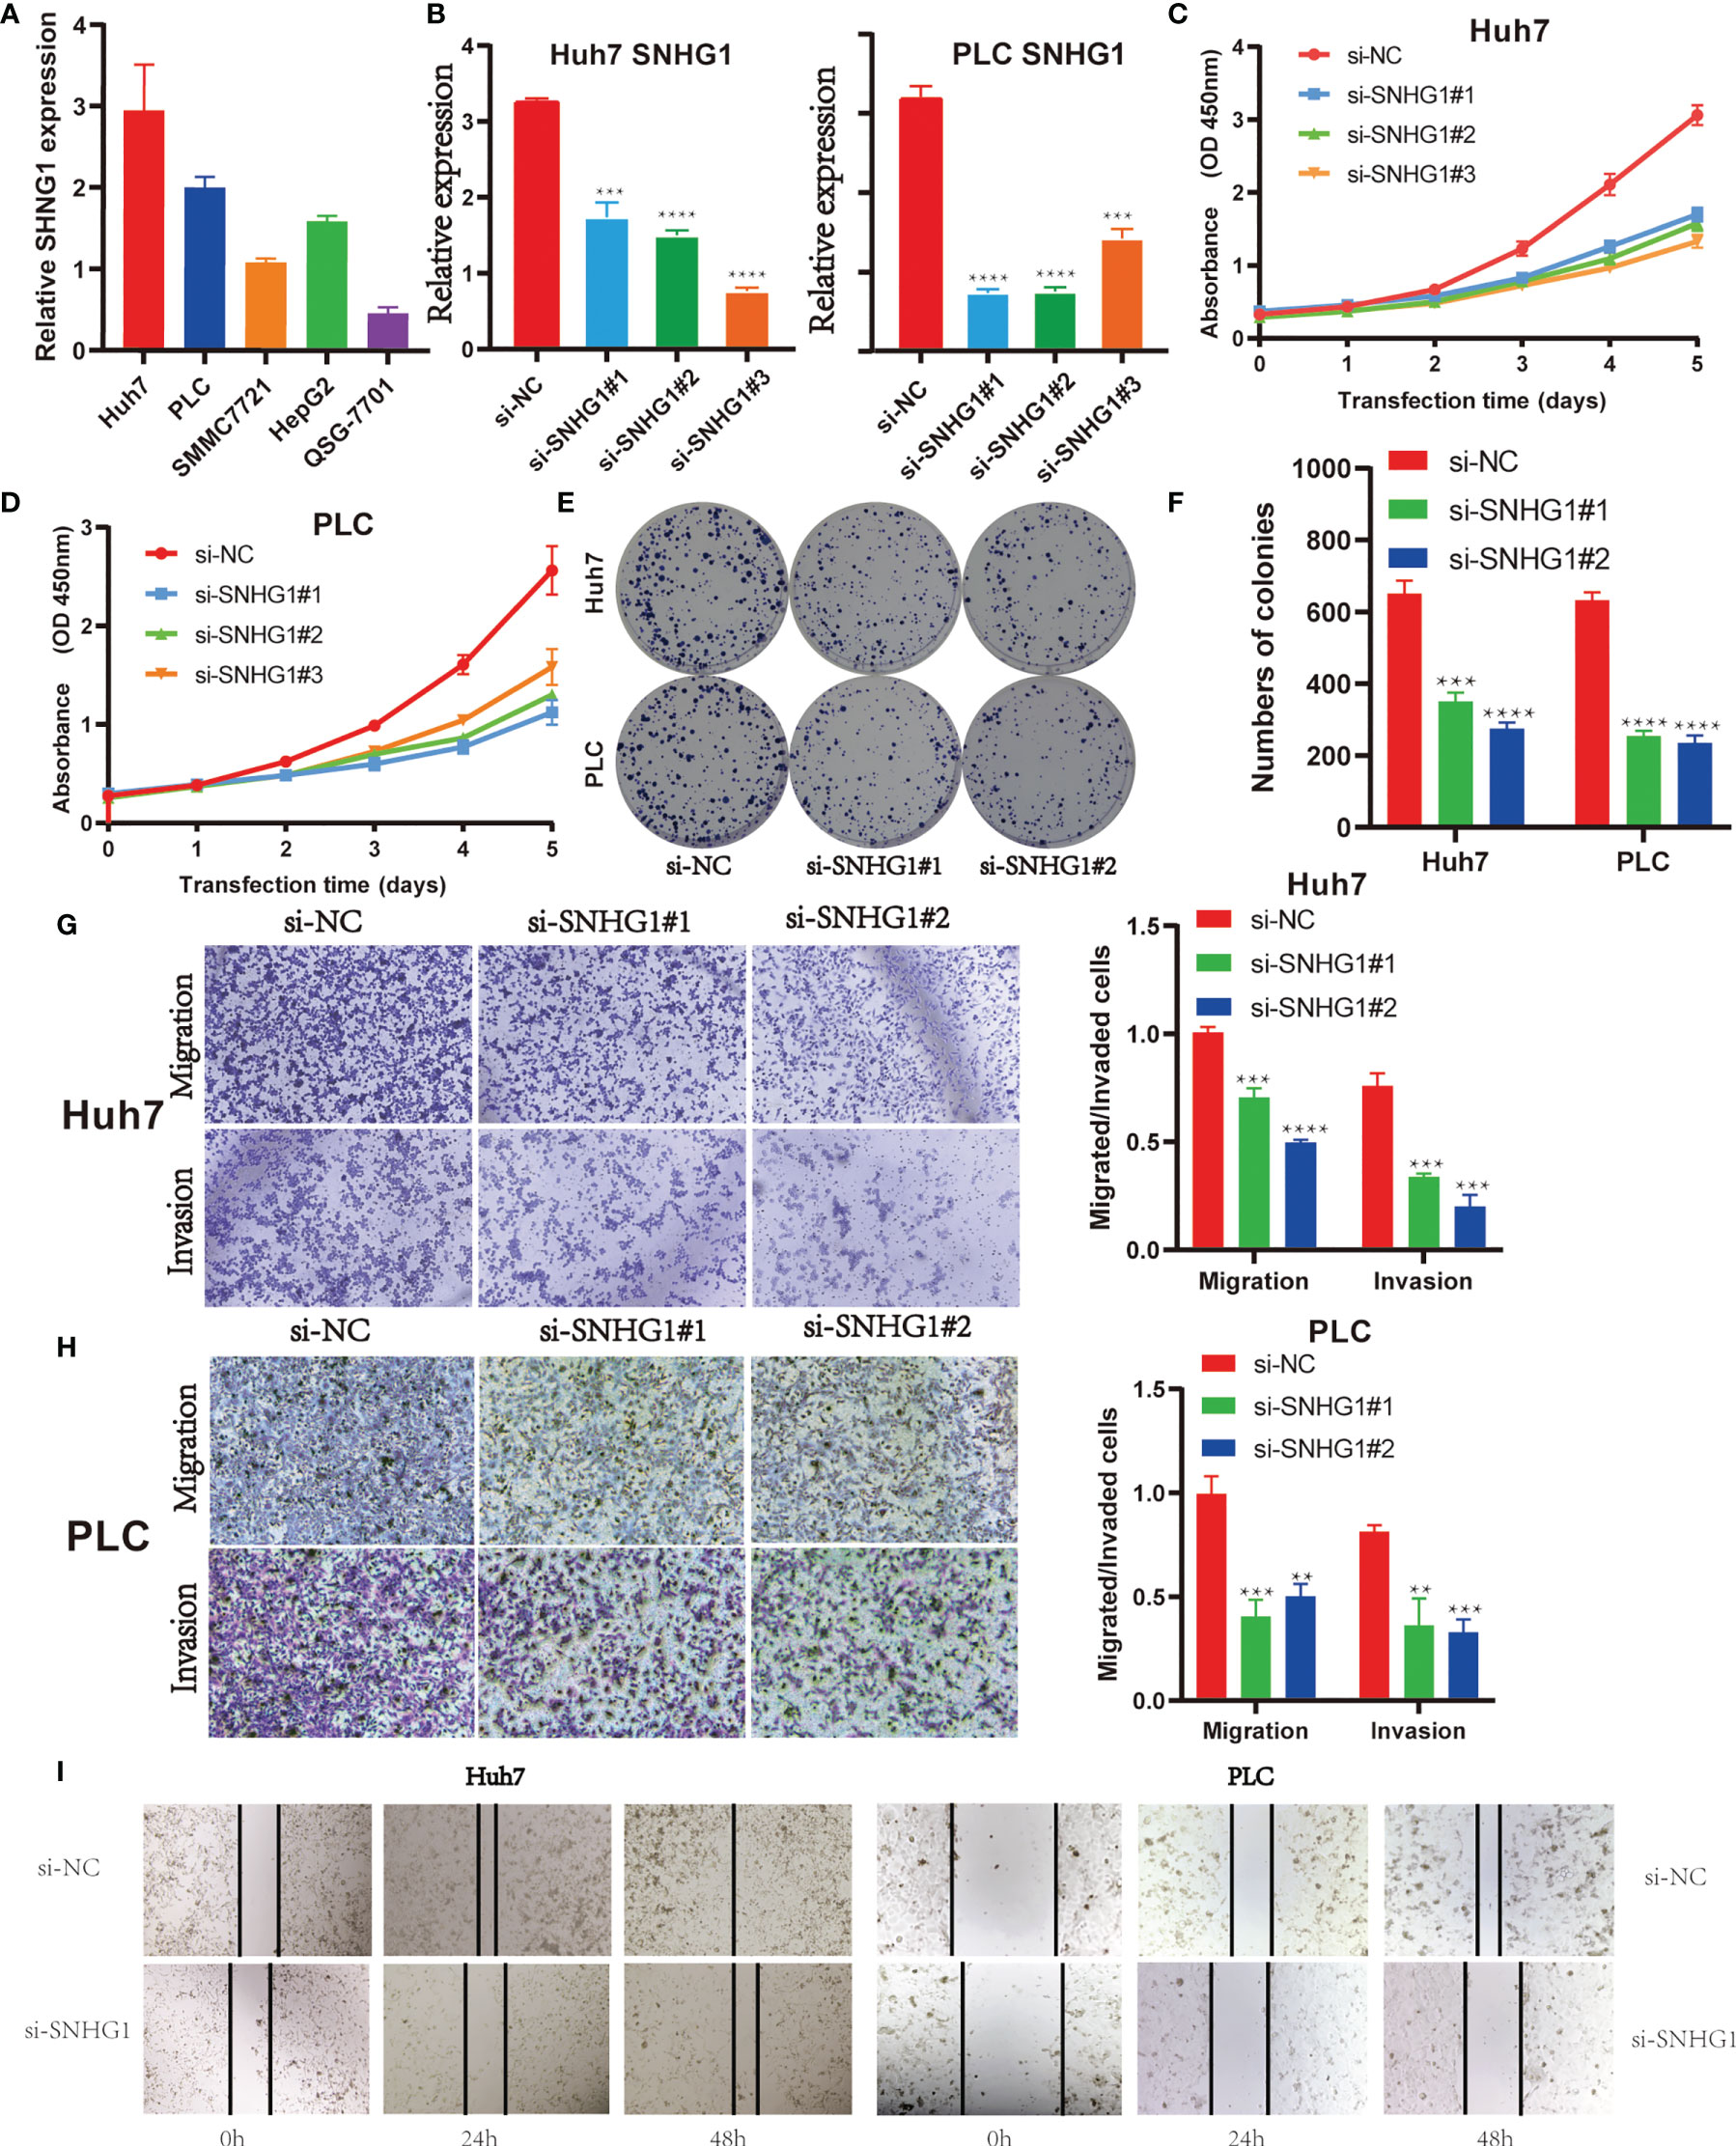
Figure 5 SNHG1 promotes proliferation, migration, and invasion of hepatocellular cancer cells. (A) Relative expression of SNHG1 was detected in QSG-7701 and the other four hepatocellular carcinoma (HCC) cell lines by RT-qPCR. (B) Expression of SNHG1 in Huh7 and PLC cells with SNHG1 knockdown detected by RT-qPCR (***p < 0.001, ****p < 0.0001). (C) Optical density (OD) value of Huh7 cells with SNHG1 knockdown and control cells in 3-(4,5-Dimethylthiazol-2-yl)-2,5-diphenyltetrazolium bromide (MTT) assay. (D) OD value of PLC cells with SNHG1 knockdown and control cells in MTT assay. (E) Colonies of Huh7 and PLC cells with SNHG1 knockdown and control cells in the colony formation assay. (F) The number of colonies was calculated 14 days after cell seeding (***p < 0.001, ****p < 0.0001). (G) Migratory and invasive potential of Huh7 cells with SNHG1 knockdown and control cells (***p < 0.001, ****p < 0.0001). (H) Migratory and invasive potential of PLC cells with SNHG1 knockdown and control cells (**p < 0.01, ***p < 0.001). (I) Wound healing assay was used to detect the migratory ability of Huh7 and PLC cells with SNHG1 knockdown.
SNHG1 Knockdown Inhibits Tumor Growth In Vivo
To investigate the role of SNHG1 in HCC growth in vivo, we cultured Huh7 cells stably expressing shSNHG1 using lentivirus (Figure 6A). As shown in Figures 6B, C (six mice per group), the knockdown of SNHG1 inhibited tumor growth significantly compared with control group (Figures 6A, B). Furthermore, decreased tumor size and weight were observed after SNHG1 was knocked down (Figures 6D, E). These results indicated that SNHG1 knockdown could influence tumor growth significantly in vivo. The miR-326 level of tumor increased markedly in the shSNHG1 group compared with control, whereas the expression of LMNB2 decreased (Figure 6F, G).
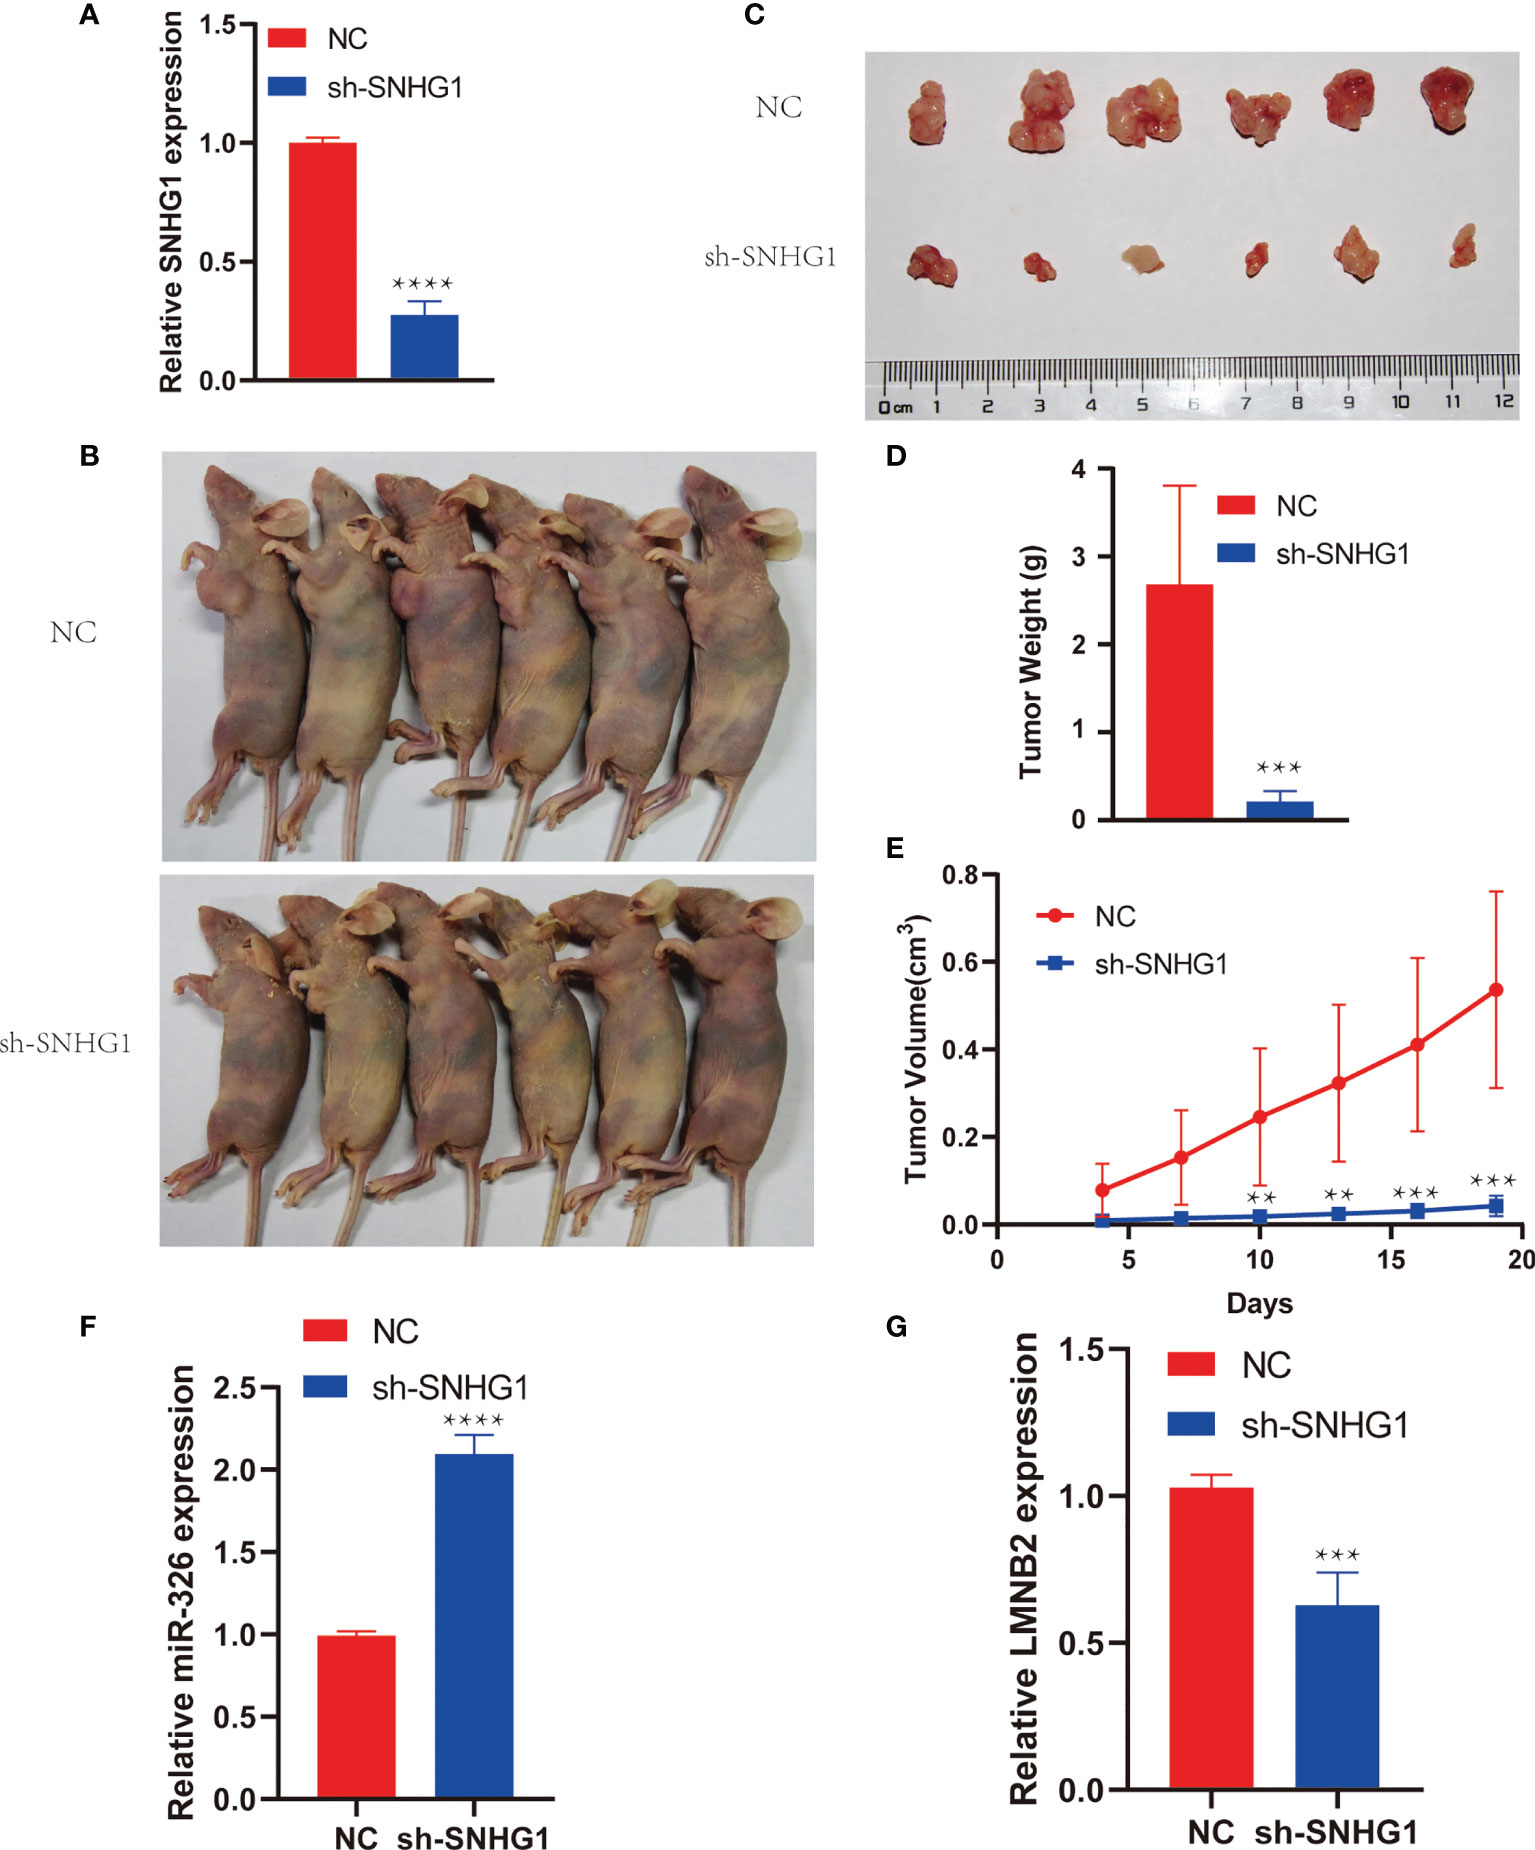
Figure 6 SNHG1 promotes hepatocellular carcinoma (HCC) tumor growth in vivo. (A) RNA levels of SNHG1 in Huh7 cells with SNHG1 knockdown detected by RT-qPCR (****p < 0.0001). (B) Representative images of mice bearing tumors from SNHG1 knockdown group and control group. (C) Representative tumor images were shown. (D, E) Quantification of tumor weight and tumor volume of individual mice following the injection of HuH7 cells with SNHG1 knockdown or control cells (**p < 0.01, ***p < 0.001). (F, G) Expression of miR-326 and LMNB2 in tumor of shSNHG1 group compared with control (***p < 0.001, ****p < 0.0001).
SNHG1 Regulates LMNB2 Expression in Hepatocellular Carcinoma via Sponging miR-326 in Hepatocellular Carcinoma
In order to confirm the regulatory axis of SNHG1–miR-326–LMNB2 in HCC mentioned above, we firstly perform the subcellular localization assay of SNHG1. Nucleocytoplasmic separation and RT-qPCR assay revealed that SNHG1 was expressed in both nucleus and cytoplasm of HuH7 and PLC cells, whereas a larger proportion of SNHG1 was located in the cytoplasm (Figure 7A). Many lncRNAs acted as ceRNAs through binding miRNAs (27). SNHG1 has also been reported to be involved in tumor development including colorectal cancer and osteosarcoma (28–30). Therefore, we used dual-luciferase reporter assays to make sure whether SNHG1 can directly interact with miR-326 in Huh7 and PLC cells. The results showed that the miR-326 mimics could reduce the luciferase activity in both Huh7 and PLC cells (Figure 7B). Meanwhile, wild-type and mutant SNHG1 luciferase reporter vectors were constructed using binding sites predicted by StarBase (Figure 7C), and it was found that miR-326 mimics reduced the luciferase activity significantly of wt-SNHG1 but showed no effect on mut-SNHG1. Furthermore, addition of wt-SNHG1 will attenuate the inhibition effect of miR326 on the LMNB2 expression level, while addition of mut-SNHG1 will not (Figure 7D). Actually, miR-326 level increased markedly after SNHG1 was knocked down in HuH7 and PLC cells (Figure 7E). These results were consistent with the correlation described in Figure 4. Additionally, miR-326 mimics could inhibit cell proliferation significantly, while miR-326 inhibitor could accelerate HuH7 cell proliferation (Figure 7F). Bioinformatics analysis has revealed that LMNB2 is the potential target of miR-326 in HCC. To test the effect of miR-326 on LMNB2 expression, as the results shown in Figure 7G, LMNB2 level decreased markedly with miR-326 mimic treatment in Huh7 cells compared with control, whereas the expression of LMNB2 increased significantly with miR-326 inhibitor treatment. In a word, miR-326 could downregulate LMNB2 expression in HCC. Moreover, LMNB2 was observed to be upregulated in the HCC tissues with low expression of miR-326 (Figure 7H). Furthermore, the LMNB2 expression was also investigated after SNHG1 silence in HCC cells (Figure 7I). Moreover, wild-type and mutant LMNB2 luciferase reporter vectors were constructed using binding sites predicted by StarBase (Figures 7J, K), and it was found that miR-326 mimics significantly reduced the luciferase activity of wt-LMNB2 but showed no effect on mut-LMNB2. The data showed that LMNB2 RNA expression was reduced significantly after SNHG1 siRNA treatment. To sum up, LMNB2 is the target of miR-326 in HCC, and SNHG1 regulates LMNB2 expression via sponging miR-326 in HCC.
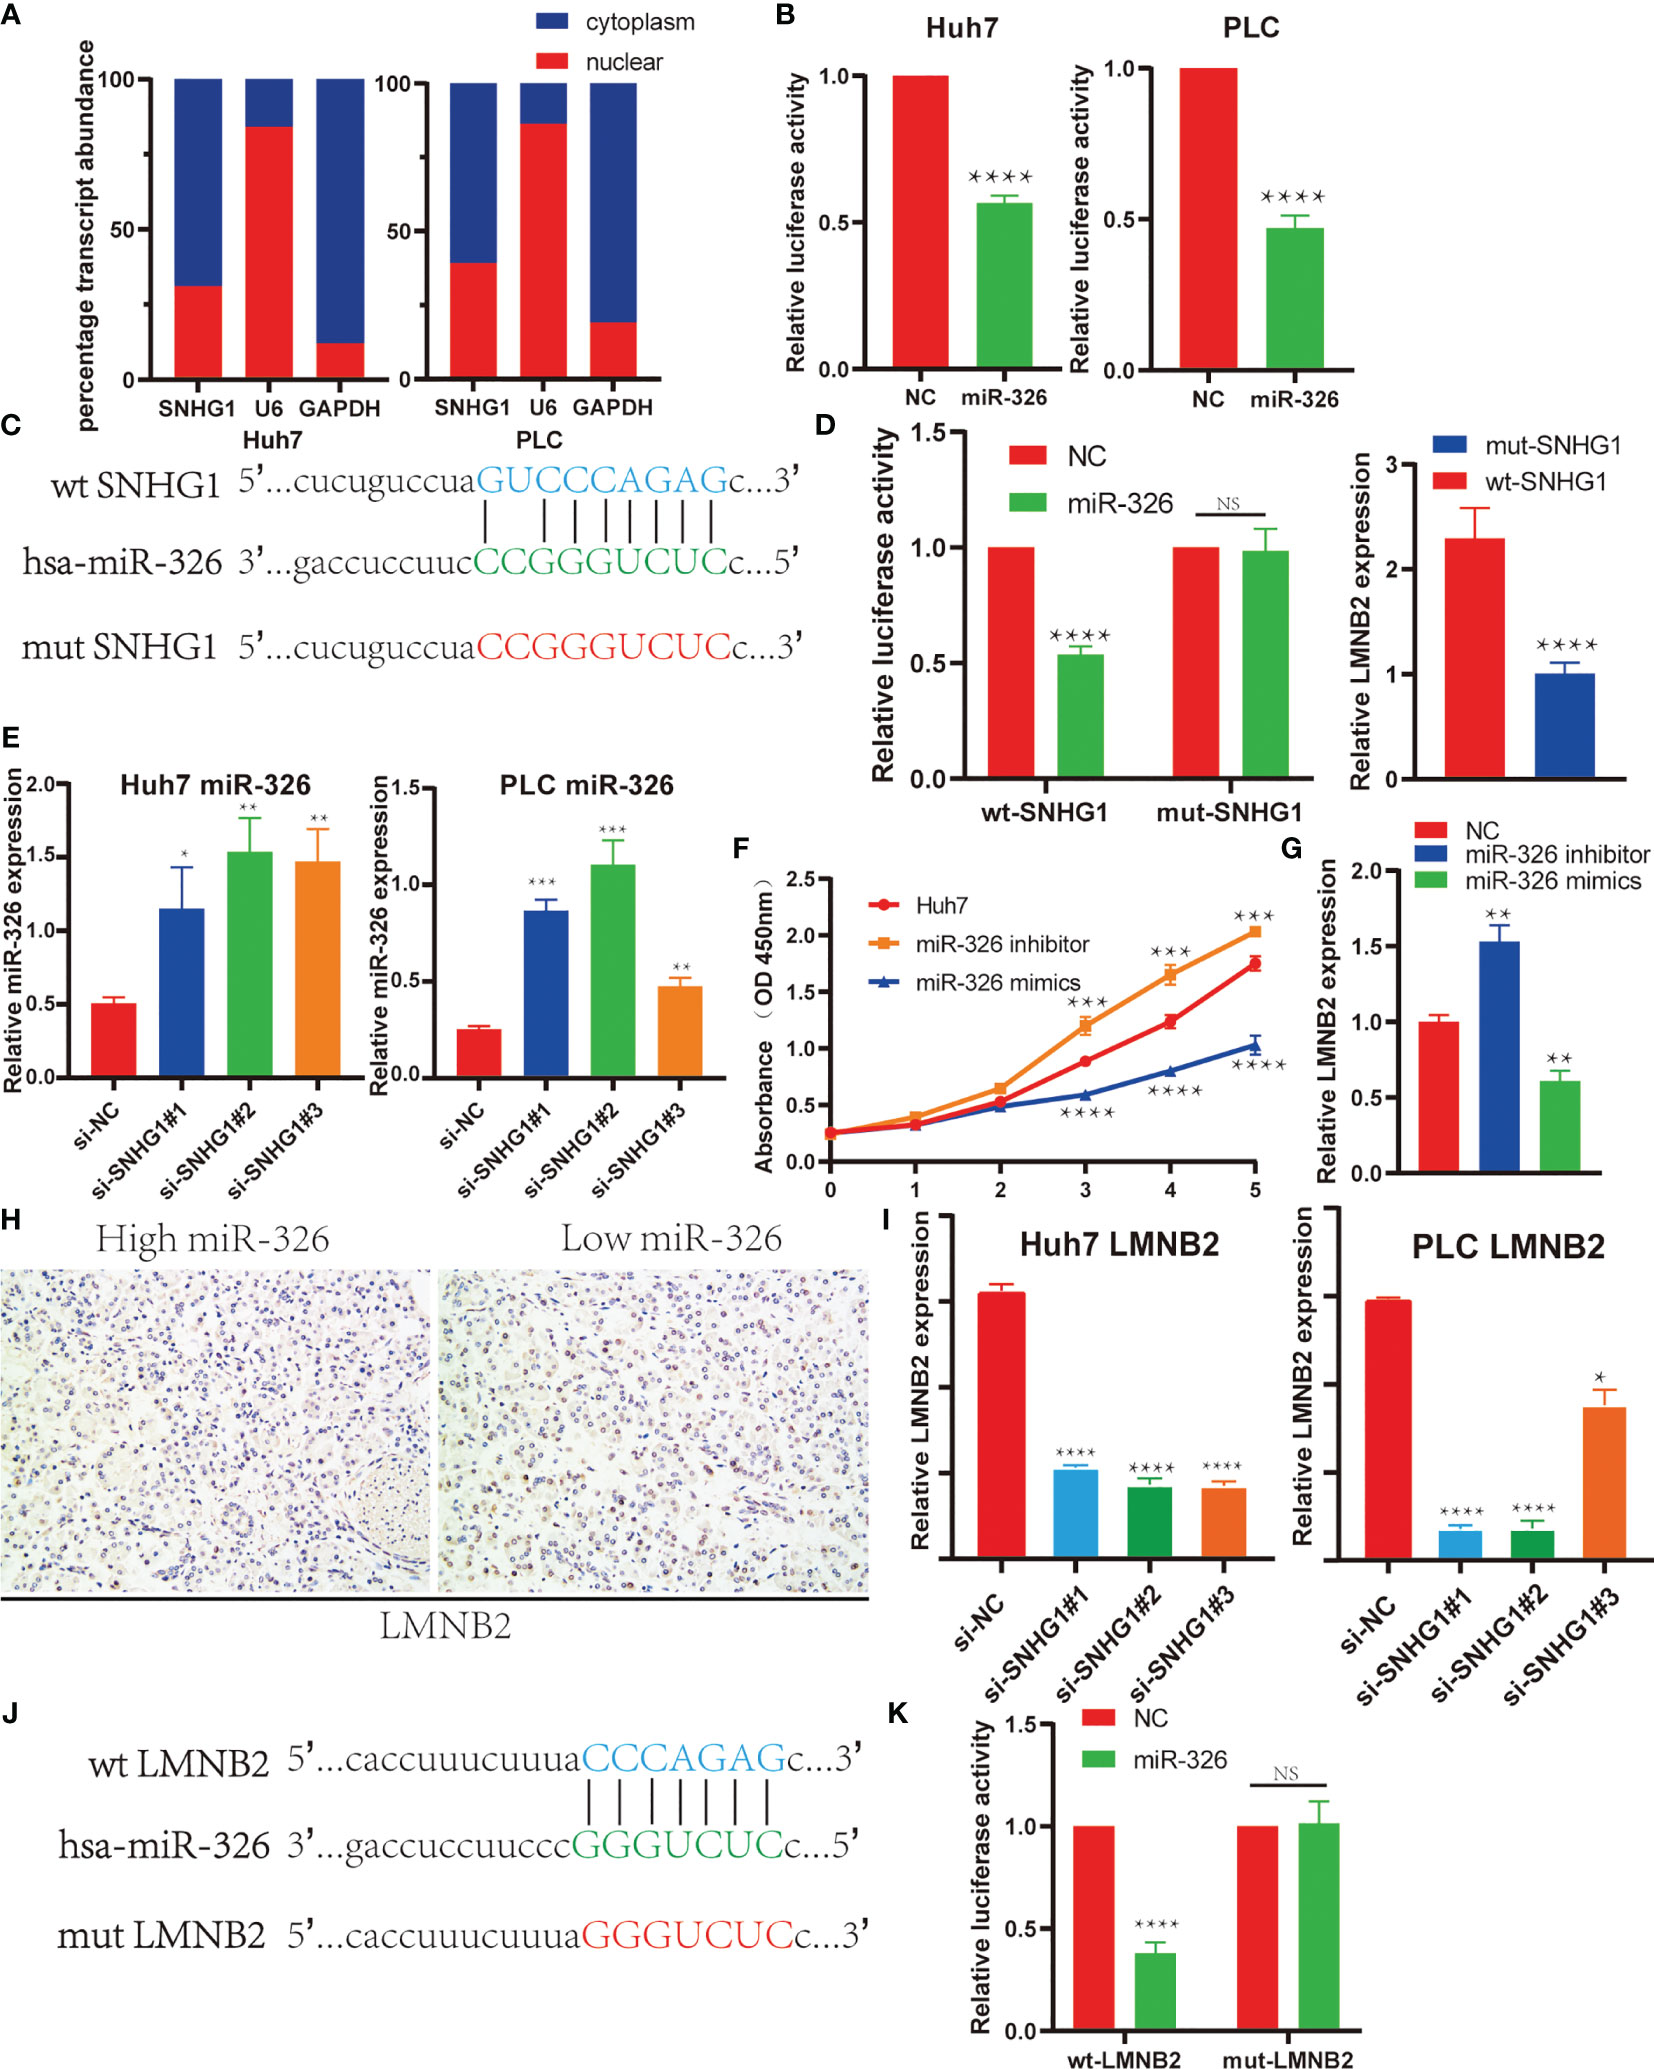
Figure 7 SNHG1 regulated LMNB2 expression through sponging miR-326 in hepatocellular carcinoma (HCC) cells. (A) Subcellular localization of SNHG1 was detected by quantifying nuclear and cytoplasmic fractions. U6 and glyceraldehyde 3-phosphate dehydrogenase (GAPDH) were used as nuclear and cytosolic controls, respectively. (B) Dual-luciferase reporter assay showed that miR-326 directly interacted with SNHG1 in Huh7 and PLC cells (****p < 0.0001). (C) The potential binding site of SNHG1 and miR-326 predicted by StarBase. The sequence alignment of miR-326 and the predicted binding region in SNHG1 (green). Predicted miR-326 binding sites (blue) in SNHG1 and position of mutated nucleotides in SNHG1 (red). (D) Dual-luciferase reporter assay was performed to detect the binding of miR-326 with WT-SNHG1 in Huh7 cells. Expression of LMNB2 in Huh7 cells after addition of wt-SNHG1 compared with mut-SNHG1 (****p < 0.0001). (E) Expression of miR-326 in Huh7 and PLC cells with SNHG1 knockdown (*p < 0.05, **p < 0.01, ***p < 0.001). (F) OD value of Huh7 cells in the MTT assay demonstrated that miR-326 mimics could inhibit cell proliferation significantly, while miR-326 inhibitor could accelerate HuH7 cell proliferation (***p < 0.001, ****p < 0.0001). (G) Expression of LMNB2 in Huh7 cells transfected with miR-326 mimics and inhibitor was measured by qRT-PCR (**p < 0.01). (H) Representative immunohistochemistry (IHC) images of LMNB2 are shown in hepatocellular carcinoma with different miR-326 expression levels. (I) RNA levels of LMNB2 in Huh7 and PLC cells with SNHG1 knockdown detected by RT-qPCR (*p < 0.05, ****p < 0.0001). (J) The potential binding site of LMNB2 and miR-326 predicted by StarBase. The sequence alignment of miR-326 and the predicted binding region in LMNB2 (green). Predicted miR-326 binding sites (blue) in LMNB2 and position of mutated nucleotides in SNHG1 (red). (K) Dual-luciferase reporter assay was performed to detect the binding of miR-326 with wt-LMNB2 in Huh7 cells (****p < 0.0001). NS, No Significant.
LMNB2 Mediated the Positive Effects of SNHG1 on Tumor Growth in Hepatocellular Carcinoma
In order to explore the biological effects of LMNB2 in HCC, we also knocked down LMNB2 expression using siRNAs or lentivirus-mediated shRNA. The results showed that LMNB2 expression was reduced in HuH7 cells significantly from RNA to protein level (Figures 8A, B). It is worth noting that the proliferation ability of Huh7 cells decreased markedly with the silence of LMNB2 expression (Figure 8C). Furthermore, we further studied the role of LMNB2 on tumor growth in vivo (three mice per group). Twenty days after transfected HuH7 cells were injected into nude mice, the volume and weight of formed tumor were significantly smaller than those of control group (Figures 8D, E), also indicating that LMNB2 knockdown could inhibit the growth of HCC cells in vitro and in vivo. Besides, SNHG1 knockdown reduced LMNB2 expression compared with control in Huh7 cells, but SNHG1-induced downregulation of LMNB2 was reversed or enhanced by miR-326 inhibitor or mimic treatment, respectively. The similar results were also confirmed by Western blotting assays (Figures 8F, G). In addition, MTT assay proved that miR-326 inhibitor could rescue the role of SNHG1 knockdown on HuH7 cell proliferation. (Figure 8H). These data demonstrated that the oncogenic SNHG1 upregulated LMNB2 expression and promoted tumor growth via suppressing miR-326 level in HCC.
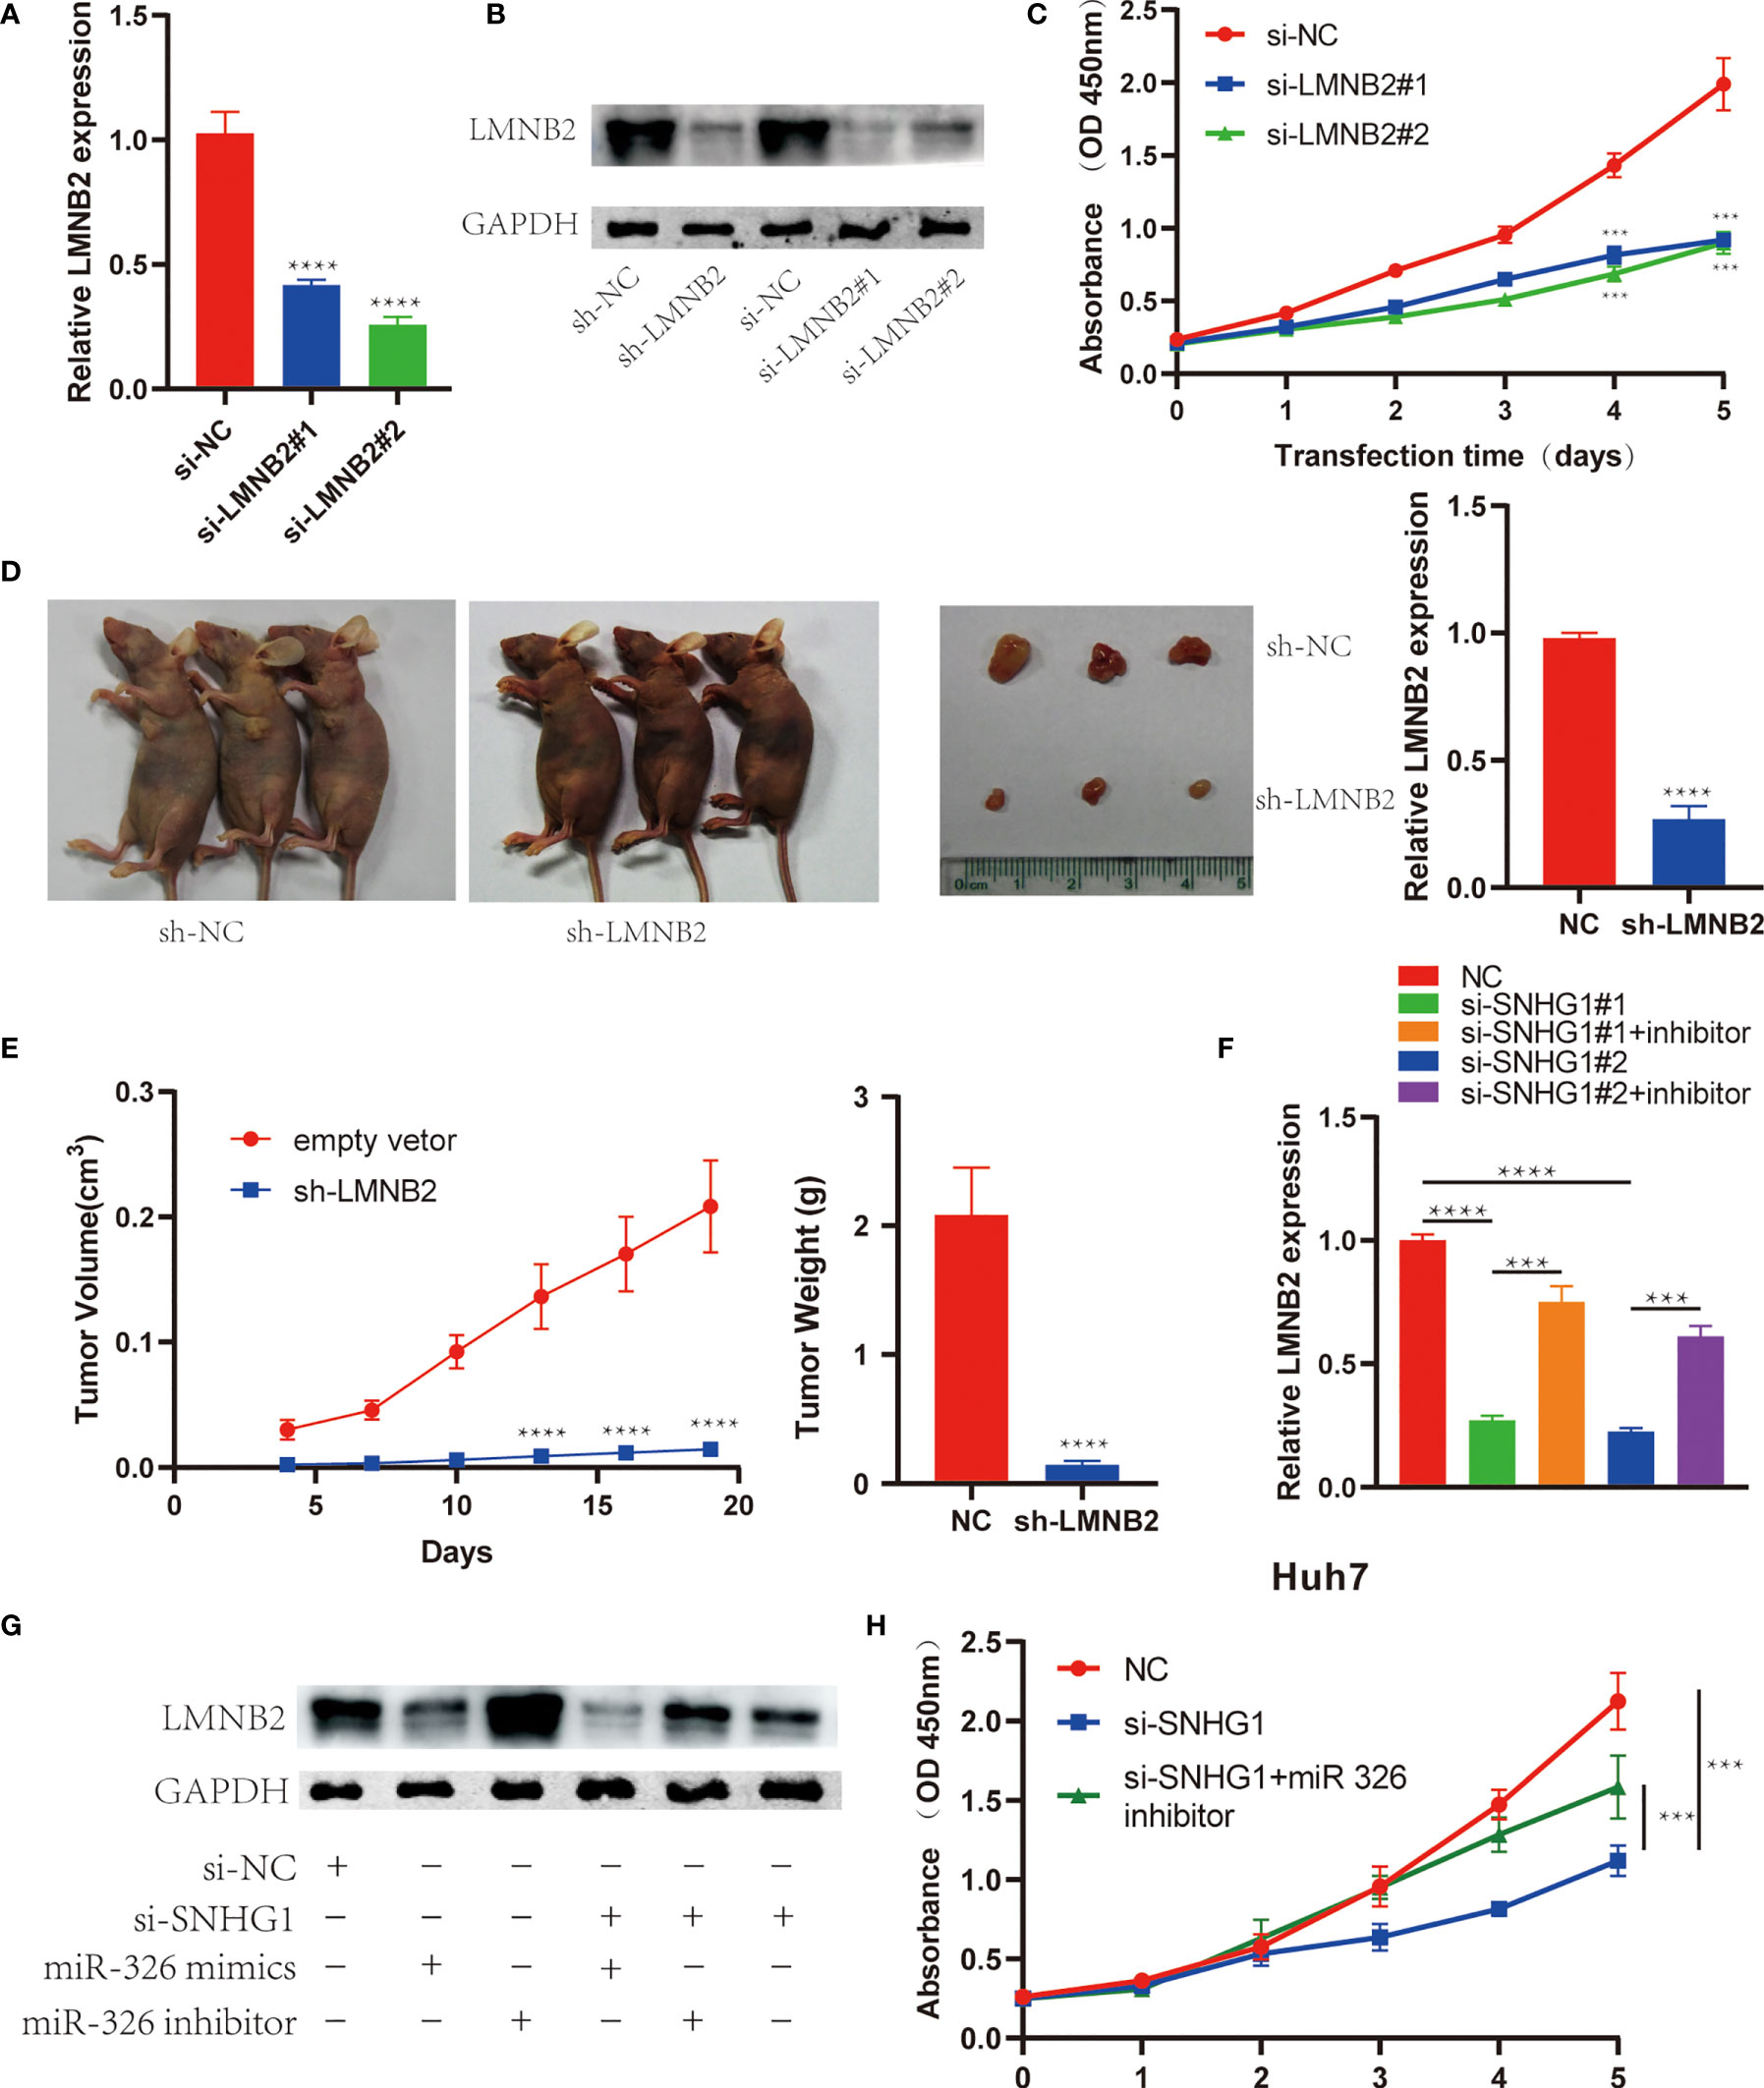
Figure 8 LMNB2 promotes hepatocellular carcinoma (HCC) growth and mediates the role of SNHG1 in HCC. (A) LMNB2 expression decreased significantly in Huh7 cells with LMNB2 siRNA treatment (****p < 0.0001). (B) Western blotting was performed to detect the protein level of LMNB2 in Huh7 cells. (C) OD value of Huh7 cells with LMNB2 knockdown and control cells in the 3-(4,5-Dimethylthiazol-2-yl)-2,5-diphenyltetrazolium bromide (MTT) assay (***p < 0.0001). (D, E) Quantification of tumor volume and tumor weight of mice following the injection of HuH7 cells with LMNB2 knockdown or control cells. Representative images of mice bearing tumors, and tumor images were shown (****p < 0.0001). (F) The qRT-PCR demonstrated that miR-326 inhibitor rescued the decreased LMNB2 expression caused by SNHG1 knockdown (***p < 0.001, ****p < 0.0001). (G) Western blotting assay showed that miR-326 regulated LMNB2 expression, and miR-326 inhibitor rescued LMNB2 downregulation caused by SNHG1 knockdown in Huh7 cells. (H) MTT assays demonstrated that miR-326 inhibitor rescued tumor growth inhibition caused by SNHG1 knockdown (***p < 0.0001).
Discussion
The present study was conducted to investigate potential lncRNA–miRNA–mRNA regulatory network based on TCGA database and elucidate the molecular signatures of HCC progression. Firstly, we screened 2,416 DEGs from RNA-seq of TCGA database through R language, including 148 lncRNAs and 2,181 mRNAs. After analyzing the miRNA data, a total of 131 differentially expressed miRNAs were screened. Then, GO enrichment analysis of DEGs indicated that differential genes are mainly concentrated in the small molecule catabolic process, collagen-containing extracellular matrix, and small molecular compounds bindings in the oxidative respiratory chain of molecular function. The results from KEGG enrichment analysis of DEGs showed that the enrichment of differential genes focused on the pathways associated with complement and coagulation cascades, cell cycle, and carbon metabolism. The GDCRNA Tools package was used to search and match in StarBase database the R language to figure out the miRNAs that linked lncRNAs with mRNAs described above. Finally, 164 related nodes and 343 correlations were found that contained 12 lncRNAs, 115 mRNAs, and 37 miRNAs. We utilized Cytoscape to visualize the relationships between them through the relational network. Then, we intersected the 37 miRNAs selected by DEGs with DEmiRs obtained previously; as a result, only four differentially expressed miRNAs were left including miR-326, miR-154-5p, miR-21-5p, and miR-93-5p. Univariate survival analysis showed that only miR-326 was associated with OS among the four differentially expressed miRNAs. So the lncRNA–miRNA–mRNA axis that contained miR-326 was extracted from the network, and we could see the direct relationship between SNHG1 and miR-326 in HCC; at the same time, LMNB2, FANCE, and ANKRD13B, three candidate targets, were involved in the diagram. In view of the reported role of LMNB2 in HCC progression, recently, we selected SNHG1–miR-326–LMNB2 axis as the hypothetic signaling involved in HCC development and progression (23).
Emerging evidence showed that lncRNAs acted as oncogenes or tumor suppressors in different types of cancer through regulating gene expression (31). Recently, many studies have unveiled the crucial role of SNHG1 in various cancer tumorigeneses and progressions (28, 30, 32). In the present study, we found that SNHG1 expression level was higher in HCC tissues and cancer cell lines and was a poor prognosis marker in HCC, which is consistent with previous reports (33–35). Furthermore, knockdown of SNHG1 expression could inhibit cell proliferation, migration, and invasion significantly, and the function of SNHG1 was further confirmed in an in vivo xenograft model. However, the mechanism of SNHG1 in HCC is still unclear. Zhang et al. (35) revealed that SNHG1 promoted HCC proliferation and cell cycle progression through inhibiting p53 and its target genes expression, and similar results were described in colorectal cancer (36). Recent further research found that binding to DNMT1 mediated the role of SNHG1-induced p53 inhibition in HCC (34). As we know, sponging miRNA is an important regulatory way of lncRNA functions. For example, SNHG1 has been reported to regulate PDCD4 expression by sponging miR-195-5p in HCC (15). Recent studies found that SNHG1 promoted HCC progression via sponging miR-377-3p and miR-195 (16, 17). Interestingly, our findings showed a new mechanism through which SNHG1 promoted HCC growth by binding to miR-326 directly. Our data indicated that miR-326 level increased significantly after SNHG1 knockdown and SNHG1 level is correlated with miR-326 expression negatively based on TCGA database. Consistent with our reports, SNHG1 also accelerated tumorigenesis by sponging miR-326 in osteosarcoma and promoted nucleus pulposus cell proliferation through regulating miR-326 (30, 37).
Lamin B2 is a member of the lamin protein family known as the nuclear lamina, which included lamin A, B1, B2, B3, and C (38). It is reported to be involved in the formation of mitotic spindles (39). However, increasing evidence showed that LMNB2 was associated with prostate and lung tumor progression and served as a prognostic marker (40–42). In our results, we also found that knockdown of LMNB2 inhibited cell proliferation and growth in vitro and in vivo, consistent with the data in latest reports (23). miRNAs are small noncoding RNAs that regulate gene expression negatively by enhancing degradation of the target mRNA and inhibiting the following translation (43). Based on our data in bioinformatics analysis and cell experiments, we found that miR-326 mimics could reduce LMNB2 mRNA and protein expression compared with control in HCC cell lines, meaning we firstly identified LMNB2 as the target of miR-326 in HCC. To verify the hypothesis that SNHG1 regulates LMNB2 expression by sponging miR-326 in HCC, we tested the effects of miR-326 on SNHG1-induced LMNB2 expression. The rescue experiments indicated that miR-326 inhibitor reversed the LMNB2 decrease induced by SNHG1 knockdown, and correlation analysis also confirmed the SNHG1–miR-326–LMNB2 axis in HCC. Although Zhang et al. (42) have demonstrated that LMNB2 was responsible for the malignant phenotype of non-small cell lung carcinoma (NSCLC) through upregulating demethylation of H3K9, the mechanism of SNHG1 in HCC progression still needs further investigation.
To sum up, we found that SNHG1 acted as a ceRNA by sequestering miR-326 and regulating LMNB2 expression in HCC. These findings contributed to a better understanding of the mechanisms underlying HCC progression. SNHG1 may be a promising biomarker for predicting prognosis and a potential therapeutic target for HCC.
Data Availability Statement
The datasets presented in this study can be found in online repositories. The names of the repository/repositories and accession number(s) can be found in the article/Supplementary Material.
Ethics Statement
The studies involving human participants were reviewed and approved by Qilu Hospital of Shandong University. The patients/participants provided their written informed consent to participate in this study. The animal study was reviewed and approved by Qilu Hospital of Shandong University.
Author Contributions
WM, LG, and SN participated in the conceptual design of the study. WM participated in the operation of bioinformatics tools. WM, LG, and SN performed the experiments. SN and HY are responsible for fund acquisition. GL is responsible for resource acquisition. LG, YL, and GL participated in the data verification. WM and SN performed the data analysis and wrote the article. All authors have read and reviewed the article. All authors contributed to the article and approved the submitted version.
Funding
The present study was supported by the National Natural Science Foundation of China (grant nos. 31701013 and 81903044) and the Natural Science Foundation of Shandong Province (grant no. ZR2017BC032).
Conflict of Interest
The authors declare that the research was conducted in the absence of any commercial or financial relationships that could be construed as a potential conflict of interest.
Publisher’s Note
All claims expressed in this article are solely those of the authors and do not necessarily represent those of their affiliated organizations, or those of the publisher, the editors and the reviewers. Any product that may be evaluated in this article, or claim that may be made by its manufacturer, is not guaranteed or endorsed by the publisher.
Supplementary Material
The Supplementary Material for this article can be found online at: https://www.frontiersin.org/articles/10.3389/fonc.2021.784067/full#supplementary-material
Supplementary Table 1 | Clinical data in TCGA LIHC mRNA data.
Supplementary Table 2 | Clinical data in TCGA LIHC miRNA data.
References
1. Forner A, Reig M, Bruix J. Hepatocellular Carcinoma. Lancet (2018) 391:1301–14. doi: 10.1016/S0140-6736(18)30010-2
2. Villanueva A. Hepatocellular Carcinoma. N Engl J Med (2019) 380:1450–62. doi: 10.1056/NEJMra1713263
3. Marengo A, Rosso C, Bugianesi E. Liver Cancer: Connections With Obesity, Fatty Liver, and Cirrhosis. Annu Rev Med (2016) 67:103–17. doi: 10.1146/annurev-med-090514-013832
4. Yang JD, Hainaut P, Gores GJ, Amadou A, Plymoth A, Roberts LR. A Global View of Hepatocellular Carcinoma: Trends, Risk, Prevention and Management. Nat Rev Gastroenterol Hepatol (2019) 16:589–604. doi: 10.1038/s41575-019-0186-y
5. Lin DC, Mayakonda A, Dinh HQ, Huang P, Lin L, Liu X, et al. Genomic and Epigenomic Heterogeneity of Hepatocellular Carcinoma. Cancer Res (2017) 77:2255–65. doi: 10.1158/0008-5472.CAN-16-2822
6. Zheng H, Pomyen Y, Hernandez MO, Li C, Livak F, Tang W, et al. Single-Cell Analysis Reveals Cancer Stem Cell Heterogeneity in Hepatocellular Carcinoma. Hepatology (2018) 68:127–40. doi: 10.1002/hep.29778
7. Kopp F, Mendell JT. Functional Classification and Experimental Dissection of Long Noncoding RNAs. Cell (2018) 172:393–407. doi: 10.1016/j.cell.2018.01.011
8. Huarte M. The Emerging Role of Lncrnas in Cancer. Nat Med (2015) 21:1253–61. doi: 10.1038/nm.3981
9. Schmitt AM, Chang HY. Long Noncoding RNAs in Cancer Pathways. Cancer Cell (2016) 29:452–63. doi: 10.1016/j.ccell.2016.03.010
10. Wong CM, Tsang FH, Ng IO. Non-Coding RNAs in Hepatocellular Carcinoma: Molecular Functions and Pathological Implications. Nat Rev Gastroenterol Hepatol (2018) 15:137–51. doi: 10.1038/nrgastro.2017.169
11. Galamb O, Barták BK, Kalmár A, Nagy ZB, Szigeti KA, Tulassay Z, et al. Diagnostic and Prognostic Potential of Tissue and Circulating Long non-Coding RNAs in Colorectal Tumors. World J Gastroenterol (2019) 25:5026–48. doi: 10.3748/wjg.v25.i34.5026
12. Jiao M, Ning S, Chen J, Chen L, Jiao M, Cui Z, et al. Long non−Coding RNA ZEB1−AS1 Predicts a Poor Prognosis and Promotes Cancer Progression Through the MiR−200a/ZEB1 Signaling Pathway in Intrahepatic Cholangiocarcinoma. Int J Oncol (2020) 56:1455–67. doi: 10.3892/ijo.2020.5023
13. Thomson DW, Dinger ME. Endogenous MicroRNA Sponges: Evidence and Controversy. Nat Rev Genet (2016) 17:272–83. doi: 10.1038/nrg.2016.20
14. Wang JY, Yang Y, Ma Y, Wang F, Xue A, Zhu J, et al. Potential Regulatory Role of LncRNA-MiRNA-mRNA Axis in Osteosarcoma. BioMed Pharmacother (2020) 121:109627. doi: 10.1016/j.biopha.2019.109627
15. Huang D, Wei Y, Zhu J, Wang F. Long non-Coding RNA SNHG1 Functions as a Competitive Endogenous RNA to Regulate PDCD4 Expression by Sponging MiR-195-5p in Hepatocellular Carcinoma. Gene (2019) 714:143994. doi: 10.1016/j.gene.2019.143994
16. Qu A, Yang Q. LncRNA SNHG1 Promotes Cell Progression and Metastasis via Sponging MiR-377-3p in Hepatocellular Carcinoma. Neoplasma (2020) 67:557–66. doi: 10.4149/neo_2020_190705N593
17. Zhang H, Zhou D, Ying M, Chen M, Chen P, Chen Z, et al. Expression of Long non-Coding RNA (LncRNA) Small Nucleolar RNA Host Gene 1 (SNHG1) Exacerbates Hepatocellular Carcinoma Through Suppressing MiR-195. Med Sci Monit (2016) 22:4820–9. doi: 10.12659/MSM.898574
18. Ding L, Bailey MH, Porta-Pardo E, Thorsson V, Colaprico A, Bertrand D, et al. Perspective on Oncogenic Processes at the End of the Beginning of Cancer Genomics. Cell (2018) 173:305–20.e10. doi: 10.1016/j.cell.2018.03.033
19. Yu G, Wang LG, Han Y, He QY. Clusterprofiler: An R Package for Comparing Biological Themes Among Gene Clusters. Omics (2012) 16:284–7. doi: 10.1089/omi.2011.0118
20. Li JH, Liu S, Zhou H, Qu LH, Yang JH. Starbase V2.0: Decoding Mirna-Cerna, Mirna-Ncrna and Protein-RNA Interaction Networks From Large-Scale CLIP-Seq Data. Nucleic Acids Res (2014) 42:D92–7. doi: 10.1093/nar/gkt1248
21. Li R, Qu H, Wang S, Wei J, Zhang L, Ma R, et al. Gdcrnatools: An R/Bioconductor Package for Integrative Analysis of Lncrna, Mirna and Mrna Data in GDC. Bioinformatics (2018) 34:2515–7. doi: 10.1093/bioinformatics/bty124
22. Zhang S, Song X. Long non-Coding RNA SNHG1 Promotes Cell Proliferation and Invasion of Hepatocellular Carcinoma by Acting as a Molecular Sponge to Modulate MiR-195. Arch Med Sci (2020) 16:386–94. doi: 10.5114/aoms.2019.81311
23. Li XN, Yang H, Yang T. MiR-122 Inhibits Hepatocarcinoma Cell Progression by Targeting LMNB2. Oncol Res (2020) 28:41–9. doi: 10.3727/096504019X15615433287579
24. Mattioni A, Boldt K, Auciello G, Komada M, Rappoport JZ, Ueffing M, et al. Ring Finger Protein 11 Acts on Ligand-Activated EGFR via the Direct Interaction With the UIM Region of ANKRD13 Protein Family. FEBS J (2020) 287:3526–50. doi: 10.1111/febs.15226
25. Polito D, Cukras S, Wang X, Spence P, Moreau L, D’Andrea AD, et al. The Carboxyl Terminus of FANCE Recruits FANCD2 to the Fanconi Anemia (FA) E3 Ligase Complex to Promote the FA DNA Repair Pathway. J Biol Chem (2014) 289:7003–10. doi: 10.1074/jbc.M113.533976
26. Wang X, Kennedy RD, Ray K, Stuckert P, Ellenberger T, D’Andrea AD. Chk1-Mediated Phosphorylation of FANCE is Required for the Fanconi Anemia/BRCA Pathway. Mol Cell Biol (2007) 27:3098–108. doi: 10.1128/MCB.02357-06
27. Peng WX, Koirala P, Mo YY. Lncrna-Mediated Regulation of Cell Signaling in Cancer. Oncogene (2017) 36:5661–7. doi: 10.1038/onc.2017.184
28. Xu M, Chen X, Lin K, Zeng K, Liu X, Pan B, et al. The Long Noncoding RNA SNHG1 Regulates Colorectal Cancer Cell Growth Through Interactions With EZH2 and MiR-154-5p. Mol Cancer (2018) 17:141. doi: 10.1186/s12943-018-0894-x
29. Zhang Y, Yu R, Li Q, Li Y, Xuan T, Cao S, et al. SNHG1/MiR-556-5p/TCF12 Feedback Loop Enhances the Tumorigenesis of Meningioma Through Wnt Signaling Pathway. J Cell Biochem (2020) 121:1880–9. doi: 10.1002/jcb.29423
30. Wang J, Cao L, Wu J, Wang Q. Long non-Coding RNA SNHG1 Regulates NOB1 Expression by Sponging MiR-326 and Promotes Tumorigenesis in Osteosarcoma. Int J Oncol (2018) 52:77–88. doi: 10.3892/ijo.2017.4187
31. Bhan A, Soleimani M, Mandal SS. Long Noncoding RNA and Cancer: A New Paradigm. Cancer Res (2017) 77:3965–81. doi: 10.1158/0008-5472.CAN-16-2634
32. Li X, Zheng H. LncRNA SNHG1 Influences Cell Proliferation, Migration, Invasion, and Apoptosis of Non-Small Cell Lung Cancer Cells via the Mir-361-3p/FRAT1 Axis. Thorac Cancer (2020) 11:295–304. doi: 10.1111/1759-7714.13256
33. Li W, Dong X, He C, Tan G, Li Z, Zhai B, et al. LncRNA SNHG1 Contributes to Sorafenib Resistance by Activating the Akt Pathway and is Positively Regulated by MiR-21 in Hepatocellular Carcinoma Cells. J Exp Clin Cancer Res (2019) 38:183. doi: 10.1186/s13046-019-1177-0
34. Li SJ, Wang L, Sun ZX, Sun SJ, Gao J, Ma RL. LncRNA SNHG1 Promotes Liver Cancer Development Through Inhibiting P53 Expression via Binding to DNMT1. Eur Rev Med Pharmacol Sci (2019) 23:2768–76. doi: 10.26355/eurrev_201904_17550
35. Zhang M, Wang W, Li T, Yu X, Zhu Y, Ding F, et al. Long Noncoding RNA SNHG1 Predicts a Poor Prognosis and Promotes Hepatocellular Carcinoma Tumorigenesis. BioMed Pharmacother (2016) 80:73–9. doi: 10.1016/j.biopha.2016.02.036
36. Zhao Y, Qin ZS, Feng Y, Tang XJ, Zhang T, Yang L. Long non-Coding RNA (LncRNA) Small Nucleolar RNA Host Gene 1 (SNHG1) Promote Cell Proliferation in Colorectal Cancer by Affecting P53. Eur Rev Med Pharmacol Sci (2018) 22:976–84. doi: 10.26355/eurrev_201802_14379
37. Tan H, Zhao L, Song R, Liu Y, Wang L. The Long Noncoding RNA SNHG1 Promotes Nucleus Pulposus Cell Proliferation Through Regulating MiR-326 and CCND1. Am J Physiol Cell Physiol (2018) 315:C21–c7. doi: 10.1152/ajpcell.00220.2017
38. Hale CM, Shrestha AL, Khatau SB, Stewart-Hutchinson PJ, Hernandez L, Stewart CL, et al. Dysfunctional Connections Between the Nucleus and the Actin and Microtubule Networks in Laminopathic Models. Biophys J (2008) 95:5462–75. doi: 10.1529/biophysj.108.139428
39. Zheng X, Kim Y, Zheng Y. Identification of Lamin B-Regulated Chromatin Regions Based on Chromatin Landscapes. Mol Biol Cell (2015) 26:2685–97. doi: 10.1091/mbc.E15-04-0210
40. Saarinen I, Mirtti T, Seikkula H, Boström PJ, Taimen P. Differential Predictive Roles of a- and B-Type Nuclear Lamins in Prostate Cancer Progression. PloS One (2015) 10:e0140671. doi: 10.1371/journal.pone.0140671
41. Ma Y, Fei L, Zhang M, Zhang W, Liu X, Wang C, et al. Lamin B2 Binding to Minichromosome Maintenance Complex Component 7 Promotes non-Small Cell Lung Carcinogenesis. Oncotarget (2017) 8:104813–30. doi: 10.18632/oncotarget.20338
42. Zhang MY, Han YC, Han Q, Liang Y, Luo Y, Wei L, et al. Lamin B2 Promotes the Malignant Phenotype of Non-Small Cell Lung Cancer Cells by Upregulating Dimethylation of Histone 3 Lysine 9. Exp Cell Res (2020) 393:112090. doi: 10.1016/j.yexcr.2020.112090
Keywords: hepatocellular carcinoma, SNHG1, miR-326, LMNB2, lncRNA, microRNA, bioinformatics
Citation: Mu W, Guo L, Liu Y, Yang H, Ning S and Lv G (2021) Long Noncoding RNA SNHG1 Regulates LMNB2 Expression by Sponging miR-326 and Promotes Cancer Growth in Hepatocellular Carcinoma. Front. Oncol. 11:784067. doi: 10.3389/fonc.2021.784067
Received: 27 September 2021; Accepted: 09 November 2021;
Published: 30 November 2021.
Edited by:
Xuesong Gu, Beth Israel Deaconess Medical Center and Harvard Medical School, United StatesReviewed by:
Chenyu Lin, The Ohio State University, United StatesMin Zhang, Huazhong Agricultural University, China
Copyright © 2021 Mu, Guo, Liu, Yang, Ning and Lv. This is an open-access article distributed under the terms of the Creative Commons Attribution License (CC BY). The use, distribution or reproduction in other forums is permitted, provided the original author(s) and the copyright owner(s) are credited and that the original publication in this journal is cited, in accordance with accepted academic practice. No use, distribution or reproduction is permitted which does not comply with these terms.
*Correspondence: Shanglei Ning, c2hhbmdsZWluaW5nQDE2My5jb20=; Guoyue Lv, bHZneUBqbHUuZWR1LmNu