 Zhengqing Wan
 Haofeng Xiong
 Xian Tan
 Tong Su
 Kun Xia
 Danling Wang
- 1Hengyang Medical School, University of South China, Hengyang, China
- 2The Affiliated Changsha Central Hospital, Hengyang Medical School, University of South China, Changsha, China
- 3Postdoctoral Station for Basic Medicine, Hengyang Medical School, University of South China, Hengyang, China
- 4Xiangya Hospital, Central South University, Changsha, China
- 5Center for Medical Genetics, School of Life Sciences, Central South University, Changsha, China
Oral squamous cell carcinoma (OSCC) is one of the most common types of cancer worldwide. Due to the lack of early detection and treatment, the survival rate of OSCC remains poor and the incidence of OSCC has not decreased during the past decades. To explore potential biomarkers and therapeutic targets for OSCC, we analyzed differentially expressed genes (DEGs) associated with OSCC using RNA sequencing technology. Methylation−regulated and differentially expressed genes (MeDEGs) of OSCC were further identified via an integrative approach by examining publicly available methylomic datasets together with our transcriptomic data. Protein−protein interaction (PPI) networks of MeDEGs were constructed and highly connected hub MeDEGs were identified from these PPI networks. Subsequently, expression and survival analyses of hub genes were performed using The Cancer Genome Atlas (TCGA) database and the Gene Expression Profiling Interactive Analysis (GEPIA) online tool. A total of 56 upregulated MeDEGs and 170 downregulated MeDEGs were identified in OSCC. Eleven hub genes with high degree of connectivity were picked out from the PPI networks constructed by those MeDEGs. Among them, the expression level of four hub genes (CTLA4, CDSN, ACTN2, and MYH11) were found to be significantly changed in the head and neck squamous carcinoma (HNSC) patients. Three hypomethylated hub genes (CTLA4, GPR29, and TNFSF11) and one hypermethylated hub gene (ISL1) were found to be significantly associated with overall survival (OS) of HNSC patients. Therefore, these hub genes may serve as potential DNA methylation biomarkers and therapeutic targets of OSCC.
Introduction
Oral squamous cell carcinoma (OSCC) is the seventh most common cancer in males under the age of 60, with about 400,000 new cases reported annually worldwide (1). Geographically, the incidences of OSCC in developing countries like India and Brazil could be more than tenfold higher than those in Western countries. Although OSCC is predominantly seen in male over the age of 65, the disease appears to be increasing in younger patients under the age of 45 and the gender difference has been decreasing over the past few decades. Thus, OSCC represents a major public health problem, especially in poor and developing countries.
Despite recent advances in therapeutic modalities, the five−year morbidity rate of OSCC remains high and the survival rate stays dismal. Under the standard treatment plan, the outcomes of patients with OSCC could be completely different (2, 3). Therefore, uncovering the complex molecular changes leading to the development of OSCC as well as the factors contributing to the differential prognosis among OSCC patients represents a continuingly unmet medical need.
The etiology of OSCC is complicated and involves both genetic and environmental factors (4). DNA methylation is one of the most abundant epigenetic modifications with key regulatory functions in gene transcription and genomic stability. Growing evidence suggests that alterations of DNA methylation contribute to carcinogenesis. In OSCC, both global and site−specific DNA hypomethylation have been reported (5–7). Kim et al. found that three out of 14 tumor suppressor genes (TSGs) are hypermethylated and transcriptionally silenced in OSCC (8). Using microarray−based technologies, the methylomic alternations in OSCC have been extensively studied and reported by multiple groups (5, 9–15). Considering the fact that the majority of genes that are abnormally methylated in cancers have no corresponding changes in mRNA expression, it becomes important to understand the functional profile of these massive genome−wide methylomic data. Two recent studies have taken a meta−analysis approach and analyzed the impact of DNA methylation on gene expression and biological pathways using publicly available transcriptome and methylome datasets (16, 17). Due to the unknown heterogeneity within and across individual studies with regard to clinical diagnosis, tumor tissue dissection, sample processing, etc., more research efforts are needed to gain a trustworthy assessment of methylomic signatures in OSCC.
In this study, we have characterized the transcriptome of fresh OSCC tumor and paired normal adjacent tissue (NAT) using RNA sequencing technology. Two methylation−profiling datasets, GSE38532 and GSE46802, generated from the same microarray platform and of paired case−control design, were selected and integrated with our transcriptome data for multi−omics analysis. Methylation−regulated and differentially expressed genes (MeDEGs) were identified, hub genes were screened through protein−protein interaction (PPI) network analysis, and further validated in The Cancer Genome Atlas (TCGA) database. Using this integrated approach, we were able to identify novel DNA methylation regulated genes with potential clinical applications in OSCC.
Materials And Methods
Tumor Biospecimen Collection and RNA Extraction
In total, 17 paired samples of OSCC and NAT were collected from newly diagnosed patients who underwent surgical resection and had received no prior treatment for the disease at Xiangya Hospital of Central South University (CSU). The samples were collected in accordance with the guidelines issued by the Ethics Committee of School of Life Sciences, CSU (Record#2020−1−42). Written informed consent was obtained to all participants in this study.
All biospecimens from patients were pathologically reviewed and confirmed by two independent pathologists. Among these patients, there were four with stage I, four with stage II, four with stage III, and five with stage IV. Their demographic characteristics are presented in Table 1. After surgical removal, all samples were immediately transferred to the lab on ice using CO2 independent medium (18045088, Gibco, USA). Tissue blocks of about 30 mg were further dissected out and used for extraction of total RNA following the manufacturer’s instruction of the AllPrep DNA/RNA/miRNA Universal Kit (80224, Qiagen, USA).
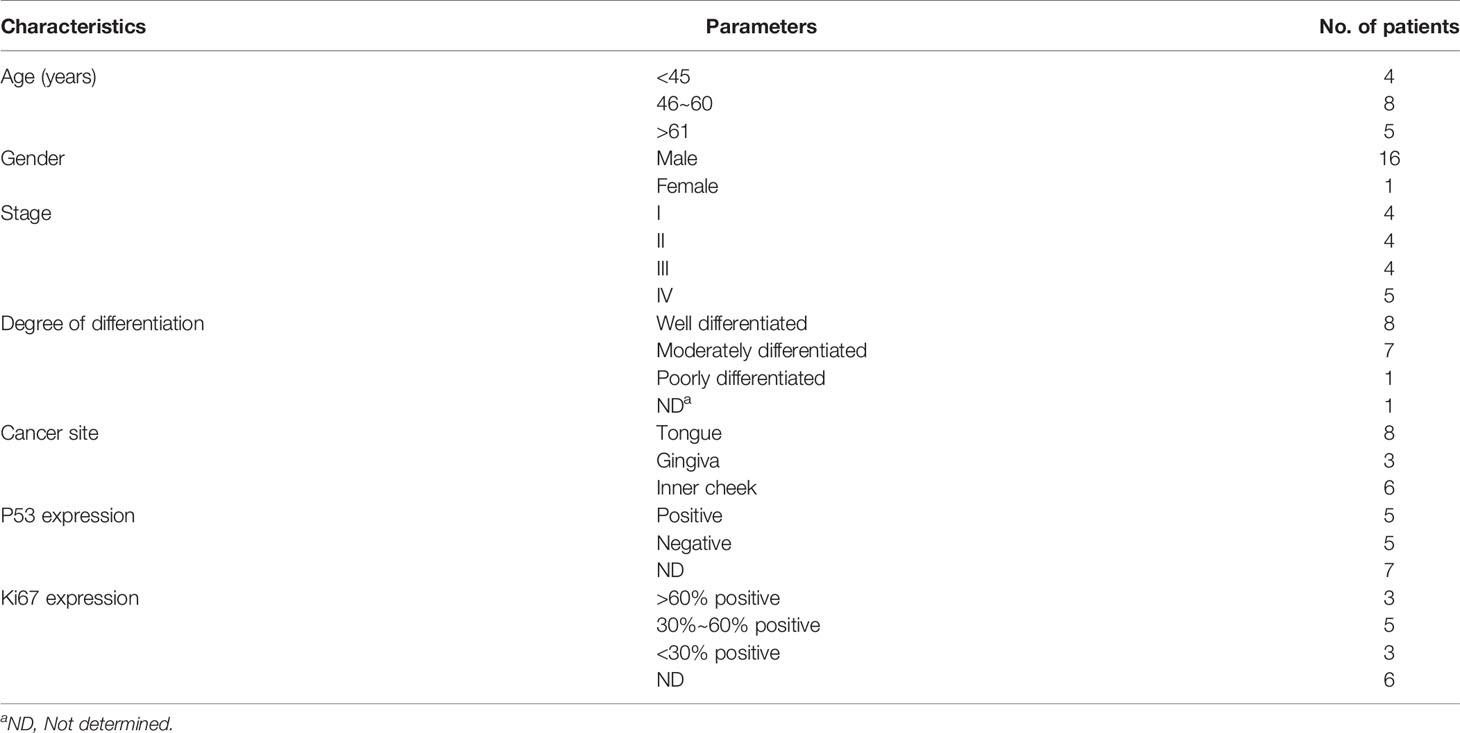
Table 1 Patient demographics and clinical characteristics.
RNA Sequencing and Data Processing
For library preparation, 1 μg of total RNA from each sample was depleted for rRNA using the Ribo−Zero rRNA Removal Kit (RZH1046, EPICENTRE, USA), followed by construction of sequencing library using the TruSeq RNA Sample Prep Kit v2 (RS−122, Illumina, USA). Individual RNA libraries were pooled and sequenced using paired−end sequencing with 150 bp reads on an Illumina HiSeq3000 instrument.
Adapter and low−quality reads were first trimmed using Trim Galore (version 0.4.4) in paired−end mode with default parameters. Trimmed reads were then mapped to the hg19 reference genome to count mapped reads for all human transcripts. Normalization and analysis of differentially expressed genes (DEGs) were carried out using multifactor analysis (tumor vs. NAT) in the DESeq2 R program package (version 1.30.1). Significant genes were identified with statistical cut−off of |Log2FC| > 2 and false discovery rate (FDR) < 0.05.
Methylation Data Acquisition and MeDEGs Identification
Microarray−based gene methylation profiling datasets GSE38532 and GSE46802 were obtained from the NCBI gene expression omnibus (GEO, https://www.ncbi.nlm.nih.gov/geo/). Forty OSCC and 40 matched NAT specimens were obtained in GSE38532, while ten paired OSCC and NAT specimens were included in GSE46802. Both microarrays used the Illumina GPL8490 microarray platform (HumanMethylation 27 BeadChip, HumanMethylation27_270596_v.1.2, Illumina, USA). This methylation chip contains 27,578 individual CpG sites spread across the proximal promoter regions, defined as 1500 bp upstream of the transcription start site (TSS1500), of 14,495 genes.
The GEO2R online software was utilized to analyze these two datasets to identify differentially methylated genes (DMGs). FDR < 0.05 and delta β−value > 0.1 were used as the cut−off standards during analysis as previously described (18). Eventually, Venndiagram package (version 1.6.20) of R program was used to obtain the overlaps between DMGs and DEGs and to identify MeDEGs, including downregulated genes with a hypermethylated pattern and upregulated genes with a hypomethylated pattern.
Functional Enrichment Analysis
Functional clustering annotation of the DEGs and MeDEGs were conducted via the Metascape online tool (19). For functional clustering, enriched annotations from the Gene Ontology (GO) biological processes and the Reactome gene sets were included. Analyses were carried out with the default parameters of minimal overlap of 3, minimal enrichment ratio of 1.5, and p−value < 0.01 as previously described (20).
Protein−Protein Interaction (PPI) Network Construction
The PPI networks of downregulated genes with a hypermethylated pattern and upregulated genes with a hypomethylated pattern were constructed using the Search Tool for the Retrieval of Interacting Genes (STRING, version 11.0) online database. PPI with an interaction score > 0.4 was visualized in the final STRING network. Protein networks are clustered to MCL inflation parameter of 2 (21).
Identification of Potential Hub Genes
To identify potential hub genes, the cytoHubba plugin of the Cytoscape (version 3.8.2, http://www.cytoscape.org/) software was used to screen modules within PPI network. Four topological analysis methods were individually utilized (MCC, MNC, Degree, and EPC) to obtain the top ten important genes from each PPI network. Common genes selected from all four methods were regarded as potential hub genes with consensus.
Validation of Hub Genes
The Gene Expression Profiling Interactive Analysis (GEPIA) online platform provides fast evaluation between the survival effect and the expression profile analysis of DEGs in a given cancer type. To validate aforementioned hub genes, the relative expression levels of these genes in head and neck squamous cell carcinoma (HNSC) were identified with statistical cut−off of |log2FC| > 1 and p−value < 0.05 as previously described (22). In addition, the overall survival (OS) effect of hub genes in HNSC was estimated by calculating the log−rank p−value and the hazard ratio (HR). Patients were divided into high (higher than the 75th percentile) and low (lower than the 25th percentile) expression groups based on the normalized expression level of the selected gene across all HNSC patients in the database (23). Since there is no OSCC category in both GEPIA and TCGA databases, and OSCC accounts for ~95% of HNSC, we chose HNSC as the category for these validation analyses.
Immune Infiltration Analysis
Infiltrations of immune cells in OSCC tumors and NATs were estimated using TIMER web tool (24, 25). Briefly, RNA−seq data in TPM (transcripts per million) format from the 17 paired samples of OSCC and NAT were calculated. The infiltration abundance of B cell, CD4+ T cell, CD8+ T cell, neutrophil, macrophage, and myeloid dendritic cell in each sample were evaluated using TIMER2.0. Similar procedures were used to analyze data from TCGA-HNSC and paired NAT samples.
Results
Characterization of RNA Sequencing and Mapping
Using RNA sequencing, a total of 1418 million and 1289 million cleaned reads were obtained from pooled OSCC and NAT libraries with 65−106 million reads per library for all samples. In all 34 libraries, > 92.9% cleaned bases have Phred quality score (Q−scores) above 30, indicating a high base call accuracy. Forty-two to eighty-one million reads were uniquely mapped to the hg19 reference genome for each sample, with an average unique mapping ratio of 92% (Table 2).
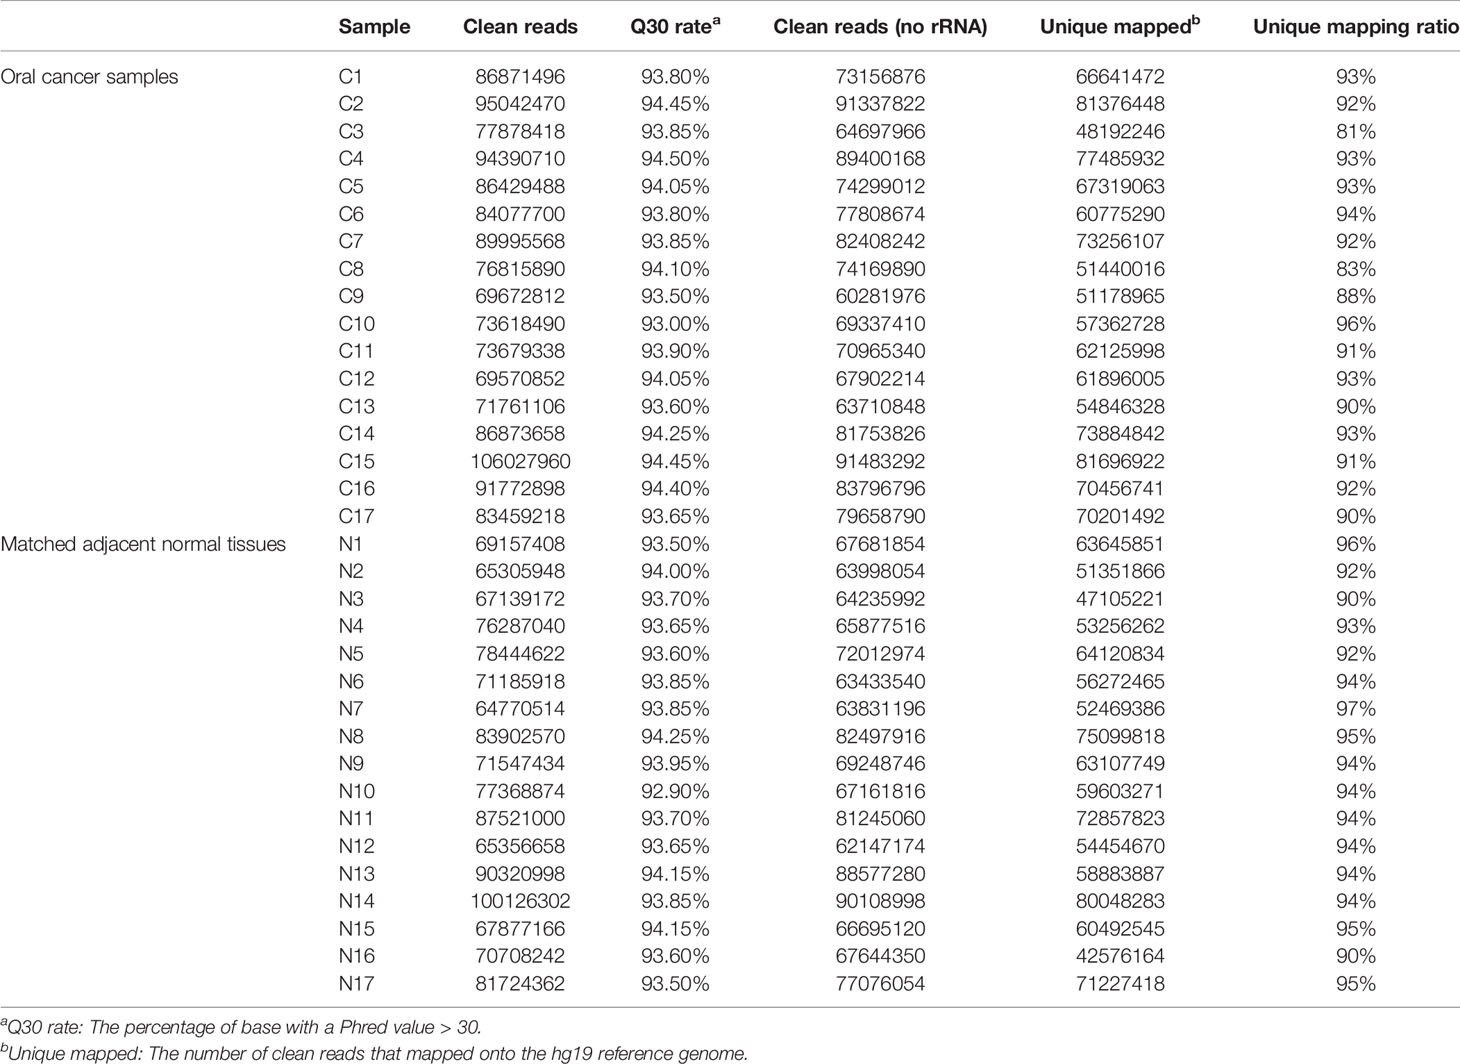
Table 2 RNA sequencing profile.
Identification of DEGs in OSCC
Principal component analysis (PCA) of RNA−seq data showed that deconvoluted data from OSCC samples and NATs were clustered into different patterns (Figure 1A), suggesting the underlying differences between these two conditions. A total of 778 upregulated genes and 2211 downregulated genes were obtained by the DESeq2 package using the cut−off criteria of FDR < 0.05 and |log2FC| > 2, as shown in Figure 1B by a volcano plot. Further functional clustering analysis using the online tools in Metascape shown that upregulated genes were mainly involved in functions such as response to bacterium, formation of the cornified envelope, extracellular matrix organization, antimicrobial humoral response, etc. (Figure 1C), while downregulated genes were mainly involved in muscle system process, muscle contraction, muscle structure development, muscle cell development, etc. (Figure 1D).
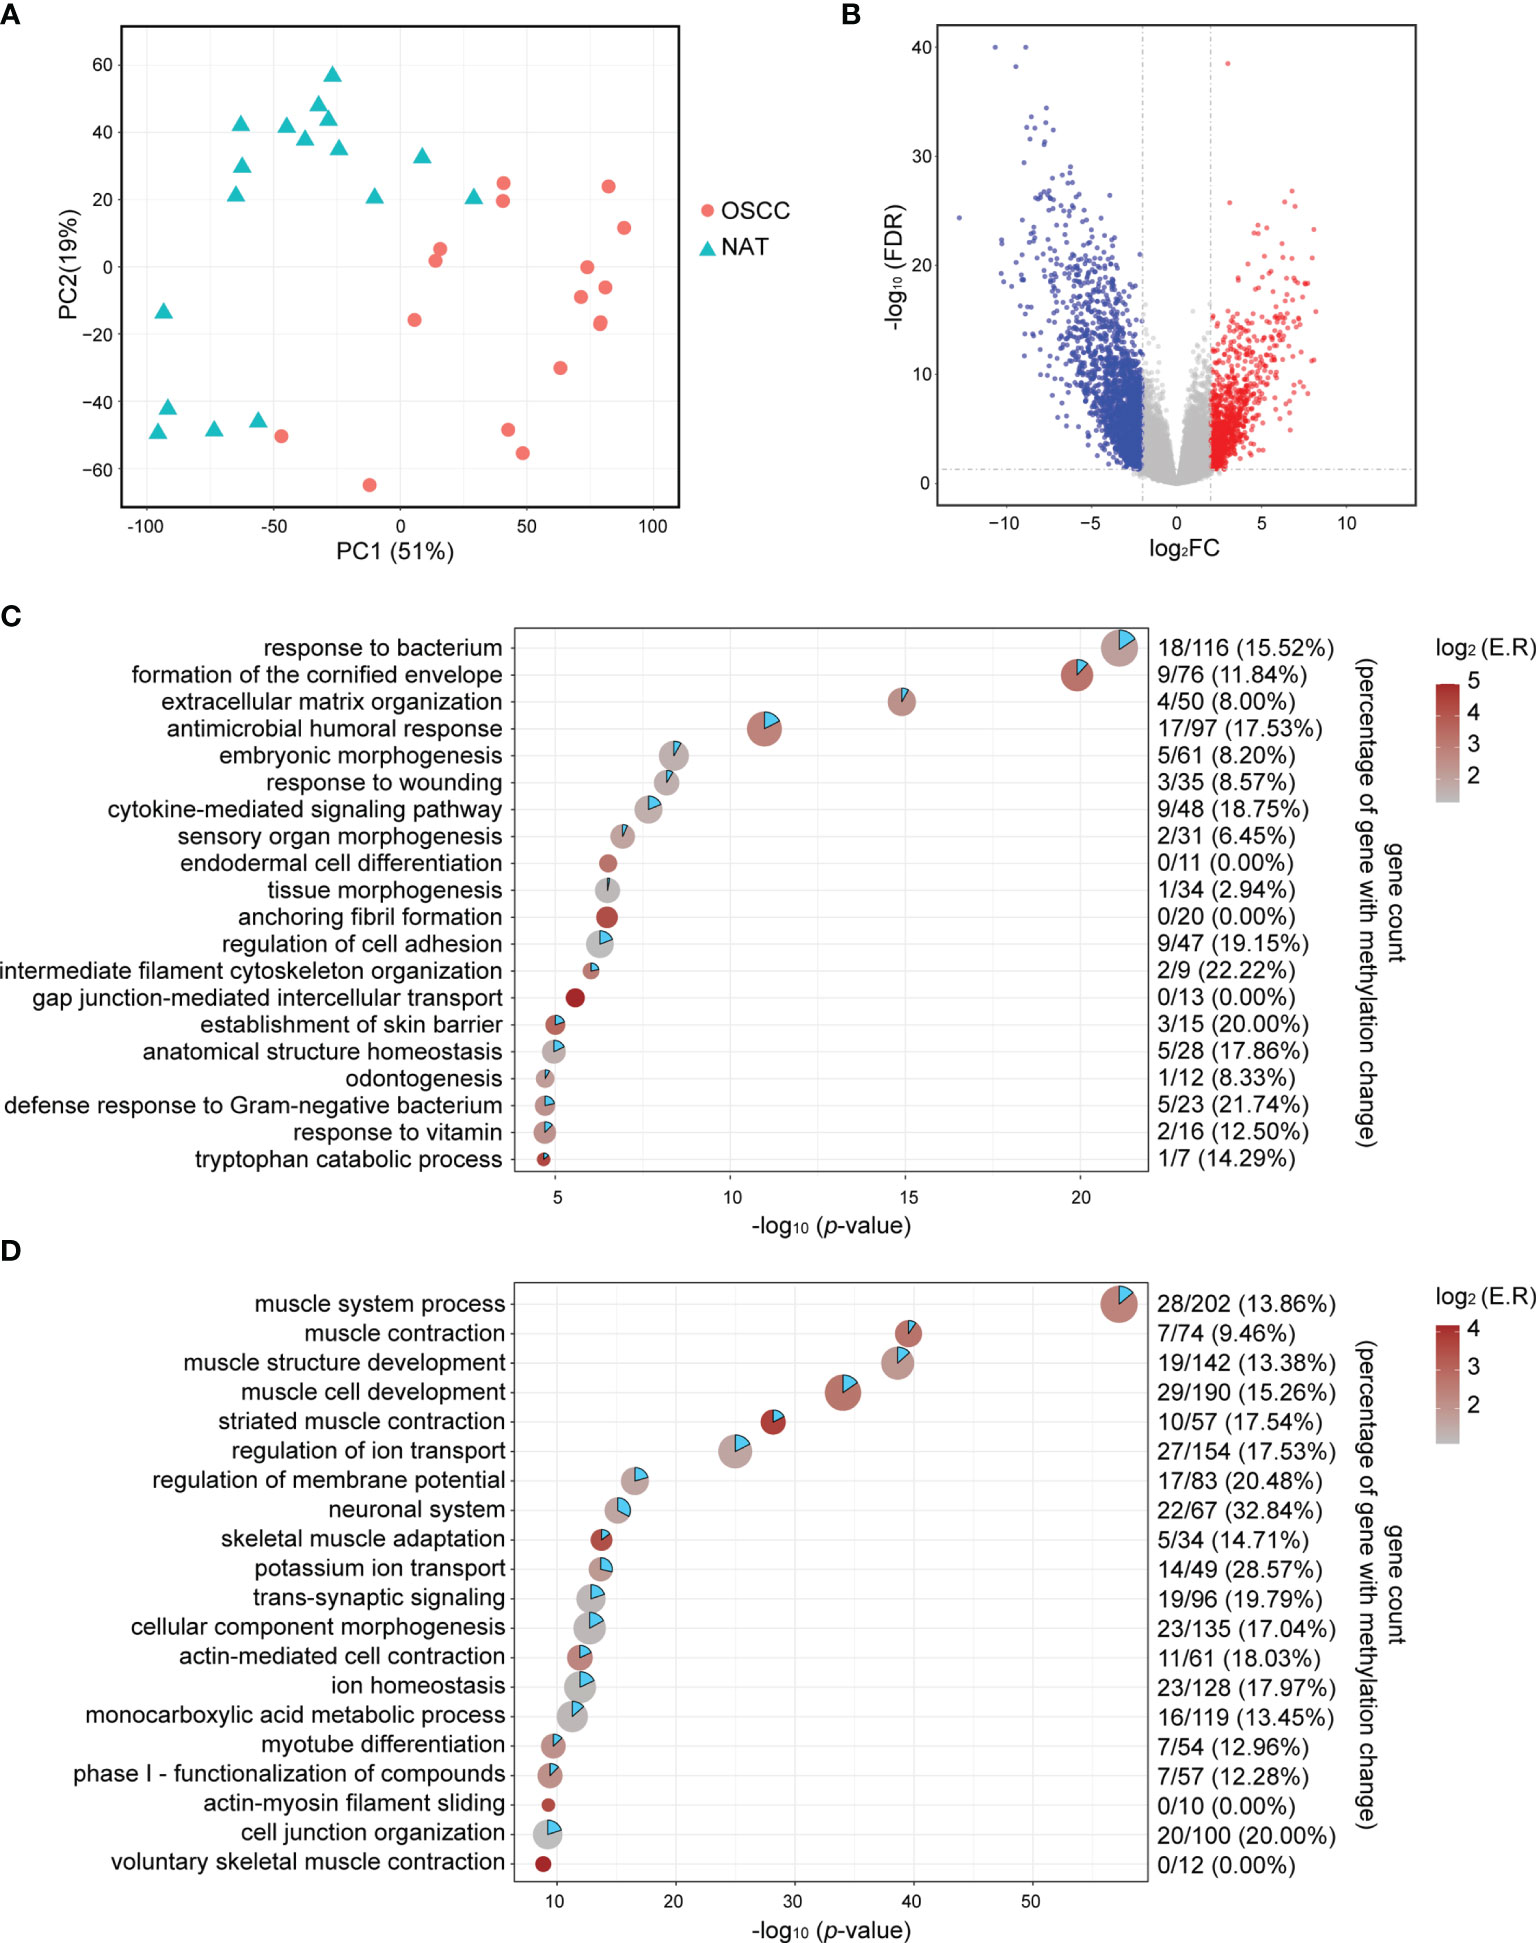
Figure 1 Identification of DEGs. (A) PCA plots of RNA-seq data show the different characteristic of RNA expression patterns of OSCC tissues and NATs. Each dot indicates a sample. (B) Volcano plot visualizing the DEGs identified by the DESeq2 packages. The vertical dotted lines are positioned at log2FC of 2 or -2. The horizontal dotted lines are positioned at FDR = 0.05. (C) Point plot for the top 20 enriched functional clusters for upregulated genes. X-axis indicates -log10 (p-value), color indicates enrichment ratio, and size indicates gene counts in unique functional clusters. Gene count in the right panel indicates hypomethylated-upregulated genes/all upregulated genes (percentage of upregulated gene with methylation change). (D) Point plot for the top 20 enriched functional clusters for downregulated genes. X-axis indicates -log10 (p-value), color indicates enrichment ratio, and size indicate gene counts in unique functional clusters. Gene count in the right panel indicates hypomethylated-upregulated genes/all upregulated genes (percentage of upregulated gene with methylation change). log2FC, log2 transformed fold change; NAT, normal adjacent tissue; FDR, Benjamini & Hochberg adjusted p-value.
Identification of Aberrantly MeDEGs in OSCC
To identify potential MeDEGs (i.e., genes that exhibit inverse correlation between their alterations of DNA methylation at promoter regions and gene expression), we performed a multi−omics analysis by integrating our transcriptomic data and publicly available methylomic data (GSE38532 and GSE46802). As shown in the Venn diagrams in Figures 2A, B, 56 upregulated and hypomethylated genes and 170 downregulated and hypermethylated genes (Table 3) were identified from this study. The heatmap of these potential MeDEGs is demonstrated in Figure 2C.
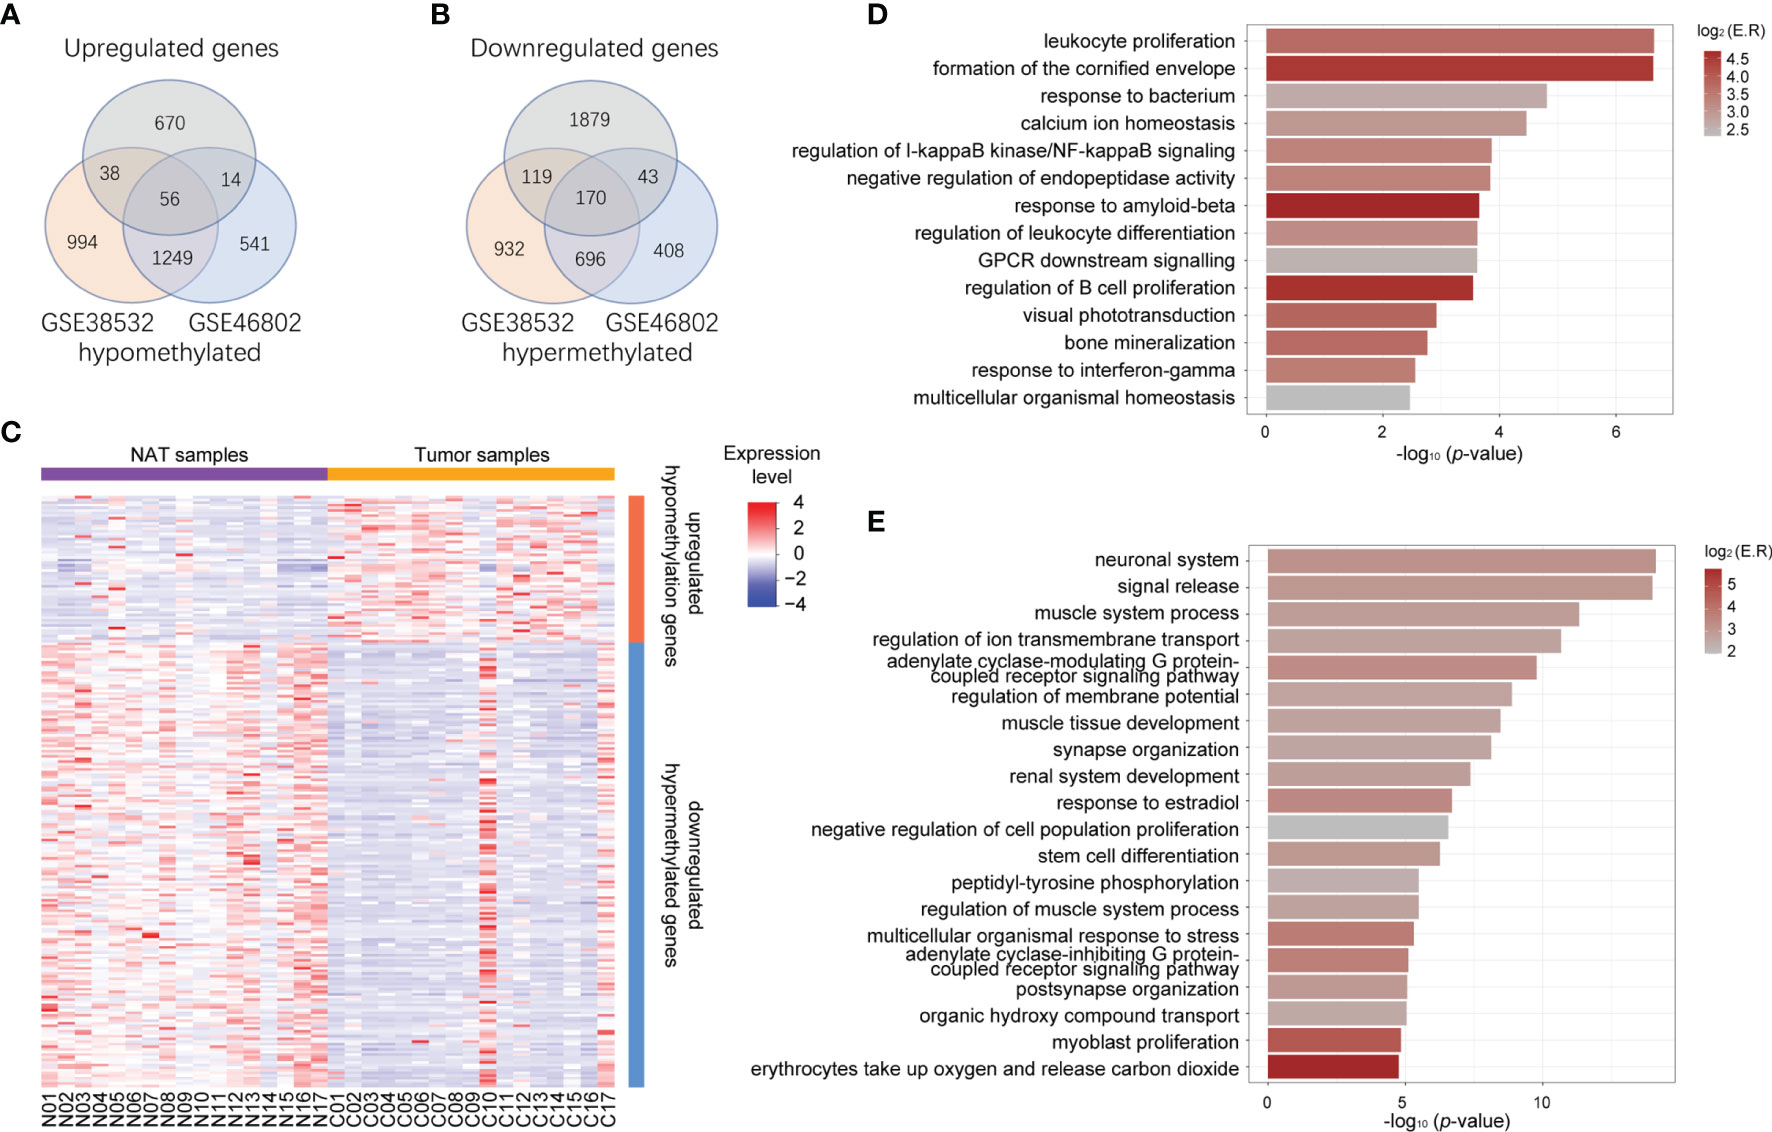
Figure 2 Identification of aberrantly methylated and differentially expressed genes. (A) Venn diagram of upregulated genes (grey circle) and hypomethylated genes common to both methylation datasets (orange circle for dataset GSE38532 and blue circle for dataset GSE46802). (B) Venn diagram of downregulated genes (grey circle) and hypermethylated genes common to both methylation datasets (orange circle for dataset GSE38532 and blue circle for dataset GSE46802). (C) Heatmap representing expression level of all the NAT and tumor samples (columns) and genes (rows) detected as methylation-regulated differentially expressed. (D) Bar plot represents functional clusters of upregulated-hypomethylated genes with statistical significance. X-axis indicates -log10 (p-value), color indicates log2 (enrichment ratio). (E) Bar plot represents functional clusters of downregulated-hypermethylated genes with statistical significance. X-axis indicates -log10 (p-value), color indicates log2 (enrichment ratio).
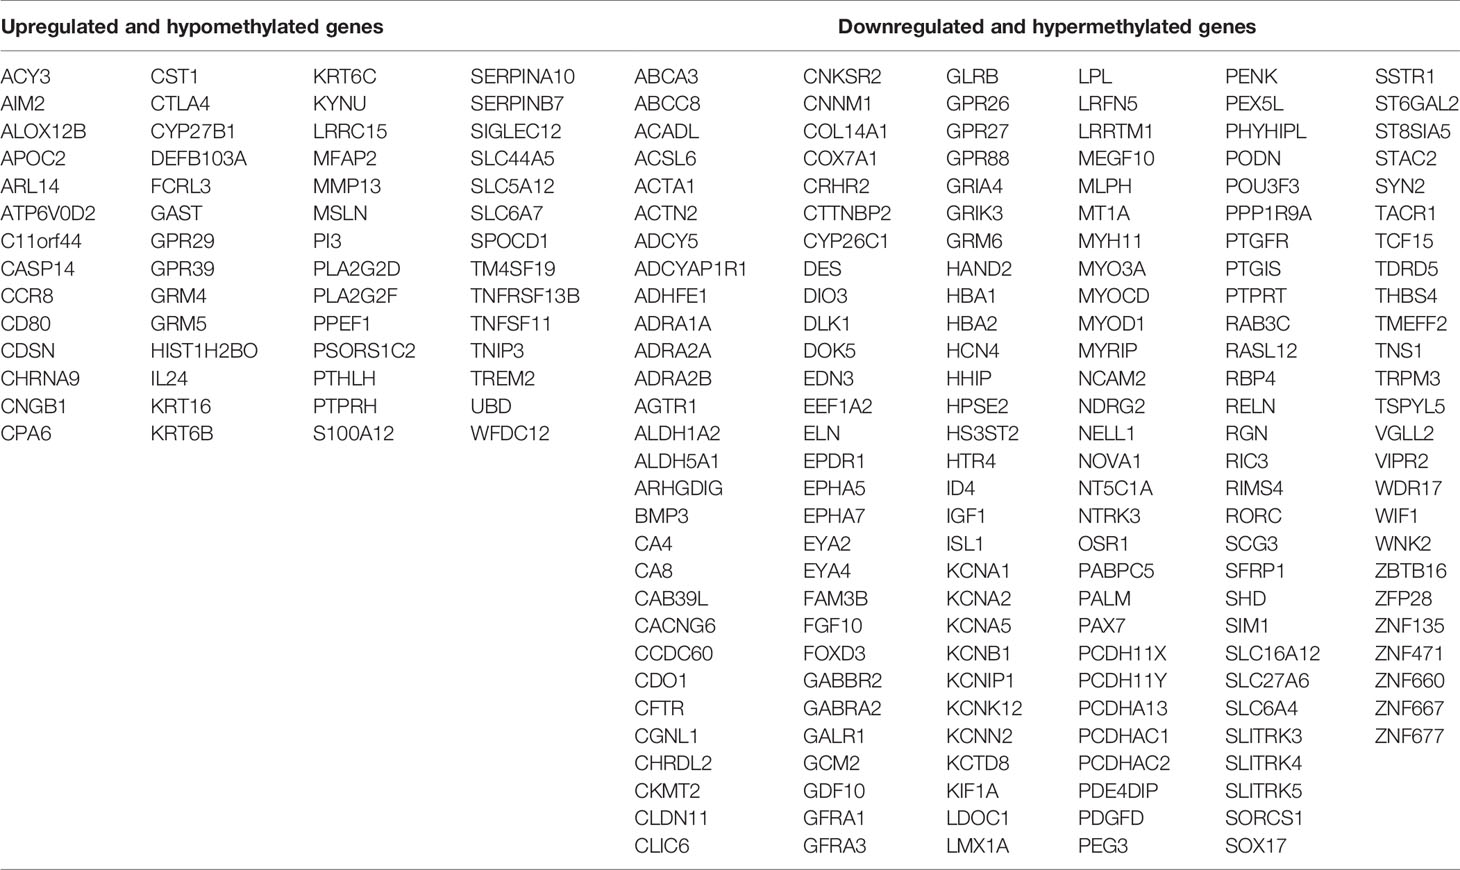
Table 3 Methylation−regulated differentially expressed genes.
Functional Enrichment Analyses of Potential MeDEGs
To evaluate the biological functions of these potential MeDEGs, functional clustering was analyzed using the online tools in Metascape. As shown in Figures 2D, E, genes that were upregulated and hypomethylated were enriched in biological processes such as leukocyte proliferation, formation of the cornified envelope, response to bacterium, calcium ion homeostasis, etc., while downregulated and hypermethylated genes were linked to neuronal system, signal release, muscle system process, regulation of ion transmembrane transport, etc. To further understand the contribution of DNA methylation to the altered gene expression in OSCC, we evaluated the ratio of DEGs that were inversely affected by methylation changes in each enriched functional cluster. As shown in Figures 1C, D, differentially upregulated genes involved in functions such as intermediate filament cytoskeleton organization, defense response to Gram−negative bacterium, establishment of skin barrier, and regulation of cell adhesion were often hypomethylated (22.22%, 21.74%, 20.00%, and 19.15%, respectively). For differentially downregulated genes, those involved in neuronal system, potassium ion transport, regulation of membrane potential, and cell junction organization were most likely to be hypermethylated (32.84%, 28.57%, 20.48%, and 20.00%, respectively).
PPI Network Construction and Hub Gene Identification
The PPI network of 56 upregulated MeDEGs and 170 downregulated MeDEGs were constructed using the STRING v11.0 database and visualized via the Cytoscape software. Thirty nodes and 38 edges were identified from the network of upregulated MeDEGs (Figure 3A), and 121 nodes and 207 edges were found from the network of downregulated MeDEGs (Figure 3B). Within each PPI network, the top 10 highly interacted genes were evaluated using four different calculation methods (MCC, MNC, Degree, and EPC) individually. Common genes coming out of all four methods were selected as potential hub genes. Eleven hub genes, including six hypomethylated genes (CTLA4, GRP29, TNFSF11, CD80, CDSN, and PI3) and five hypermethylated genes (ACTN2, MYOD1, ISL1, MYH11, and PAX7) were identified from these networks (Table 4 and Figures 4A, B).
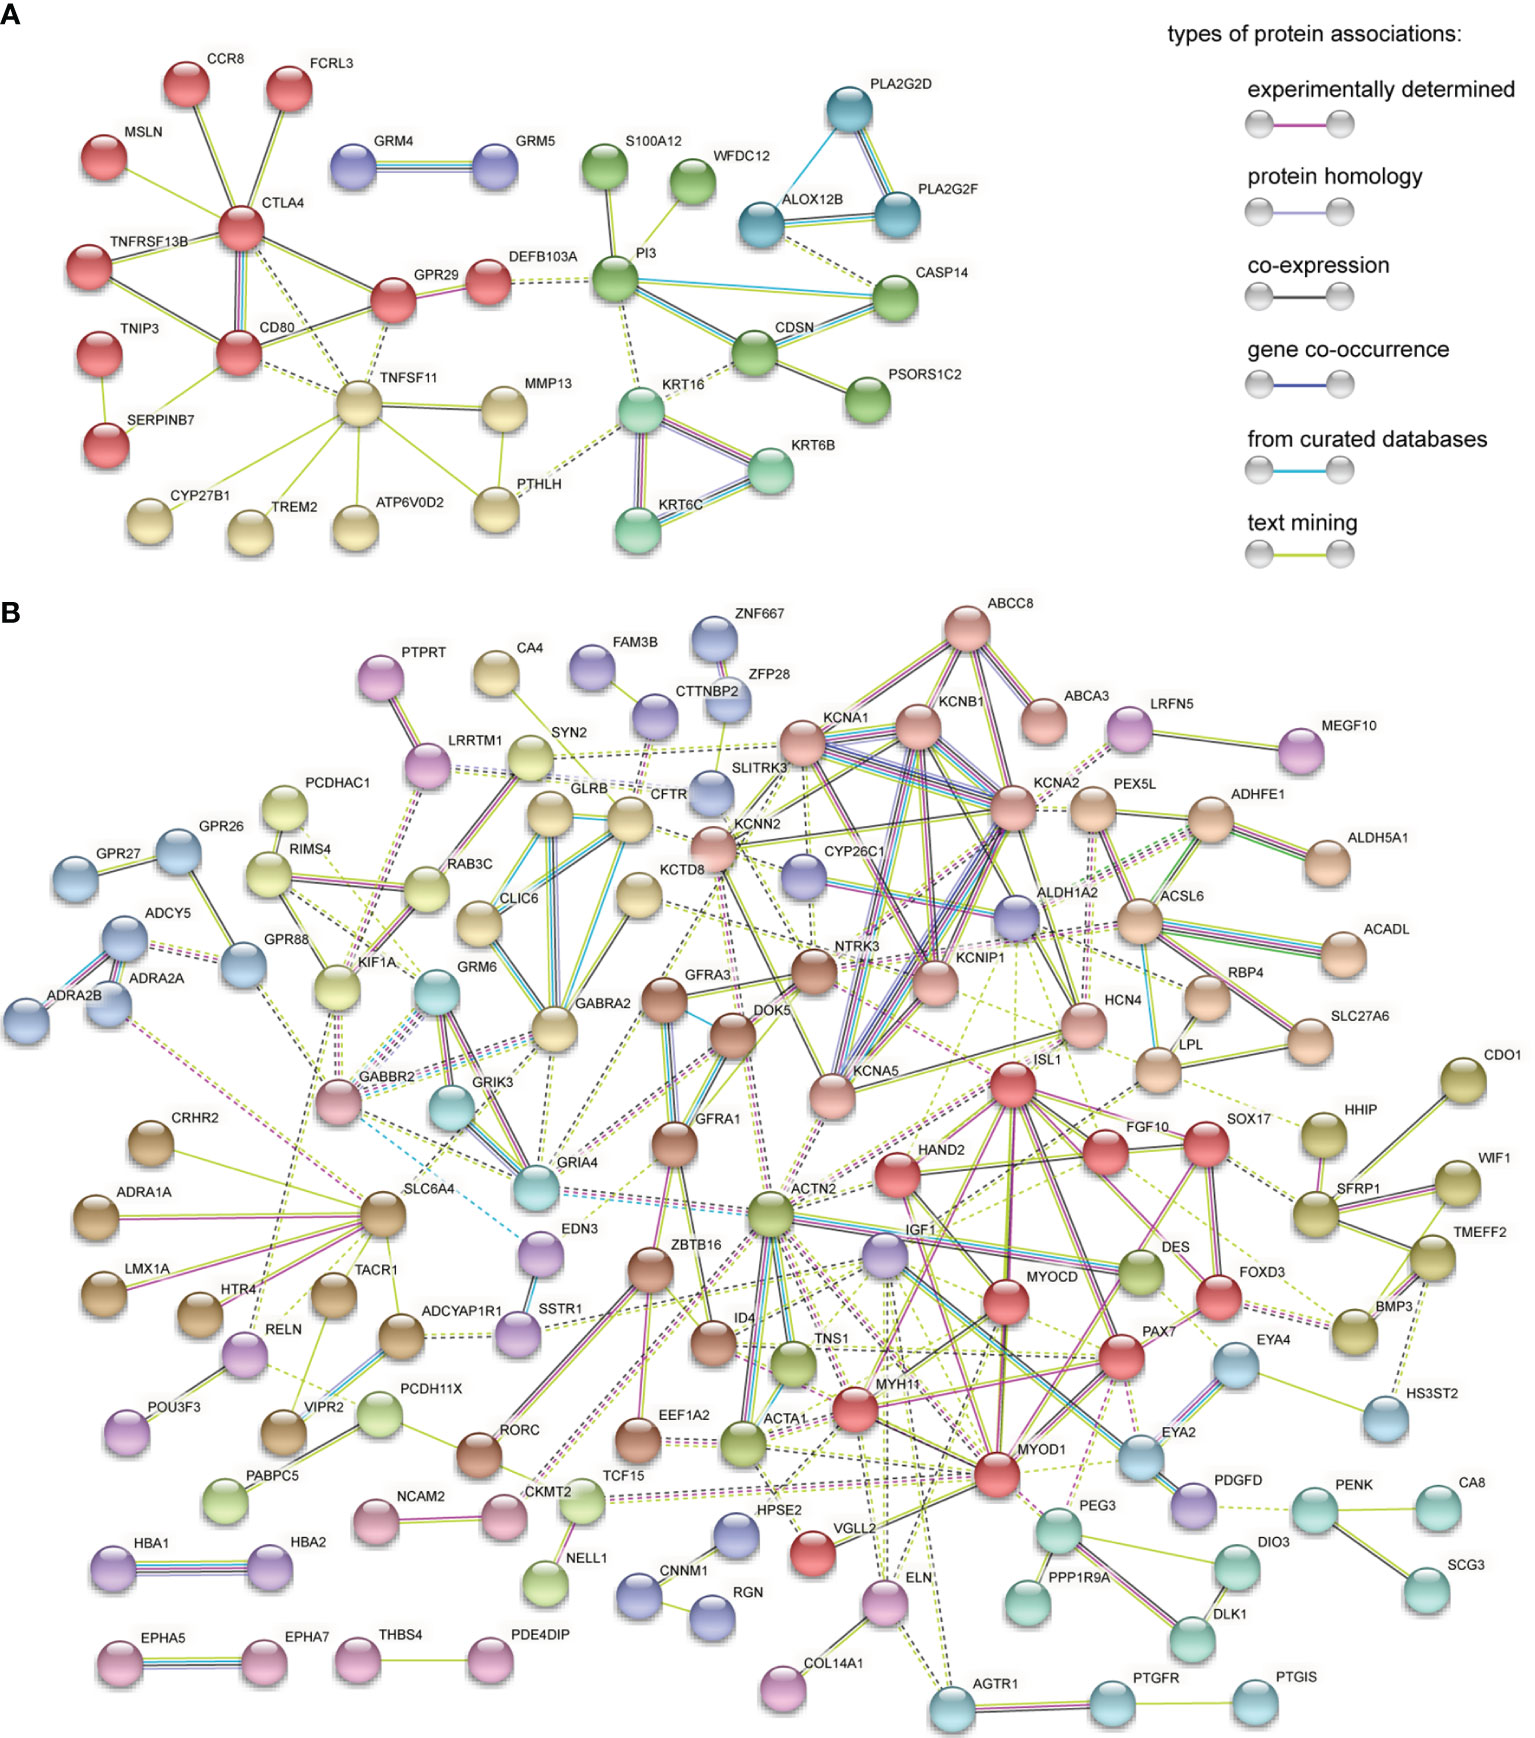
Figure 3 PPI network analysis of MeDEGs. (A) PPI network of upregulated and hypomethylated genes. (B) PPI network of downregulated and hypermethylated genes. Each node represents a protein coded by unique genes, edges indicate interactions, and the color of edge indicates the degree of associations between proteins. Disconnected nodes in the network were hidden. Protein networks are clustered on MCL inflation parameter 2. Nodes from the same cluster are presented in the same color. Edges between different clusters are represented by dashed line.
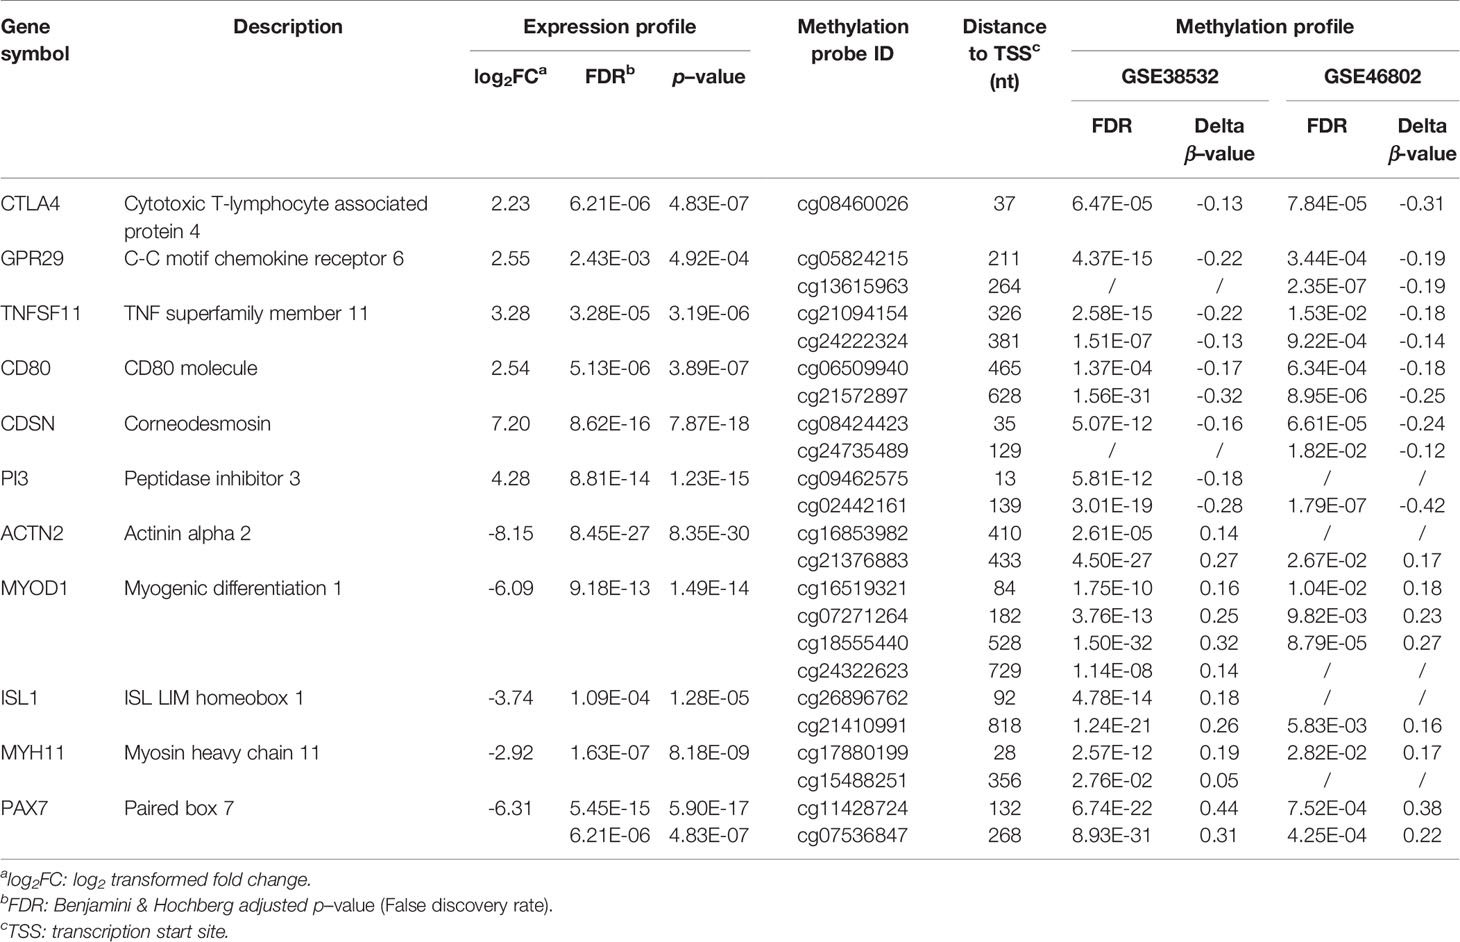
Table 4 Expression and Methylation Profiles of Eleven Potential Hub MeDEGs.
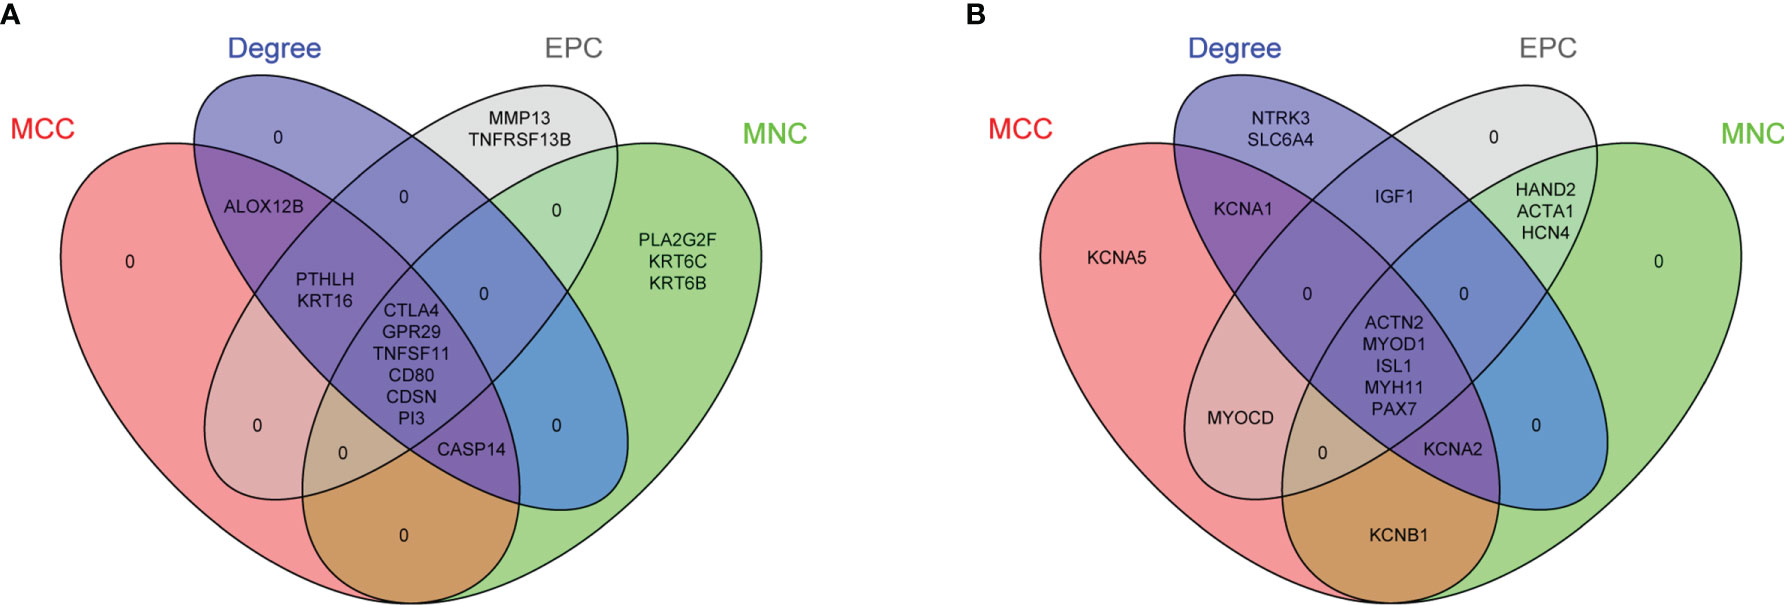
Figure 4 Identification of potential hub genes from PPI networks of MeDEGs. (A) Venn diagram of highly connected genes identified by four calculation methods from PPI network of upregulated and hypomethylated genes. Six overlapping genes were identified in the intersection of all lists. (B) Venn diagram of highly connected genes identified by four calculation methods from PPI network of downregulated and hypermethylated genes. Five overlapping genes were identified in the intersection of all lists. List of calculation methods: MCC (red), MNC (green), Degree (blue), and EPC (gray).
Validation of The Hub Genes
To evaluate the clinical relevance of these potential hub genes in OSCC, we assessed their expression levels in normal and tumor tissues using the GEPIA online tool. Since OSCC accounts for ~95% of all HNSC cases and a specific OSCC category is not included in TCGA database, similar to other studies, TCGA−HNSC data were obtained and used in this analysis (26). As shown in Figures 5A–K, the expression levels of four hub genes (CTLA4, CDSN, ACTN2, and MYH11) were significantly dysregulated in HNSC. The two hypomethylated hub genes, CTLA4 and CDSN, were significantly upregulated, and two hypermethylated hub genes, ACTN2 and MYH11, were downregulated in the HNSC tumor samples. All remaining hub genes, although without statistic strength, showed a correct trend with regard to gene expression in tumor tissues compared to those in NATs.
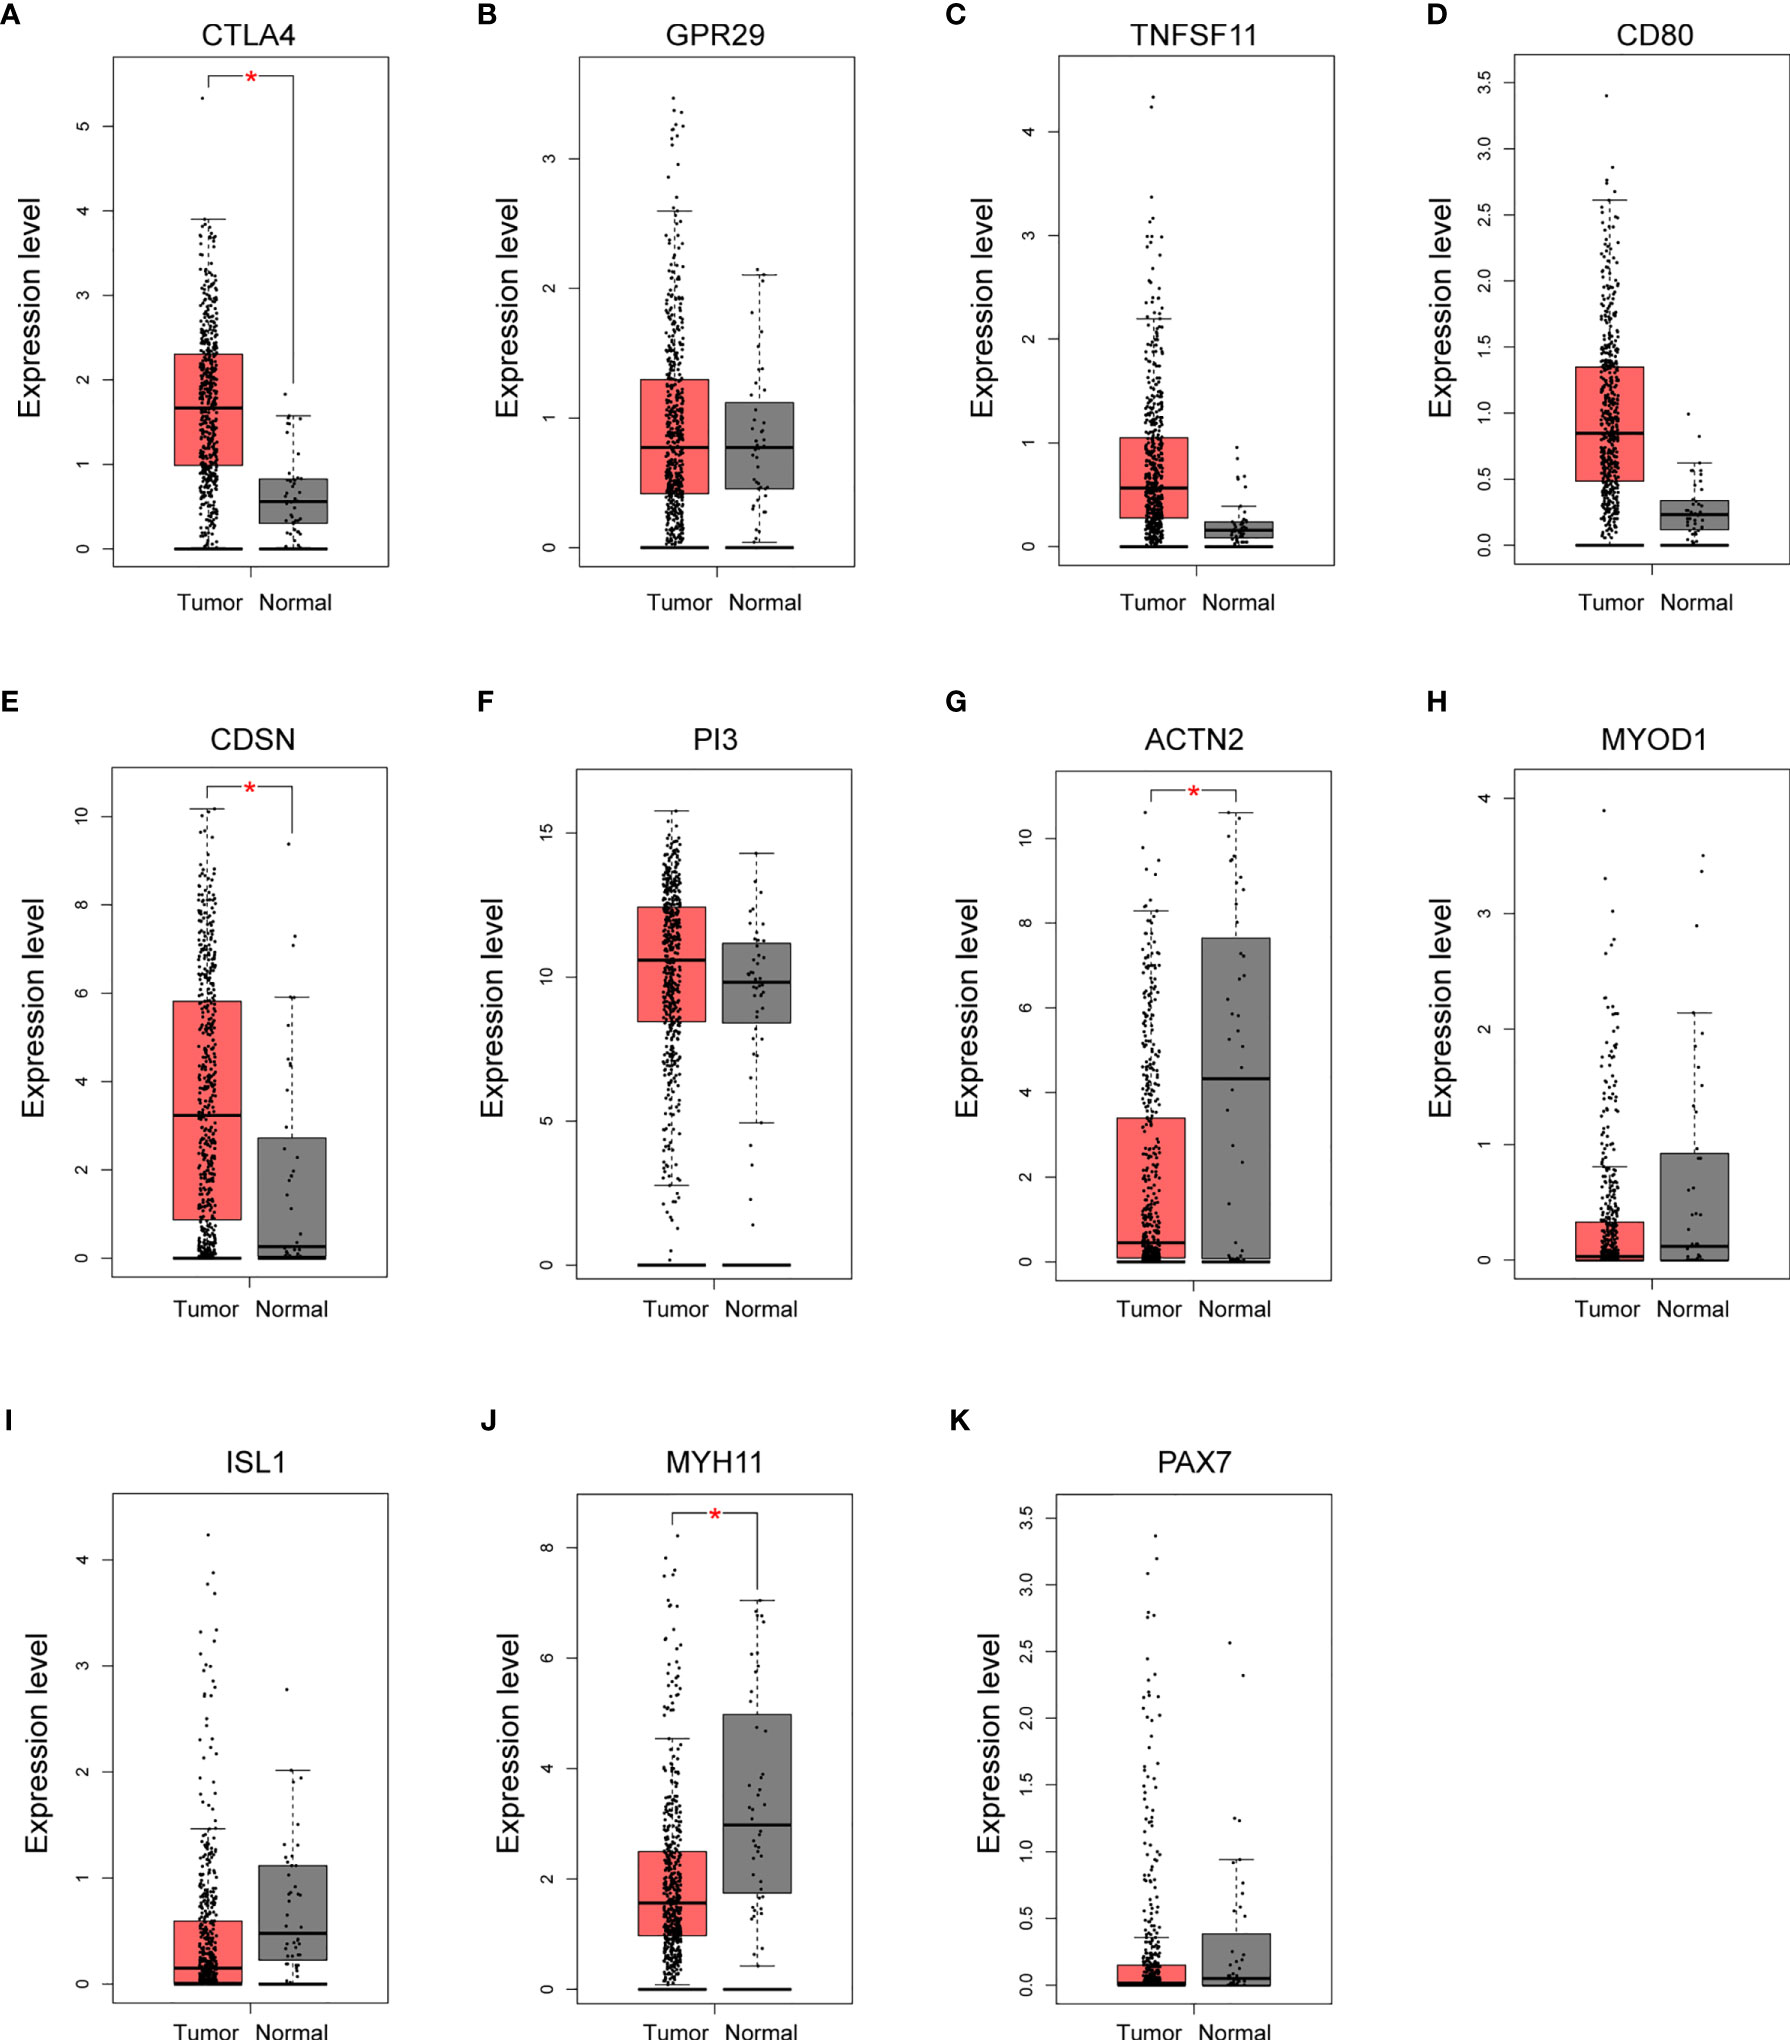
Figure 5 Validation of the expression of potential hub genes in the Cancer Genome Atlas (TGCA) database. (A–K) Box plots showing the relative expression levels of 11 potential hub genes across normal tissues (n = 44) and HNSC tumor samples (n = 519). Expression level indicates log2 (TPM + 1). TPM, Transcripts Per Million reads. *p < 0.05.
In addition, we explored the prognostic value of these 11 hub genes by examining the association between the expression level of each gene and the OS of the HNSC cases using the Kaplan−Meier plotter (Figures 6A–K). The expression levels of four hub genes showed significant correlation with the HNSC clinical outcome. High expression levels of all three hypomethylated and upregulated hub genes (CTLA4, GPR29 and TNFSF11) presented a trend of association with longer OS (Figures 6A–C), while low expression of hypermethylated and downregulated hub gene ISL1 was found to be significantly associated with shorter OS (Figure 6I).
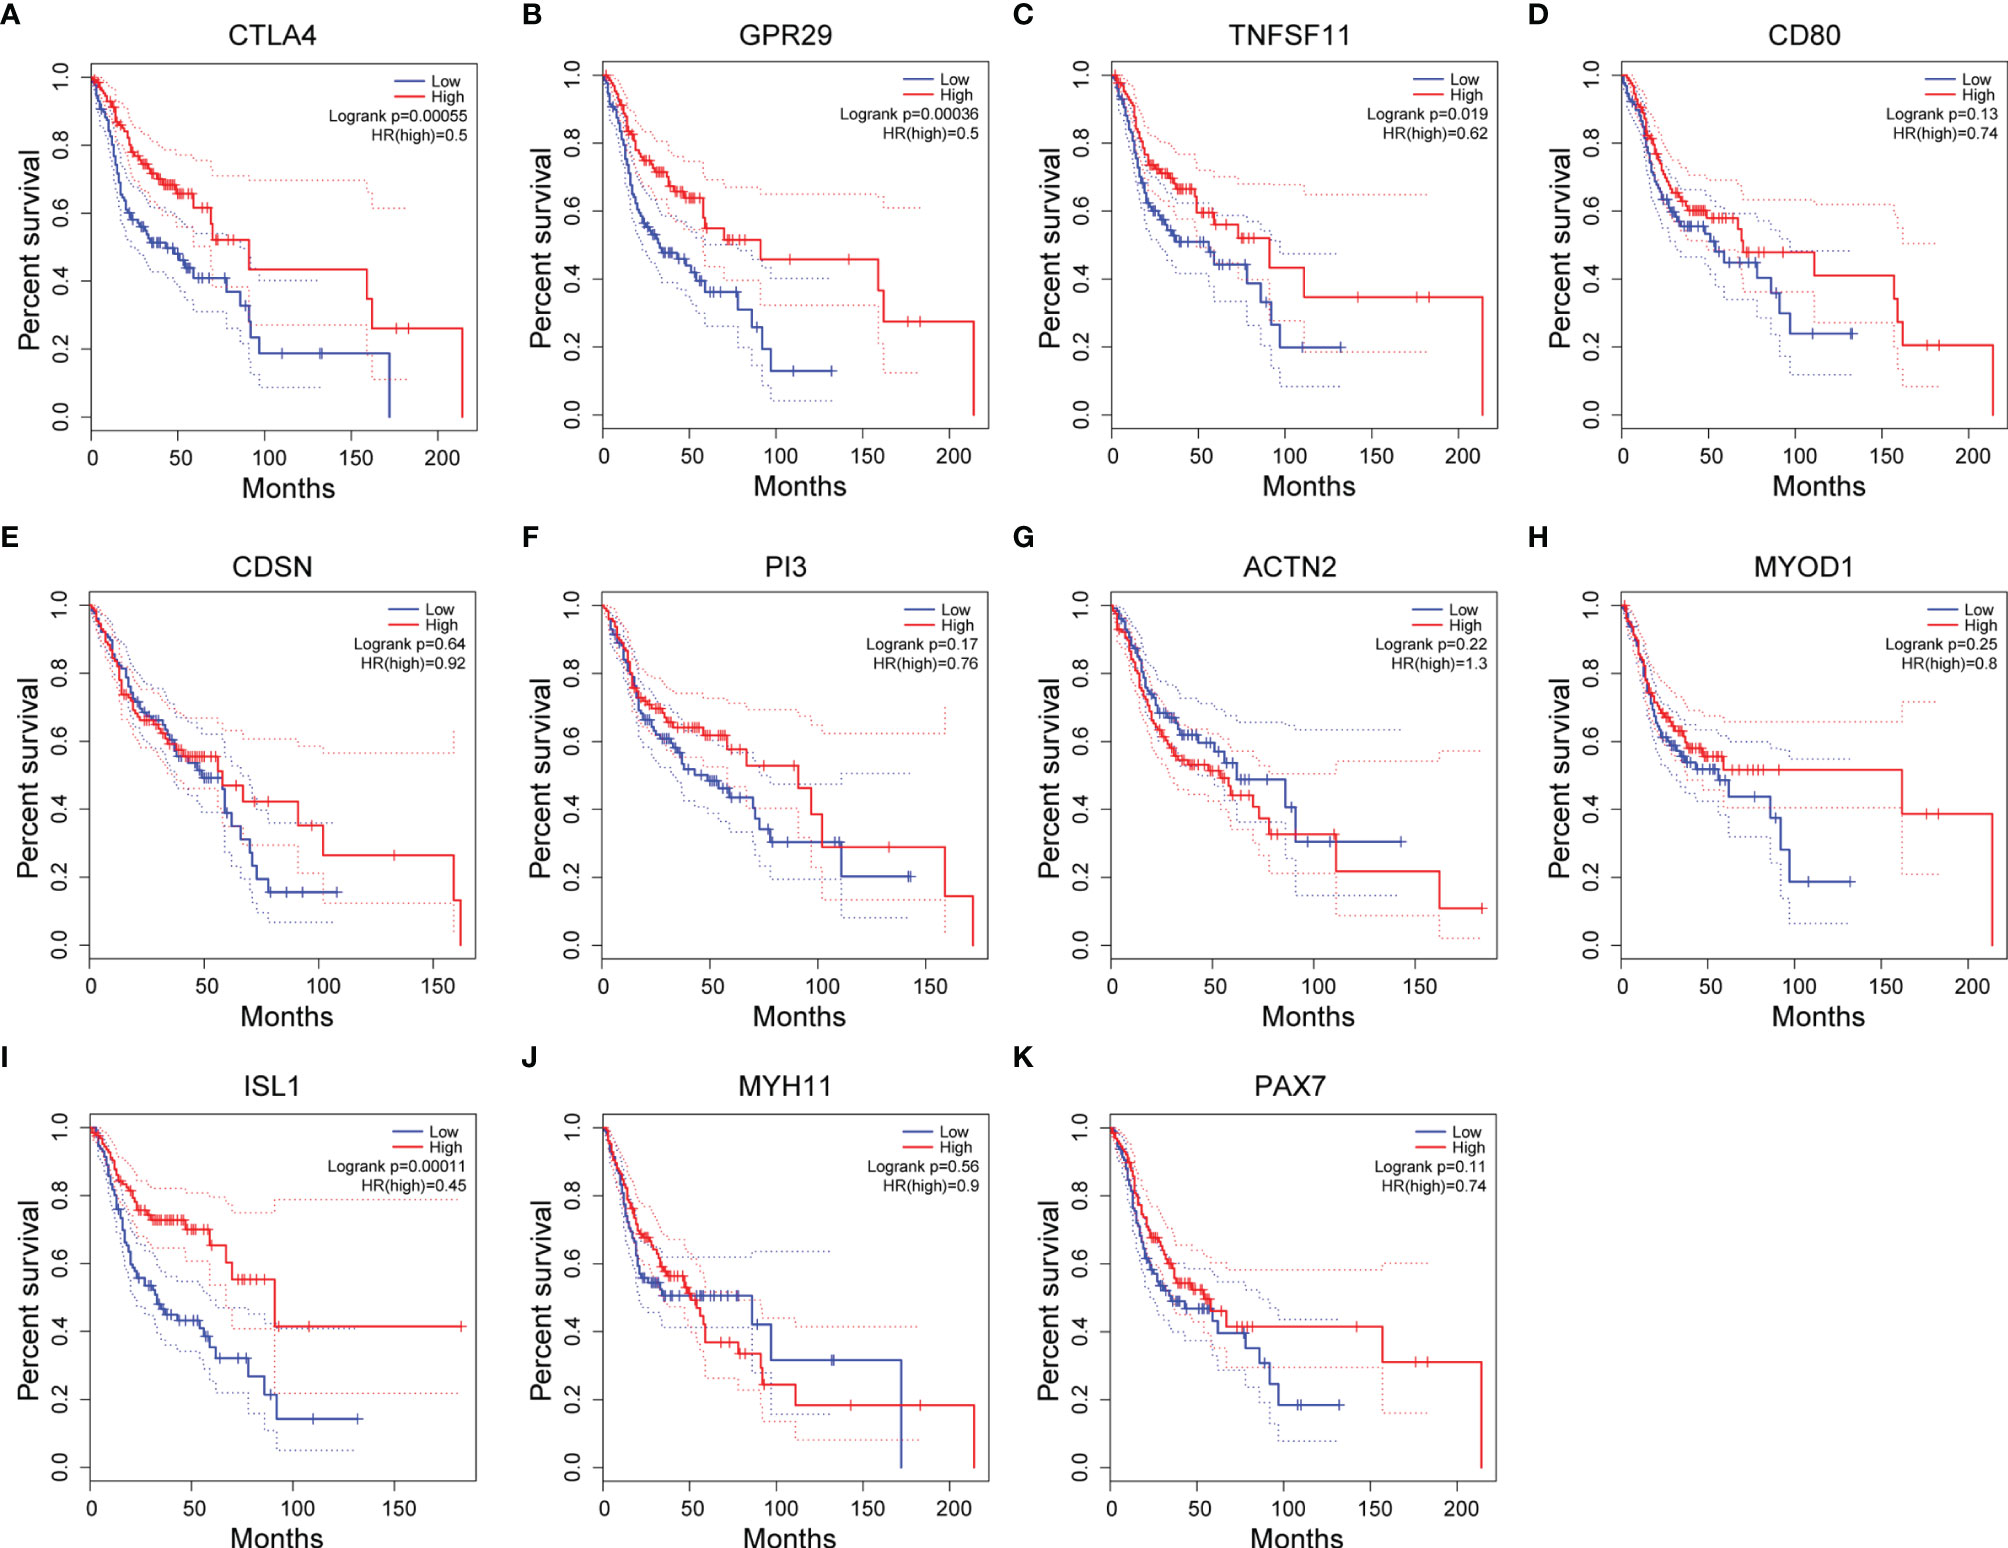
Figure 6 Associations between the expression level of hub genes and overall survival (OS) of HNSC patients. (A–K) Kaplan-Meier plots showing the OS of HNSC patients of 11 potential hub genes. Blue line: OS curve for patients with hub gene expression lower than the 25th percentile. Red line: OS curve for patients with hub gene expression higher than the 75th percentile.
Considering the fact that HNSC datasets were used in these analyses, it may provide more insights if OSCC datasets could be specifically classified in TCGA and GEPIA to allow reexamination of the prognostic value of these genes.
Discussion
The purpose of this study is to gain informative insights of the functional and clinically relevant profile of DNA methylation in OSCC. To achieve this goal, we took an integrated multi−omics approach to analyze the impact of DNA methylation on gene expression and biological pathways, then validated the association between the expression level of MeDEGs and the OS of HNSC patients in TCGA. Using this integrated approach, 226 DEGs with inverse corresponding DNA methylation changes and seven hub MeDEGs with potential clinical applications were identified. These findings may contribute to the understanding of the molecular mechanism as well as the development of potential DNA methylation biomarkers for OSCC.
There is strong evidence suggesting the involvement of aberrant DNA methylation in OSCC carcinogenesis. Compared to other epigenetic modification, DNA methylation attracts more attention since it is one of the earliest detectable neoplastic changes and is relatively reversible by chemical treatment. Microarray based methylomic evaluation provided a powerful tool for studying global changes of DNA methylation. To the best of our knowledge, eight groups have reported their studies identifying DNA methylation signatures in OSCC using a case−control study design, generating a sufficient amount of publicly available methylomic datasets (5, 9–15). Due to the inherent limitation of the high dimensionality of these huge data, an important question is how to select informative genes which are more biologically relevant to clinical outcomes and transfer these massive data into meaningful patterns with key genes and pathways. Recently, studies from two different groups have integrated transcriptomic and methylomic approaches to examine aberrant MeDEGs and their interrelationships in OSCC (16, 17). Since different inputs of publicly available datasets were used in these two studies, their findings barely overlap with each other. Therefore, more studies are needed to evaluate the power of this multi−omics approach and gain sufficient confidence for the key findings.
In our study, we generated RNA profiling from a stringently controlled collection of 17 paired samples of OSCC and NAT. These samples were similarly collected during the surgery procedure and immediately processed for RNA extraction to maximally preserve RNA integrity. A total of 778 upregulated genes and 2211 downregulated genes were identified through transcriptome analysis. Meanwhile, two methylation profiling GSE38532 and GSE46804, generated from same microarray platform and with similar paired case−control design, were obtained from public databases. Integrated multi−omics analysis revealed hypermethylation of 7.69% of under−expressed genes (170 of 2211) and hypomethylation of 7.20% of over−expressed genes (56 of 778) from these datasets. The finding that less than 10% DEGs are inversely associated with methylation modification is consistent with overall cancer associated MeDEGs from other studies (16, 27). The Illumina HumanMethylation 27 BeadChip covers 27,578 CpGs distributed genome−widely but specifically in proximal promoter regions. This supports the current knowledge of how DNA methylation regulates gene expression.
Our functional clustering analysis demonstrated that among all the DEGs, aberrant hypomethylation mainly occurs in genes involved in biological functions such as formation of the cornified envelope, extracellular matrix organization, anchoring fibril formation, regulation of cell adhesion, and intermediate filament cytoskeleton organization, all have been previously suggested to play roles in the development and progression of squamous cell carcinoma. Furthermore, hypomethylated MeDEGs are also enriched in the regulation of immune responses, including cellular response to bacterium, antimicrobial humoral response, and cytokine−mediated signaling pathway. This suggests the contribution of infective agents (such as previously reported HPV16 and Candida albicans) and immune dysfunction to OSCC, potentially through chronic inflammation related pathologies. For aberrantly hypermethylated DEGs, functions related to cell junction organization, regulation of membrane potential, and monocarboxylic acid metabolic process are observed to be enriched. Interestingly, multiple muscle related pathways like muscle system process, muscle structure development, muscle cell development, and muscle contraction are also found enriched. Therefore, consistent with previous reports, our study indicates that aberrant muscle function related cytoskeleton remodeling may assist the formation and progression of OSCC (28, 29). Other enriched functions like trans-synaptic signaling, regulation of ion transport, and phase I−functionalization of compounds is in agreement with our understanding that etiological factors like tobacco use, betel chewing, and alcohol consumption contribute to OSCC.
To understand the functional association among these MeDEGs, the PPI network of 56 upregulated MeDEGs and 170 downregulated MeDEGs were constructed using the STRING v11.0 database. Six highly connected hypomethylated genes (CTLA4, GPR29, TNFSF11, CD80, CDSN, and PI3) and five highly connected hypermethylated genes (ACTN2, MYOD1, ISL1, MYH11, and PAX7) were identified as hub genes from these networks. Hub genes are generally expected to play important roles in biological processes (30). Therefore, we further evaluated these hub genes for their correlations between observed dysregulation of DNA methylation and altered mRNA expression level in the TCGA database. Two hypomethylated hub gene (CTLA4 and CDSN) was found to be significantly upregulated, while two hypermethylated hub genes (ACTN2 and MYH11) showed obviously decreased expression level in the HNSC group. Therefore, our study identified four hub genes whose aberrant expressions were likely regulated by the mechanism of DNA methylation. Additionally, four hub genes showed important value in distinguishing the prognosis of HNSC patients. High expression levels of three individual hypomethylated hub genes (CTLA4, GPR29, and TNFSF11) presented a significant association with longer OS, while low expression of hypermethylated hub gene ISL1 was found to be clearly associated with shorter OS in HNSC patients. Therefore, these aberrantly methylated hub genes have potential diagnostic value and may become biomarkers and therapeutic targets for OSCC. Further studies with more specific OSCC datasets could provide more insights in the future.
CTLA4 (cytotoxic T-lymphocyte associated protein 4) is preferentially expressed in activated CD4+ T cells and constitutively expressed in CD4+Foxp3+ Treg cells (31, 32). It functions as a potent immune inhibitor by reducing the initiation of T-cell activation mediated by the interactions between antigen presenting cells (APCs) and T cells. Clinically, limiting CTLA4 function by antibody blockade was proved effective as a therapeutical approach to treat various cancers by the mechanism of boosting immune response against malignant tissues (33–36). In our study, we found that CTLA4 was not only significantly upregulated in patients with HNSC, but its high expression level was also associated with patients have better long-term survival. The median survival time was about 91 months for HNSC patients with high expression levels of CTLA4, compared with a median survival time of about 43 months for those patients with low expression levels of CTLA4. The beneficial effect of high expression of CTLA4 in HNSC, at first sight, seems contradictory to the well-known immune suppressive function, in other words, tumor−promoting role of CTLA4. However, the elevated expression of CTLA4 and beneficial effect of upregulated CTLA4 have also been previously noticed in other tumors (37, 38). To address the question of whether the upregulated CTLA4 in tumor tissues was originated from the increased immune infiltration, especially the infiltration of CTLA4 abundant CD4+ T cells, we estimated the abundances of six immune cell types (B cells, CD4+ T cells, CD8+ T cells, macrophages, neutrophils, and dendritic cells) in tumor and paired adjacent tissues by re−analyzing gene expression data using TIMER web tool (Supplementary Figure S1). Although the signals of certain immune cells were found higher in our OSCC samples (neutrophil and myeloid dendric cells) or TCGA HNSC samples (CD8+ T cell, neutrophil, and myeloid dendritic cells) compared to their corresponding NATs, the counts of CD4+ T cell infiltration were similar between tumor and paired adjacent tissues. Recently, a number of studies suggested that tumor cell-intrinsic CTLA4 might execute different functions, from inducing apoptosis to regulating cell proliferation, than that of T cells (39, 40). Here our results provide additional evidence that, depending on the context, the origin and the involvement of CTLA4 in tumorigenesis is complex.
We also identified two hypomethylated hub genes whose expression levels in tumor tissues showed positive association with the prognosis of HNSC patients, although their overall mRNA levels were not significantly changed in TCGA-HNSC samples compared to those in NATs. GPR29 (G−protein coupled receptor 29) is also known as CCR6 (CC chemokine receptor 6), a chemokine receptor that preferentially expressed by T cells, immature dendritic cells, and B cells. Its exclusive binding partner CCL20 (as known as macrophage inflammatory protein−3α, MIP-3α) is known to be steadily expressed by Th17 cells and secreted by intestinal epithelial cells as a response to local enteropathogenic infection (41). Therefore, CCL20−CCR6 axis plays crucial role in mucosal immunity. Apart from the immune-regulatory function, the elevated expression of CCR6 has been previously shown in various cancers, with complicated anti-cancer or pro-cancer potentials. TNFSF11 (tumor necrosis factor ligand superfamily member 11) is also known as receptor activator of nuclear factor kappa-B ligand (RANKL). It binds to its receptor RANK to regulate the differentiation, activation, and survival of osteoclast cells. While TNFSF11 is primarily known for its function in osteoclast regeneration, it has also been implicated in pathways like innate immune response, cell proliferation, and apoptosis. Here we report the first evidence that aberrant DNA methylation and aberrant expression level of TNFSF11 and GPR29 may play a role in the development of OSCC.
ISL1 (ISL LIM homeobox 1) is a LIM−homeodomain transcription factor. Aberrantly expressed ISL1 has been reported in various cancers, including gastric cancer, non-Hodgkin lymphoma, neuroblastoma, breast cancer, OSCC, etc. (42–44). Functionally, ISL1 has been implicated in many important biological pathways, such as tumorigenesis, cell invasion, apoptosis, and cancer immunity (42, 45). Although many studies indicated a tumor−promoting effect of elevated ISL1, Rajneesh et al. reported that hypermethylated and downregulated ISL1 was correlated with poorer survival in patients with breast cancer (46). In OSCC, Han et al. reported that ISL1 is significantly decreased and could be a potential biomarker of the disease (47). Consistently, in the present study, we identify the hypermethylated ISL1 as a key change in OSCC, indicating the prognostic value of ISL1 in OSCC.
Besides CTLA4, our study adds three additional hub genes with a significant and inverse correlation between the methylation pattern in promoter region and the mRNA expression level. The first one is ACTN2, for which the decreased expression level and elevated methylation status has already been reported in OSCC by another group (48). The second is MYH11, which encodes a myosin heavy chain family protein that is selectively expressed in smooth muscle. Similar to our observation, other studies have reported the downregulation of MYH11 in OSCC (49, 50). In colorectal cancer, survival analysis showed that low expression of MYH11 was significantly associated with poor prognosis (51, 52). Although the exact mechanism remains unclear, evidence suggests that the hypermethylation regulated interaction between DNMT3B and MYH11 may contribute to the tumor progression (53). The last is CDSN, which encodes corneodesmosin that is required for corneodesmosomes to maintain properly cornified squamous epithelia. Mutations in CDSN have been described in hereditary skin conditions such as hypotrichosis simplex of the scalp (HSS) and progressive loss of scalp hair (PSD) (54–57). In this study, we are the first to indicate hypomethylated and upregulated CDSN as a key change in OSCC.
Conclusion
This study analyzed MeDEGs in OSCC using integrated multi-omics analysis and examined their related pathways and functions. From the networks of upregulated and downregulated MeDEGs, we identified the four hub genes (CTLA4, GPR29, TNFSF11, and ISL1) that are highly correlated with the OS of HNSC patients. In addition, we also verified four hub genes (CTLA4, CDSN, ACTN2, and MYH11) that their expression levels in tumor tissue might be regulated by the mechanism of DNA methylation. Therefore, this study provides a list of potential biomarkers and therapy targets for OSCC, as well as insights for unraveling the molecular mechanisms underlying this disease. However, it is worth noting the limitation of these discoveries generated from purely computational approach. Further prospective validation is warranted to characterize the clinical utilities and underlying mechanisms of these genes.
Data Availability Statement
The datasets presented in this study can be found in online repositories. RNA sequencing data were available in NCBI GEO database (https://www.ncbi.nlm.nih.gov/geo; GSE186775). Microarray-based gene methylation profiling data set analyzed in this study are openly accessible in GEO database (https://www.ncbi.nlm.nih.gov/geo; GSE38532 and https://www.ncbi.nlm.nih.gov/geo; GSE46802).
Ethics Statement
The studies involving human participants were reviewed and approved by the Ethics Committee of School of Life Sciences, Central South University. The patients/participants provided their written informed consent to participate in this study.
Author Contributions
Conceptualization, ZW and DW. Methodology, ZW and DW. Software, ZW. Formal analysis, ZW. Investigation, ZW. Validation, ZW, XT, and DW. Resources, DW, HX, TS, and KX. Data curation, ZW. Writing—original draft preparation, ZW and DW. Writing—review and editing, ZW and DW. Visualization, ZW. Supervision, DW and KX. Project administration, ZW and DW. Funding acquisition, ZW and DW. All authors have read and agreed to the published version of the manuscript.
Funding
This work is funded by The Science and Technology Innovation Program of Hunan Province, grant number 2019SK2124 and 2020RC2070. The funders had no role in the design of the study; in the collection, analyses, or interpretation of data; in the writing of the manuscript, or in the decision to publish the results.
Conflict of Interest
The authors declare that the research was conducted in the absence of any commercial or financial relationships that could be construed as a potential conflict of interest.
Publisher’s Note
All claims expressed in this article are solely those of the authors and do not necessarily represent those of their affiliated organizations, or those of the publisher, the editors and the reviewers. Any product that may be evaluated in this article, or claim that may be made by its manufacturer, is not guaranteed or endorsed by the publisher.
Acknowledgments
The authors sincerely appreciate the reviewers’ critical suggestions and great help in improving the quality of the manuscript.
Supplementary Material
The Supplementary Material for this article can be found online at: https://www.frontiersin.org/articles/10.3389/fonc.2021.794146/full#supplementary-material
Supplementary Figure 1 | Immune infiltration estimation of tissue samples analyzed in this study. Immune infiltration of B cell (A), CD4+ T cell (B), CD8+ T cell (C), Neutrophil (D), Macrophage (E), and Myeloid dendritic cell (F) were evaluated using TIMER2.0 web server. TCGA-HNSC samples and paired NATs were obtained from TCGA-HNSC project. NAT: Normal Adjacent Tissue. Statistical difference was evaluated using Student’s t test with Welch correction. *p < 0.05, **p < 0.01, ***p < 0.001, ****p < 0.0001.
References
1. Sung H, Ferlay J, Siegel RL, Laversanne M, Soerjomataram I, Jemal A, et al. Global Cancer Statistics 2020: GLOBOCAN Estimates of Incidence and Mortality Worldwide for 36 Cancers in 185 Countries. CA Cancer J Clin (2021) 71(3):209–49. doi: 10.3322/caac.21660
2. Geum DH, Roh YC, Yoon SY, Kim HG, Lee JH, Song JM, et al. The Impact Factors on 5-Year Survival Rate in Patients Operated With Oral Cancer. J Korean Assoc Oral Maxillofac Surg (2013) 39(5):207–16. doi: 10.5125/jkaoms.2013.39.5.207
3. Tsai WC, Kung PT, Wang ST, Huang KH, Liu SA. Beneficial Impact of Multidisciplinary Team Management on the Survival in Different Stages of Oral Cavity Cancer Patients: Results of a Nationwide Cohort Study in Taiwan. Oral Oncol (2015) 51(2):105–11. doi: 10.1016/j.oraloncology.2014.11.006
4. Kumar M, Nanavati R, Modi TG, Dobariya C. Oral Cancer: Etiology and Risk Factors: A Review. J Cancer Res Ther (2016) 12(2):458–63. doi: 10.4103/0973-1482.186696
5. Basu B, Chakraborty J, Chandra A, Katarkar A, Baldevbhai JRK, Dhar Chowdhury D, et al. Genome-Wide DNA Methylation Profile Identified a Unique Set of Differentially Methylated Immune Genes in Oral Squamous Cell Carcinoma Patients in India. Clin Epigenet (2017) 9:13. doi: 10.1186/s13148-017-0314-x
6. Khor GH, Froemming GR, Zain RB, Abraham MT, Omar E, Tan SK, et al. DNA Methylation Profiling Revealed Promoter Hypermethylation-Induced Silencing of P16, DDAH2 and DUSP1 in Primary Oral Squamous Cell Carcinoma. Int J Med Sci (2013) 10(12):1727–39. doi: 10.7150/ijms.6884
7. Strzelczyk JK, Krakowczyk L, Owczarek AJ. Aberrant DNA Methylation of the P16, APC, MGMT, TIMP3 and CDH1 Gene Promoters in Tumours and the Surgical Margins of Patients With Oral Cavity Cancer. J Cancer (2018) 9(11):1896–904. doi: 10.7150/jca.24477
8. Kim SY, Han YK, Song JM, Lee CH, Kang K, Yi JM, et al. Aberrantly Hypermethylated Tumor Suppressor Genes Were Identified in Oral Squamous Cell Carcinoma (OSCC). Clin Epigenet (2019) 11(1):116. doi: 10.1186/s13148-019-0715-0
9. Guerrero-Preston R, Soudry E, Acero J, Orera M, Moreno-Lopez L, Macia-Colon G, et al. NID2 and HOXA9 Promoter Hypermethylation as Biomarkers for Prevention and Early Detection in Oral Cavity Squamous Cell Carcinoma Tissues and Saliva. Cancer Prev Res (Phila) (2011) 4(7):1061–72. doi: 10.1158/1940-6207.CAPR-11-0006
10. Langevin SM, Butler RA, Eliot M, Pawlita M, Maccani JZ, McClean MD, et al. Novel DNA Methylation Targets in Oral Rinse Samples Predict Survival of Patients With Oral Squamous Cell Carcinoma. Oral Oncol (2014) 50(11):1072–80. doi: 10.1016/j.oraloncology.2014.08.015
11. Li YF, Hsiao YH, Lai YH, Chen YC, Chen YJ, Chou JL, et al. DNA Methylation Profiles and Biomarkers of Oral Squamous Cell Carcinoma. Epigenetics (2015) 10(3):229–36. doi: 10.1080/15592294.2015.1006506
12. Nemeth CG, Rocken C, Siebert R, Wiltfang J, Ammerpohl O, Gassling V. Recurrent Chromosomal and Epigenetic Alterations in Oral Squamous Cell Carcinoma and Its Putative Premalignant Condition Oral Lichen Planus. PloS One (2019) 14(4):e0215055. doi: 10.1371/journal.pone.0215055
13. Pickering CR, Zhang J, Yoo SY, Bengtsson L, Moorthy S, Neskey DM, et al. Integrative Genomic Characterization of Oral Squamous Cell Carcinoma Identifies Frequent Somatic Drivers. Cancer Discov (2013) 3(7):770–81. doi: 10.1158/2159-8290.CD-12-0537
14. Sheu JJ, Lee CC, Hua CH, Li CI, Lai MT, Lee SC, et al. LRIG1 Modulates Aggressiveness of Head and Neck Cancers by Regulating EGFR-MAPK-SPHK1 Signaling and Extracellular Matrix Remodeling. Oncogene (2014) 33(11):1375–84. doi: 10.1038/onc.2013.98
15. Towle R, Truong D, Hogg K, Robinson WP, Poh CF, Garnis C. Global Analysis of DNA Methylation Changes During Progression of Oral Cancer. Oral Oncol (2013) 49(11):1033–42. doi: 10.1016/j.oraloncology.2013.08.005
16. Zhang X, Feng H, Li D, Liu S, Amizuka N, Li M. Identification of Differentially Expressed Genes Induced by Aberrant Methylation in Oral Squamous Cell Carcinomas Using Integrated Bioinformatic Analysis. Int J Mol Sci (2018) 19(6):1698. doi: 10.3390/ijms19061698
17. Zhao C, Zou H, Zhang J, Wang J, Liu H. An Integrated Methylation and Gene Expression Microarray Analysis Reveals Significant Prognostic Biomarkers in Oral Squamous Cell Carcinoma. Oncol Rep (2018) 40(5):2637–47. doi: 10.3892/or.2018.6702
18. Martino D, Joo JE, Sexton-Oates A, Dang T, Allen K, Saffery R, et al. Epigenome-Wide Association Study Reveals Longitudinally Stable DNA Methylation Differences in CD4+ T Cells From Children With IgE-Mediated Food Allergy. Epigenetics (2014) 9(7):998–1006. doi: 10.4161/epi.28945
19. Zhou Y, Zhou B, Pache L, Chang M, Khodabakhshi AH, Tanaseichuk O, et al. Metascape Provides a Biologist-Oriented Resource for the Analysis of Systems-Level Datasets. Nat Commun (2019) 10(1):1523. doi: 10.1038/s41467-019-09234-6
20. Liu X, Frost J, Bowcock A, Zhang W. Canonical and Interior Circular RNAs Function as Competing Endogenous RNAs in Psoriatic Skin. Int J Mol Sci (2021) 22(10):5182. doi: 10.3390/ijms22105182
21. Brohee S, van Helden J. Evaluation of Clustering Algorithms for Protein-Protein Interaction Networks. BMC Bioinf (2006) 7:488. doi: 10.1186/1471-2105-7-488
22. Wang X, Chai Z, Li Y, Long F, Hao Y, Pan G, et al. Identification of Potential Biomarkers for Anti-PD-1 Therapy in Melanoma by Weighted Correlation Network Analysis. Genes (Basel) (2020) 11(4):435. doi: 10.3390/genes11040435
23. Communal L, Roy N, Cahuzac M, Rahimi K, Kobel M, Provencher DM, et al. A Keratin 7 and E-Cadherin Signature Is Highly Predictive of Tubo-Ovarian High-Grade Serous Carcinoma Prognosis. Int J Mol Sci (2021) 22(10):5325. doi: 10.3390/ijms22105325
24. Li T, Fan J, Wang B, Traugh N, Chen Q, Liu JS, et al. TIMER: A Web Server for Comprehensive Analysis of Tumor-Infiltrating Immune Cells. Cancer Res (2017) 77(21):e108–e10. doi: 10.1158/0008-5472.CAN-17-0307
25. Li T, Fu J, Zeng Z, Cohen D, Li J, Chen Q, et al. TIMER2.0 for Analysis of Tumor-Infiltrating Immune Cells. Nucleic Acids Res (2020) 48(W1):W509–14. doi: 10.1093/nar/gkaa407
26. Zhang X, Feng H, Li Z, Li D, Liu S, Huang H, et al. Application of Weighted Gene Co-Expression Network Analysis to Identify Key Modules and Hub Genes in Oral Squamous Cell Carcinoma Tumorigenesis. Onco Targets Ther (2018) 11:6001–21. doi: 10.2147/OTT.S171791
27. Han B, Yang X, Zhang P, Zhang Y, Tu Y, He Z, et al. DNA Methylation Biomarkers for Nasopharyngeal Carcinoma. PloS One (2020) 15(4):e0230524. doi: 10.1371/journal.pone.0230524
28. Bhat KM, Setaluri V. Microtubule-Associated Proteins as Targets in Cancer Chemotherapy. Clin Cancer Res (2007) 13(10):2849–54. doi: 10.1158/1078-0432.CCR-06-3040
29. Pellegrini F, Budman DR. Review: Tubulin Function, Action of Antitubulin Drugs, and New Drug Development. Cancer Invest (2005) 23(3):264–73. doi: 10.1081/CNV-200055970
30. Hsing M, Byler KG, Cherkasov A. The Use of Gene Ontology Terms for Predicting Highly-Connected ’Hub’ Nodes in Protein-Protein Interaction Networks. BMC Syst Biol (2008) 2:80. doi: 10.1186/1752-0509-2-80
31. Chan DV, Gibson HM, Aufiero BM, Wilson AJ, Hafner MS, Mi QS, et al. Differential CTLA-4 Expression in Human CD4+ Versus CD8+ T Cells Is Associated With Increased NFAT1 and Inhibition of CD4+ Proliferation. Genes Immun (2014) 15(1):25–32. doi: 10.1038/gene.2013.57
32. Ha D, Tanaka A, Kibayashi T, Tanemura A, Sugiyama D, Wing JB, et al. Differential Control of Human Treg and Effector T Cells in Tumor Immunity by Fc-Engineered Anti-CTLA-4 Antibody. Proc Natl Acad Sci USA (2019) 116(2):609–18. doi: 10.1073/pnas.1812186116
33. Hellmann MD, Ciuleanu TE, Pluzanski A, Lee JS, Otterson GA, Audigier-Valette C, et al. Nivolumab Plus Ipilimumab in Lung Cancer With a High Tumor Mutational Burden. N Engl J Med (2018) 378(22):2093–104. doi: 10.1056/NEJMoa1801946
34. Motzer RJ, Tannir NM, McDermott DF, Aren Frontera O, Melichar B, Choueiri TK, et al. Nivolumab Plus Ipilimumab Versus Sunitinib in Advanced Renal-Cell Carcinoma. N Engl J Med (2018) 378(14):1277–90. doi: 10.1056/NEJMoa1712126
35. Perez-Ruiz E, Minute L, Otano I, Alvarez M, Ochoa MC, Belsue V, et al. Prophylactic TNF Blockade Uncouples Efficacy and Toxicity in Dual CTLA-4 and PD-1 Immunotherapy. Nature (2019) 569(7756):428–32. doi: 10.1038/s41586-019-1162-y
36. Wolchok JD, Chiarion-Sileni V, Gonzalez R, Rutkowski P, Grob JJ, Cowey CL, et al. Overall Survival With Combined Nivolumab and Ipilimumab in Advanced Melanoma. N Engl J Med (2017) 377(14):1345–56. doi: 10.1056/NEJMoa1709684
37. Liu JN, Kong XS, Huang T, Wang R, Li W, Chen QF. Clinical Implications of Aberrant PD-1 and CTLA4 Expression for Cancer Immunity and Prognosis: A Pan-Cancer Study. Front Immunol (2020) 11:2048. doi: 10.3389/fimmu.2020.02048
38. Antczak A, Pastuszak-Lewandoska D, Gorski P, Domanska D, Migdalska-Sek M, Czarnecka K, et al. Ctla-4 Expression and Polymorphisms in Lung Tissue of Patients With Diagnosed Non-Small-Cell Lung Cancer. BioMed Res Int (2013) 2013:576486. doi: 10.1155/2013/576486
39. Contardi E, Palmisano GL, Tazzari PL, Martelli AM, Fala F, Fabbi M, et al. CTLA-4 Is Constitutively Expressed on Tumor Cells and can Trigger Apoptosis Upon Ligand Interaction. Int J Cancer (2005) 117(4):538–50. doi: 10.1002/ijc.21155
40. Zhang H, Dutta P, Liu J, Sabri N, Song Y, Li WX, et al. Tumour Cell-Intrinsic CTLA4 Regulates PD-L1 Expression in Non-Small Cell Lung Cancer. J Cell Mol Med (2019) 23(1):535–42. doi: 10.1111/jcmm.13956
41. Meitei HT, Jadhav N, Lal G. CCR6-CCL20 Axis as a Therapeutic Target for Autoimmune Diseases. Autoimmun Rev (2021) 20(7):102846. doi: 10.1016/j.autrev.2021.102846
42. Li M, Sun C, Bu X, Que Y, Zhang L, Zhang Y, et al. ISL1 Promoted Tumorigenesis and EMT via Aurora Kinase A-Induced Activation of PI3K/AKT Signaling Pathway in Neuroblastoma. Cell Death Dis (2021) 12(6):620. doi: 10.1038/s41419-021-03894-3
43. Guo T, Bai YH, Cheng XJ, Han HB, Du H, Hu Y, et al. Insulin Gene Enhancer Protein 1 Mediates Glycolysis and Tumorigenesis of Gastric Cancer Through Regulating Glucose Transporter 4. Cancer Commun (Lond) (2021) 41(3):258–72. doi: 10.1002/cac2.12141
44. Zhang Q, Yang Z, Jia Z, Liu C, Guo C, Lu H, et al. ISL-1 Is Overexpressed in Non-Hodgkin Lymphoma and Promotes Lymphoma Cell Proliferation by Forming a P-STAT3/p-C-Jun/ISL-1 Complex. Mol Cancer (2014) 13:181. doi: 10.1186/1476-4598-13-181
45. Su T, Liu H, Zhang D, Xu G, Liu J, Evans SM, et al. LIM Homeodomain Transcription Factor Isl1 Affects Urethral Epithelium Differentiation and Apoptosis via Shh. Cell Death Dis (2019) 10(10):713. doi: 10.1038/s41419-019-1952-z
46. Pathania R, Ramachandran S, Elangovan S, Padia R, Yang P, Cinghu S, et al. DNMT1 Is Essential for Mammary and Cancer Stem Cell Maintenance and Tumorigenesis. Nat Commun (2015) 6:6910. doi: 10.1038/ncomms7910
47. Ding Y, Liu P, Zhang S, Tao L, Han J. Screening Pathogenic Genes in Oral Squamous Cell Carcinoma Based on the mRNA Expression Microarray Data. Int J Mol Med (2018) 41(6):3597–603. doi: 10.3892/ijmm.2018.3514
48. Dai Y, Lv Q, Qi T, Qu J, Ni H, Liao Y, et al. Identification of Hub Methylated-CpG Sites and Associated Genes in Oral Squamous Cell Carcinoma. Cancer Med (2020) 9(9):3174–87. doi: 10.1002/cam4.2969
49. Amiri-Dashatan N, Koushki M, Jalilian A, Ahmadi NA, Rezaei-Tavirani M. Integrated Bioinformatics Analysis of mRNAs and miRNAs Identified Potential Biomarkers of Oral Squamous Cell Carcinoma. Asian Pac J Cancer Prev (2020) 21(6):1841–8. doi: 10.31557/APJCP.2020.21.6.1841
50. Islam T, Rahman R, Gov E, Turanli B, Gulfidan G, Haque A, et al. Drug Targeting and Biomarkers in Head and Neck Cancers: Insights From Systems Biology Analyses. OMICS (2018) 22(6):422–36. doi: 10.1089/omi.2018.0048
51. Alhopuro P, Phichith D, Tuupanen S, Sammalkorpi H, Nybondas M, Saharinen J, et al. Unregulated Smooth-Muscle Myosin in Human Intestinal Neoplasia. Proc Natl Acad Sci USA (2008) 105(14):5513–8. doi: 10.1073/pnas.0801213105
52. Wang RJ, Wu P, Cai GX, Wang ZM, Xu Y, Peng JJ, et al. Down-Regulated MYH11 Expression Correlates With Poor Prognosis in Stage II and III Colorectal Cancer. Asian Pac J Cancer Prev (2014) 15(17):7223–8. doi: 10.7314/APJCP.2014.15.17.7223
53. Wang J, Xu P, Hao Y, Yu T, Liu L, Song Y, et al. Interaction Between DNMT3B and MYH11 via Hypermethylation Regulates Gastric Cancer Progression. BMC Cancer (2021) 21(1):914. doi: 10.1186/s12885-021-08653-3
54. Davalos NO, Garcia-Vargas A, Pforr J, Davalos IP, Picos-Cardenas VJ, Garcia-Cruz D, et al. A Non-Sense Mutation in the Corneodesmosin Gene in a Mexican Family With Hypotrichosis Simplex of the Scalp. Br J Dermatol (2005) 153(6):1216–9. doi: 10.1111/j.1365-2133.2005.06958.x
55. Levy-Nissenbaum E, Betz RC, Frydman M, Simon M, Lahat H, Bakhan T, et al. Hypotrichosis Simplex of the Scalp Is Associated With Nonsense Mutations in CDSN Encoding Corneodesmosin. Nat Genet (2003) 34(2):151–3. doi: 10.1038/ng1163
56. van der Velden J, van Geel M, Engelhart JJ, Jonkman MF, Steijlen PM. Mutations in the CDSN Gene Cause Peeling Skin Disease and Hypotrichosis Simplex of the Scalp. J Dermatol (2020) 47(1):3–7. doi: 10.1111/1346-8138.15136
Keywords: oral squamous cell carcinoma, multi-omics, DEGs, DMGs, MeDEGs
Citation: Wan Z, Xiong H, Tan X, Su T, Xia K and Wang D (2022) Integrative Multi−Omics Analysis Reveals Candidate Biomarkers for Oral Squamous Cell Carcinoma. Front. Oncol. 11:794146. doi: 10.3389/fonc.2021.794146
Received: 13 October 2021; Accepted: 17 December 2021;
Published: 14 January 2022.
Edited by:
Amanda Psyrri, University General Hospital Attikon, GreeceReviewed by:
Heather Walline, University of Michigan, United StatesXiangqian Guo, Henan University, China
Copyright © 2022 Wan, Xiong, Tan, Su, Xia and Wang. This is an open-access article distributed under the terms of the Creative Commons Attribution License (CC BY). The use, distribution or reproduction in other forums is permitted, provided the original author(s) and the copyright owner(s) are credited and that the original publication in this journal is cited, in accordance with accepted academic practice. No use, distribution or reproduction is permitted which does not comply with these terms.
*Correspondence: Danling Wang, ZGFubGluZ3dhbmdAdXNjLmVkdS5jbg==