 Chaoxu Liu
 Jin Zhou†
 Cai Chang
 Wenxiang Zhi
- Department of Ultrasonography, Fudan University Shanghai Cancer Center, Shanghai Medical College, Fudan University, Shanghai, China
Objective: To explore the feasibility of shear wave elastography (SWE) parameters for assessing the biological behavior of breast cancer.
Materials and Methods: In this prospective study, 224 breast cancer lesions in 216 female patients were examined by B-mode ultrasound and shear wave elastography in sequence. The maximum size (Smax) of the lesion was measured by B-mode ultrasound, and then shear wave elastography was performed on this section to obtain relevant parameters, including maximum elasticity (Emax), mean elasticity (Emean), standard deviation of elasticity (SD), and the area ratio of shear wave elastography to B-mode ultrasound (AR). The relationship between SWE parameters and pathological type, histopathological classification, histological grade, lymphovascular invasion status (LVI), axillary lymph node status (ALN), and immunohistochemistry of breast cancer lesions was performed according to postoperative pathology.
Results: In the univariate analysis, the pathological type and histopathological classification of breast cancer were not significantly associated with SWE parameters; with an increase in the histological grade of invasive ductal carcinoma (IDC), SD (p = 0.016) and Smax (p = 0.000) values increased. In the ALN-positive group, Smax (p = 0.004) was significantly greater than in the ALN-negative group; Smax (p = 0.003), Emax (p = 0.034), and SD (p = 0.045) were significantly higher in the LVI-positive group than in the LVI-negative group; SD (p = 0.043, p = 0.047) and Smax (p = 0.000, p = 0.000) were significantly lower in the ER+ and PR+ groups than in the ER- and PR- groups, respectively; AR (p = 0.032) was significantly higher in the ER+ groups than in the ER- groups, and Smax (p = 0.002) of the HER2+ group showed higher values than that of the HER2- group; Smax (p = 0.000), SD (p = 0.006), and Emax (p = 0.004) of the Ki-67 high-expression group showed significantly higher values than those of the Ki-67 low-expression group. In the multivariate analysis, Ki-67 was an independent factor of Smax (p = 0.005), Emax (p = 0.004), and SD (p = 0.006); ER was an independent influencing factor of Smax (p = 0.000) and AR (p = 0.032). LVI independently influences Smax (p = 0.006).
Conclusions: The SWE parameters Emax, SD, and AR can be used to evaluate the biological behavior of breast cancer.
Introduction
Breast cancer is one of the most common cancers, and the mortality rate of breast cancer ranks first among women (1). Predicting the prognosis of breast cancer preoperatively can aid in understanding the disease course and guiding treatment. The pathological type, histopathological classification, histological grade, axillary lymph node status (ALN), lymphovascular invasion status (LVI), and immunohistochemical factors such as estrogen receptor (ER) and progesterone receptor (PR), human epidermal growth factor receptor 2 (HER2), and the Ki-67 proliferation index affect the prognosis of breast cancer (2–5), and these methods of evaluating the breast cancer prognosis are obtained invasively via biopsy. Therefore, noninvasive methods to assess the prognosis of breast cancer are urgently needed. Shear wave elastography (SWE) imaging is a recently emerging elastography technology, which can qualitatively and quantitatively differentiate between malignant and benign foci, and its clinical value has been widely recognized (6–9). As quantitative parameters of SWE, the maximum elasticity (Emax), standard deviation of elasticity (SD), and mean elasticity (Emean) can quantitatively reflect the tissue hardness of the lesion, and the relationship between these parameters and patient clinicopathological characteristics has attracted considerable clinical attention (10). Determining whether these parameters can be used to quantitatively evaluate the biological behavior of breast cancer has been a major research focus in recent years (11, 12).
Kim’s research results showed that tumors with higher Emax and Emean values were found to exhibit poor pathological differentiation (13). Huang et al. concluded that SD can reflect the heterogeneity of tumors and can be used to distinguish benign from malignant lesions. The SD of malignant tumors was found to be relatively high (14). Our research revealed that in addition to the higher Emax values of malignant foci, the elastic areas of some foci were larger than the B-mode areas. Does the hardness of the tissues surrounding the lesion change earlier than the morphology of the lesion? In Leong’s study, it was mentioned that the area ratio of shear wave elastography to B-mode ultrasound (AR) is helpful for identifying benign and malignant breast foci (15), but the clinicopathological characteristics of AR in different malignant foci were not discussed. In view of the fact that there are few studies in this area, we aim to explore the distribution characteristics and influencing factors of AR in different breast cancer types in our research. We also intend to explore the relationships between the SWE parameters and the clinicopathological characteristics of breast cancer patients to clarify the feasibility of using SWE parameters to predict the biological behavior of breast cancer preoperatively.
Materials and Methods
Patients
Our research obtained approval from the Shanghai Cancer Center Institutional Review Board, and all patients in this prospective study provided written informed consent. This work was conducted from January 2019 to December 2019 at Fudan University Shanghai Cancer Center (FUSCC). We prospectively recruited 354 breast patients with 362 breast foci for B-mode ultrasound (US) and SWE during this period. The maximum diameter of the collected breast lesions was less than or equal to 30 mm. Compared with postoperative and biopsy pathologies, 116 benign breast lesions were excluded. Another 22 breast patients were excluded for the reasons as follows: 7 lesions in 7 patients showed artifacts because of tumor prominence from the skin surface; 10 breast lesions in 10 patients were located beside or behind the nipple, which causes inaccuracy in elastography imaging; and 5 patients were lost to follow-up. Therefore, a total of 224 breast cancer foci from 216 patients were ultimately included.
B-Mode Ultrasound and Shear Wave Elastography Examinations
B-mode US and SWE were performed by a Supersonic Aixplorer color Doppler ultrasound diagnostic apparatus (Supersonic Imagine, Aix en Provence, France) and which was equipped with an SL 15-4 MHz linear array transducer, and all imaging was collected by 2 sonographers with 5 and 10 years of working experience in breast US. In this study, the largest section of the lesion was selected to measure Smax in B-mode US examination. Then, the mode was switched to SWE for the largest section of the lesion to obtain the SWE image. The sampling frame was placed to contain the entire section of the lesion. The transducer remained relatively fixed for approximately 5 s without applying pressure to the lesion until the SWE image was stable and no artifacts were observed, and then the SWE image was obtained. Regions of interest (ROIs) were acquired respectively in shear wave elastography and B-mode ultrasound by drawing the outline of the border of the lesion to exactly include the lesion without breast tissue around the lesion. Emax value, Emean value, and SD value of the entire lesion in the SWE image were generated automatically by the US system, as well as the area of the lesion in the B-mode US image and the area of the lesion in the SWE image, and then AR was calculated by dividing the area of SWE by the area of B-mode US. Each of the lesions was continuously obtained three times for three images, and then average values of three images were calculated to obtain the final results of the SWE parameters.
Pathologic Analysis
The pathological evaluation parameters included ER and PR status, HER2 status, Ki-67 proliferation index, LVI status, ALN status, pathological type, histopathological classification, and histological grade. Histological grading was determined by the Nottingham grading system (16). The modified American Society of Clinical Oncology-College of American Physicians scoring guidelines were used (17, 18). Positive ER and PR status was ruled as ≥1% of tumor cells with positive nuclear staining. On the basis of standard criteria, the immunohistochemical staining of HER2 was scored as 0, 1+, 2+, and 3+. A score of 3+ was classified as HER2 positive, and a score of 0 and 1+ was classified as negative. There was another situation where tumors had a score of 2+, fluorescence in situ hybridization testing (FISH) was performed to identify the amplification of HER2, and a positive FISH amplification was defined to be HER2 positive. The cells with Ki-67 nuclear-stained were defined to be positively stained. Based on this criterion, the Ki-67 proliferation index was defined as the percentage of cells that were Ki-67-positive in greater than or equal to 500 tumor cells in the hot spot of each slide. High Ki-67 index expression was ruled as ≥14%, and low Ki-67 index expression was ruled as <14% (19). ALN positivity refers to axillary lymph node metastasis. LVI positivity was defined as the existence of cancer cells in the lymphatic and/or blood vessels in or around the tumor. Two senior physicians pathologically diagnosed the lesions, and a consensus was reached through discussion when disagreements occurred.
Statistical Analysis
The Statistical Package for the Social Sciences for Windows (SPSS, Chicago, IL, USA, version 23.0) was used to perform all statistical analyses. A simple linear regression model was used to analyze the relationship between the SWE parameters and clinicopathological parameters. Stepwise multiple linear regression analysis was used to determine the pathological parameters independently related to the SWE parameters. A p-value < 0.05 was considered statistically significant.
Results
Clinical Characteristics
The average age of the 216 breast cancer patients was 53.7 ± 10.6 years (range 28–79 years), the average size of the 224 foci was 17.6 ± 5.7 mm (range 5.0–30.0 mm), and the average values of the SWE parameters were as follows: Emax 190.4 ± 84.1 kPa (range 12.0–300.0 kPa), Emean 61.8 ± 29.3 kPa (range 4.0–169.5 kPa), SD 38.7 ± 20.5 kPa (range 2.6–87.9 kPa), and AR 1.97 ± 0.79 (range 0.82–8.05), and the AR values of all lesions were higher than 1 except for one lesion, which was 0.82 (Figures 1–3). The B-mode US and SWE parameters of the lesions are listed in (Figure 4).
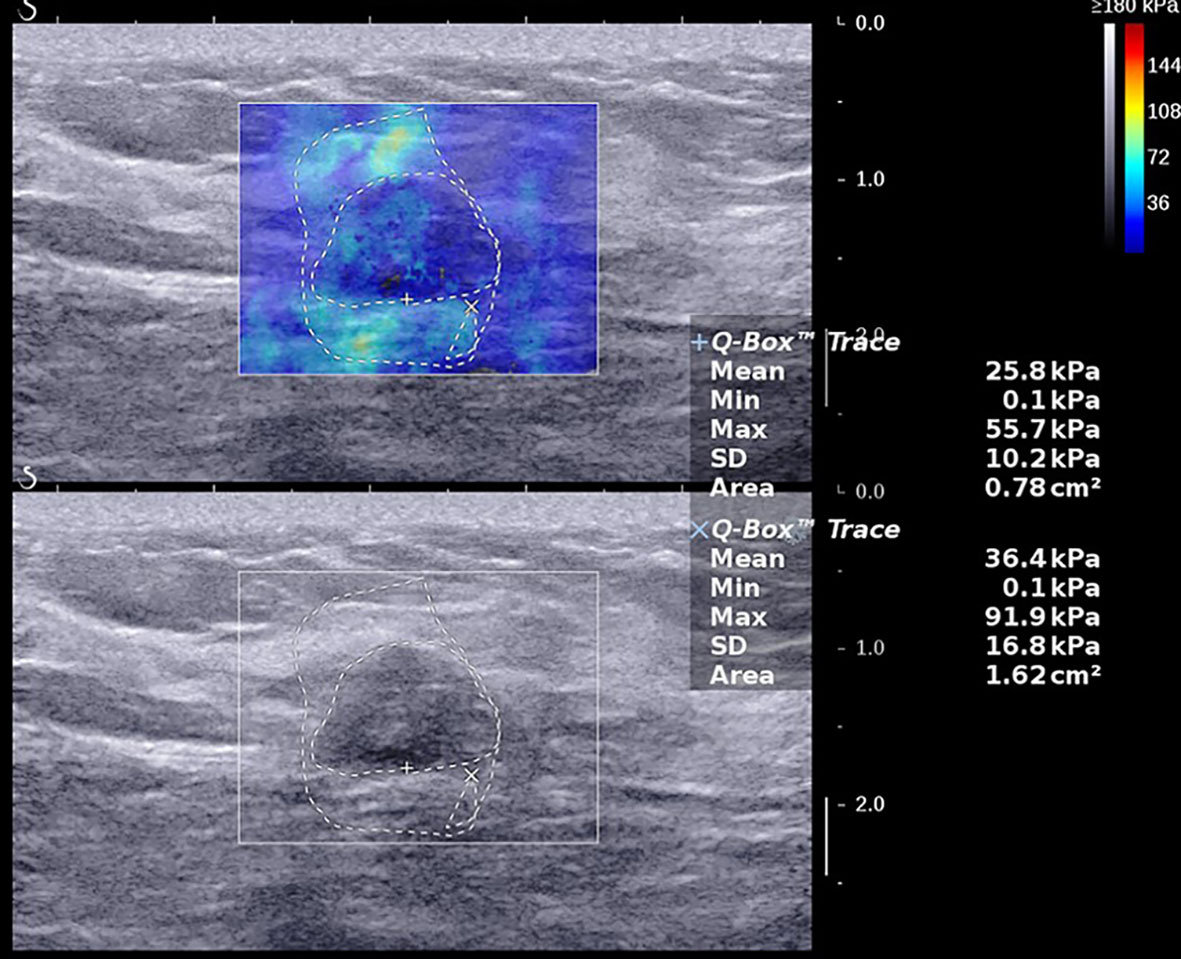
Figure 1 A 47-year-old female with a 14.0-mm lesion in the right breast. A freehand ROI was drawn manually to measure areas by drawing the outline of the border of the lesion respectively in shear wave elastography and B-mode ultrasound. The SWE values of the lesion were as follows: Emax, 137.9 kPa; Emean, 44.4 kPa; SD, 27.2 kPa; AR, 2.29. The lesion was invasive ductal carcinoma with the histological grade II, showing negative lymphovascular invasion and negative axillary lymph node status, ER+ and PR+, HER2-, and low expression of Ki-67, 10%.
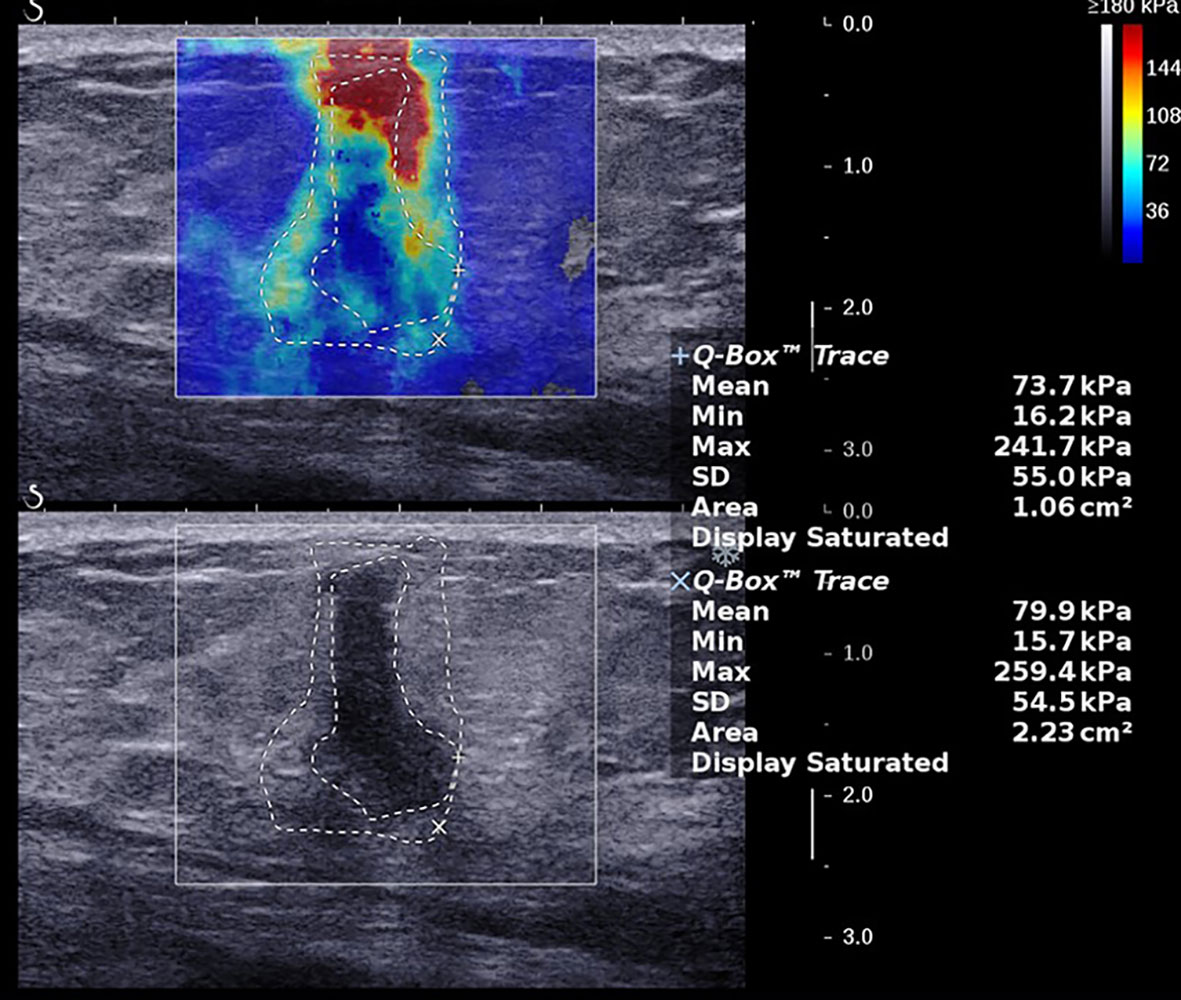
Figure 2 A 57-year-old female with a 15.0-mm lesion in the left breast. The SWE parameter values of the cancer were as follows: Emax, 261.5 kPa; Emean, 82.4 kPa; SD, 54.2 kPa; AR, 1.95. The lesion was invasive ductal carcinoma with the histological grade II, showing negative lymphovascular invasion and negative axillary lymph node status, ER- and PR-, HER2+, and high expression of Ki-67, 15%.
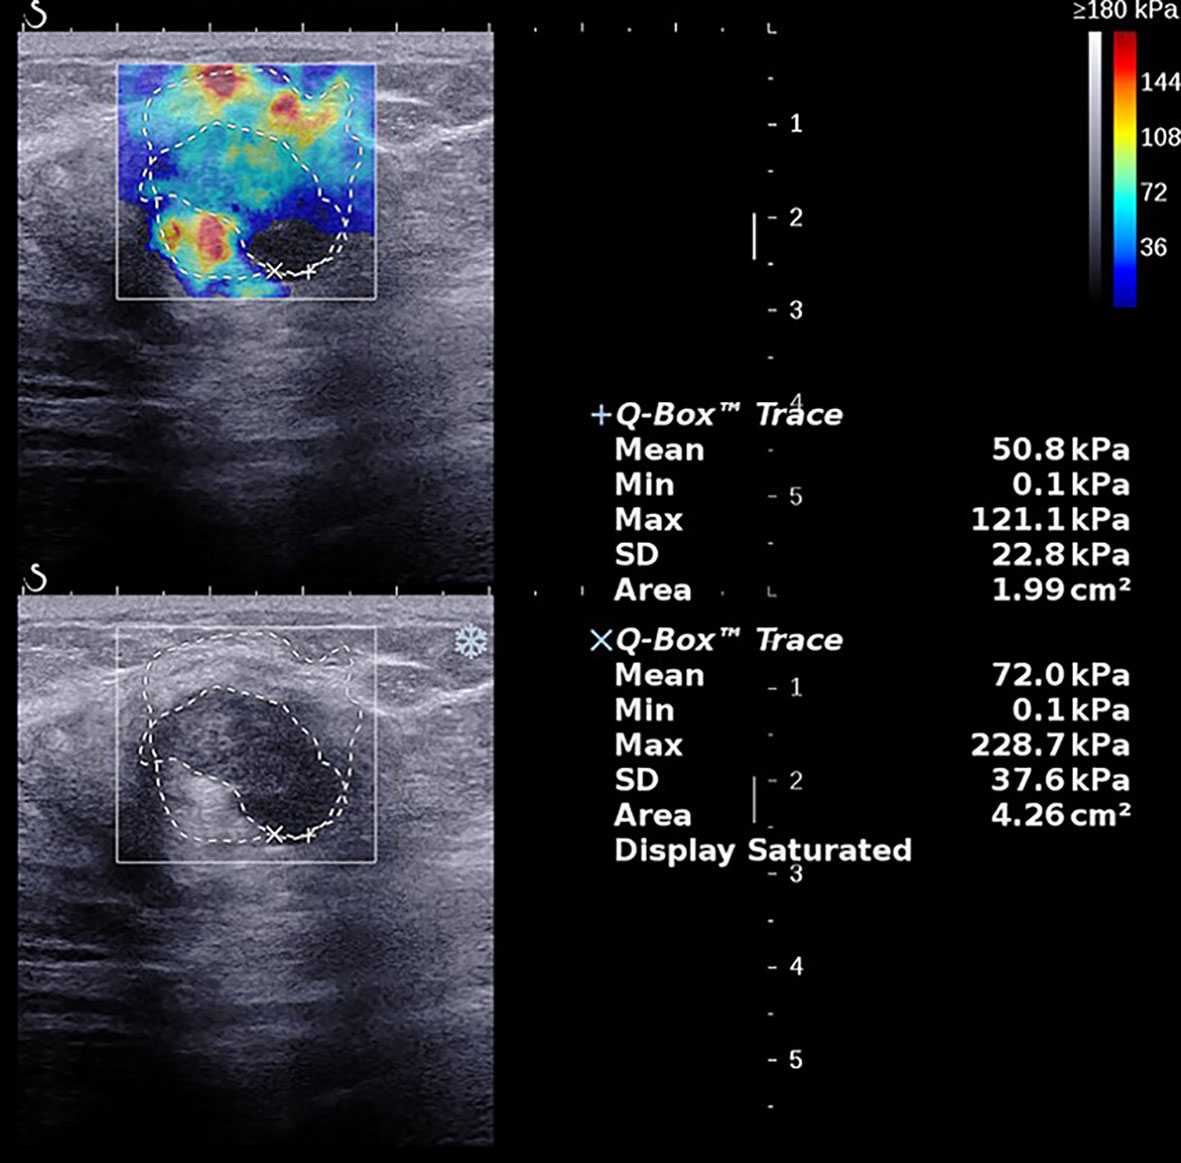
Figure 3 A 62-year-old female with a 28.0-mm lesion in the left breast. The SWE parameter values of the cancer were as follows: Emax, 236.0 kPa; Emean, 69.3 kPa; SD, 41.5 kPa; AR, 2.02. The lesion was invasive ductal carcinoma with the histological grade III, showing negative lymphovascular invasion and negative axillary lymph node status, ER- and PR-, HER2-, and high expression of Ki-67, 60%.
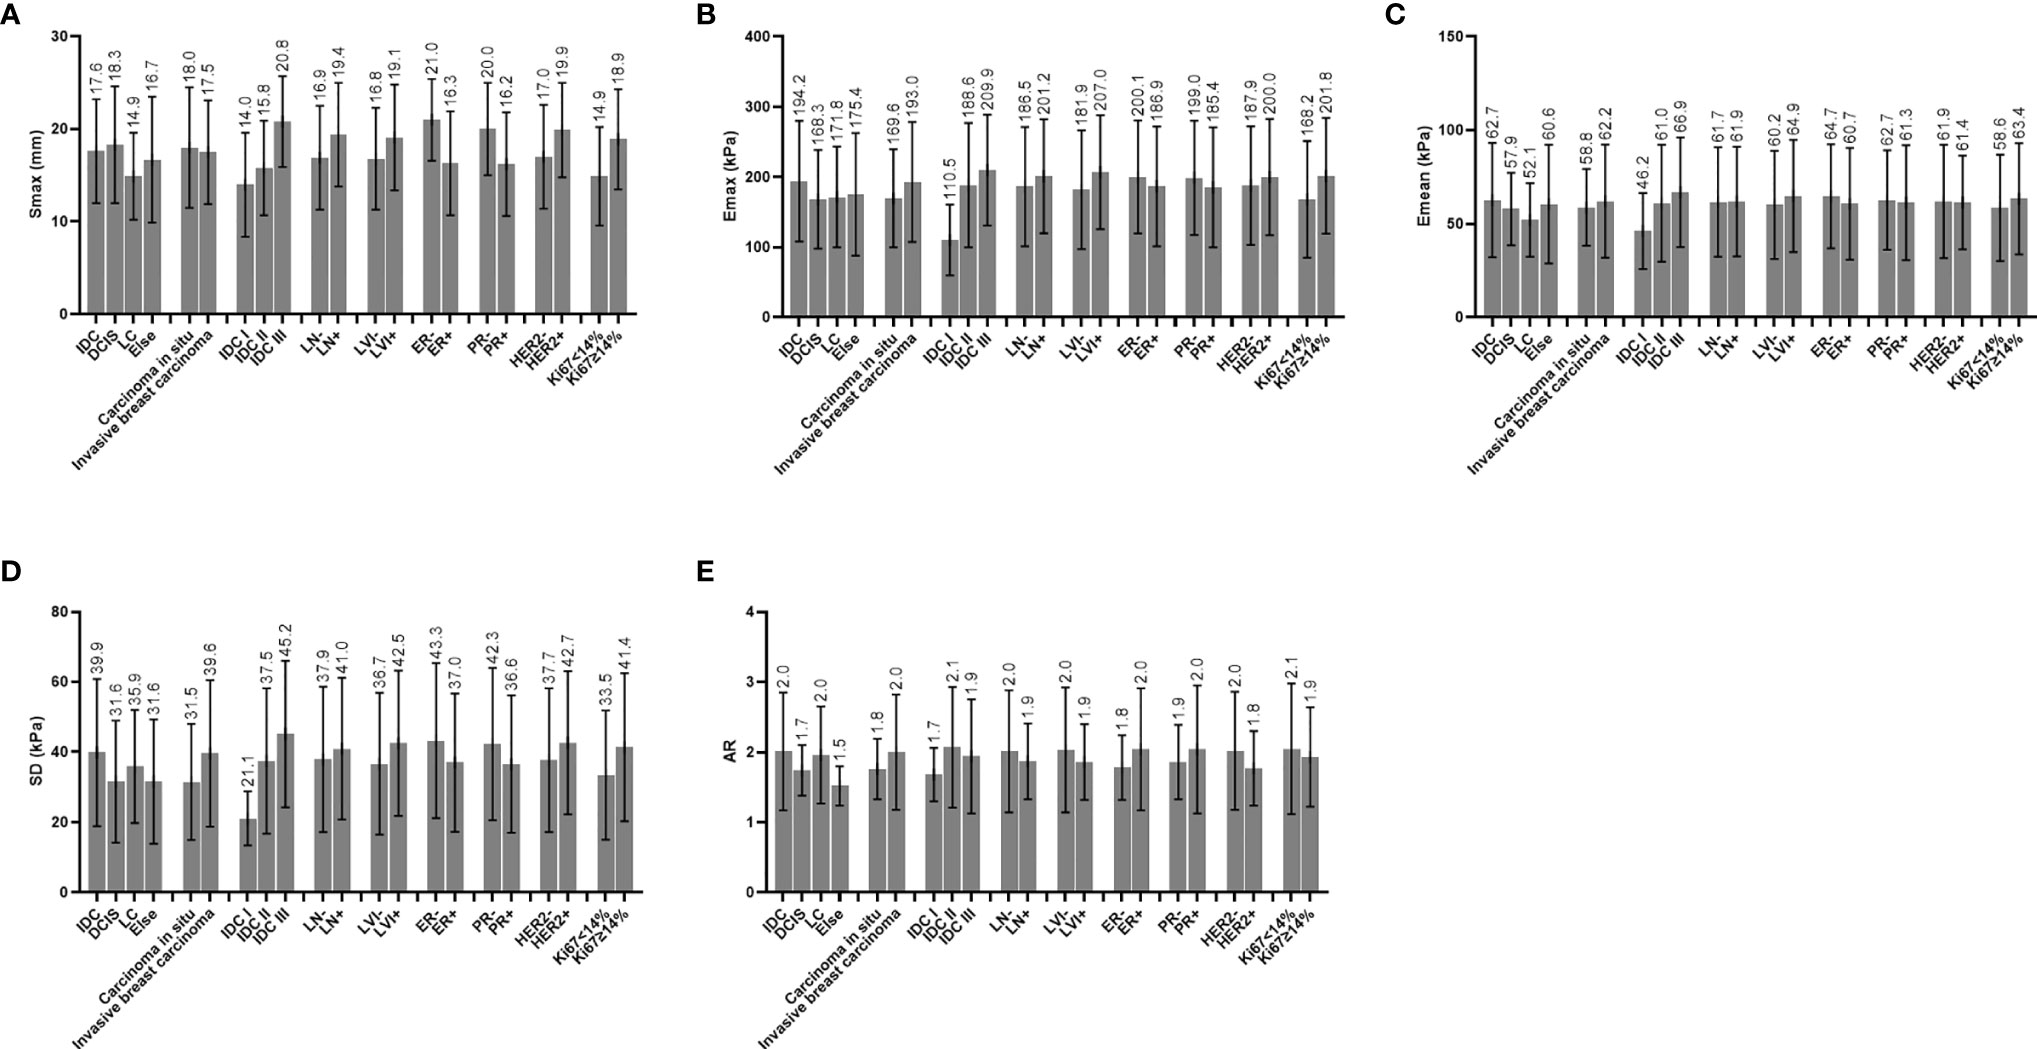
Figure 4 (A) Distribution characteristics of Smax between different groups. (B) Distribution characteristics of Emax between different groups. (C) Distribution characteristics of Emean between different groups. (D) Distribution characteristics of SD between different groups. (E) Distribution characteristics of AR between different groups; IDC, invasive ductal carcinoma; DCIS, ductal carcinoma in situ; LC, lobular carcinoma; ALN, axillary lymph node status; LVI, lymphovascular invasion; ER, estrogen receptor; PR, progesterone receptor; HER2, human epidermal growth factor receptor 2; Ki67, Ki67 index; Smax, maximal size; Emax, maximal elasticity; Emean, mean elasticity; SD, standard deviation of elasticity; AR, area ratio of shear wave elastography to B-mode ultrasound.
A total of 224 breast cancer foci were observed among 216 breast cancer patients. The pathological types of cancers included 188 lesions of invasive ductal carcinomas (IDC), 21 lesions of ductal carcinomas in situ (DCIS), 7 lesions of invasive lobular breast carcinomas (ILC), 1 lesion of lobular carcinoma in situ, 3 lesions of intraductal papillary carcinomas, 1 lesion of solid intraductal papillary carcinoma with interstitial infiltration, 2 lesions of mucinous adenocarcinomas, and 1 lesion of invasive carcinoma with mucus secretion.
Simple Linear Regression Analysis of the Correlation between SWE Parameters and Clinicopathological Parameters
Pathological Type, Histopathological Classification, and Histological Grade
In this study, pathological type had no correlation with SWE parameters (Table 1). On histopathological classification, there were 199 cases of invasive breast cancer and 25 cases of cancer in situ. The Emax (p = 0.190) and SD (p = 0.062) values of the invasive breast cancer group were higher than those of the cancer in situ group, but no significant differences were observed (Table 1).
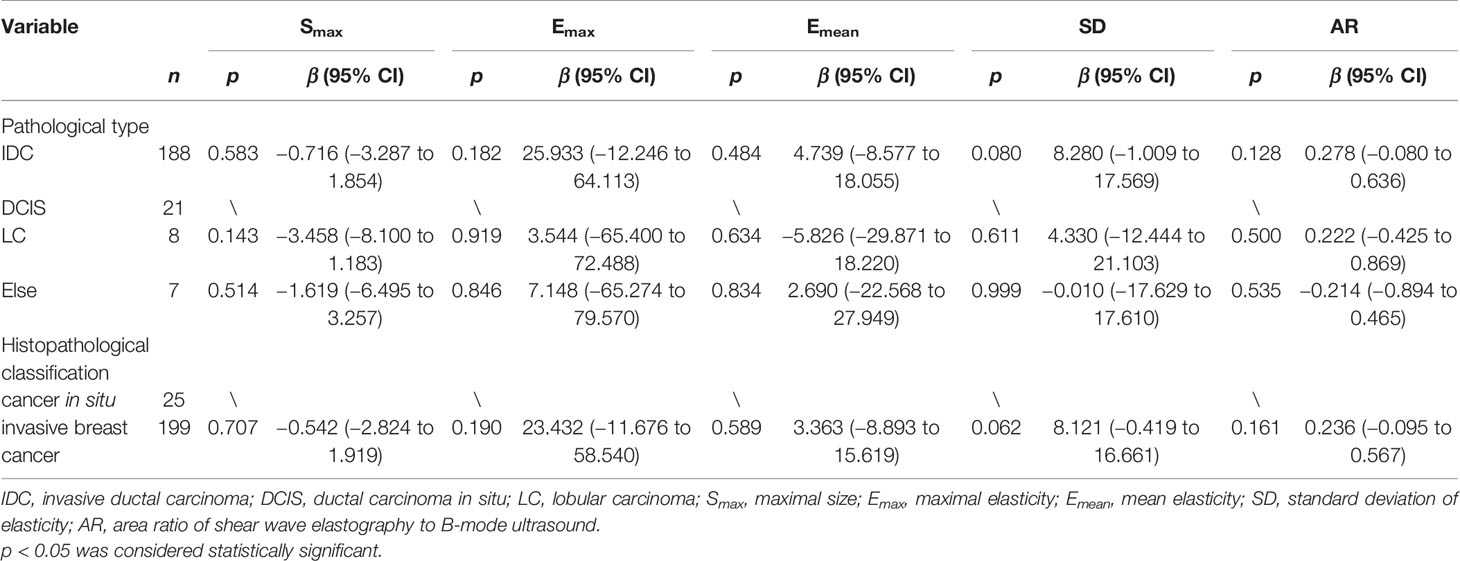
Table 1 Univariate analysis of correlation of pathological type and histopathological classification with B-mode ultrasound and shear wave elastography parameters.
Since most of the breast cancer cases in this research were IDC and there were fewer other pathological types of breast cancers, IDC cases were chosen to be analyzed for the relationship between histological grade and SWE parameters. In this study, there were 188 cases of IDC (including 1 case with missing histological grading information), including 4 cases of IDC-I, 115 cases of IDC-II, and 68 cases of IDC-III. Although the Emax (p = 0.072), Emean (p = 0.339), and SD (p = 0.119) values were not significantly different between IDC-I and IDC-II, the average values of these parameters in the IDC-II group was greater than those in the IDC-I group. Smax (p = 0.000) and SD (p = 0.016) of the IDC-III group showed significantly greater values than those of the IDC-II group. The Smax (p = 0.010), Emax (p = 0.024), and SD (p = 0.024) in the group of IDC-III showed significantly higher values than those in the group of IDC-I (Table 2).
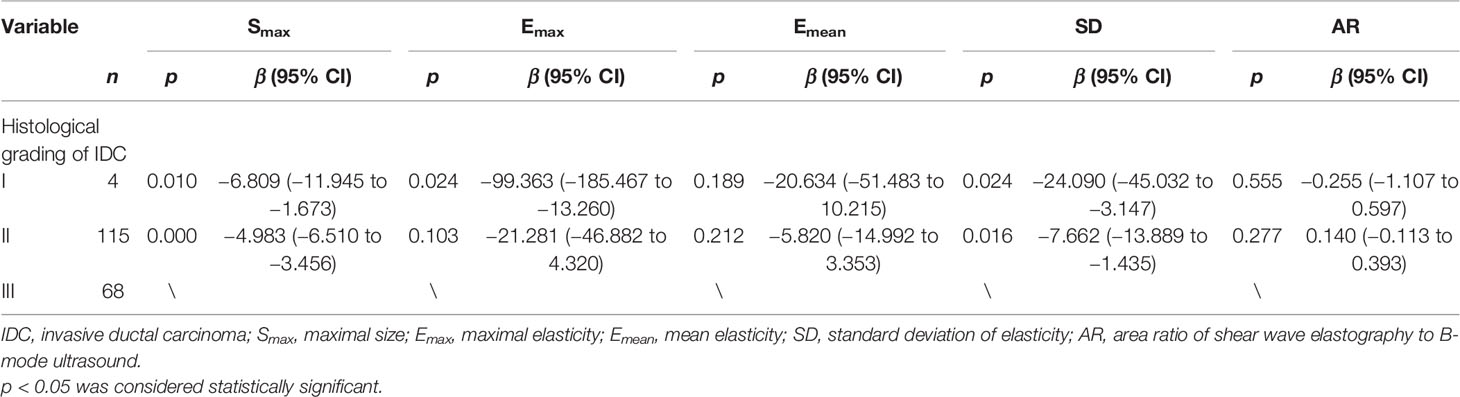
Table 2 Univariate analysis of correlation of histological grading with B-mode ultrasound and shear wave elastography parameters.
Axillary Lymph Node Status and Lymphovascular Invasion Status
There were 60 lesions in the ALN-positive group and 164 lesions in the ALN-negative group, and there were 76 lesions in the LVI-positive group and 148 lesions in the LVI-negative group. The Smax (p = 0.004) of the lesions showed lower values in the group of ALN-negative than that in the group of ALN-positive. Emax (p = 0.034), SD (p = 0.045), and Smax (p = 0.003) in the LVI-positive group were significantly higher than those in the LVI-negative group. Although the distributions were not significantly different, AR in the ALN-positive group (p = 0.237) was lower than in the ALN-negative group and AR in the LVI-positive group (p = 0.143) was lower than in the LVI-negative group (Table 3).
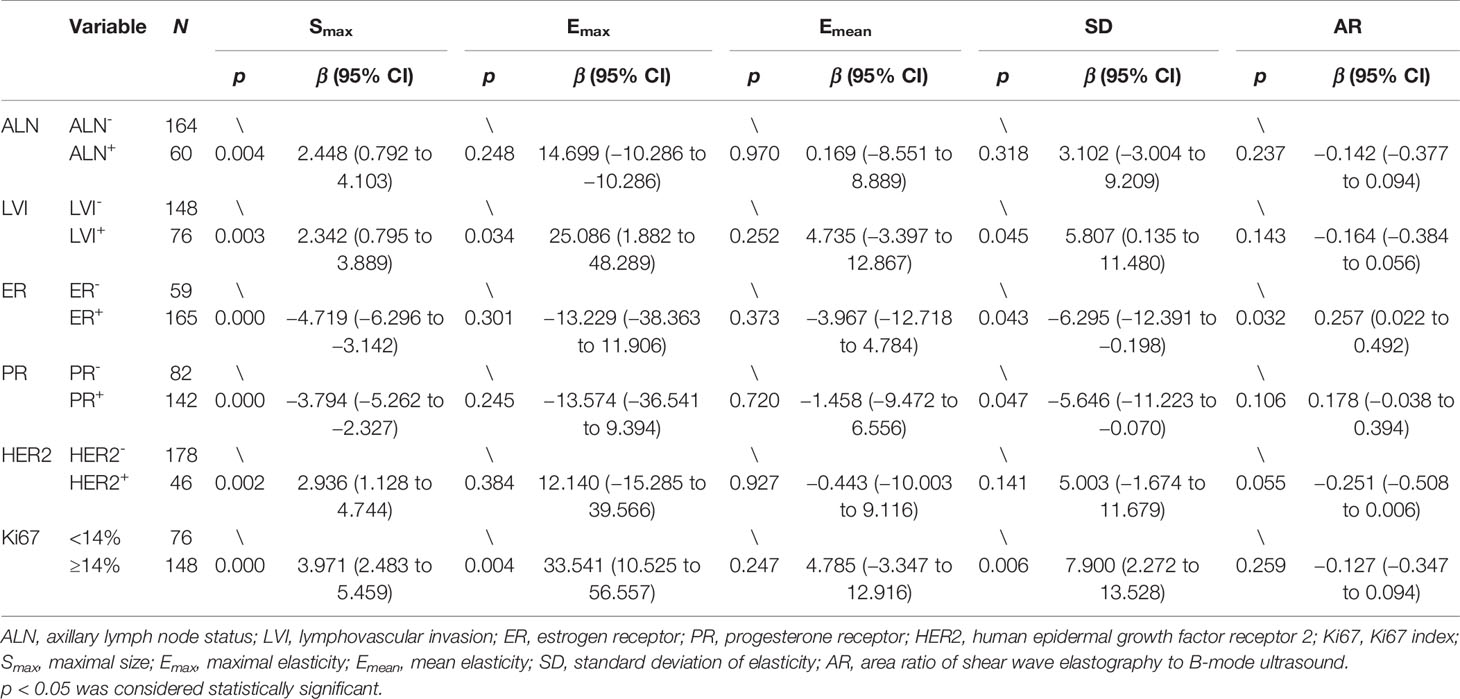
Table 3 Univariate analysis of correlation of ALN, LVI, and immunohistochemical biomarkers with B-mode ultrasound and shear wave elastography parameters.
Immunohistochemical Factors
SD and Smax were significantly correlated with ER and PR status. Compared with the ER- and the PR- lesions, the ER+ and the PR+ lesions had lower SD (p = 0.043, p = 0.047) and Smax (p = 0.000, p = 0.000) values. AR (p = 0.032) was significantly higher in the ER+ lesions than in the ER- lesions. AR (p = 0.106) in the PR+ lesions was also higher than in the PR- lesions but there were no significant differences. The Smax (p = 0.002) of the HER2+ foci had significantly higher values than that of the HER2- foci. The Emax (p = 0.004), SD (p = 0.006), and Smax (p = 0.000) values of the lesions in the Ki-67 high-expression group were significantly higher than those in the Ki-67 low-expression group. The AR (p = 0.055) of the HER2+ lesions was lower than those of the HER2- lesions, and AR (p = 0.259) in the Ki-67 high-expression group was also lower than that in the Ki-67 low-expression group, but both no significant differences were observed (Table 3).
Multivariate Analysis
It was shown in the multiple linear regression analysis that the Ki-67 index was an independent influencing factor of Emax (p = 0.004), SD (p = 0.006), and Smax (p = 0.005); ER status and LVI were independent influencing factors of Smax (p = 0.000, p = 0.006), and ER status independently influenced AR (p = 0.032) (Table 4).
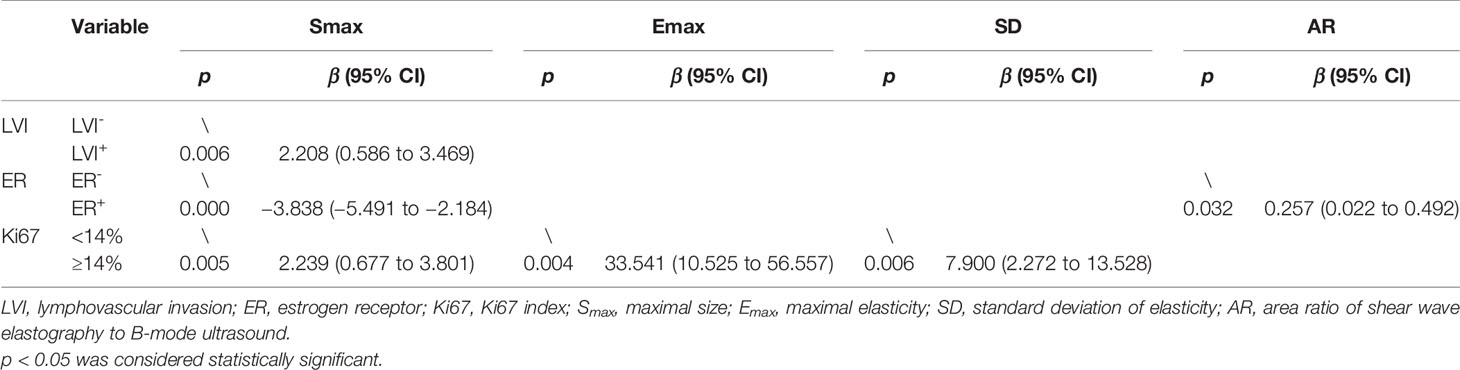
Table 4 Multivariate linear regression analysis for clinicopathological factors.
Discussion
This study explored the relationship between SWE parameters and clinicopathological characteristics. The results showed that in the univariate analysis, there was no significant difference in the distribution of SWE parameters among different pathological types of breast cancers, which is consistent with the conclusions reported by Ganau et al. (20), who indicated that pathological type is not the main factor affecting SWE parameters. Invasive breast cancer and cancer in situ have different biological behaviors and different clinical treatment plans. Therefore, we divided breast cancers into invasive breast cancer group and cancer in situ group. Compared with the cancers in situ, the invasive breast cancers showed higher values of Emax (p = 0.190) and SD (p = 0.062). As the aggressiveness of the lesion increases, both Emax and SD may increase.
The histological grade of IDC affects the clinical characteristics of the tissue. Our research clarified that lesions become harder and more heterogeneous with an increasing histological grade. The SD (p = 0.016) and Smax (p = 0.000) in the group of IDC-III were significantly higher than those in the group of IDC-II, and the Smax (p = 0.010), Emax (p = 0.024), and SD (p = 0.024) in the group of IDC-III showed higher values than those in the group of IDC-I. Even though the Emax (p = 0.072), Emean (p = 0.339), and SD (p = 0.119) in the group of IDC-II were greater than those in the group of IDC-I, the SWE parameter distribution between the two groups did not show significant differences. This may be due to the small number of cases in the IDC-I group. The study by Evans et al. obtained similar results, showing that a higher histological grade was positively associated with a higher Emean (21).
Our results showed that in the ALN-positive group, Smax (p = 0.004) showed greater values than that in the ALN-negative group, indicating that larger masses have a higher risk of ALN metastasis. There were no significant differences in the distribution of SWE parameters between the ALN-positive group and the ALN-negative group; Emean (p = 0.970) values in the ALN-positive group and the ALN-negative group were similar; however, Emax (p = 0.248) in the ALN-positive group was greater than that in the ALN-negative group. The result is consistent with the report by Xue et al., in which they concluded that the Emax values in the breast cancer ALN-negative group were lower than that in the ALN-positive group (p = 0.110) but without significant differences (22). ALN can reflect prognosis, and it has been reported that Emean or Emax of breast cancer in the ALN-positive group has higher Young’s modulus value (23, 24).
LVI positivity means that tumor cells have infiltrated the lymphatic and/or blood vessels in the area around the tumor, which is one of the critical steps of metastasis and is related to a poor prognosis (25, 26). The research by Son et al. indicated that the state of LVI is associated with Emean and Emax, with both values being higher in the LVI-positive group (27). In our research, the Emax (p = 0.034), SD (p = 0.045), and Smax (p = 0.003) of the LVI-positive group showed significantly higher values than those of the LVI-negative group, indicating that larger lesions become harder and more heterogeneous and are more likely to be LVI-positive. Therefore, preoperative Emax and SD values can infer whether a lesion has progressed to be LVI-positive. However, our research did not find a correlation between LVI and Emean. In the multiple linear regression analysis, the LVI did not show an independent correlation with Emax and SD, which may be due to the correlation between those two parameters and Ki-67. LVI-positive is often correlated with a high Ki-67 index (28).
ER, PR, HER2, and Ki-67 are markers used to distinguish breast cancer subtypes, and their expression status affects patients’ clinical treatment plan and prognosis (29). Our research results showed that the SD (p = 0.043, p = 0.047) and Smax (p = 0.000, p = 0.000) values of the ER+ and the PR+ lesions were smaller than those of the ER- and the PR- lesions. AR (p = 0.032) was significant higher in the ER+ lesions than in the ER- lesions. We also found that AR (p = 0.106) was higher in the PR+ lesions, but there were no significant differences. Existing research results have indicated that ER- and PR- breast cancers tend to a worse prognosis than ER+ or PR+ breast cancers, while ER+ and PR+ tumors are well differentiated and less aggressive to a large extent (30). Therefore, based on the patient’s preoperative Smax, SD, and AR values, we can infer the expression status of ER and PR. ER status independently affected Smax (p = 0.000) and AR (p = 0.032) in the multiple linear regression analysis, but failed to show an independent association with SD. This can be attributed to the relationship between SD and Ki-67, as ER- tumors tend to have a higher Ki-67 index (31). In addition, our research shows that HER2 status is correlated with Smax (p = 0.002). The Smax value in the HER2+ group was larger than that in the HER2- group, which may be a result from the high degree of malignancy and faster growth rate of the HER2+ lesions (32). Our study also found that the Emax and SD values of the HER2+ lesions were higher than those of the HER2- lesions, but no significant differences were observed. At present, all the evidence from clinical studies have indicated that ER+, PR+, and HER2- tumors have a good prognosis and show an excellent response to hormone therapy (33–37). This conclusion coincides with our research results, which show that ER+, PR+, and HER2- tumors have smaller sizes, lower Emax and SD values, and higher AR values in most cases, which indicates a better prognosis.
Ki-67 is a nuclear antigen that reflects the proliferation activity of tumor cells, and its expression level is related to the degree of tumor malignancy. The higher the Ki-67 index, the more rapid the rate of tumor proliferation is, and the stronger the invasion and metastasis abilities are (38–40). In the univariate analysis, the Emax (p = 0.004), SD (p = 0.006) and Smax (p = 0.000) values of the lesions in the Ki-67 high-expression group showed significantly higher values than those in the Ki-67 low-expression group. In the multiple regression analysis, the Ki-67 index was also an independent influencing factor of Emax (p = 0.007), SD (p = 0.007), and Smax (p = 0.006). In this study, the higher SD values in the Ki-67 high-expression group may be triggered by the following mechanism: the more vigorous the cell karyokinesis is during tumor growth, the higher the Ki-67 index will be, which, in turn, increases the SD value, reflecting the heterogeneity in tumor cells. Therefore, the SD value can be used to noninvasively assess the biological behavior of cancer cells in vivo. Emax represents the hardness of the lesion, which is affected by the structure of necrotic tissue and fibrous tissue. In this study, tumors with a higher Ki-67 value had a larger Emax value, which is similar to the results of Nishimura et al. (41). This may explain why ischemic and hypoxic necrosis occurs inside lesions with high rates of tumor proliferation, which subsequently leads to fibrosis and hyperplasia, thereby increasing the hardness of the tumor (42, 43). In the Ki-67 high-expression group, AR (p = 0.259) was lower than in the Ki-67 low-expression group, although no significant differences were observed. In B-mode US images, infiltrating growth of the tumor does not change the acoustic impedance, but the shear wave elastic velocity of the tumor is changed, so the shear wave elastic area of the tumor could be larger than the B-mode image area, which may explain why the AR value is higher in malignant tumors than in benign breast foci. The AR values of all lesions in our study were higher than 1 except for one lesion, which was 0.82. We speculated that the worse the prognosis of the tumor, the more likely visible the surrounding infiltrated parts of the tumor on B-mode US, then the area of B-mode US will be larger, but the area of SWE may not increase proportionally, so AR values may be lower. On the contrary, the better the prognosis of breast cancer, the higher its AR value. So, this may explain why AR was higher in ALN-negative, LVI-negative, ER+, PR+, HER2-, and Ki-67 low-expression groups, which means better prognosis in our research.
This study has some shortcomings that should be noted: the number of pathological types of breast cancer cases showed a large difference in their distribution, with IDC being the majority of cases, which is related to the different incidences of different breast cancer types. We hope to expand the sample size in the future to further explore the distribution of SWE parameters in different pathological types of breast cancers.
Conclusion
The shear wave elastography parameters Emax, SD, and AR can be used to evaluate the biological behavior of breast cancer.
Data Availability Statement
The original contributions presented in the study are included in the article/supplementary material. Further inquiries can be directed to the corresponding authors.
Ethics Statement
The studies involving human participants were reviewed and approved by the Fudan University Shanghai Cancer Center Institutional Review Board. The patients/participants provided their written informed consent to participate in this study.
Author Contributions
CL, JZ, and WZ offered the conception and design of the study. CC offered administrative support. CL and WZ collected the clinical and image data. CL and JZ conducted data analysis and interpretation. CL and JZ wrote the manuscript. WZ and CC reviewed and re-edited the manuscript. All authors contributed to the article and approved the submitted version.
Funding
This study was supported by the National Natural Science Foundation of China (81801701 and 81830058).
Conflict of Interest
The authors declare that the research was conducted in the absence of any commercial or financial relationships that could be construed as a potential conflict of interest.
Publisher’s Note
All claims expressed in this article are solely those of the authors and do not necessarily represent those of their affiliated organizations, or those of the publisher, the editors and the reviewers. Any product that may be evaluated in this article, or claim that may be made by its manufacturer, is not guaranteed or endorsed by the publisher.
Acknowledgments
We thank the doctors from Ultrasound Department and Breast Surgery of FUSCC for their help with the acquisition of cases and images.
References
1. Sung H, Ferlay J, Siegel RL, Laversanne M, Soerjomataram I, Jemal A, et al. Global Cancer Statistics 2020: GLOBOCAN Estimates of Incidence and Mortality Worldwide for 36 Cancers in 185 Countries. CA Cancer J Clin (2021) 71:209–49. doi: 10.3322/caac.21660
2. Yu F, Quan F, Xu J, Zhang Y, Xie Y, Zhang J, et al. Breast Cancer Prognosis Signature: Linking Risk Stratification to Disease Subtypes. Brief Bioinform (2019) 20:2130–40. doi: 10.1093/bib/bby073
3. Duffy MJ, Harbeck N, Nap M, Molina R, Nicolini A, Senkus E, et al. Clinical Use of Biomarkers in Breast Cancer: Updated Guidelines From the European Group on Tumor Markers (EGTM). Eur J Cancer (2017) 75:284–98. doi: 10.1016/j.ejca.2017.01.017
4. Giuliano AE, Connolly JL, Edge SB, Mittendorf EA, Rugo HS, Solin LJ, et al. Breast Cancer-Major Changes in the American Joint Committee on Cancer Eighth Edition Cancer Staging Manual. CA Cancer J Clin (2017) 67:290–303. doi: 10.3322/caac.21393
5. Hanker AB, Sudhan DR, Arteaga CL. Overcoming Endocrine Resistance in Breast Cancer. Cancer Cell (2020) 37:496–513. doi: 10.1016/j.ccell.2020.03.009
6. Brem RF, Lenihan MJ, Lieberman J, Torrente J. Screening Breast Ultrasound: Past, Present, and Future. AJR Am J Roentgenol (2015) 204:234–40. doi: 10.2214/AJR.13.12072
7. Diana A, Carlino F, Franzese E, Oikonomidou O, Criscitiello C, De Vita F, et al. Early Triple Negative Breast Cancer: Conventional Treatment and Emerging Therapeutic Landscapes. Cancers (Basel) (2020) 12:819. doi: 10.3390/cancers12040819
8. Choi HJ, Ko KH, Jung HK. Shear Wave Elastography for Surgically Verified Breast Papillary Lesions: Is it Effective for Differentiation Between Benign and Malignant Lesions? J Ultrasound Med (2017) 36:2007–14. doi: 10.1002/jum.14293
9. Youk JH, Gweon HM, Son EJ. Shear-Wave Elastography in Breast Ultrasonography: The State of the Art. Ultrasonography (2017) 36:300–9. doi: 10.14366/usg.17024
10. Song EJ, Sohn YM, Seo M. Tumor Stiffness Measured by Quantitative and Qualitative Shear Wave Elastography of Breast Cancer. Br J Radiol (2018) 91:20170830. doi: 10.1259/bjr.20170830
11. Huang Y, Liu Y, Wang Y, Zheng X, Han J, Li Q, et al. Quantitative Analysis of Shear Wave Elastic Heterogeneity for Prediction of Lymphovascular Invasion in Breast Cancer. Br J Radiol (2021) 94:20210682. doi: 10.1259/bjr.20210682
12. Cantisani V, David E, Barr RG, Radzina M, de Soccio V, Elia D, et al. US-Elastography for Breast Lesion Characterization: Prospective Comparison of US BIRADS, Strain Elastography and Shear Wave Elastography. Ultraschall Med (2021) 42:533–40. doi: 10.1055/a-1134-4937
13. Kim H, Lee J, Kang BJ, Kim SH. What Shear Wave Elastography Parameter Best Differentiates Breast Cancer and Predicts Its Histologic Aggressiveness? Ultrasonography (2021) 40:265–73. doi: 10.14366/usg.20007
14. Evans A, Whelehan P, Thomson K, McLean D, Brauer K, Purdie C, et al. Quantitative Shear Wave Ultrasound Elastography: Initial Experience in Solid Breast Masses. Breast Cancer Res (2010) 12:R104. doi: 10.1186/bcr2787
15. Leong LC, Sim LS, Lee YS, Ng FC, Wan CM, Fook-Chong SM, et al. A Prospective Study to Compare the Diagnostic Performance of Breast Elastography Versus Conventional Breast Ultrasound. Clin Radiol (2010) 65:887–94. doi: 10.1016/j.crad.2010.06.008
16. Elston CW, Ellis IO. Pathological Prognostic Factors in Breast Cancer. I. The Value of Histological Grade in Breast Cancer: Experience From a Large Study With Long-Term Follow-Up. Histopathology (1991) 19:403–10. doi: 10.1111/j.1365-2559.1991.tb00229.x
17. Hammond ME, Hayes DF, Wolff AC. Clinical Notice for American Society of Clinical Oncology-College of American Pathologists Guideline Recommendations on ER/PgR and HER2 Testing in Breast Cancer. J Clin Oncol (2011) 29:e458. doi: 10.1200/JCO.2011.35.2245
18. Wolff AC, Hammond M, Allison KH, Harvey BE, Mangu PB, Bartlett J, et al. Human Epidermal Growth Factor Receptor 2 Testing in Breast Cancer: American Society of Clinical Oncology/College of American Pathologists Clinical Practice Guideline Focused Update. J Clin Oncol (2018) 36:2105–22. doi: 10.1200/JCO.2018.77.8738
19. Penault-Llorca F, Radosevic-Robin N. Ki67 Assessment in Breast Cancer: An Update. Pathology (2017) 49:166–71. doi: 10.1016/j.pathol.2016.11.006
20. Ganau S, Andreu FJ, Escribano F, Martin A, Tortajada L, Villajos M, et al. Shear-Wave Elastography and Immunohistochemical Profiles in Invasive Breast Cancer: Evaluation of Maximum and Mean Elasticity Values. Eur J Radiol (2015) 84:617–22. doi: 10.1016/j.ejrad.2014.12.020
21. Evans A, Whelehan P, Thomson K, McLean D, Brauer K, Purdie C, et al. Invasive Breast Cancer: Relationship Between Shear-Wave Elastographic Findings and Histologic Prognostic Factors. Radiology (2012) 263:673–7. doi: 10.1148/radiol.12111317
22. Xue X, Li J, Wan W, Shi X, Zheng Y. Kindlin-2 Could Influence Breast Nodule Elasticity and Improve Lymph Node Metastasis in Invasive Breast Cancer. Sci Rep (2017) 7:6753. doi: 10.1038/s41598-017-07075-1
23. Evans A, Rauchhaus P, Whelehan P, Thomson K, Purdie CA, Jordan LB, et al. Does Shear Wave Ultrasound Independently Predict Axillary Lymph Node Metastasis in Women With Invasive Breast Cancer? Breast Cancer Res Treat (2014) 143:153–7. doi: 10.1007/s10549-013-2747-z
24. Au FW, Ghai S, Lu FI, Moshonov H, Crystal P. Quantitative Shear Wave Elastography: Correlation With Prognostic Histologic Features and Immunohistochemical Biomarkers of Breast Cancer. Acad Radiol (2015) 22:269–77. doi: 10.1016/j.acra.2014.10.007
25. Song YJ, Shin SH, Cho JS, Park MH, Yoon JH, Jegal YJ. The Role of Lymphovascular Invasion as a Prognostic Factor in Patients With Lymph Node-Positive Operable Invasive Breast Cancer. J Breast Cancer (2011) 14:198–203. doi: 10.4048/jbc.2011.14.3.198
26. Ma Q, Dieterich LC, Detmar M. Multiple Roles of Lymphatic Vessels in Tumor Progression. Curr Opin Immunol (2018) 53:7–12. doi: 10.1016/j.coi.2018.03.018
27. Son MJ, Kim S, Jung HK, Ko KH, Koh JE, Park AY. Can Ultrasonographic Vascular and Elastographic Features of Invasive Ductal Breast Carcinoma Predict Histologic Aggressiveness? Acad Radiol (2020) 27:487–96. doi: 10.1016/j.acra.2019.06.009
28. Asaoka M, Patnaik SK, Zhang F, Ishikawa T, Takabe K. Lymphovascular Invasion in Breast Cancer is Associated With Gene Expression Signatures of Cell Proliferation But Not Lymphangiogenesis or Immune Response. Breast Cancer Res Treat (2020) 181:309–22. doi: 10.1007/s10549-020-05630-5
29. Hammerl D, Smid M, Timmermans AM, Sleijfer S, Martens J, Debets R. Breast Cancer Genomics and Immuno-Oncological Markers to Guide Immune Therapies. Semin Cancer Biol (2018) 52:178–88. doi: 10.1016/j.semcancer.2017.11.003
30. Barzaman K, Karami J, Zarei Z, Hosseinzadeh A, Kazemi MH, Moradi-Kalbolandi S, et al. Breast Cancer: Biology, Biomarkers, and Treatments. Int Immunopharmacol (2020) 84:106535. doi: 10.1016/j.intimp.2020.106535
31. Li Y, Zhang X, Qiu J, Pang T, Huang L, Zeng Q. Comparisons of P53, KI67 and BRCA1 Expressions in Patients With Different Molecular Subtypes of Breast Cancer and Their Relationships With Pathology and Prognosis. J Buon (2019) 24:2361–8.
32. Chung I, Reichelt M, Shao L, Akita RW, Koeppen H, Rangell L, et al. High Cell-Surface Density of HER2 Deforms Cell Membranes. Nat Commun (2016) 7:12742. doi: 10.1038/ncomms12742
33. Dai X, Xiang L, Li T, Bai Z. Cancer Hallmarks, Biomarkers and Breast Cancer Molecular Subtypes. J Cancer (2016) 7:1281–94. doi: 10.7150/jca.13141
34. Nicolini A, Ferrari P, Duffy MJ. Prognostic and Predictive Biomarkers in Breast Cancer: Past, Present and Future. Semin Cancer Biol (2018) 52:56–73. doi: 10.1016/j.semcancer.2017.08.010
35. Lee O, Sullivan ME, Xu Y, Rogers C, Muzzio M, Helenowski I, et al. Selective Progesterone Receptor Modulators in Early-Stage Breast Cancer: A Randomized, Placebo-Controlled Phase II Window-Of-Opportunity Trial Using Telapristone Acetate. Clin Cancer Res (2020) 26:25–34. doi: 10.1158/1078-0432.CCR-19-0443
36. Bartlett J, Sgroi DC, Treuner K, Zhang Y, Ahmed I, Piper T, et al. Breast Cancer Index and Prediction of Benefit From Extended Endocrine Therapy in Breast Cancer Patients Treated in the Adjuvant Tamoxifen-To Offer More? (ATTom) Trial. Ann Oncol (2019) 30:1776–83. doi: 10.1093/annonc/mdz289
37. Smyth LM, Piha-Paul SA, Won HH, Schram AM, Saura C, Loi S, et al. Efficacy and Determinants of Response to HER Kinase Inhibition in HER2-Mutant Metastatic Breast Cancer. Cancer Discov (2020) 10:198–213. doi: 10.1158/2159-8290.CD-19-0966
38. Nielsen TO, Leung S, Rimm DL, Dodson A, Acs B, Badve S, et al. Assessment of Ki67 in Breast Cancer: Updated Recommendations From the International Ki67 in Breast Cancer Working Group. J Natl Cancer Inst (2021) 113:808–19. doi: 10.1093/jnci/djaa201
39. Thangarajah F, Enninga I, Malter W, Hamacher S, Markiefka B, Richters L, et al. A Retrospective Analysis of Ki-67 Index and Its Prognostic Significance in Over 800 Primary Breast Cancer Cases. Anticancer Res (2017) 37:1957–64. doi: 10.21873/anticanres.11536
40. Liang Q, Ma D, Gao RF, Yu KD. Effect of Ki-67 Expression Levels and Histological Grade on Breast Cancer Early Relapse in Patients With Different Immunohistochemical-Based Subtypes. Sci Rep (2020) 10:7648. doi: 10.1038/s41598-020-64523-1
41. Nishimura R, Osako T, Okumura Y, Hayashi M, Toyozumi Y, Arima N. Ki-67 as a Prognostic Marker According to Breast Cancer Subtype and a Predictor of Recurrence Time in Primary Breast Cancer. Exp Ther Med (2010) 1:747–54. doi: 10.3892/etm.2010.133
42. Hasebe T, Mukai K, Tsuda H, Ochiai A. New Prognostic Histological Parameter of Invasive Ductal Carcinoma of the Breast: Clinicopathological Significance of Fibrotic Focus. Pathol Int (2000) 50:263–72. doi: 10.1046/j.1440-1827.2000.01035.x
Keywords: ultrasound, shear wave elastography, breast cancer, prognosis, biological behavior
Citation: Liu C, Zhou J, Chang C and Zhi W (2022) Feasibility of Shear Wave Elastography Imaging for Evaluating the Biological Behavior of Breast Cancer. Front. Oncol. 11:820102. doi: 10.3389/fonc.2021.820102
Received: 22 November 2021; Accepted: 30 December 2021;
Published: 27 January 2022.
Edited by:
Guang Yang, Imperial College London, United KingdomReviewed by:
Rong Wu, Shanghai General Hospital, ChinaXin-Wu Cui, Huazhong University of Science and Technology, China
Copyright © 2022 Liu, Zhou, Chang and Zhi. This is an open-access article distributed under the terms of the Creative Commons Attribution License (CC BY). The use, distribution or reproduction in other forums is permitted, provided the original author(s) and the copyright owner(s) are credited and that the original publication in this journal is cited, in accordance with accepted academic practice. No use, distribution or reproduction is permitted which does not comply with these terms.
*Correspondence: Wenxiang Zhi, endlbngxMTIzQDE2My5jb20=; Cai Chang, Y2hhbmdjNjFAMTYzLmNvbQ==
†These authors have contributed equally to this work and share first authorship