 Xiaoyang Yan
 Hongwei Gao*
- School of Life Science, Ludong University, Yantai, China
In this paper, we selected Pt(en)Cl4, Pt(dach)Cl4, and Pt(bipy)Cl4 with gradually increasing ligands to explore the ligand effect on the properties of platinum(IV) anticancer drugs. The electronic structures and multiple drug properties of these three complexes were studied at the LSDA/SDD level using the density functional theory (DFT) method. By comparing the gap between the highest occupied molecular orbital (HOMO) and the lowest unoccupied molecular orbital (LUMO), electron affinity, atomic charge population, and natural bond orbital (NBO), we found that the order of reducibility is Pt(bipy)Cl4 > Pt(en)Cl4 > Pt(dach)Cl4. Our research can provide the theoretical basis for the development of anticancer drugs.
Introduction
Cisplatin is the first generation of the Pt(II) anticancer complex (1). Pt(II) complexes, such as cisplatin, have remarkable curative effects in the treatment of cancer, but the lack of selectivity leads to side effects in the treatment process, such as nephrotoxicity, neurotoxicity, and cross-resistance. These problems severely limit their clinical application (2). In order to overcome the shortcomings of Pt(II) anticancer complexes, scientists have designed and synthesized new platinum complexes with anticancer activity. On the background, Pt(IV) complexes have become a research hotspot (3). Since Pt(IV) anticancer drugs are easily reduced to corresponding Pt(II) drugs, they are called “prodrugs” of Pt(II) anticancer drugs (4). The molecule itself has a low ability to kill cancer cells, but these Pt(IV) complexes are easily reduced to release Pt(II) under physiological conditions; thus, they retain the broad-spectrum and high-efficiency biological activity of their corresponding Pt(II) anticancer complexes and have many unique advantages (5).
The physical and chemical properties of Pt(IV) complexes are significantly different from those of Pt(II) complexes. Compared with the planar Pt(II) complex, the central Pt ion of the Pt(IV) complex has hexacoordinate structures with two axial orbits, which can form a stable octahedral coordination configuration (6). The modification of different ligands at the axial position of Pt(IV) can affect the liposolubility, reduction, targeting, and other biological activities (7–9). This method can provide a unique idea for the design of platinum drugs, which can change the pharmacokinetic and pharmacodynamic properties of drugs. The most representative Pt(IV) complex with anticancer activity is Ormaplatin, also known as Pt(dach)Cl4. Pt(dach)Cl4 is the first Pt(IV) complex to enter clinical trials and its central Pt atom connects four Cl ligands. Experiments have shown that the Pt(IV) complex is easily reduced when the ligand is Cl (10). Pt(dach)Cl4 has successfully undergone six different phase I trials for its good reducibility. However, the subsequent phase II trials of Pt(dach)Cl4 had to be interrupted because of its potential neurotoxic adverse effects (11). By studying complexes with similar structures to Pt(dach)Cl4, we hope to find complexes with better anticancer properties than Pt(dach)Cl4 and provide a theoretical basis for the development of subsequent drugs. Pt(dach)Cl4 has played an indispensable role in the development history of Pt(IV) anticancer complexes, but its related theoretical studies are rare. Since Pt(bipy)Cl4 and Pt(en)Cl4 have similar structures to Pt(dach)Cl4, their electronic structures and medical properties were analyzed and compared by calculation software.
The density functional theory (DFT) method has been successfully tested and applied to different systems (12). This method can accurately simulate the physical and chemical important London dispersion interactions (13). A suitable method for calculating the structure of platinum tetravalent compounds has been reported recently (14). In this study, the structures and properties of Pt(dach)Cl4, Pt(en)Cl4, and Pt(bipy)Cl4 were calculated by Gaussian 16 software and Multiwfn 3.8 (15) in the ground state of LSDA with SDD basis though the DFT method. According to the structural parameters obtained by geometric optimization, the charge number of atoms, the HOMO–LUMO gap, and natural bond orbital (NBO) analysis results, we compared the stability, toxicity, electron activity, electron distribution deformation degree, and the force between different orbits of these three complexes. Hiraishi et al. studied far-infrared spectra and force constants of ammine complexes of Pt (IV), Pt (II), and Pd (II) (16).
Computational Details
In this study, all calculations were performed by Gaussian 16 software (17) and the results were analyzed by the Gaussview 6.0 molecular visualization program (18). Each bond length and bond angle of three anticancer complexes were fully optimized at the local spin-density approximation (LSDA) (19, 20) Stuttgart/Dresden and D95 ECPs (SDD) (21, 22) level of the DFT method. According to the optimized bond length, the reducibilities of the complexes were compared. The distribution of electron density was visually displayed by plotting the electrostatic potential of the optimized complexes. Then, polarizability, electron activity, and electron distribution deformation degree were displayed by comparing the HOMO–LUMO gaps and the softness. In addition, the calculated infrared spectrum data confirm the characteristic vibrational functional group of the complexes.
NBO means that a group of natural orbits are combined into a single electron basis function. This basis function constitutes the electronic configuration of the N particle system; thus, the configuration with less basis than the regular Hartree–Fock orbit can be realized when ci is expanded. Weinhold and Reed further elaborated this basis function and proposed the following concepts: natural spin orbit, natural bond orbit, and natural hybrid orbit (23). They developed these concepts into a set of theories, also called NBO theory. The NBO analysis emphasizes the role of molecular orbital interaction or exchange transfer. It is calculated by considering all possible interactions between filled donor and empty acceptor NBOs. In addition, NBO analysis estimates the energy importance between them via the second-order perturbation theory (24). The stabilization energy (Ea) combined with electron delocalization between electron donor NBO (i) and electron acceptor NBO (j) is calculated by following equation (q is the orbital occupancies, Ei and Ej are diagonal elements, and Fij is the off-diagonal NBO Fock matrix element) (25):
Multiwfn 3.8 is used to process the optimized complexes for more intuitive illustrations (15). It is a multifunctional program for wavefunction analysis. The main function is to calculate and visualize real space functions: population analysis, bond order analysis, orbital composition analysis, plot density of states, and spectrum and topology analysis for electron density (15). In this paper, Multiwfn 3.8 was used to calculate some parameters: local orbit locator (LOL) (26, 27) and electronic localization function (ELF) (28). Then, the electrostatic potential plane contour maps and the orbital delocalization index (ODI) were calculated by the Mulliken and Hirshfeld methods.
Results and Discussion
Optimization and Electronic Structure Analysis
The chemical structures of the three complexes (left) and the optimized structures (right) at the LSDA/SDD level are shown in Figure 1. The optimized data of bond length and bond angle are shown in Table 1. The optimized bond lengths of the Pt-Cl are 2.342 Å (Pt(bipy)Cl4), 2.340 Å (Pt(en)Cl4), and 2.339 Å (Pt(dach)Cl4) in Table 1. The Cl-Pt-Cl bond angle (from small to large) is Pt(bipy)Cl4 (89.060°) < Pt(dach)Cl4 (95.747°) < Pt(en)Cl4 (95.980°). Ju Guang Han (1) et al. proved that the longer the bond length of Pt-Cl, the weaker the binding ability between them and Cl, which means that it is easier to break the binding between Pt and Cl in the presence of a DNA/protein environment. Afterwards, Pt(IV) is easier to reduce to Pt (II) to exert anticancer activity. The calculated result shows that the optimized bond lengths of Pt-Cl are 2.342 Å (Pt(bipy)Cl4), 2.340 Å (Pt(en)Cl), and 2.339 Å (Pt(dach)Cl4). The order is Pt(bipy)Cl4 > Pt(en)Cl4 > Pt(dach)Cl4, which means that Pt(bipy)Cl4 is most easily reduced and Pt(dach)Cl4 is the most difficult to reduce. The experimental value of R(Pt-Cl1) is 2.33 Å. The deviations are 0.012 Å (Pt(bipy)Cl4), 0.009 Å (Pt(dach)Cl4), and 0.01 Å (Pt(en)Cl4). The experimental value of R(Pt-N1) is 2.17 Å. The deviations are 0.161 Å (Pt(bipy)Cl4), 0.13 Å (Pt(dach)Cl4), and 0.119 Å (Pt(en)Cl4). The bond lengths of Pt-Cl and Pt-N obtained by calculation are close to the experimental values (16). In addition, the intensity of the interaction between Pt and Cl is also a sign that the detachment rate of Cl- from complex in some way in a DNA/protein environment. This is also a method of measuring reaction kinetics that bind Pt(IV) anticancer drugs to DNA (1).
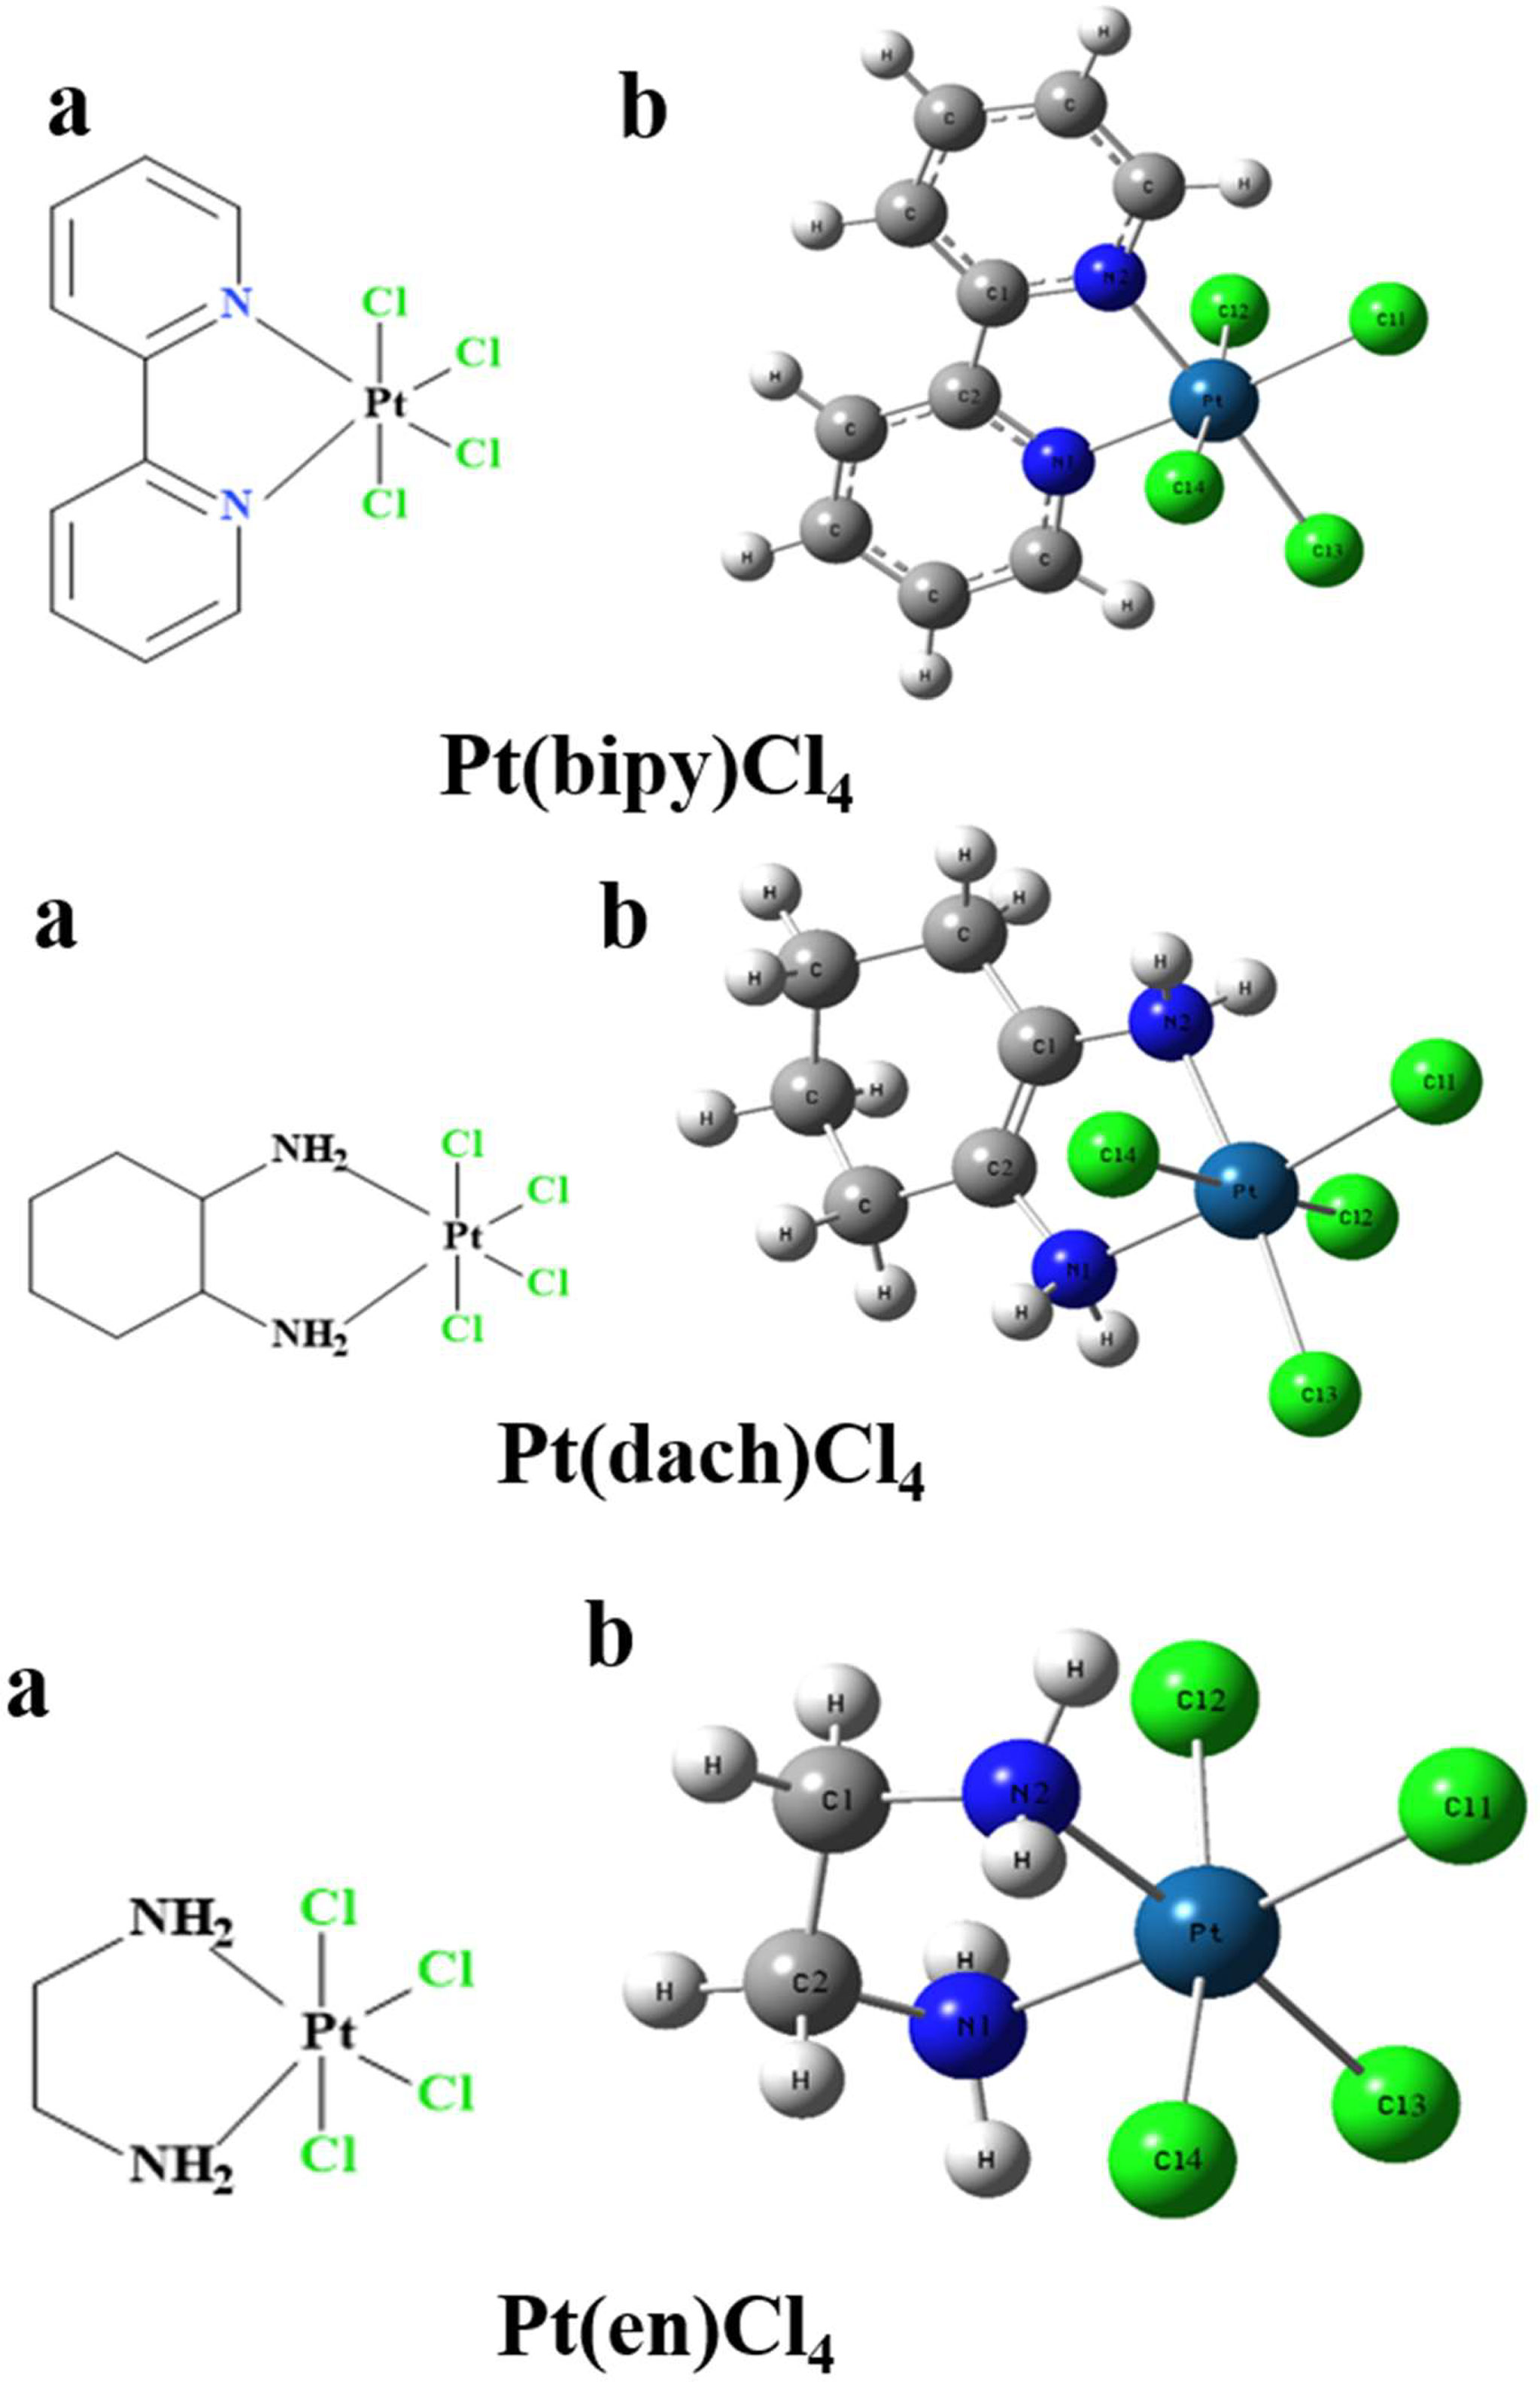
Figure 1 The chemical structure (A) and the optimized structure (B) of Pt(bipy)Cl4, Pt(dach)Cl4, and Pt(en)Cl4 at the LSDA/SDD level.
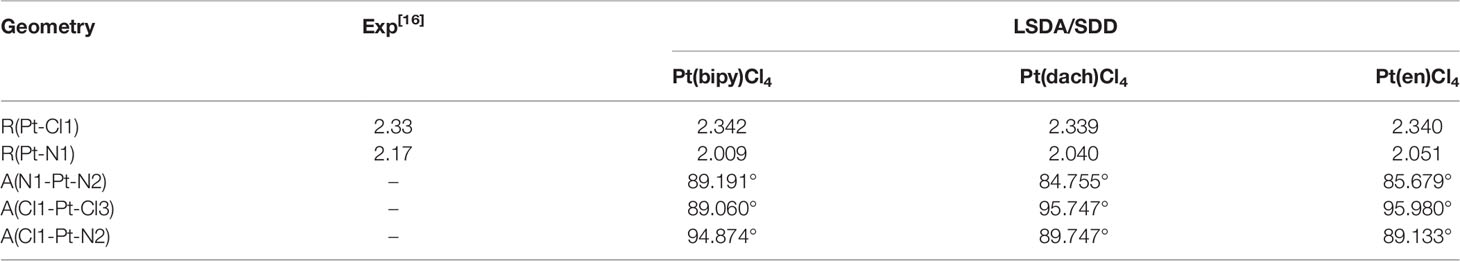
Table 1 Optimized bond length (in Å) and bond angle (in °) of complexes Pt(dach)Cl4, Pt(bipy)Cl4, and Pt(en)Cl4 at the LSDA/SDD level.
Experiments have shown that the reactivity of these three complexes with glutathione (GSH), L-cysteine (L-Cys), and L-methionine (L-Met) follows this rule: Pt(bipy)Cl4 > Pt(dach)Cl4 > Pt(en)Cl4 (29). The order of the Pt-N bond length (from short to long) and the Cl-Pt-Cl bond angle (from small to large) is Pt(bipy)Cl4 < Pt(dach)Cl4 < Pt(en)Cl4, which is just the opposite of the reactivity order proved by experiments (29). However, the order of the bond angles of Cl-Pt-N (from large to small) is Pt(bipy)Cl4 > Pt(dach)Cl4 > Pt(en)Cl4, which is the same as the reactivity order proved by experiments. Thus, we could infer that the bond length of Pt-N from short to long and the bond angle of Cl-Pt-Cl from small to large are negatively correlated with the reactivity. The bond angle of Cl-Pt-N from large to small is positively correlated with the reactivity.
Vibrational Spectroscopic
We calculated the IR frequencies and intensities of Pt(dach)Cl4, Pt(bipy)Cl4, and Pt(en)Cl4 at the LSDA/SDD level. The calculated infrared spectra of these complexes and the experimental infrared spectra of ammonium confirm the characteristic tetrachloroplatinate (Chemical Database of Chinese Academy of Sciences) are depicted in Figure 2. The calculated and experimental data are shown in Table 2. The vibration types exhibited by the highest peaks of these three complexes are the out-of-plane bending vibrations of C-H and N-H: γ(CH) and γ(NH) are at 779 cm-1 in Pt(bipy)Cl4, γ(CH) and γ(NH) are at 1,122 cm-1 in Pt(dach)Cl4, and γ(CH) and γ(NH) are at 1,088 cm-1 in Pt(en)Cl4, and Pt(en)Cl4 has the highest infrared intensity. By comparing Pt(dach)Cl4 and Pt(en)Cl4, we can clearly find that the highest peak of Pt(bipy)Cl4 shifts to the low-frequency region. Moreover, CH-related vibration types include in-plane bending vibration [δ(CH)] and symmetric stretching vibration [υ(CH)]. The position of δ(CH) is at 1,471 cm-1 in Pt(bipy)Cl4, 1,560 cm-1 in Pt(dach)Cl4, and 1,585 cm-1 in Pt(en)Cl4, and Pt(bipy)Cl4 has the highest infrared spectral intensity and shifts to low frequency. The position of υ(CH) is at 3,098 cm-1 in Pt(bipy)Cl4, 3,363 cm-1 in Pt(dach)Cl4, and 3,416 cm-1 in Pt(en)Cl4, and Pt(en)Cl4 has the highest infrared spectral intensity. In addition, the absorption peak of Pt(bipy)Cl4 shifts obviously to the low-frequency region compared with Pt(en)Cl4.
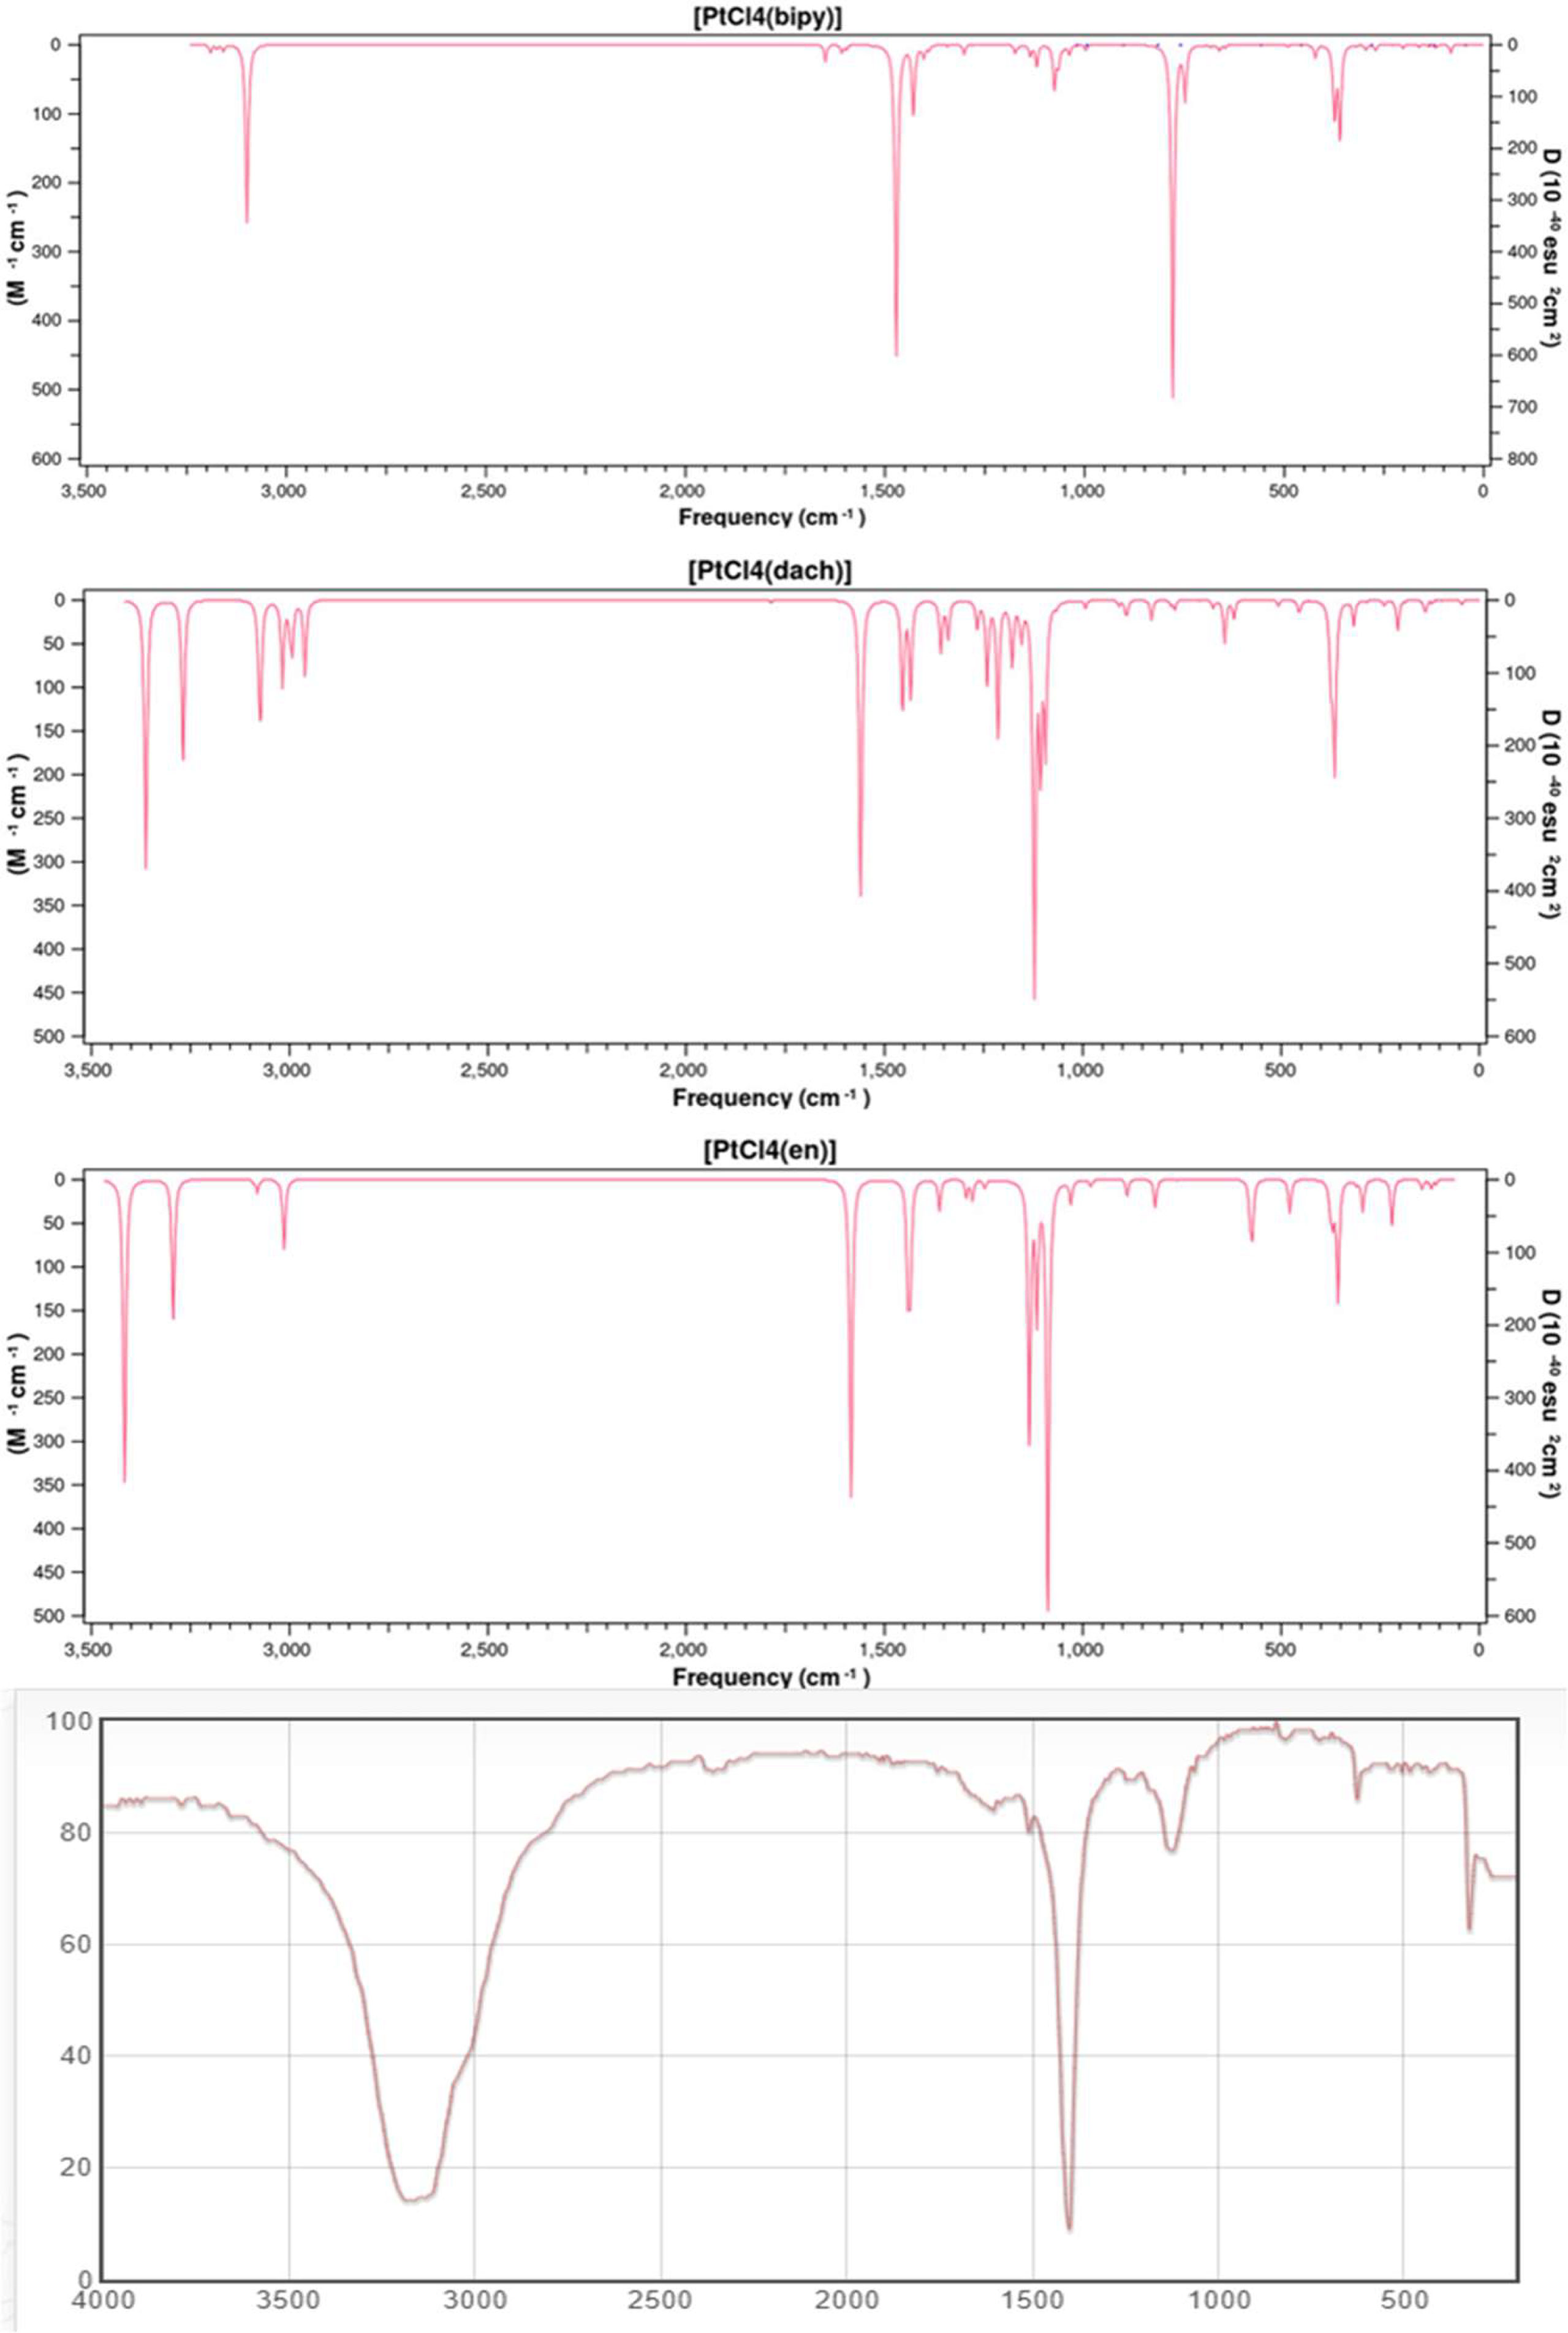
Figure 2 The theoretical frequencies and infrared intensities calculated with the LSDA/SDD method for Pt(bipy)Cl4, Pt(dach)Cl4, and Pt(en)Cl4, as well as the infrared spectrum of ammonium tetrachloroplatinate.
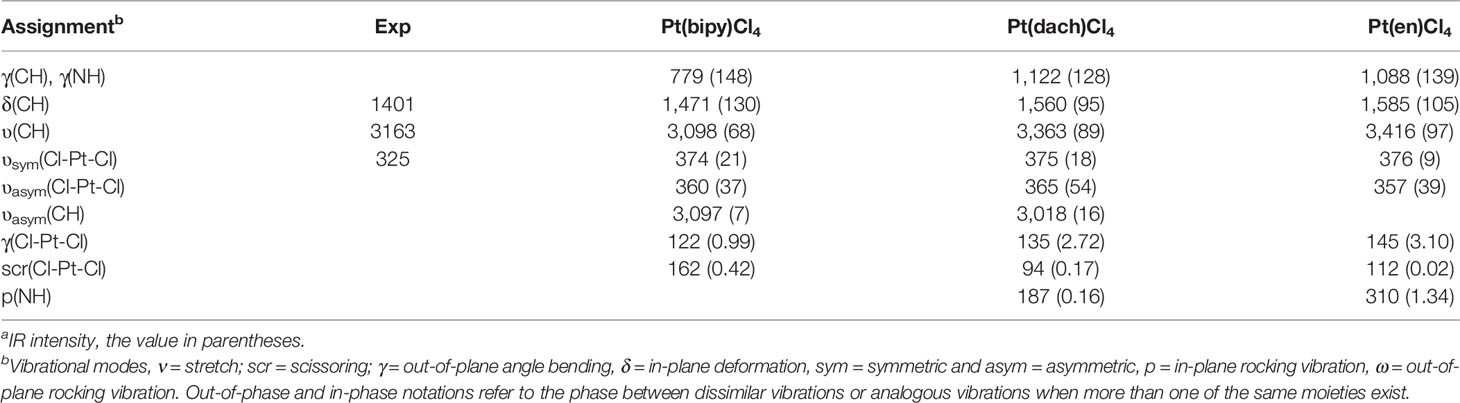
Table 2 Frequencies (cm-1) and infrared intensitiesa (km/mol) calculated for complexes Pt(dach)Cl4, Pt(bipy)Cl4, and Pt(en)Cl4 at the LSDA/SDD level.
We observe that the vibration types related to Pt are symmetric stretching vibration [υsym(Cl-Pt-Cl)], antisymmetric stretching vibration [υasym(Cl-Pt-Cl)], scissoring vibration [scr(Cl-Pt-Cl)], and out-of-plane bending vibration [γ(Cl-Pt-Cl)]. The position of υsym(Cl-Pt-Cl) is at 374 cm-1 in Pt(bipy)Cl4, 375 cm-1 in Pt(dach)Cl4, and 376 cm-1 in Pt(en)Cl4, and Pt(bipy)Cl4 has the highest infrared intensity. The position of υasym(Cl-Pt-Cl) is at 360 cm-1 in Pt(bipy)Cl4, 365 cm-1 in Pt(dach)Cl4, and 357 cm-1 in Pt(en)Cl4, and Pt(dach)Cl4 has the highest infrared intensity. The position of γ(Cl-Pt-Cl) is at 122 cm-1 in Pt(bipy)Cl4, 135 cm-1 in Pt(dach)Cl4, and 145 cm-1 in Pt(en)Cl4, and Pt(en)Cl4 has the highest infrared intensity. In addition, compared with Pt(en)Cl4, the absorption peak of Pt(bipy)Cl4 shifts slightly to the low-frequency region. The position of scr(Cl-Pt-Cl) is at 162 cm-1 in Pt(bipy)Cl4, 94 cm-1 in Pt(dach)Cl4, and 112 cm-1 in Pt(en)Cl4, and Pt(bipy)Cl4 has the highest infrared intensity. In addition, compared with Pt(bipy)Cl4, the absorption peak of Pt(dach)Cl4 shifts obviously to the low-frequency region.
The infrared spectrum of ammonium tetrachloroplatinate has three peaks between 300 cm-1 and 3,500 cm-1, and the vibration modes are in-plane bending vibration [δ(CH)], symmetric stretching vibration [υ(CH)], and symmetric stretching vibration [υsym(Cl-Pt-Cl)]. Ammonium tetrachloroplatinate, Pt(bipy)Cl4, Pt(dach)Cl4, and Pt(en)Cl4 have similar structures. The positions of δ(CH), υsym(Cl-Pt-Cl), and υ(CH) are 1,401 cm-1, 3,163 cm-1, and 325 cm-1, respectively, in ammonium tetrachloroplatinate. Compared with the experimental results, the smaller the substituent attached to Pt, the more the positions of δ(CH) and υsym(Cl-Pt-Cl) move to the high-frequency region. The size of the substituent does not affect the position of υ(CH).
HOMO–LUMO Calculations
The HOMO–LUMO gap values play a vital role in a wide range of chemical interactions (30). The size of HOMO and LUMO shows the ability to lose and gain electrons. The energy gap is an important stability index for the individual species concerned (31, 32). Generally speaking, a large HOMO–LUMO gap indicates high stability. High stability of a molecule reflects low reducibility toward chemical reactions in some sense. A small HOMO–LUMO gap indicates that the overall energy difference between the occupied and non-occupied orbits is smaller. The smaller overall energy difference lends smaller excitation energy and larger polarizability (33). The HOMO–LUMO gap values are calculated at the LSDA/SDD level. The different physical parameters calculated from HOMO–LUMO are displayed in Table 3. The HOMO and LUMO of three complexes are displayed in Figure 3.
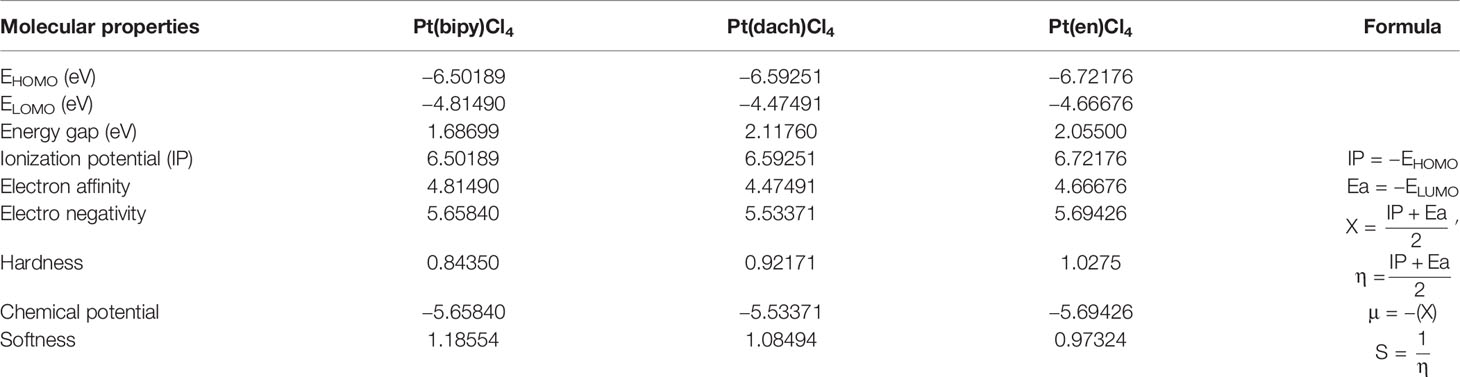
Table 3 HOMO–LUMO energy gaps and other physical relationships of the Pt(dach)Cl4, Pt(bipy)Cl4, and Pt(en)Cl4 at the LSDA/SDD level.
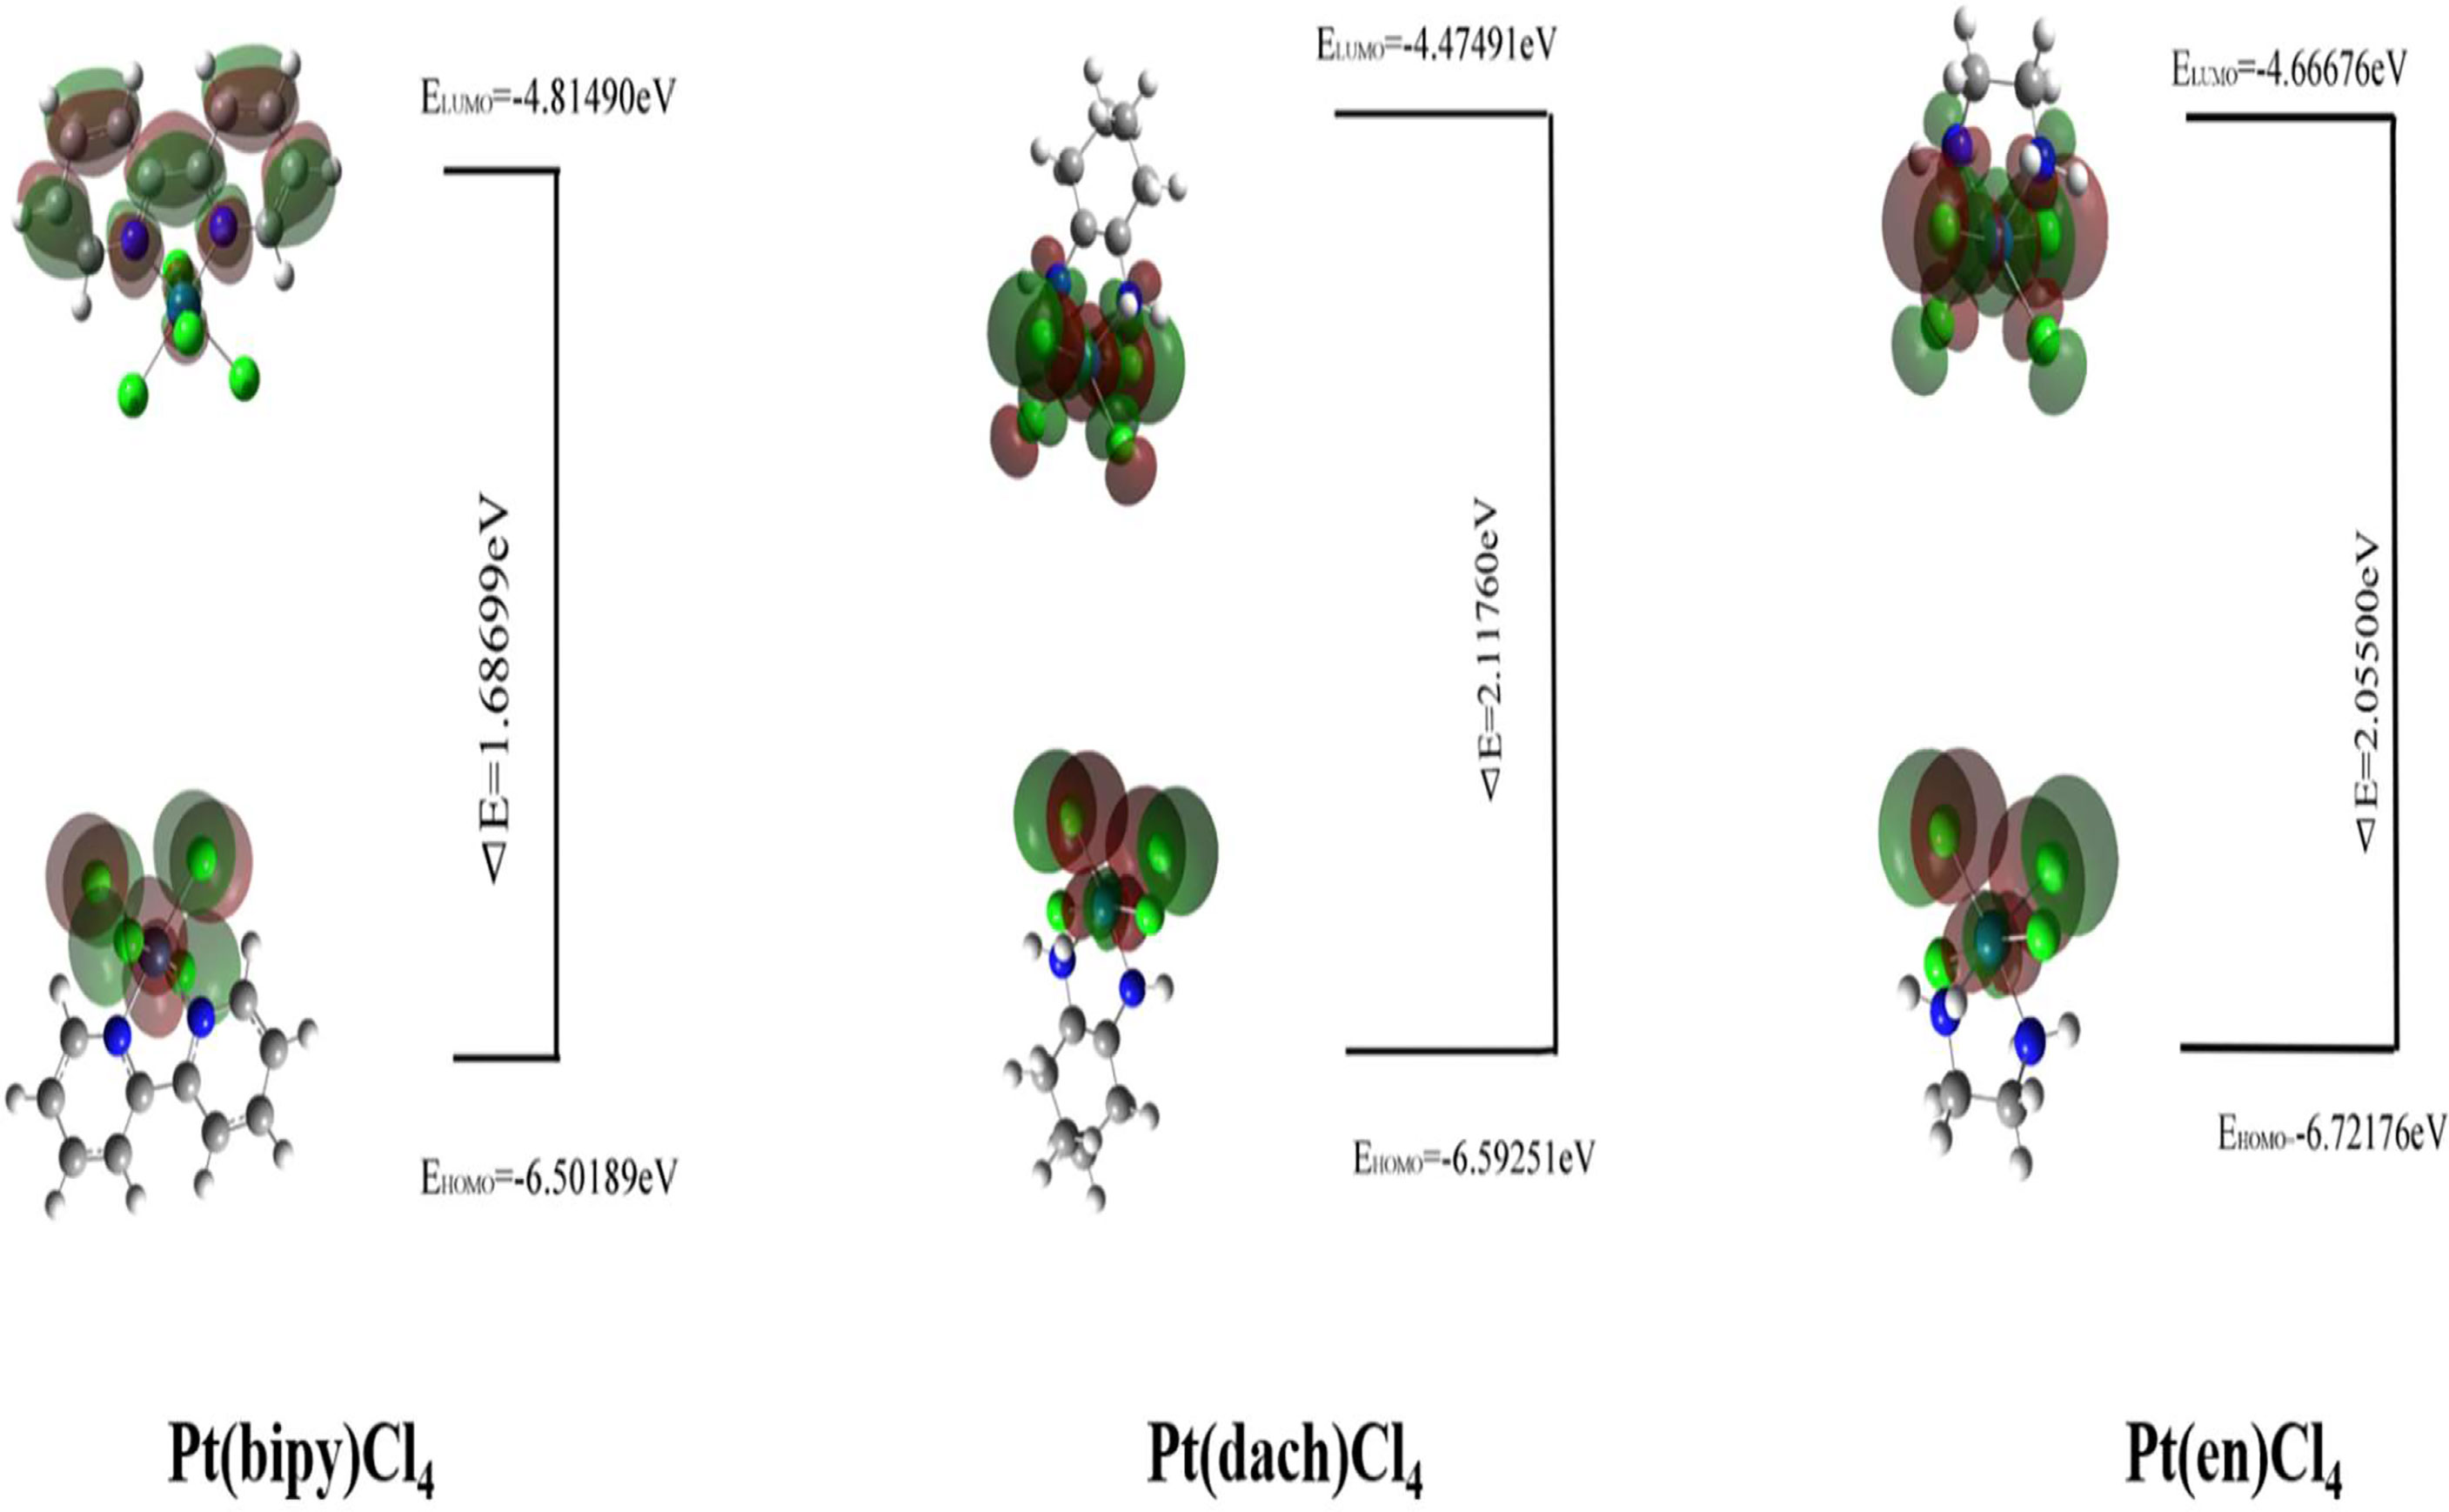
Figure 3 The HOMO and LUMO of Pt(bipy)Cl4, Pt(dach)Cl4, and Pt(en)Cl4.
The HOMO–LUMO gap of Pt(bipy)Cl4, Pt(en)Cl4, and Pt(dach)Cl4 are 1.68699 eV, 2.05500 eV, and 2.11760 eV, respectively. Thus, the order of polarizability from large to small is Pt(bipy)Cl4 > Pt(en)Cl4 > Pt(dach)Cl4, the order of stability from large to small is Pt(dach)Cl4 > Pt(en)Cl4 > Pt(bipy)Cl4, and the order of reducibility from large to small is Pt(bipy)Cl4 > Pt(en)Cl4 > Pt(dach)Cl4. Ju Guang Han (1) et al. proved that low electron affinity leads to poor ability to obtain electrons; thus, the stability is strong. The electron affinity of Pt(bipy)Cl4, Pt(en)Cl4, and Pt(dach)Cl4 are 4.81490 kcal mol-1, 4.66676 kcal mol-1, and 4.47491 kcal mol-1, respectively; hence, order of stability from large to small is Pt(dach)Cl4 > Pt(en)Cl4 > Pt(bipy)Cl4. Therefore, the rules of the HOMO–LUMO gap and electron affinity proved that Pt(bipy)Cl4 has the largest reducibility and Pt(dach)Cl4 has the smallest reducibility. The order of softness from large to small is Pt(bipy)Cl4 (1.18554) > Pt(dach)Cl4 (1.08494) > Pt(en)Cl4 (0.97324). Softness reflects the activity of electrons and the degree of deformation of their distribution. Generally speaking, the larger the softness indicates, the easier it is for a molecule to react. Thus, softness also shows that Pt(bipy)Cl4 is more responsive than Pt(dach)Cl4.
Natural Charge Analysis
Mulliken atomic charge calculation is a vital function in the application of quantum chemical calculation, because it affects physical properties such as electronic structures, molecular polarizability, and many other properties of a molecular system (34, 35). Natural charge analysis is an alternative to the traditional Mulliken population analysis. It shows better numerical stability and better description of the electron distribution in complexes with high ionic properties, such as complexes containing metal atoms (36).
The calculated natural charges of Pt(bipy)Cl4, Pt(dach)Cl4, and Pt(en)Cl4 at the LSDA/SDD level are displayed in Tables 4–6. Natural charge distribution histograms are shown in Figure 4. Among the three complexes, Cl and N connected to Pt are negatively charged. In the four Cl substituents of Pt(bipy)Cl4, Cl22 and Cl25 have a high amount of charge (−0.017 a.u.) while the lowest charge is seen on Cl23 (−0.034 a.u.). In the four Cl substituents of Pt(dach)Cl4, Cl22 and Cl25 have a high amount of charge (−0.016 a.u.) while the lowest charge is seen on Cl23 and Cl21 (−0.049 a.u.). In the four Cl substituents of Pt(en)Cl4, Cl15 and Cl16 have a high amount of charge (−0.020 a.u.) while the lowest charge is seen on Cl14 and Cl17 (−0.055 a.u.).
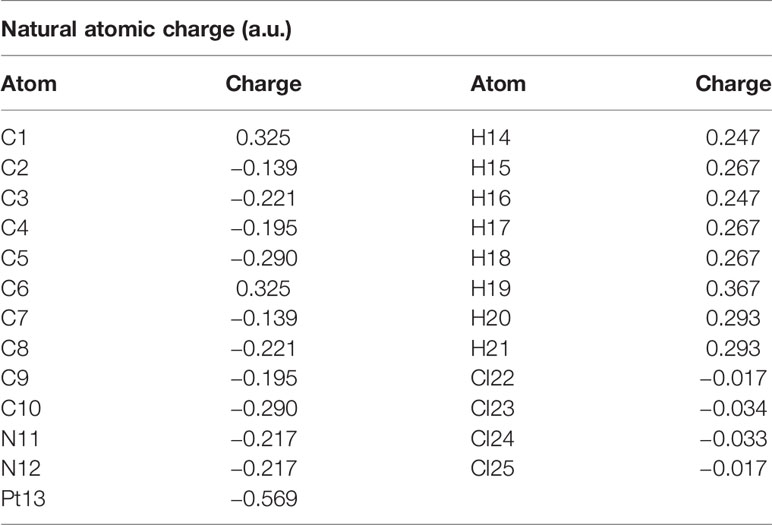
Table 4 Natural atomic charges for Pt(bipy)Cl4.
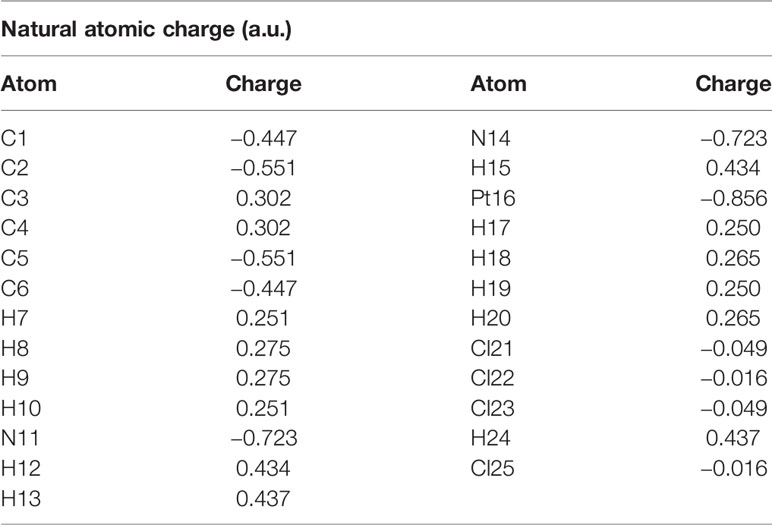
Table 5 Natural atomic charges for Pt(dach)Cl4.
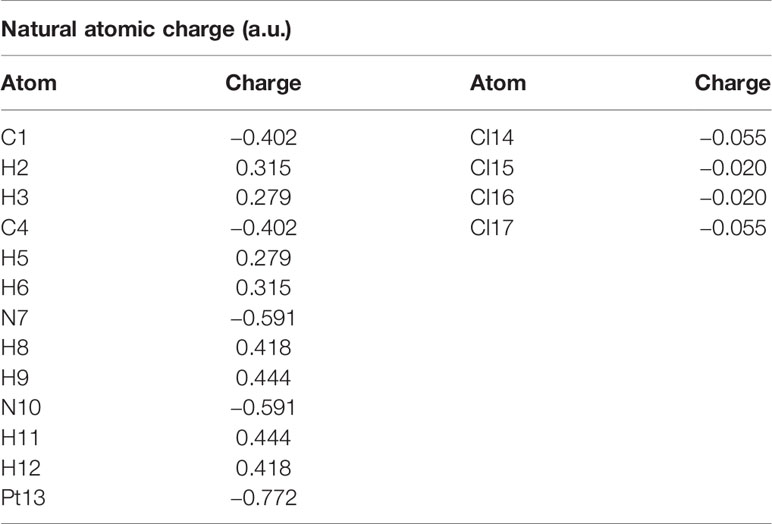
Table 6 Natural atomic charges for Pt(en)Cl4.
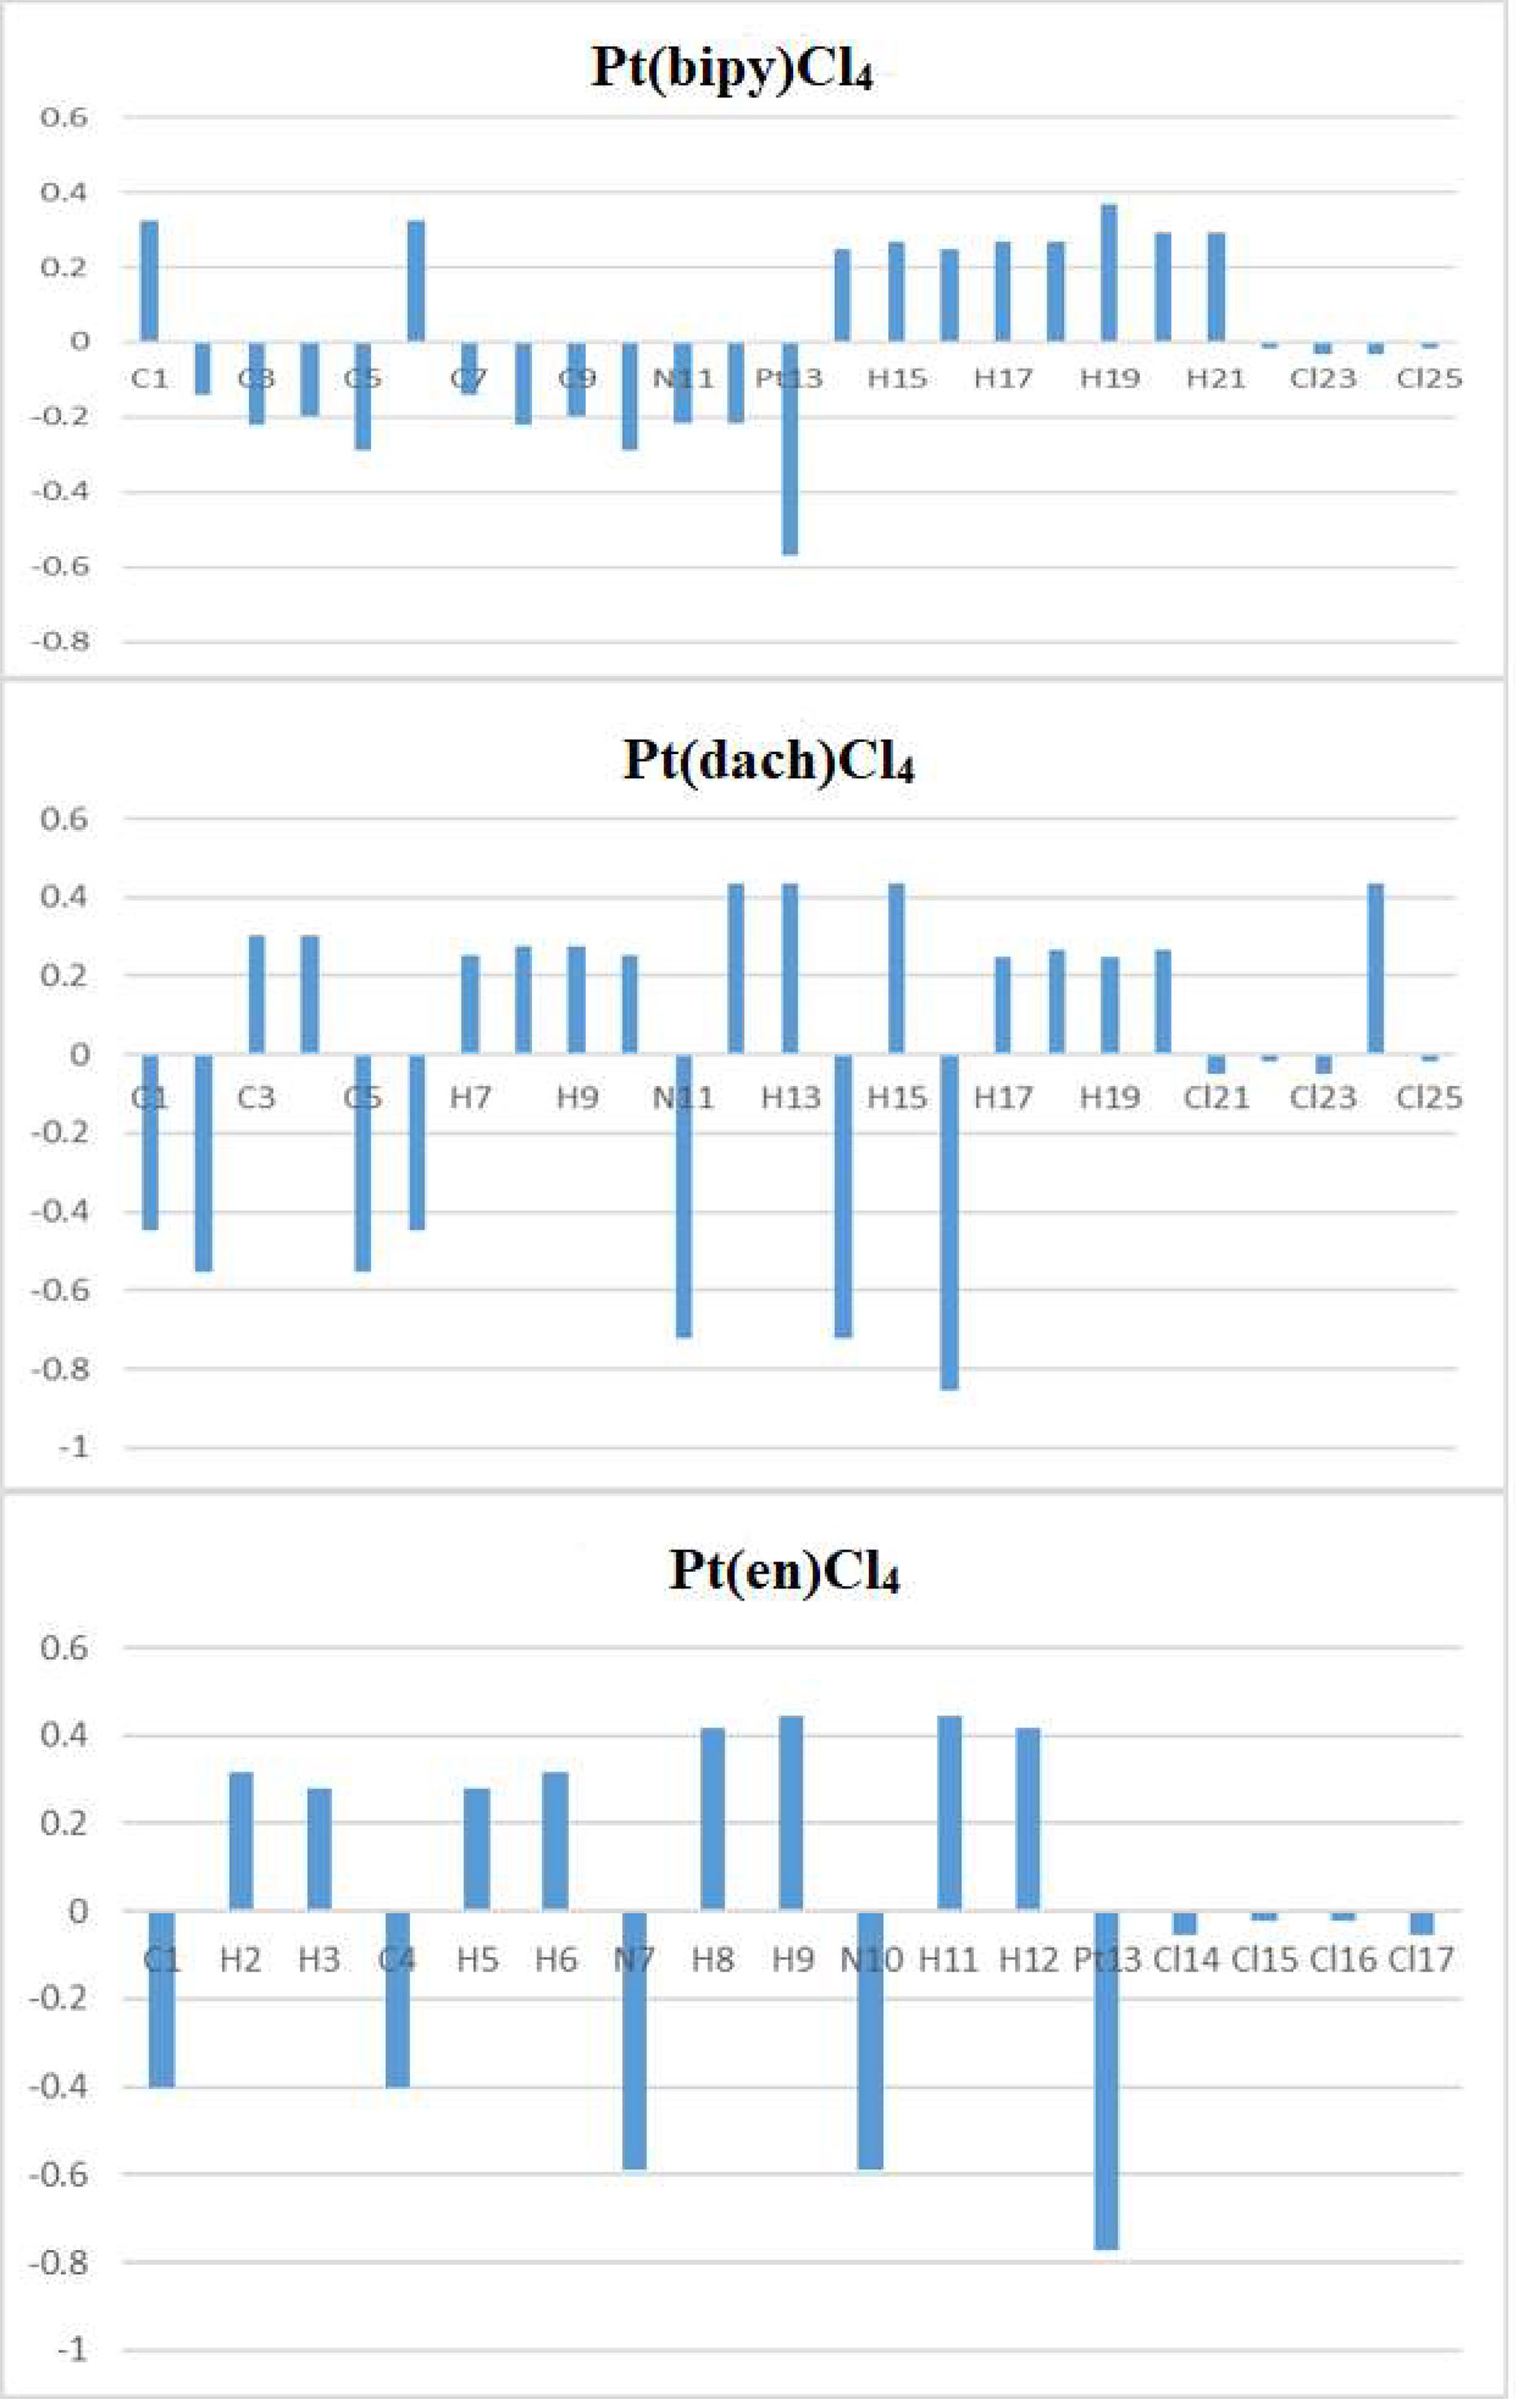
Figure 4 Natural atomic charges for Pt(bipy)Cl4, Pt(dach)Cl4, and Pt(en)Cl4.
Ju Guang Han et al. proved that the more charge Pt carries, the greater the activity (1). The dose required to inhibit tumor is inversely related to Pt activity. Pt(bipy)Cl4 carries the most charge (−0.569 a.u.), so it has the highest activity and the minimum dose required for the treatment of tumors. Pt(dach)Cl4 carries the least charge (−0.772 a.u.), so it has the lowest activity and the largest dose required for tumor treatment. The cytotoxicity carried by anticancer Pt complexes is related to the Cl atomic charge. The smaller the negative charge is, the smaller the toxicity is (1). Pt(bipy)Cl4 is the least toxic (−0.101 a.u.) and Pt(dach)Cl4 is more toxic (−0.13 a.u.) than Pt(bipy)Cl4. Pt(bipy)Cl4 is better than Pt(dach)Cl4 in terms of toxicity and dose of the drug needed to treat cancer; thus, we infer that Pt(bipy)Cl4 has a greater potential in the treatment of cancer.
NBO Analysis
NBO analysis provides an effective method for studying intramolecular bonds, intermolecular bonds, and bond–bond interactions. It also provides a convenient basis for studying charge transfer or conjugate interactions in molecular systems (37). The second-order Fork matrix is used to evaluate the donor–acceptor interactions in NBO analysis (38). The interactions result in a loss of occupancy from the localized NBO of the idealized Lewis structure into an empty non-Lewis orbital. (39) The electron donor orbit (i), electron acceptor orbit (j), and the corresponding second-order stabilization energy distribution [E(2)] in the stable configurations of the three complexes are shown in Tables 7–9. The E(2) value represents the degree (strong or weak) of electron delocalization and the interaction between electron donor and electron acceptor, which show the contribution tendency of the electrons transferring from electron donor to the electron acceptor (40).
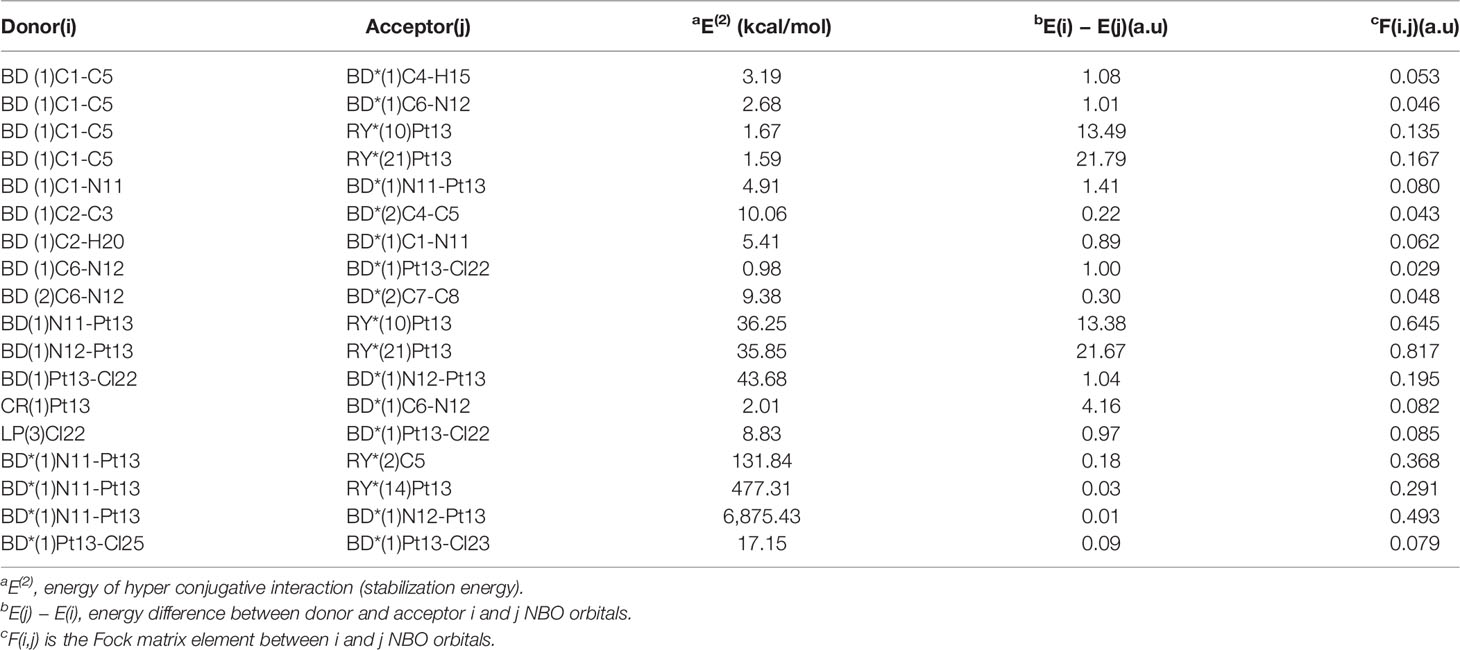
Table 7 Second-order perturbation theory analysis of Fock matrix in NBO basis for Pt(bipy)Cl4 at the LSDA/SDD level.
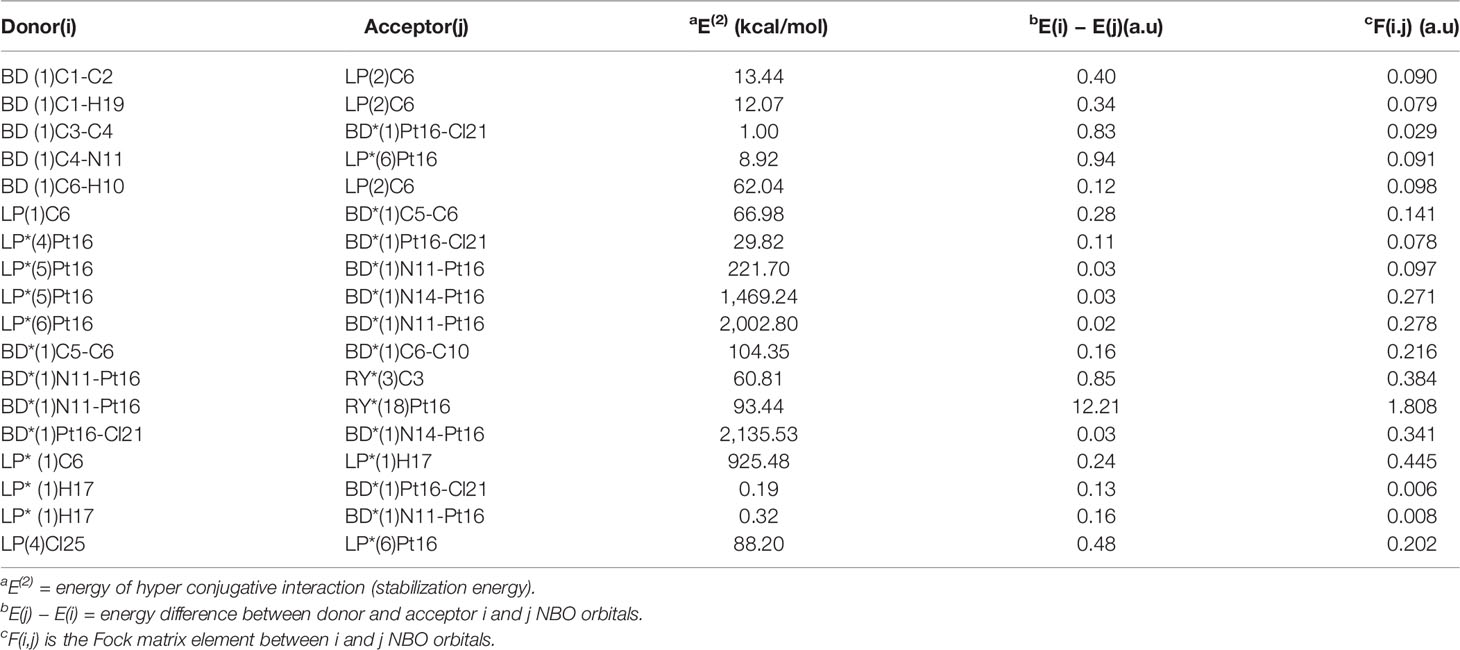
Table 8 Second-order perturbation theory analysis of Fock matrix in NBO basis for Pt(dach)Cl4 at the LSDA/SDD level.
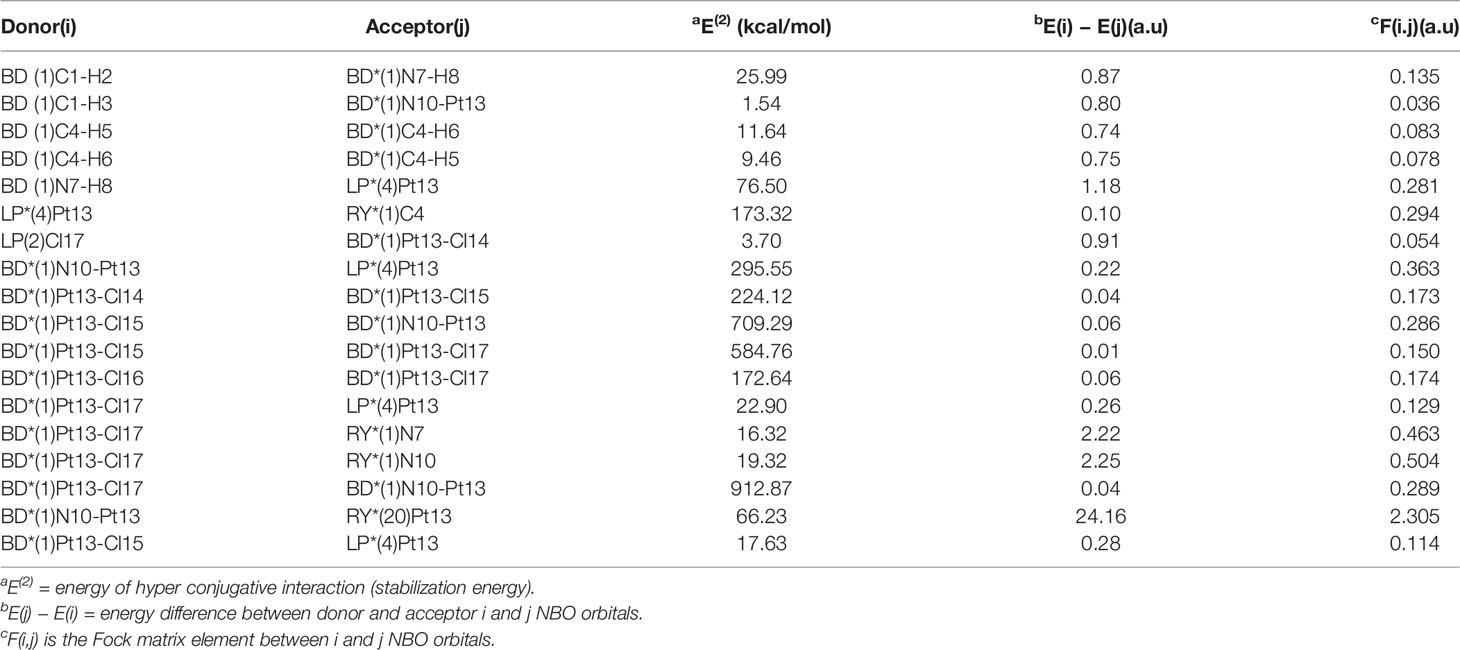
Table 9 Second-order perturbation theory analysis of Fock matrix in NBO basis for Pt(en)Cl4 at the LSDA/SDD level.
The largest interaction energies of the three complexes appear between the anti-bonding donor and the anti-bonding acceptor, showing great delocalization effects. The largest interaction energy is the anti-bonding N11-Pt13 and anti-bonding N12-Pt13 in the Pt(bipy)Cl4 complex (6,875.43 kcal/mol). This result clearly demonstrates strong delocalization between BD*(1)N11-Pt13 and BD*(1)N12-Pt13, and also shows a large tendency of anti-bonding N11-Pt13 to provide electrons to anti-bonding N12-Pt13. The interactions between the central atom Pt and the surrounding atoms are BD*(1)Pt16-Cl21 to BD*(1)N14-Pt16 and BD*(1)Pt13-Cl17 to BD*(1)N10-Pt13, and their energies are 2,135.53 kcal/mol and 912.87 kcal/mol, respectively, in the Pt(dach)Cl4 and Pt(dach)Cl4 complex. According to the comparison of calculated data, the degree of electron delocalization between the anti-bonding donor and the anti-bonding acceptor of Pt(bipy)Cl4 is higher than that of Pt(dach)Cl4 and Pt(en)Cl4.
Quantifying the Extent of Spatial Delocalization of Orbitals via the Orbital Delocalization Index
The ODI of an orbit is calculated by this formula (41):
Where ΘA,i ′ is the composition of atom A in orbital i.
The delocalization degree of orbit means that the range of orbit distribution is narrow or wide. The larger the distribution range, the stronger the delocalization (42). The ODI is a useful indicator of quantifying the extent of orbital spatial delocalization. The lower (higher) the ODI is, the stronger the orbital delocalization (localization) is. For example, if an orbit is completely localized on an atom, the orbital component of that atom is 100%. Then, the ODI value is (1002)/100 = 100, which reaches the theoretical maximum. If this orbit is evenly distributed on two atoms, the ODI value will be (502 + 502)/100 = 50, which is obviously smaller. Strong delocalization indicates that orbits occupy more atoms; thus, the ODI value will be small (41). We calculate the ODI of Pt(dach)Cl4, Pt(bipy)Cl4, and Pt(en)Cl4 through the Mulliken and Hirshfeld methods at the LSDA/SDD level. The calculation process was completed using the Multiwfn 3.8 software, and the obtained data are shown in Table 10. Figure 5 shows the orbital isosurface map of the partial orbitals of three complexes.
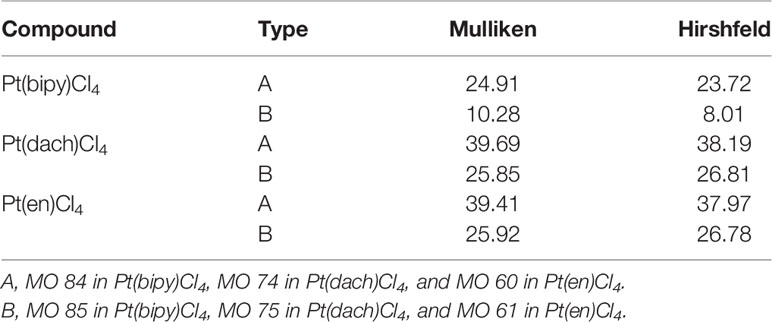
Table 10 Orbital delocalization index of Pt(dach)Cl4, Pt(bipy)Cl4, and Pt(en)Cl4 through the Mulliken method and the Hirshfeld method.
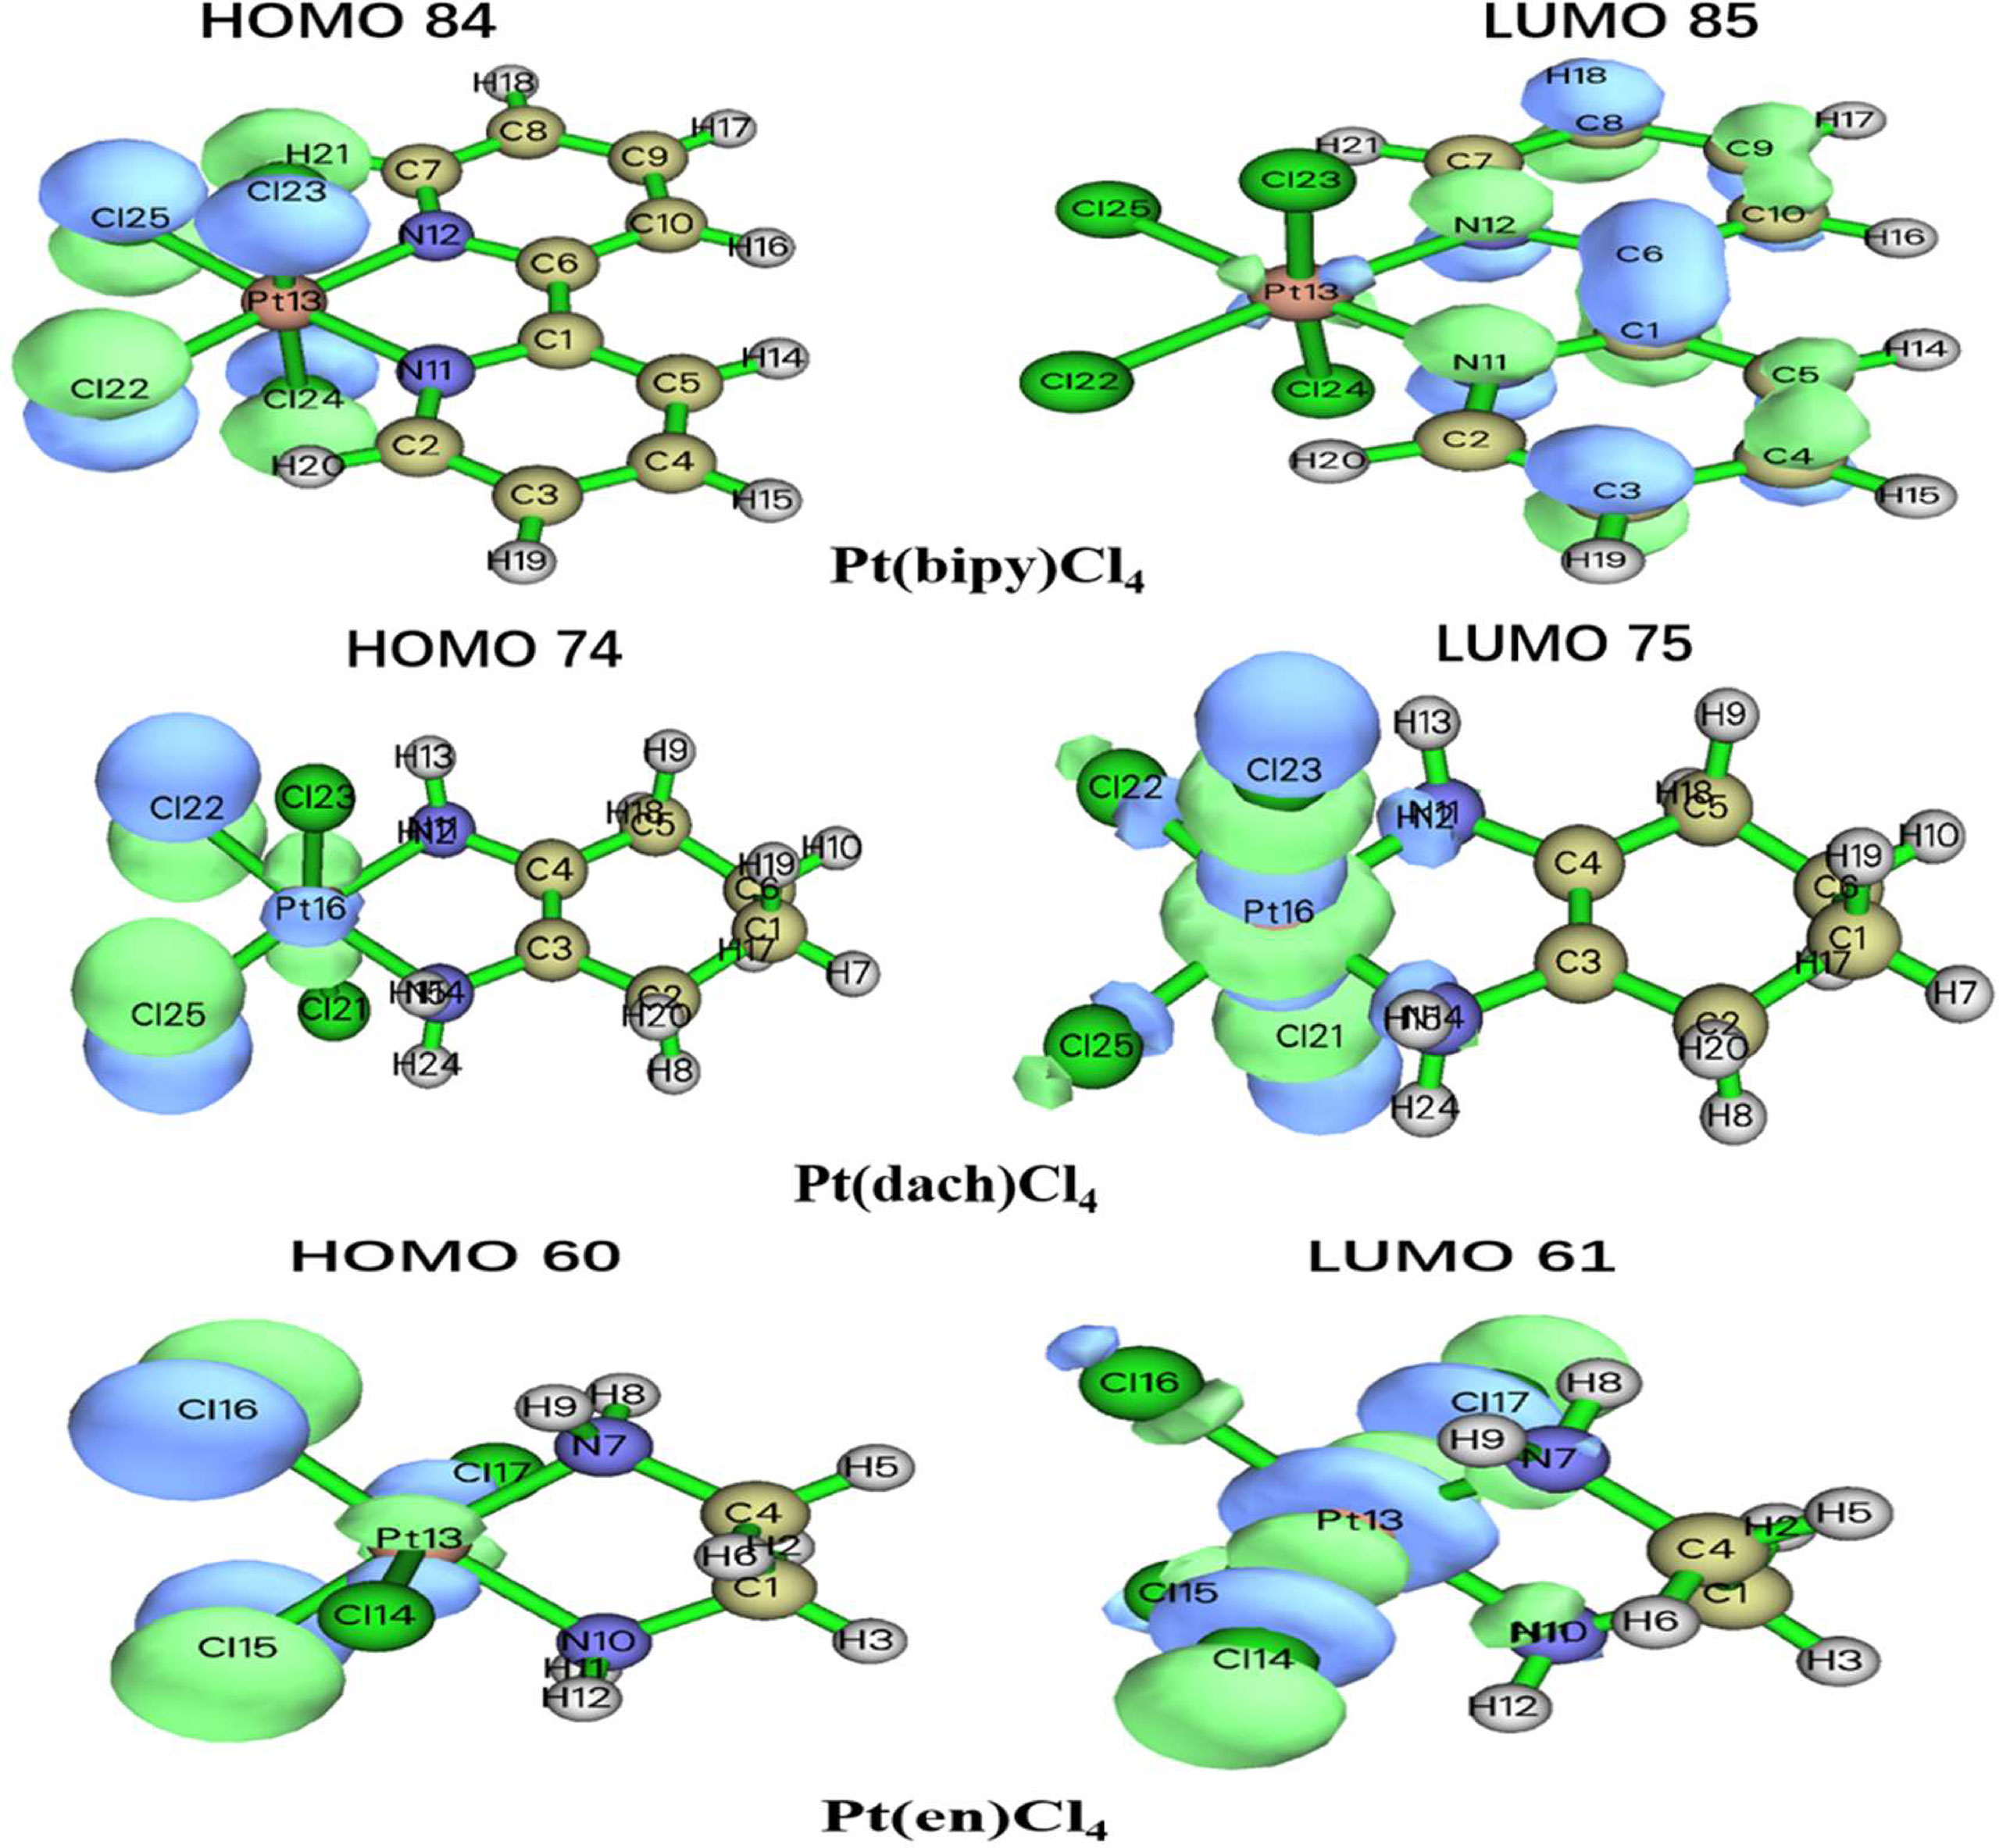
Figure 5 Orbital isosurface map of partial orbitals of Pt(bipy)Cl4, Pt(dach)Cl4, and Pt(en)Cl4.
By comparing the ODI values and orbital isosurface maps, it can be seen that the ODI value is indeed able to quantify the extent of orbital delocalization faithfully. HOMO 84, HOMO 74, and HOMO 60 show a partial delocalization character. Four Cl ions connected by the central Pt atom of each complex mainly and equally contribute to the orbital; therefore, their ODI is not quite high (41). Comparing the data obtained using the Mulliken method, the ODI of Pt(bipy)Cl4 is smallest in the three complexes (HOMO 84 = 24.91, LUMO 85 = 10.28). Comparing the data obtained using the Hirshfeld method, the ODI of Pt(bipy)Cl4 is smallest in the three complexes (HOMO 84 = 23.72, LUMO 85 = 8.01). Therefore, the HOMO and LUMO orbitals of Pt(bipy)Cl4 have strong delocalization.
Molecular Surface Electrostatic Potential Analysis
Molecular electrostatic potential is defined as the energy needed to transfer positive charges from an infinite distance to a point in the space around the molecule. Bonaccorsi et al. (43) first defined the electrostatic potential energy of molecules:
where Z and R represent the charge and position of the nucleus, respectively, and r represents the distance of a unit positive charge from a molecule that produces an electrostatic field (44). The molecular electrostatic potential is widely used to predict molecular nucleophilic sites, nucleophilic sites, and molecular recognition modes.
The molecular surface electrostatic potential can be expressed by a three-dimensional electrostatic potential diagram. The three-dimensional electrostatic potential diagram of the three complexes at the LSDA/SDD level is shown in Figure 6. The molecular surface positive electrostatic potential is shown in red, while the negative electrostatic potential is shown in blue. As shown in Figure 6, the Pt-Cl bond is mainly surrounded by the negative electrostatic potential, which means that this region has the ability to contribute electrons and nucleophilic properties. The C-H bond is mainly surrounded by the positive electrostatic potential; thus, this region has the ability to obtain electrons and electrophilic properties. Methods other than electrostatic potential cannot visually display the amphiphilicity of halogen-containing systems.
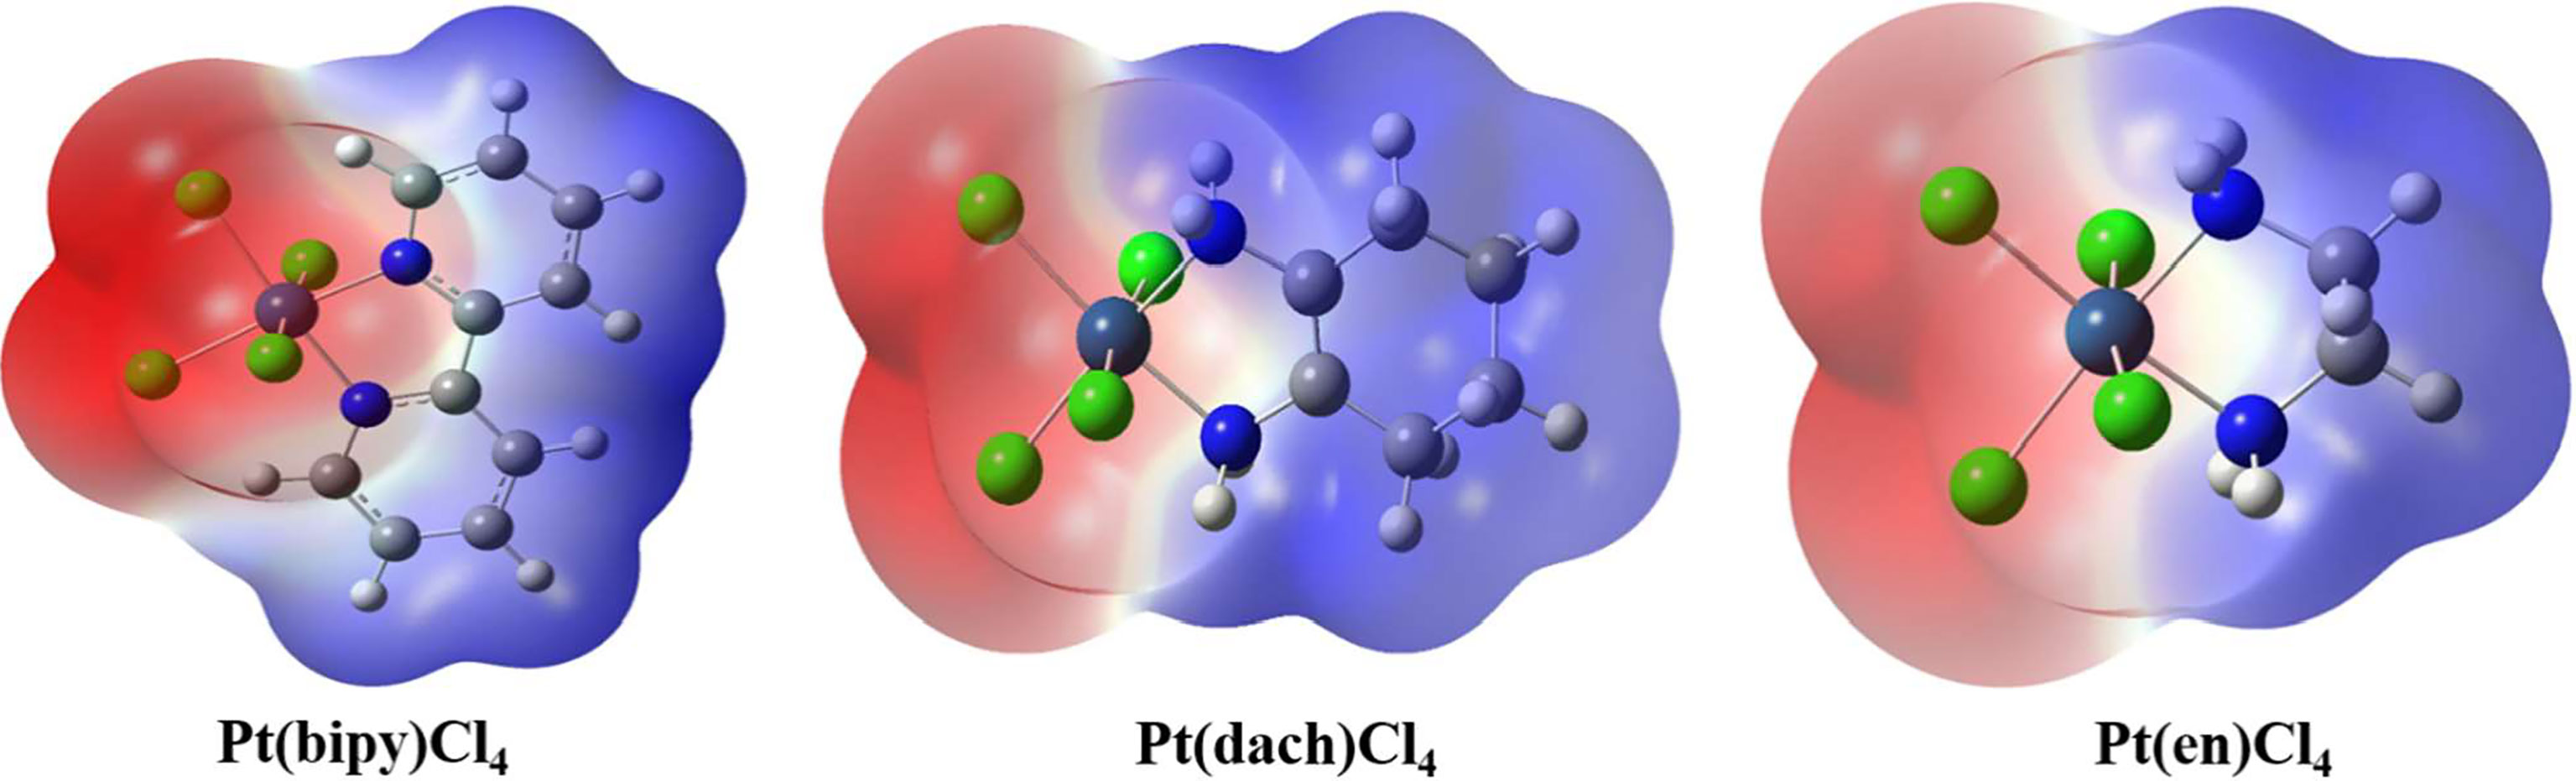
Figure 6 Three-dimensional electrostatic potential diagram of Pt(bipy)Cl4, Pt(dach)Cl4, and Pt(en)Cl4.
We used Multiwfn 3.8 to draw electrostatic potential contour maps of the three complexes in Figure 7. The black solid line and the dashed line in this figure represent the regions where the electrostatic potential is positive and negative, respectively. The bold blue line corresponds to the vdW surface (isosurface of electron density = 0.001 a.u., as defined by R. F. W. Bader). From the graph, it is clear that the Pt atom is overall positively charged, because the vdW surface close to the Pt atom largely intersects solid contour lines. For the same reason, we can see that Pt(en)Cl4 has more electrons in Pt and Cl atoms than Pt(bipy)Cl4 and Pt(dach)Cl4.
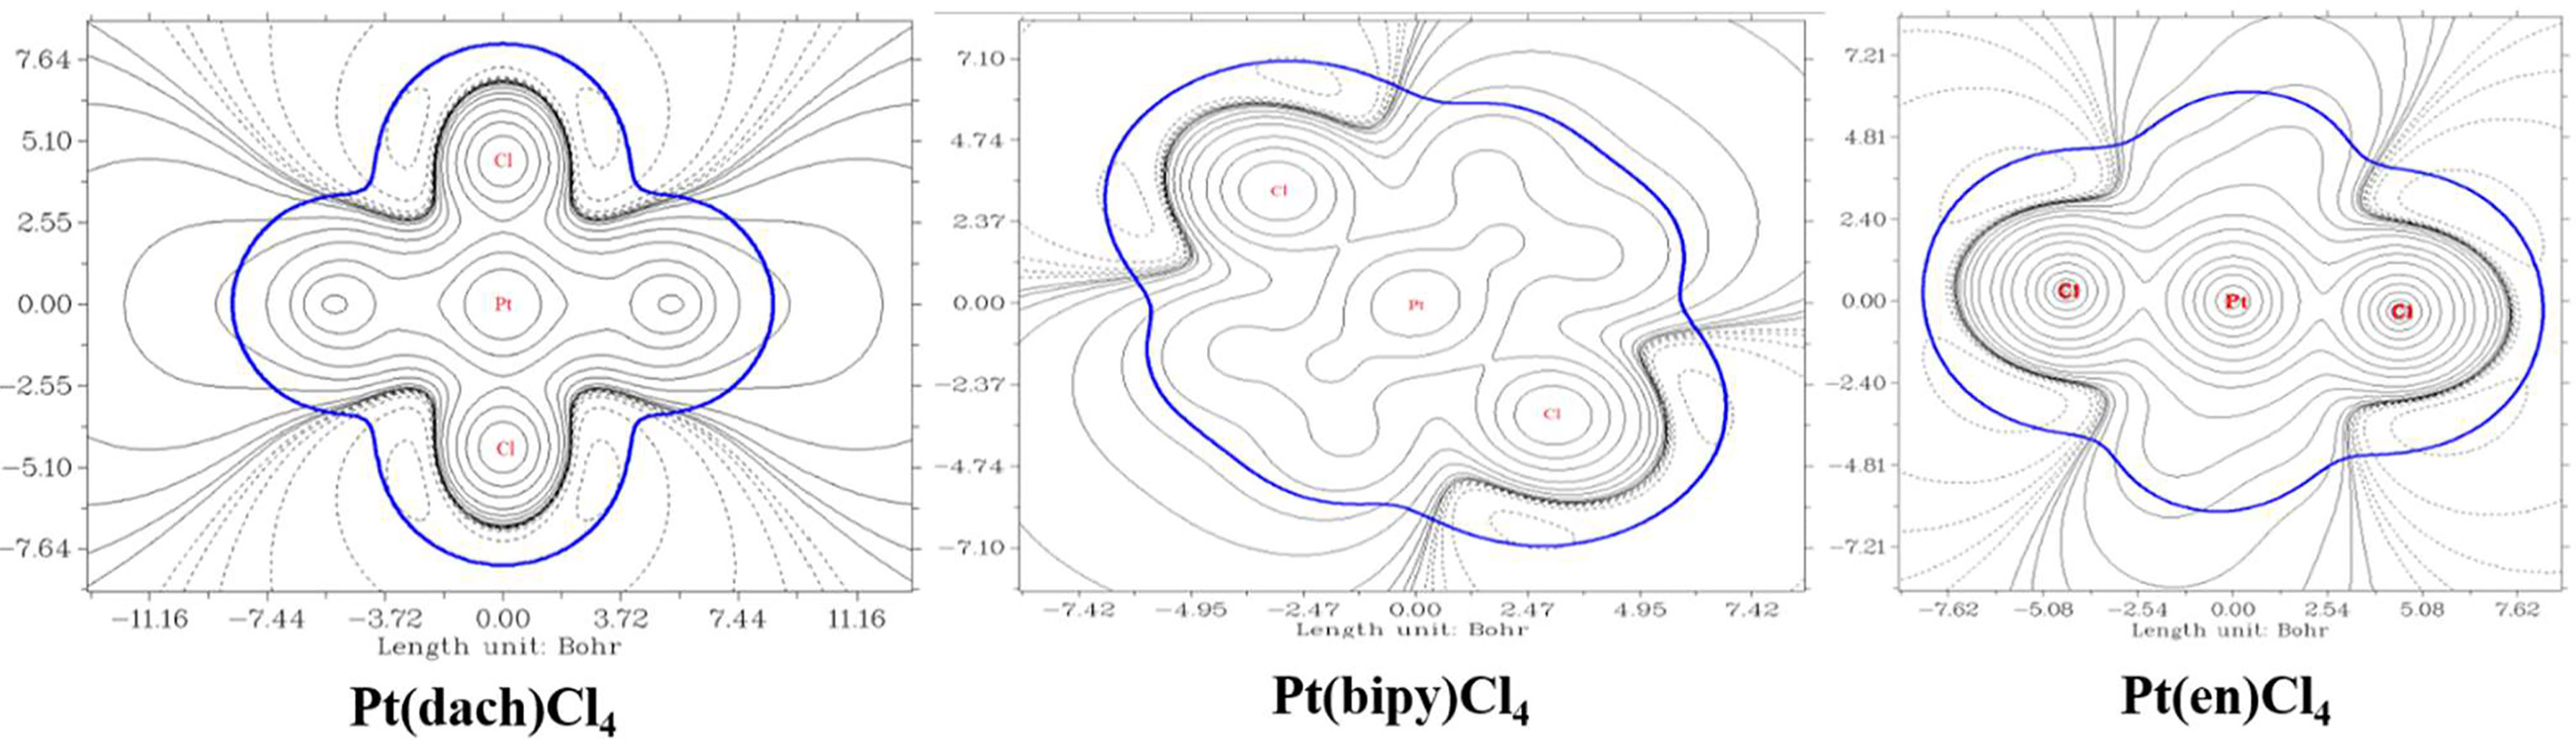
Figure 7 Electrostatic potential contour maps of Pt(bipy)Cl4, Pt(dach)Cl4, and Pt(en)Cl4.
Extreme point information of the molecular surface electrostatic potential (45) of the three complexes are shown in Tables 11–13. The surface electrostatic potential of Pt(bipy)Cl4 has 2 minimum points (minimum = −2.214701 eV) and 11 maximum points (maximum = 2.434223 eV); Pt(dach)Cl4 has 5 minimum points (minimum = −2.140967 eV) and 9 maximum points (maximum = 2.275112 eV); Pt(en)Cl4 has 3 minimum points (minimum = −2.029787 eV) and 8 maximum points (maximum = 2.373782 eV).
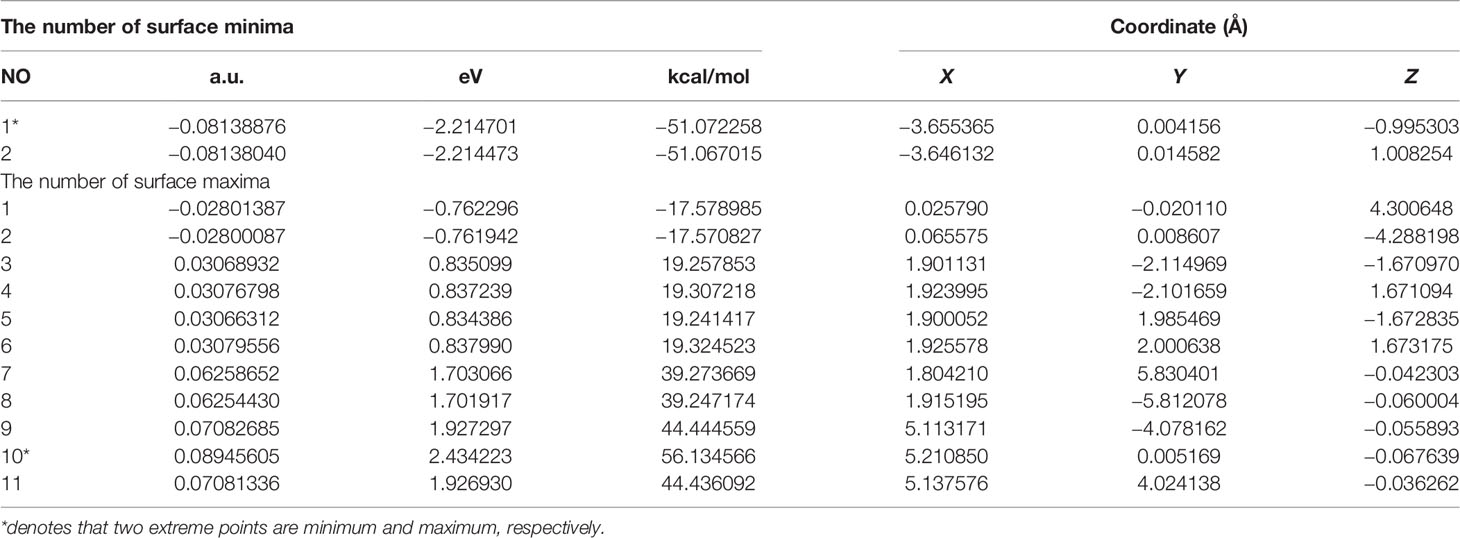
Table 11 Extreme point information of the molecular surface electrostatic potential of Pt(bipy)Cl4.
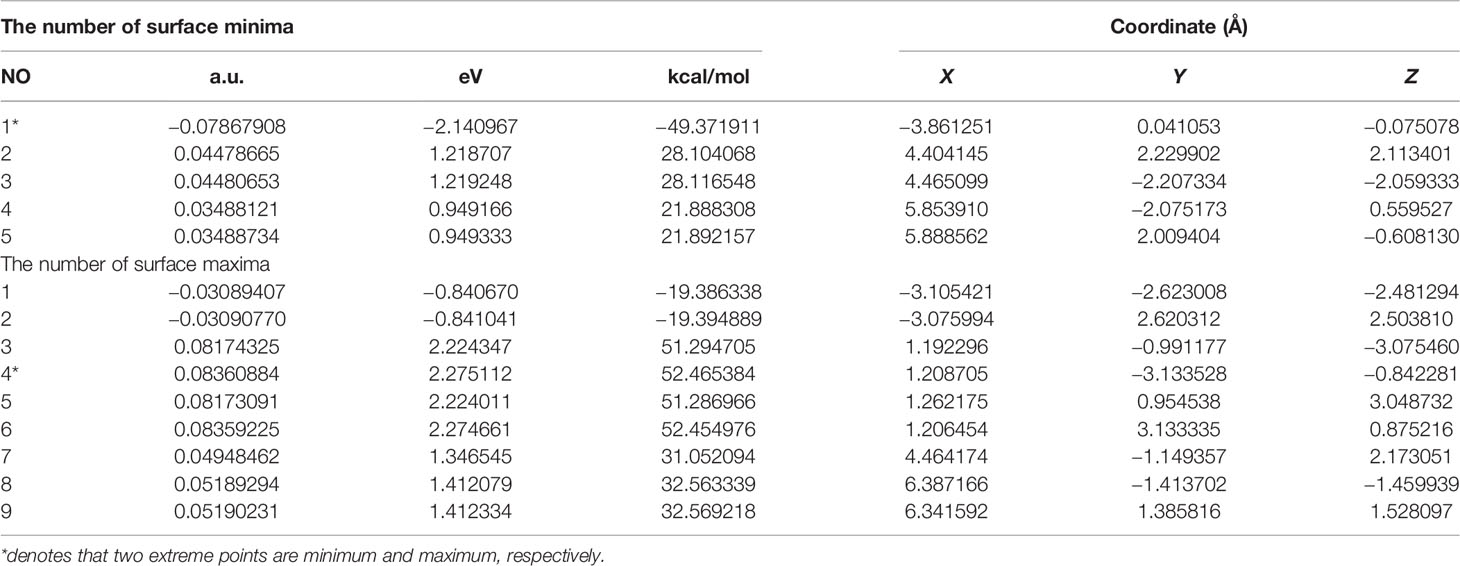
Table 12 Extreme point information of the molecular surface electrostatic potential of Pt(dach)Cl4.
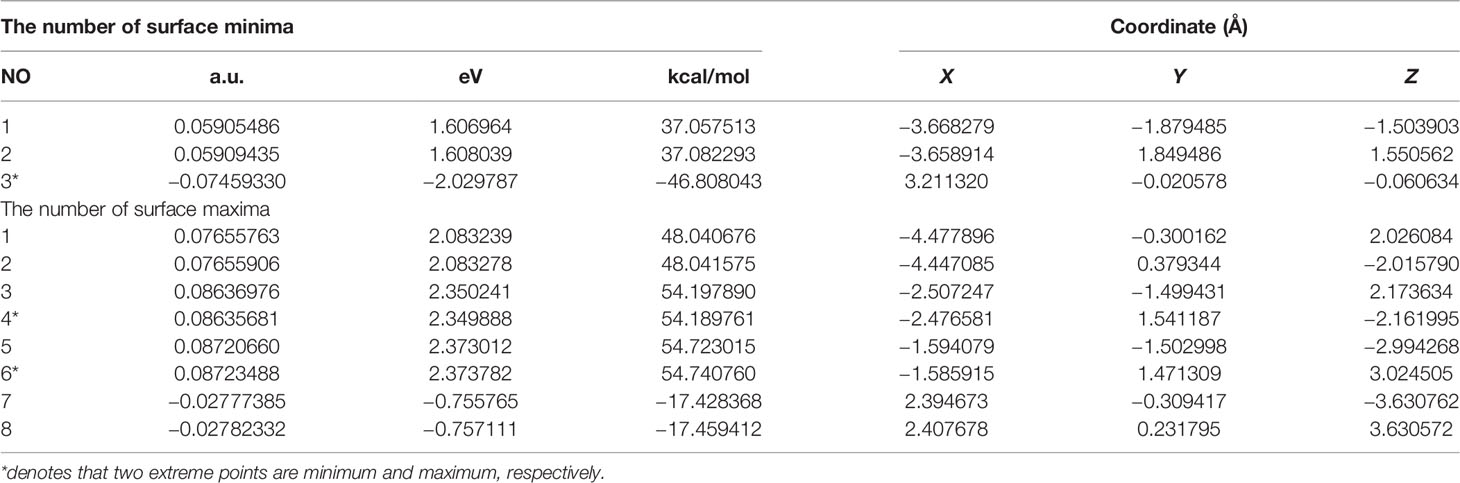
Table 13 Extreme point information of the molecular surface electrostatic potential of Pt(en)Cl4.
The extreme points around each complex are clearly shown in Figure 8. Red dots represent maximum points and blue dots represent minimum points. In Pt(bipy)Cl4, the maximum points of the surface electrostatic potential are distributed around the H atom because the electronegativity of the H atom is less than that of the C and N atoms. This is why the H atom in the system shows a positive charge. It can be seen from the position of the two minimum points and the area covered by the atomic sphere that the electrostatic potential of the molecular surface near the Pt and Cl atoms is negative. Therefore, the region of the Pt and Cl atoms is easily attacked by nucleophiles. In Pt(dach)Cl4 and Pt(en)Cl4, the region of the H atom connected with the N atom has a larger electrostatic potential and a stronger positive charge. This region leads to weak electronegativity in some parts connected with Pt and Cl atoms. The effect of these parts on the electrostatic potential is not obvious. This explains why the central Pt atom region of Pt(dach)Cl4 and Pt(en)Cl4 shows little electrophilicity. Due to the strong tension of the C-C bond, the minimum points of the surface electrostatic potential appear on the molecular surface near the C-C bond in Pt(dach)Cl4 and Pt(en)Cl4. Because the ring has a strong tension, the electron density aggregation region between C-C is “squeezed” out to some extent, not completely on the C-C bond. It is the negative contribution of this part of the electron density to the electrostatic potential that produces the minimum electrostatic potential on the molecular surface.
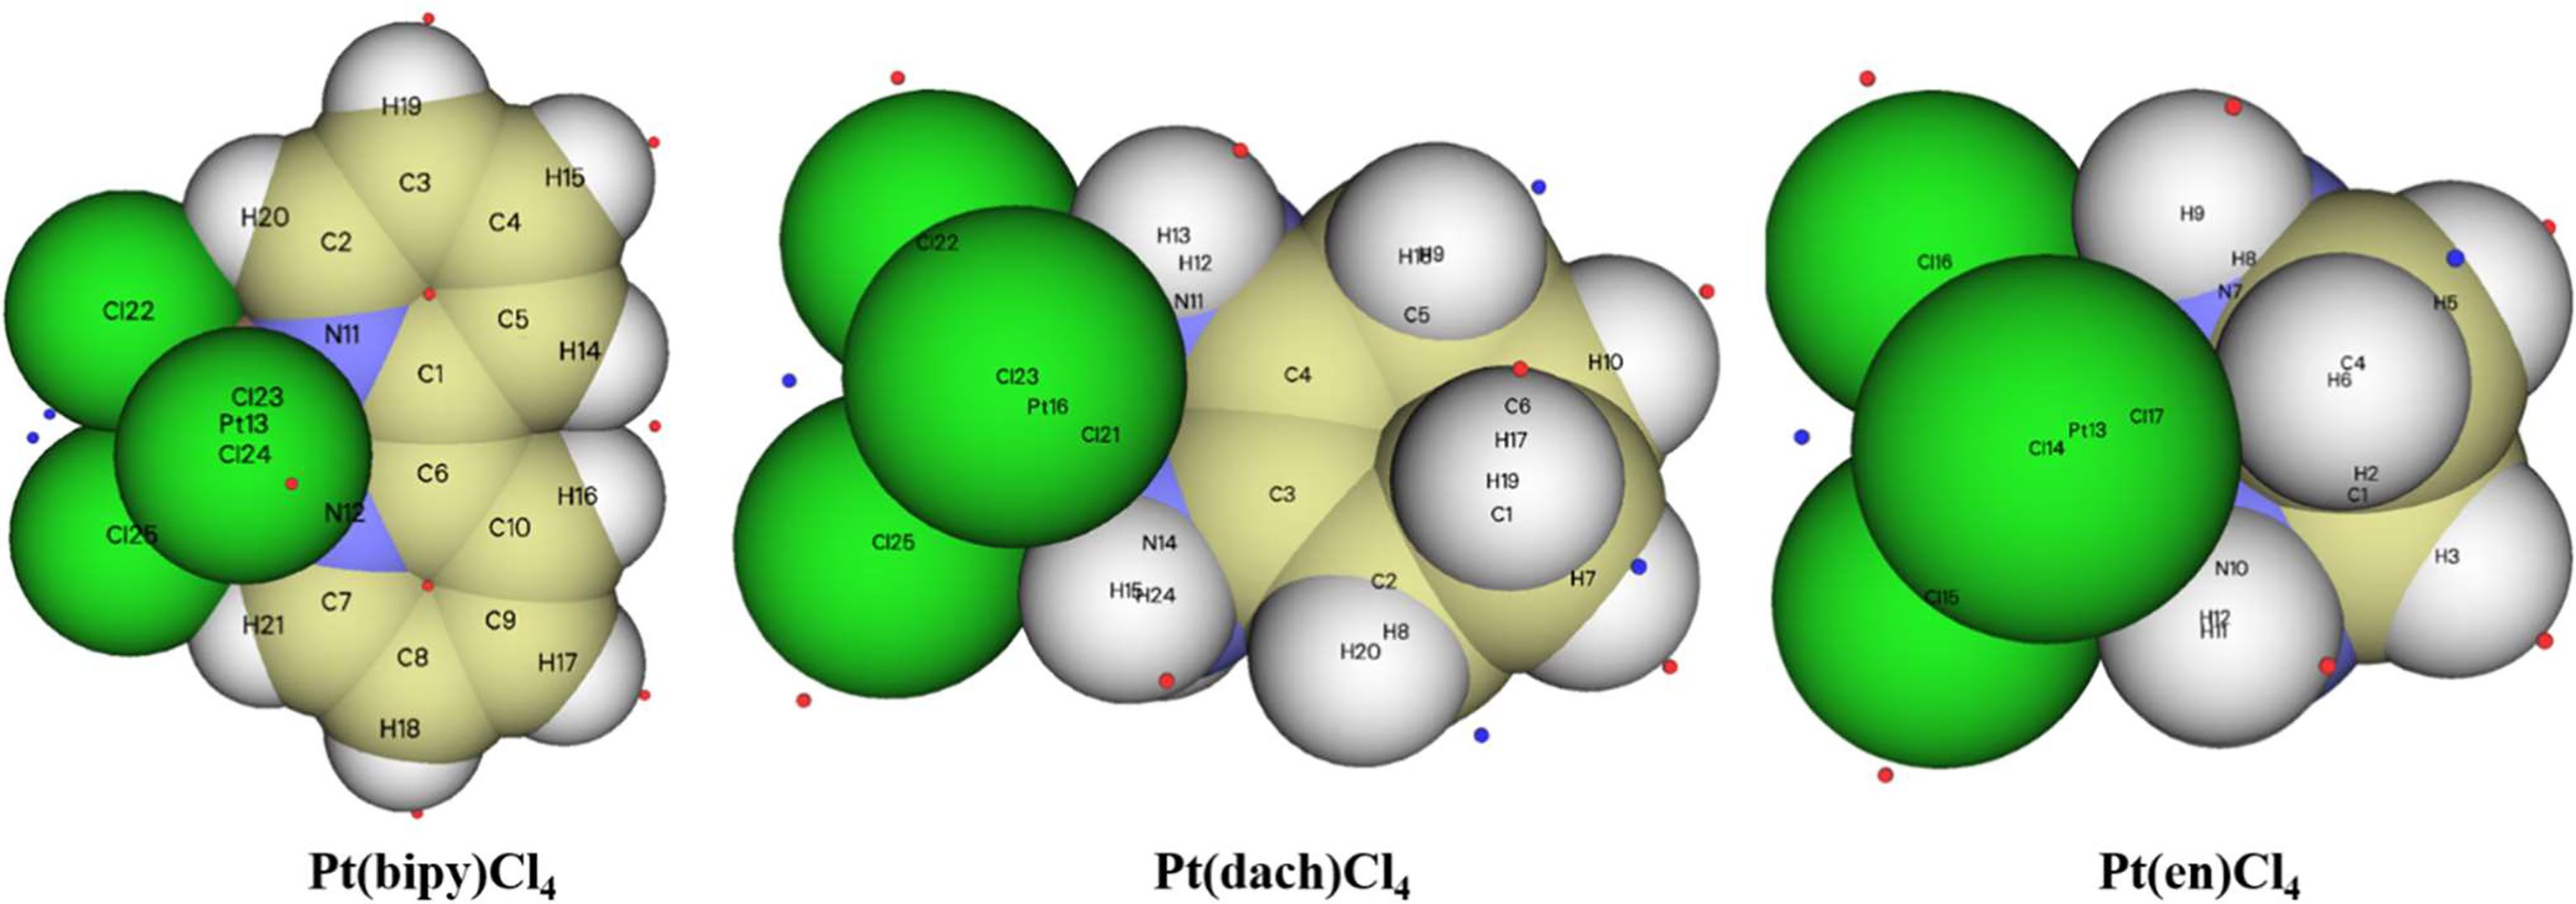
Figure 8 The extreme points of Pt(bipy)Cl4, Pt(dach)Cl4, and Pt(en)Cl4.
Shaded Surface Map With a Projection Effect of the Electron Localization Function and the Localized Orbital Locator Analysis
The Multiwfn 3.8 tool is used to analyze the electron-depleted region and the electron-rich region by LOL projection (26, 27). Schmider and Becke first explained that the Localized Orbital Locator (LOL) is a function that is used for locating localized high localization regions (26):
Where τ′(r) (dimensionless variable) is g0(r)/g(r). It always depends on the positive one-electron kinetic energy and is defined as
where Ψi(r) is the Hartree–Fock or the Kohn Sham orbital.
Sason Shaik et al. first defined the charge-shift bonds (46): When the atom binds, the kinetic energy of charge-shift bonds increases sharply and exceeds the reduction of potential energy caused by the reduction of atomic size. If atoms have lone pair electrons, kinetic energy increases more. During bonding, lone pair electrons increase kinetic energy by repulsion between lone pair electrons and bonding electrons. Therefore, the electrons in the bonding region balance the intense motion of the lone pair electrons near the atom by slower fluctuations between atoms. The LOL of Pt(bipy)Cl4, Pt(dach)Cl4, and Pt(en)Cl4 is plotted in Figure 9. The red color substantially reveals the high electron localization nature in the bonding regions. The degree of electron localization between Pt-Cl and Pt-N is not as high as the case of C-C and C-N bonds; this is a known feature of the “charge-shift bond” (47).
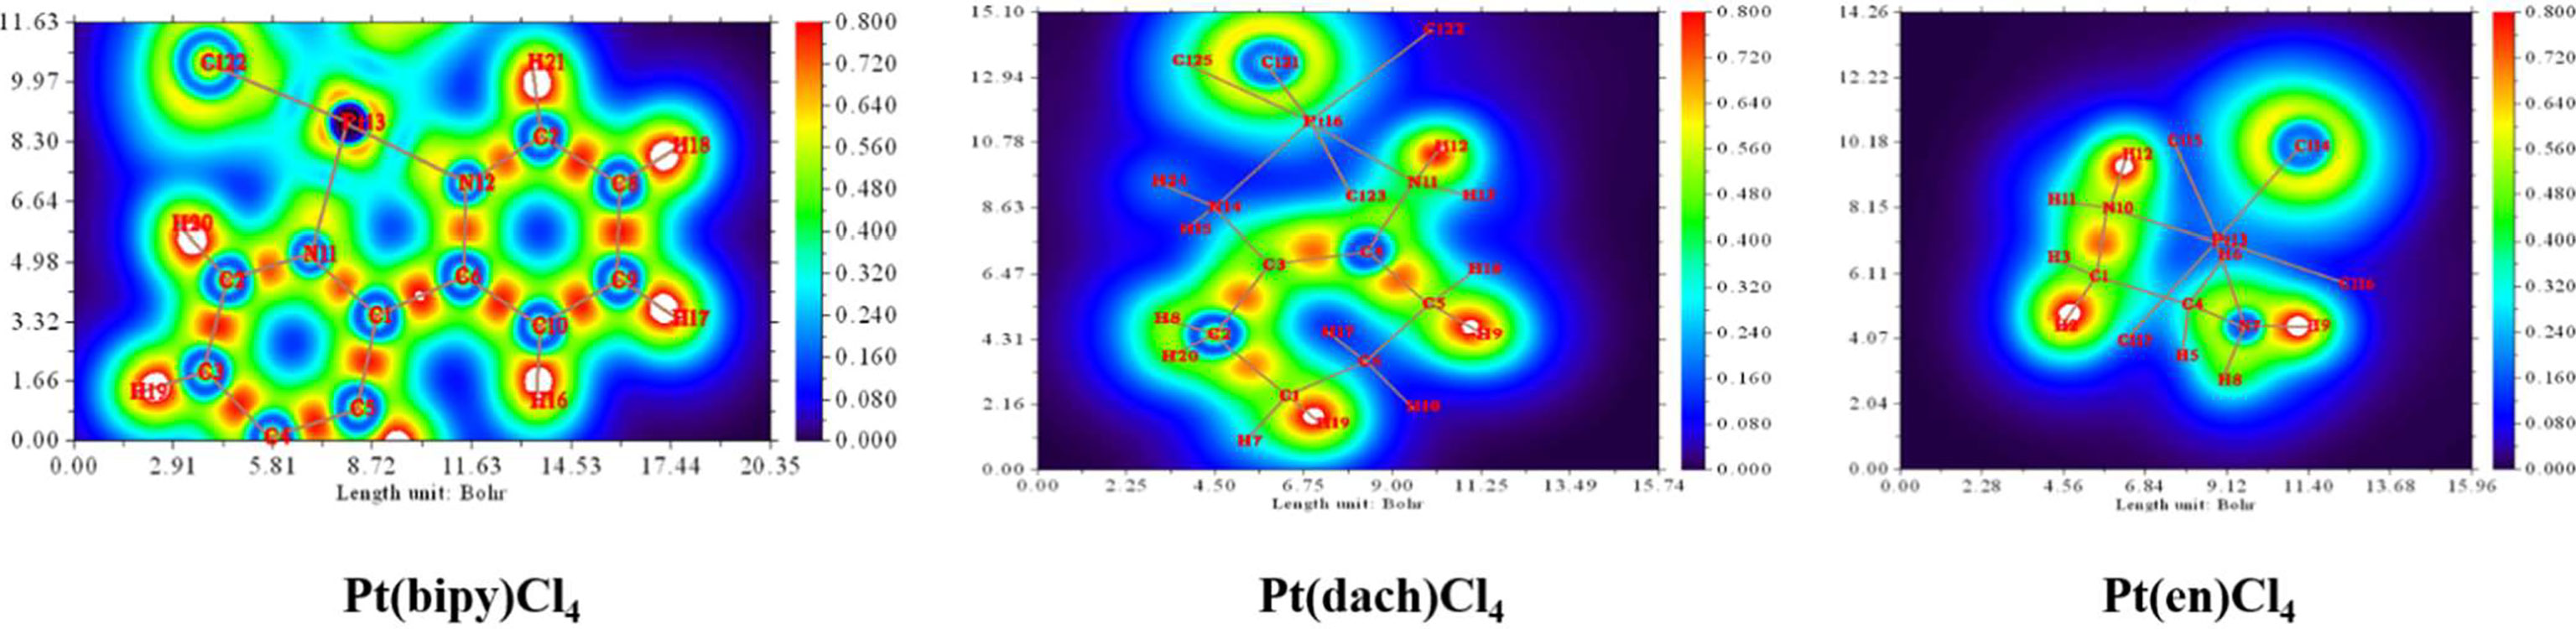
Figure 9 The localized orbital locator (LOL) of Pt(bipy)Cl4, Pt(dach)Cl4, and Pt(en)Cl4.
In a specific region, LOL represents the degree (strong or weak) of the limitation of the electronic movement. The shaded surface map with the projection effect of the electron localization function (ELF) of Pt(bipy)Cl4, Pt(dach)Cl4, and Pt(en)Cl4 is plotted in Figure 10. The high electron depletion region between the valence shell and the inner shell is represented by blue circles around the nucleus. Most of them appear in areas far from Pt atoms. The red-colored area represents the high localized electron regions. In order to stabilize the molecule, the electrons learn to localize on the outer side of the molecule. In Figure 10, we can see that electrons occupy the outside of the complexes and thus Pt(bipy)Cl4, Pt(dach)Cl4, and Pt(en)Cl4 are stabilized.
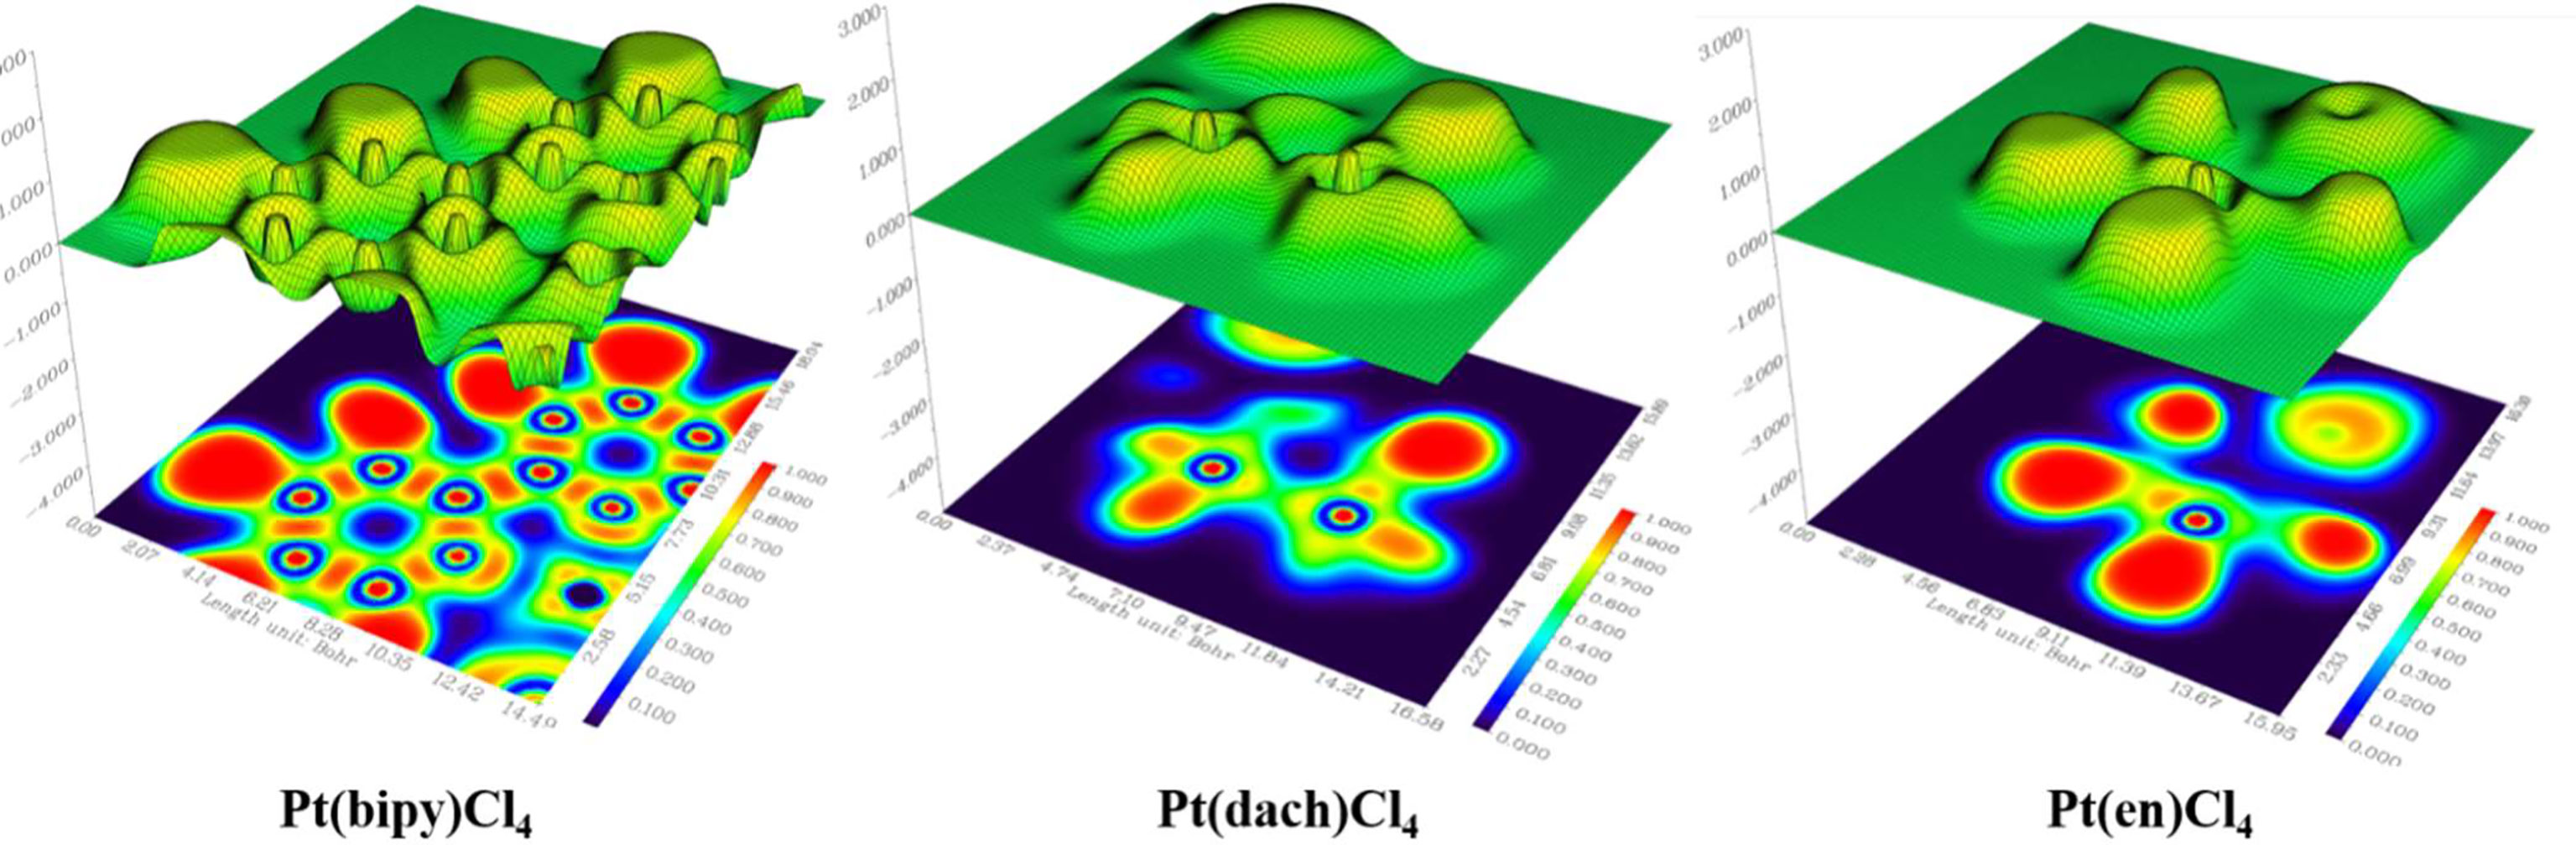
Figure 10 Electron localization function (ELF) of Pt(bipy)Cl4, Pt(dach)Cl4, and Pt(en)Cl4.
Conclusion
For Pt(bipy)Cl4, Pt(dach)Cl4, and Pt(en)Cl4, optimized structures, theoretical frequencies, infrared intensities, HOMO- and LUMO-related physical properties, natural atomic charges, electrostatic potential extreme points, and delocalization properties are studied. The bond length of Pt-N from short to long and the bond angle of Cl-Pt-Cl from small to large are negatively correlated with the reactivity. The bond angle of Cl-Pt-N from large to small is positively correlated with the reactivity. Pt(bipy)Cl4 is the most easily reduced and Pt(dach)Cl4 is the most difficult to reduce. The order of polarizability from large to small is Pt(bipy)Cl4 > Pt(en)Cl4 > Pt(dach)Cl4 and softness from large to small is Pt(bipy)Cl4 > Pt(dach)Cl4 > Pt(en)Cl4. Pt(bipy)Cl4 is better than Pt(dach)Cl4 in terms of toxicity and dose of the drug needed to treat cancer. The degree of electron delocalization between the anti-bonding donor and the anti-bonding acceptor of Pt(bipy)Cl4 is higher than Pt(dach)Cl4 and Pt(en)Cl4. Then, the HOMO and LUMO orbitals of Pt(bipy)Cl4 have a strong delocalization. ELF and LOL analysis prove that Pt(bipy)Cl4, Pt(dach)Cl4, and Pt(en)Cl4 are stabilized. Our study speculates that Pt(bipy)Cl4 has better anticancer properties than Pt(dach)Cl4 and provides theoretical basis for the development of subsequent drugs.
Data Availability Statement
The original contributions presented in the study are included in the article/supplementary material. Further inquiries can be directed to the corresponding author.
Author Contributions
XY contributed to the conception and design of the study and wrote the first draft of the manuscript. HG supported financial technical support. All authors contributed to manuscript revision, read, and approved the submitted version.
Funding
This work was financially supported by the Natural Science Foundation of Shandong, China (Grant No. ZR2019MC004), the High-end Talent Team Construction Foundation (Grant No. 108-10000318), and the High-end Full-time Innovative Talent Introduction Foundation “two-hundred plans” of Yantai.
Conflict of Interest
The authors declare that the research was conducted in the absence of any commercial or financial relationships that could be construed as a potential conflict of interest.
Publisher’s Note
All claims expressed in this article are solely those of the authors and do not necessarily represent those of their affiliated organizations, or those of the publisher, the editors and the reviewers. Any product that may be evaluated in this article, or claim that may be made by its manufacturer, is not guaranteed or endorsed by the publisher.
References
1. Guang HJ, Min PW, Yu SY. Theoretical Study on Electronic Structures and Medical Properties of Pt Complexes as Antitumor Drug. Chin Clin Pharmacol Ther (2000) 5(002):112–6.
2. Wong E, Giandomenico CM. ChemInform Abstract: Current Status of Platinum-Based Antitumor Drugs. onAcademic (1999) 09(99):2451–66. doi: 10.1002/chin.199948303
3. Hall MD, Dolman RC, Hambley TW. Platinum(IV) Anticancer Complexes. Metal Ions Biolog Syst (2004) 42:297–322. doi: 10.1201/b12414-9
4. Dasari S, Tchounwou PB. Cisplatin in Cancer Therapy: Molecular Mechanisms of Action. Eur J Pharmacol (2014) 740(1):364–78. doi: 10.1016/j.ejphar.2014.07.025
5. Kim J, Pramanick S, Lee D, Park H, Kim WJ. Polymeric Biomaterials for the Delivery of Platinum-Based Anticancer Drugs. Biomat Sci (2015) 07(07):1–16. doi: 10.1039/C5BM00039D
6. Wexselblatt E, Dan G. What do We Know About the Reduction of Pt(IV) Pro-Drugs? J Inorgan Biochem (2012) 117:220–9. doi: 10.1016/j.jinorgbio.2012.06.013
7. Lippard SJ, Suntharalingam K, Johnstone TC. The Next Generation of Platinum Drugs: Targeted Pt(II) Agents, Nanoparticle Delivery, and Pt(IV) Prodrugs. Chem Rev (2016) 16:3436–86. doi: 10.1021/acs.chemrev.5b00597
8. Varbanov HP, Goschl S, Heffeter P, Theiner S, Roller A, Jensen F, et al. A Novel Class of Bis- and Tris-Chelate Diam(M)Inebis(Dicarboxylato)Platinum(IV) Complexes as Potential Anticancer Prodrugs. J Med Chem (2014) 57(15):6751. doi: 10.1021/jm500791c
9. Ermondi G, Caron G, Ravera M, Gabano E, Osella D. Molecular Interaction Fields vs. Quantum-Mechanical-Based Descriptors in the Modelling of Lipophilicity of Platinum(IV) Complexes. Dalton Trans (2013) 42(10):3482–9. doi: 10.1039/c2dt32360e
10. Choi S, Filotto C, Bisanzo M, Delaney S, Lagasee D, Whitworth JL, et al. Reduction and Anticancer Activity of Platinum(IV) Complexes. Inorgan Chem (1998) 37(10):2500–4. doi: 10.1021/ic971047x
11. Imran M, Ayub W, Butler IS, Zia-ur-Rehman. Photoactivated Platinum-Based Anticancer Drugs. Coord Chem Rev (2018) 376:405–29. doi: 10.1016/j.ccr.2018.08.009
12. Grimme S, Antony J, Ehrlich S, Krieg H. A Consistent and Accurate Ab Initio Parametrization of Density Functional Dispersion Correction (DFT-D) for the 94 Elements H-Pu. J Chem Phys (2010) 132(15):154104. doi: 10.1063/1.3382344
14. Mu M, Gao H. Density Functional Study of Trans, Trans, Trans-[Pt (N3) 2 (OH) 2 (Py) 2] on Molecular Structure and Vibrational Spectroscopy. Spectrochim Acta Part A: Mol Biomolecul Spectrosc (2021) 261:120022. doi: 10.1016/j.saa.2021.120022
15. Lu F, Chen T. Multiwfn: A Multifunctional Wavefunction Analyzer. J Comput Chem (2012) 33(5):580–92. doi: 10.1002/jcc.22885
16. Hiraishi J, Nakagawa I, Shimanouchi T. Far Infra-Red Spectra and Force Constants of Ammine Complexes of Pt (IV), Pt (II) and Pd (Ii). Spectrochim Acta Part A: Mol Spectrosc (1968) 24(7):819–32. doi: 10.1016/0584-8539(68)80180-1
17. Frisch MJ, Trucks GW, Schlegel HB, Scuseria GE, Robb MA, Cheeseman JR, et al. Gaussian 09, Revision B.01. Wallingford: Gaussian Inc (2010).
19. Löwdin P-O. Quantum Theory of Molecular and Solids. Adv Phys (1956) 5(17):1–171. doi: 19/1.1970097
20. Vosko SH, Wilk L, Nusair M. Accurate Spin-Dependent Electron Liquid Correlation Energies for Local Spin Density Calculations: A Critical Analysis. Can J Phys (1980) 58(8):1200–11. doi: 10.1139/p80-159
21. Fuentealba P, Stoll H, Szentpaly LV, Schwerdtfeger P, Preuss H. On the Reliability of Semi-Empirical Pseudopotentials: Simulation of Hartree-Fock and Dirac-Fock Results. J Phys B Atom Mol Phys (1983) 16(11):L323. doi: 10.1088/0022-3700/16/11/001
22. Andrae D, Haeussermann U, Dolg M, Stoll H, Preuss H. Energy-Adjustedab Initio Pseudopotentials for the Second and Third Row Transition Elements. Theoret Chim Acta (1990) 77(2):123–41. doi: 10.1007/BF01114537
23. Reed AE, Weinhold F. Natural Bond Orbital Analysis of Nearhartree-Fock Water Dimer. J Chem Phys (1983) 78(6):4066–73. doi: 10.1063/1.445134
24. Reed AE, Curtiss LA, Weinhold F. Intermolecular Interactions From a Natural Bond Orbital, Donor-Acceptor Viewpoint. Chem Rev (1988) 88:899–926. doi: 10.1021/cr00088a005
25. Antony Danish AI, Jebasingh Kores BJ, Sasitha CT, Winfred Jebaraj CJ. DFT, NBO, HOMO-LUMO, NCI, Stability, Fukui Function and Hole – Electron Analyses of Tolcapone. Comput Theor Chem (2021) 1202:1–11. doi: 1016/j.comptc.2021.113296
26. Schmider HL, Becke AD. Chemical Content of the Kinetic Energy Density. J Of Mol Struct (2000) 527(1):51–61. doi: 10.1016/S0166-1280(00)00477-2
27. Schmider HL, Becke AD. Two Functions of the Density Matrix and Their Relation to the Chemical Bond. J Chem Phys (2002) 116(8):3184–93. doi: 10.1063/1.1431271
28. Pittalis S, Varsano D, Delgado A, Rozzi CA. Bonds, Lone Pairs, and Shells Probed by Means of on-Top Dynamical Correlations. Eur Phys J B: Conden Matter Complex Syst (2018) 91(8):1–7. doi: 10.1140/epjb/e2018-90143-4
29. Jovanovi S, Petrovic B, Bugarcic D, van Eldik R. Reduction of Some Pt(IV) Complexes With Biologically Important Sulfur-Donor Ligands. Dalton Trans (2013) 42(24):8890–6. doi: 10.1039/c3dt50751c
30. Aihara J. Reduced HOMO-LUMO Gap as an Index of Kinetic Stability for Polycyclic Aromatic Hydrocarbons. J Phys Chem A (1999) 103:7487–95. doi: 10.1021/jp990092i
31. Fukui K. The Role of Frontier Orbitals in Chemical Reactions. In: Frontier Orbitals and Reaction Paths: Selected Papers of Kenichi Fukui, vol. pp. Kyoto: World Scientific (1997). p. 150–70.
32. Taşal E, Kumalar M. Ab Initio Hartree-Fock and Density Functional Theory Investigations on the Conformational Stability, Molecular Structure and Vibrational Spectra of 5-Chloro-3-(2-(4-Methylpiperazin-1-Yl)-2-Oxoethyl)Benzo[D]Thiazol-2(3H)-One Drug Molecule. Spectrochim Acta Part A Mol Biomolecul Spectrosc (2012) 95:282–99. doi: 10.1016/j.saa.2012.04.081
33. Zhou Z, Parr RG. Activation Hardness: New Index for Describing the Orientation of Electrophilic Aromatic Substitution. J Am Chem Soc (1990) 112:5720–4. doi: 10.1021/ja00171a007
34. Rubarani Gangadharan P, Sampath Krishnan S. Natural Bond Orbital (NBO) Population Analysis of 1-Azanapthalene-8-Ol. Acta Physic Polonic A (2014) 125:18–22. doi: 10.12693/APhysPolA.125.18
35. Sidir I, Sidir YG, Kumalar M, Tasal E. Ab Initio Hartree-Fock and Density Functional Theory Investigations on the Conformational Stability, Molecular Structure and Vibrational Spectra of 7-Acetoxy-6-(2,3 Dibromopropyl)-4,8-Dimethylcoumarin Molecule. J Mol Struct (2010) 964(1-3):134–51. doi: 10.1016/j.molstruc.2009.11.023
36. Reed AE, Weinstock RB, Weinhold F. Natural population analysis. J Chem Phys (1985) 83(2):735–46. doi: 10.1063/1.449486
37. Glendening ED, Landis CR, Weinhold F. NBO 6.0: Natural Bond Orbital Analysis Program. J Comput Chem (2016) 34(16):1429–37. doi: 10.1002/jcc.23266
38. Szczepanik D, Mrozek J. Minimal Set of Molecule-Adapted Atomic Orbitals From Maximum Overlap Criterion. J Math Chem (2013) 51(10):2687–98. doi: 10.1007/s10910-013-0230-z
39. Sebastian S, Sundaraganesan N. The Spectroscopic (FT-IR, FT-IR Gas Phase, FT-Raman and UV) and NBO Analysis of 4-Hydroxypiperidine by Density Functional Method. Spectrochim Acta Part A Mol Biomolecul Spectrosc (2010) 75(3):941–52. doi: 10.1016/j.saa.2009.11.030
40. Chaitanya K. Molecular Structure, Vibrational Spectroscopic (FT-IR, FT-Raman), UV–vis Spectra, First Order Hyperpolarizability, NBO Analysis, HOMO and LUMO Analysis, Thermodynamic Properties of Benzophenone 2,4-Dicarboxylic Acid by Ab Initio HF and Density Functional Method. Spectrochim Acta Part A: Mol Biomolecul Spectrosc (2012) 86(5):159–73. doi: 10.1016/j.saa.2011.09.069
41. Tian L. Multiwfn Manual, Version 3.7(Dev), Section 4.8.5. China: Beijing Kein Research Center for Natural Sciences (2012).
42. Mo Y, Peyerimhoff SD. Theoretical Analysis of Electronic Delocalization. J Chem Phys (1998) 109(5):1687–97. doi: 10.1063/1.476742
43. Bonaccorsi R, Pullman A, Scrocco E, Tomasi J. The Molecular Electrostatic Potentials for the Nucleic Acid Bases: Adenine, Thymine, and Cytosine. Theoret Chim Acta (1972) 24(1):51–60. doi: 10.1007/BF00528310
44. Murray JS, Politzer P. The Electrostatic Potential: An Overview. Wiley Interdiscip Rev Comput Mol Sci (2011) 1(2):153–63. doi: 10.1002/wcms.19
45. Lu T, Chen F. Quantitative Analysis of Molecular Surface Based on Improved Marching Tetrahedra Algorithm. J Mol Graphics Modell (2012) 38:314–23. doi: 10.1016/j.jmgm.2012.07.004
46. Hiberty PC, Megret C, Song L, Wu W, Shaik S. Barriers of Hydrogen Abstraction vs Halogen Exchange?: An Experimental Manifestation of Charge-Shift Bonding. J Am Chem Soc (2006) 128(9):2836–43. doi: 10.1021/ja053130m
Keywords: DFT, IR spectroscopy, geometry optimization, HOMO and LUMO, natural bond orbital
Citation: Yan X and Gao H (2022) A Theoretical Study on the Medicinal Properties and Eletronic Structures of Platinum(IV) Anticancer Agents With Cl Substituents. Front. Oncol. 12:860159. doi: 10.3389/fonc.2022.860159
Received: 22 January 2022; Accepted: 13 April 2022;
Published: 19 May 2022.
Edited by:
Ran Su, Tianjin University, ChinaReviewed by:
Pogula Lakshmi Praveen, Veer Surendra Sai University of Technology, IndiaJesus Baldenebro-Lopez, Universidad Autónoma de Sinaloa, Mexico
Copyright © 2022 Yan and Gao. This is an open-access article distributed under the terms of the Creative Commons Attribution License (CC BY). The use, distribution or reproduction in other forums is permitted, provided the original author(s) and the copyright owner(s) are credited and that the original publication in this journal is cited, in accordance with accepted academic practice. No use, distribution or reproduction is permitted which does not comply with these terms.
*Correspondence: Hongwei Gao, Z2FvaG9uZ3czNjlAbGR1LmVkdS5jbg==