 Jingjin Zhu1,2†
 Jiahui Geng3†
 Wei Shan4†Boya Zhang1,2Huaqing Shen3Xiaohan Dong5Mei Liu6Xiru Li2*Liuquan Cheng5*
- 1School of Medicine, Nankai University, Tianjin, China
- 2Department of General Surgery, Chinese People’s Liberation Army General Hospital, Beijing, China
- 3Department of Neurology, Beijing Tiantan Hospital, Beijing, China
- 4Department of Neurology, Beijing Tiantan Hospital, Capital Medical University, Beijing, China
- 5Department of Radiology, Chinese People’s Liberation Army General Hospital, Beijing, China
- 6Department of Pathology, Chinese People’s Liberation Army General Hospital, Beijing, China
Importance: The utilization of artificial intelligence for the differentiation of benign and malignant breast lesions in multiparametric MRI (mpMRI) assists radiologists to improve diagnostic performance.
Objectives: To develop an automated deep learning model for breast lesion segmentation and characterization and to evaluate the characterization performance of AI models and radiologists.
Materials and methods: For lesion segmentation, 2,823 patients were used for the training, validation, and testing of the VNet-based segmentation models, and the average Dice similarity coefficient (DSC) between the manual segmentation by radiologists and the mask generated by VNet was calculated. For lesion characterization, 3,303 female patients with 3,607 pathologically confirmed lesions (2,213 malignant and 1,394 benign lesions) were used for the three ResNet-based characterization models (two single-input and one multi-input models). Histopathology was used as the diagnostic criterion standard to assess the characterization performance of the AI models and the BI-RADS categorized by the radiologists, in terms of sensitivity, specificity, accuracy, and the area under the receiver operating characteristic curve (AUC). An additional 123 patients with 136 lesions (81 malignant and 55 benign lesions) from another institution were available for external testing.
Results: Of the 5,811 patients included in the study, the mean age was 46.14 (range 11–89) years. In the segmentation task, a DSC of 0.860 was obtained between the VNet-generated mask and manual segmentation by radiologists. In the characterization task, the AUCs of the multi-input and the other two single-input models were 0.927, 0.821, and 0.795, respectively. Compared to the single-input DWI or DCE model, the multi-input DCE and DWI model obtained a significant increase in sensitivity, specificity, and accuracy (0.831 vs. 0.772/0.776, 0.874 vs. 0.630/0.709, 0.846 vs. 0.721/0.752). Furthermore, the specificity of the multi-input model was higher than that of the radiologists, whether using BI-RADS category 3 or 4 as a cutoff point (0.874 vs. 0.404/0.841), and the accuracy was intermediate between the two assessment methods (0.846 vs. 0.773/0.882). For the external testing, the performance of the three models remained robust with AUCs of 0.812, 0.831, and 0.885, respectively.
Conclusions: Combining DCE with DWI was superior to applying a single sequence for breast lesion characterization. The deep learning computer-aided diagnosis (CADx) model we developed significantly improved specificity and achieved comparable accuracy to the radiologists with promise for clinical application to provide preliminary diagnoses.
1 Introduction
Multiparametric magnetic resonance imaging (mpMRI) consisting of functional imaging techniques such as dynamic contrast-enhanced MRI (DCE-MRI) and diffusion-weighted imaging (DWI) is widely used for the screening, diagnosis, and preoperative evaluation of breast diseases (1–3). Several studies have demonstrated that mpMRI can provide complementary morphology and function data for the discrimination of benign and malignant breast tumors, significantly improving the diagnostic accuracy in breast cancer and reducing unnecessary breast biopsies of benign lesions (4–7).
However, mpMRI produced massive amounts of image data with a high spatial and temporal resolution, and radiologists face challenges in the correct interpretation (2, 8). Although the US Breast Imaging-Reporting and Data System (BI-RADS) lexicon provides a structured common language for interpretation and reporting, the defined rules for converting specific imaging features into a diagnostic category are not available (9). Most researchers employed multivariate logistic regression analysis to determine imaging features that jointly are associated with malignancy (6, 7, 10, 11).
With the advances in computer technology, extracting large amounts of data from medical images using automatic algorithms becomes more feasible (12, 13). In particular, deep learning (DL) algorithms based on convolutional neural networks (CNNs) for image analysis have achieved prominence for lesion characterization in breast MRI (14–16). The current methods always use manual annotation to identify and delineate lesions although it is a tedious and time-consuming process and leads to deviations in the presence of background parenchymal enhancement (BPE) (17–19).
Therefore, the purpose of our study was to develop a fully automated DL computer-aided diagnosis (CADx) model for breast lesion accurate segmentation and characterization. Firstly, using CNNs to segment the breast lesions from the DCE and DWI. Then, based on the segmentation results, we designed two single-input models using DCE and DWI as input sequences, respectively, and a multi-input model combining the two sequences to differentiate benign and malignant lesions and compare the performance of the AI models and the BI-RADS categorized by the radiologists. Finally, we collected data from another medical center to test the robustness of the proposed models.
2 Related works
DL is a type of machine learning with hundreds of deep layers of neural networks. Each layer learns to detect features of increasing complexity from the images and then combines lower-level features to form more abstract higher-level representational attributions or features to discover distributional features of the data (20). In contrast to traditional machine learning (ML) methods, DL can learn directly by navigating the data space without feature engineering and achieve an end-to-end result output (21). Consequently, more medical image research studies are focusing on DL methods, and such methods have outperformed most traditional ML methods. The study of DL in breast MRI mainly focuses on lesion detection and segmentation, characterization and classification, and radiogenomics.
2.1 Lesion identification and segmentation
Segmentation is a highly relevant task in medical image analysis. One of the earliest works was made by Cirean et al. (22). The network predicts the category label of each pixel by providing the local region (patch) around it as input. Due to a large number of overlapping patches, the network must run separately for each patch, leading to extremely slow operation. Furthermore, there is a trade-off between localization accuracy and the use of context. Subsequently, Ronneberger et al. (23) modified and extended the fully convolutional network architecture. The new network adopted a U-shaped architecture without any fully connected layers and used only the effective part of each convolution, i.e., the segmentation map contains only the pixels available in the full context of the input image. In addition, the authors preserved extensive feature map channels so that more information can flow into the final recovered segmented images, which allows the network suitable for fewer training images and produces more accurate segmentation. Up to now, UNet is always the basic network architecture for image segmentation tasks. Considering that diagnostic and interventional images in medicine are often volumetric, researchers further explored segmentation algorithms applicable to 3D images. Çiçek et al. (24) and Milletari et al. (25) designed 3DUNet and VNet, respectively, by replacing all 2D operations with corresponding 3D operations in UNet or adding a new loss layer specifically designed for the segmentation task based on Dice similarity coefficient (DSC) to UNet.
DCE-MRI includes the temporal acquisition of 3D volumes before and after intravenous injection of paramagnetic contrast agent, hence having four-dimensional data, which is essential for breast lesion analysis. The traditional UNet fails to capture temporal information. To overcome this drawback, Chen et al. (26) constructed a spatiotemporal network by modifying the standard U-shaped network and adding a novel convolutional long short-term memory (ConvLSTM) structure for extracting spatiotemporal information while preserving high spatial resolution. In addition, the 3TP UNet, which utilizes a three-time point approach to improve lesion segmentation performance, was proposed and optimized. Results showed that the network outperforms classical and some new deep learning methods with an average DSC exceeding 60%, laying the foundation for a protocol-independent approach (27, 28).
2.2 Lesion characterization and classification
Breast lesion diagnosis belongs to a classification task. At this clinical step, multiple breast modalities are often used and integration of the findings is required (29). Conventional MRI examinations perform direct diagnosis mainly on the basis of morphological features of breast lesions, while DCE-MRI is based on rapid scanning imaging sequences and uses pharmacokinetic models to determine the intra- and extravascular temporal intensity profiles of contrast agents and to analyze changes in perfusion, microcirculation, and capillary permeability at the lesion site. Thus, current clinical image analysis systems are mainly concerned with displaying enhanced regions and their voxel-by-voxel kinetic profiles and corresponding threshold levels.
Herent et al. (30) created a lesion feature model using a 50-layer residual neural network based on a single two-dimensional T1-weighted fat-suppressed MRI obtained after intravenous injection of gadolinium chelate selected by the radiologist, reaching a weighted mean area under the receiver operating characteristic (ROC) curve (AUC) of 0.816 on the independent challenge test set. Zhou et al. (31) and Antropova et al. (32) compared the diagnostic performance for benign and malignant categorization of lesions in DCE-MRI by radiomics analysis and CNN models based on ResNet50 and VGG19, respectively. Significant improvements in predictive performance in assessing the malignancy of lesions were observed in DL compared to handcrafted features. To optimize the structure of the CNN model, Hizukuri et al. (33) initially identified a baseline model from AlexNet, ZFNet, VGG16, and GoogLeNet in terms of the AUC. Afterward, the hyperparameters in the baseline model, such as the number of convolutional layers, the number of filters, and the size of the filters, were optimized using the Bayesian optimization with the Gaussian process. The model achieved high classification performance with accuracy, sensitivity, specificity, positive predictive value, and negative predictive value of 92.9%, 93.3%, 92.3%, 93.3%, and 92.3%, respectively. However, it should be noted that the model was designed only for the differential diagnosis of breast masses.
In addition, it has been investigated to incorporate dynamic and volumetric components of DCE-MRI into breast lesion classification using maximum intensity projection (MIP) images, and the results demonstrated that combining volumetric and dynamic DCE-MRI components can significantly improve CNN-based lesion classification (34, 35). For more comprehensive use of the information contained in MRI, some studies have explored the addition of DWI and T2-weighted volumes along with DCE-MRI to improve the specificity of clinical breast MRI protocols further (2, 36–39). However, the relevant studies employing DL methods are fewer.
2.3 Radiogenomics
Several state-of-the-art models, which exploit MRI images, have been developed for other purposes, such as differentiating the molecular subtypes of breast cancer and predicting breast cancer recurrence and pathologic complete response in patients receiving adjuvant therapy. Zhu et al. (40) investigated three different deep learning methods to conduct radiogenomic analysis of breast cancer: training from scratch, transfer learning, and off-the-shelf deep features. The best AUC performance was achieved by the off-the-shelf deep features approach with 0.65 (95% CI, [0.57, 0.71]). Another study applied a traditional CNN and a recurrent network using ConvLSTM. When the developed models were tested on an independent dataset, the accuracy was 0.4–0.5. Then, by re-tuning the models through transfer learning, the overall classification accuracy was improved by greater than 30% (41).
Assessing the efficacy of treatment is also an important clinical application of radiogenomics. It is expected to reveal the prognostic connection between imaging and patients by fusing imaging and genetic and pathological features. So far, there have been several attempts to develop CNN-based approaches with the objective of predicting pathological complete response (pCR) in breast patients using pretreatment MRI examinations, and the models all achieved an average AUC of more than 70% (42–45).
3 Materials and methods
This cross-sectional, retrospective, multicenter study was approved by the Ethics Committee of the Chinese People’s Liberation Army (PLA) General Hospital (No. S2019-093-01), and the requirement for individual consent was waived due to the retrospective nature of the analysis.
3.1 Study dataset
A total of 5,688 female patients undergoing breast mpMRI in the 1st Medical Center of PLA General Hospital from January 2011 to May 2020 were retrospectively enrolled. There were 2,823 patients who were randomly selected for training, validation, and testing of the segmentation model, and 3,303 patients with the original BI-RADS classification and pathological validation were used to train, validate, and test the characterization model (Figure 1). For the characterization task, the unit for the calculation and statistics was named “breast,” and each patient had two breasts. A breast is defined as benign if only benign lesions were present in it, malignant if only malignant lesions were present in it, or malignant if both benign and malignant lesions were co-existing in it. After excluding 48 lesions with an exhibited evident mismatch of location in the MRI report and surgery or biopsy or with a history of surgical intervention or other treatment prior to MRI examination, the study included 3,303 female patients with 3,607 pathologically confirmed lesions (2,213 malignant and 1,349 benign). Another 123 female patients with 81 pathologically confirmed malignant lesions and 55 benign lesions were collected from the 6th Medical Center from July 2020 to September 2021. The MRI protocol was attached to the Supplement.
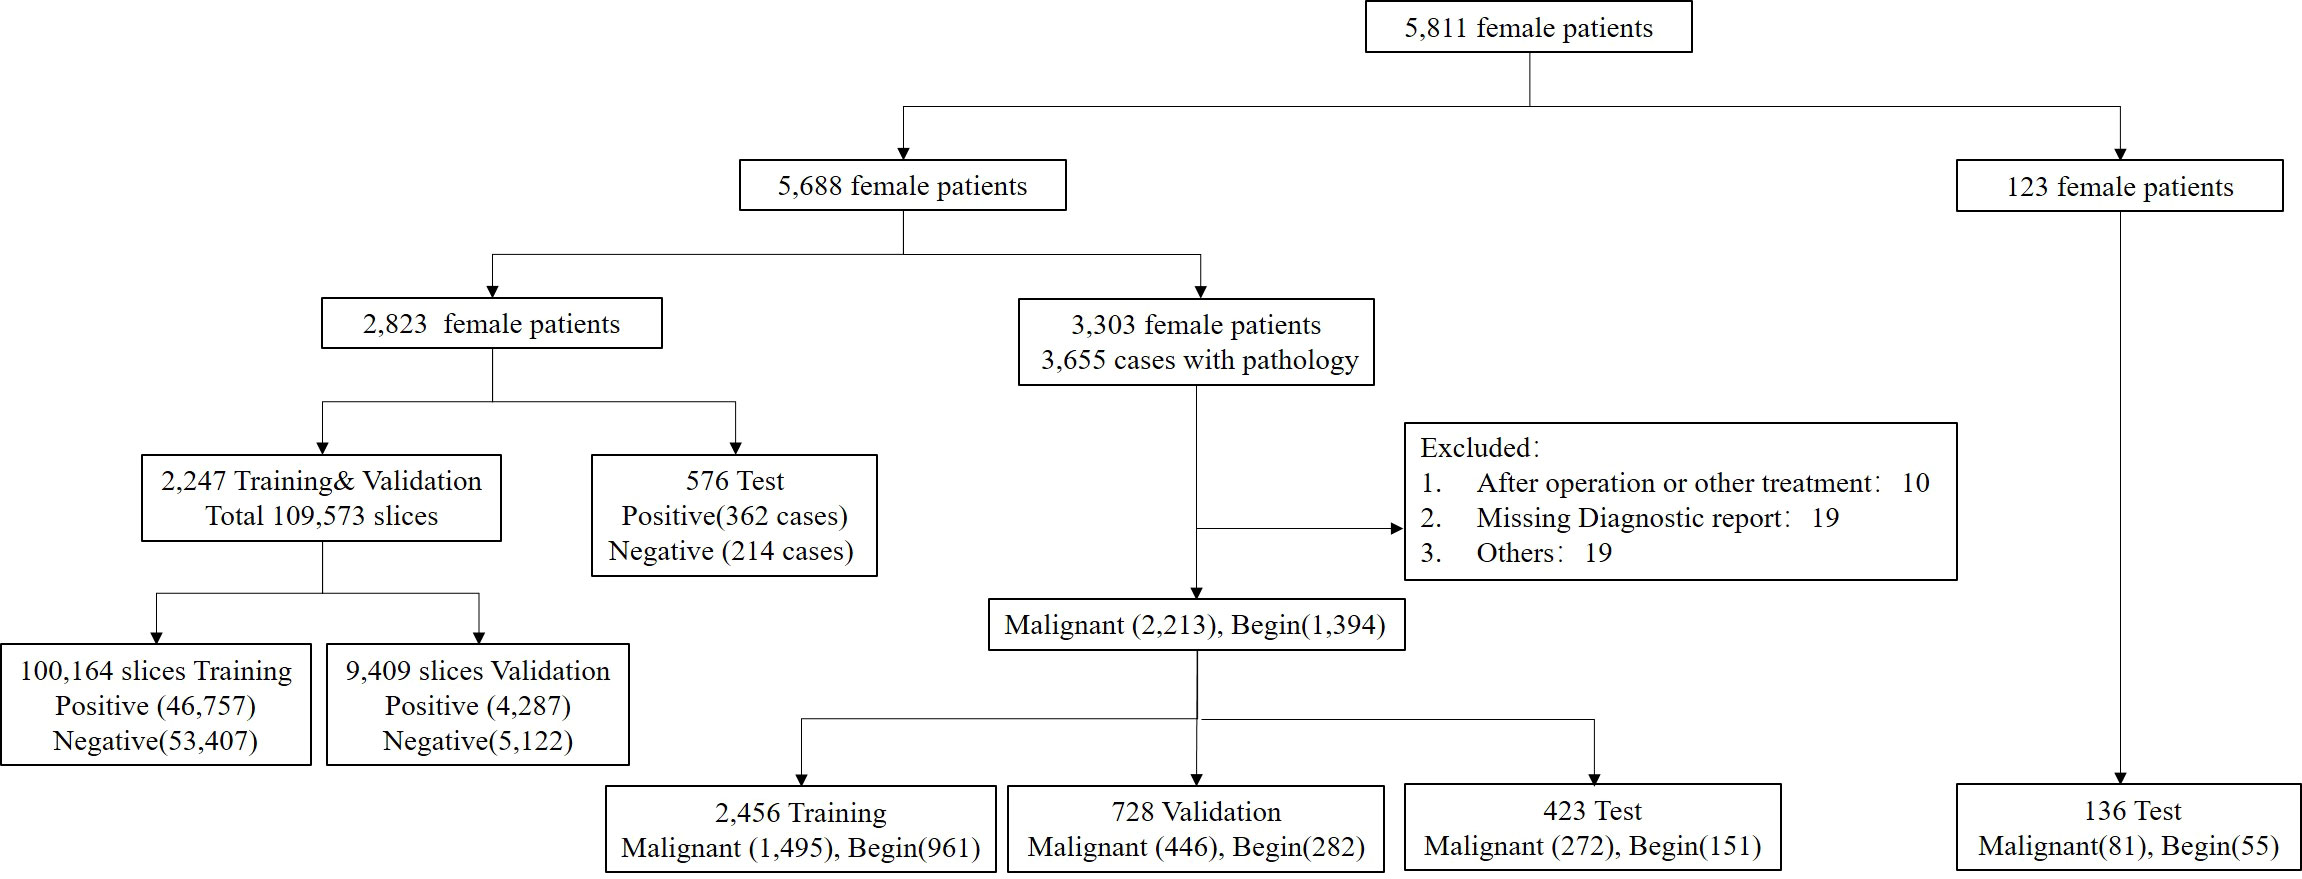
Figure 1 Flowchart of the final analysis cohort. A total of 5,811 patients were included in this study. A total of 5,688 patients within our institution were used for the segmentation and characterization model training, validation, and testing, and 123 patients from another institution were used for external testing of the proposed characterization model.
3.2 Deep learning system
The code implementations were in-house developments based on Python 3.6.8 (https://www.python.org), and the software modules numpy, scipy, pandas, and sklearn were utilized. Figure 2 summarizes the workflow of the DL algorithm, consisting of the following two steps: 1) imaging segmentation of breast lesions and 2) lesion characterization of benign and malignant.
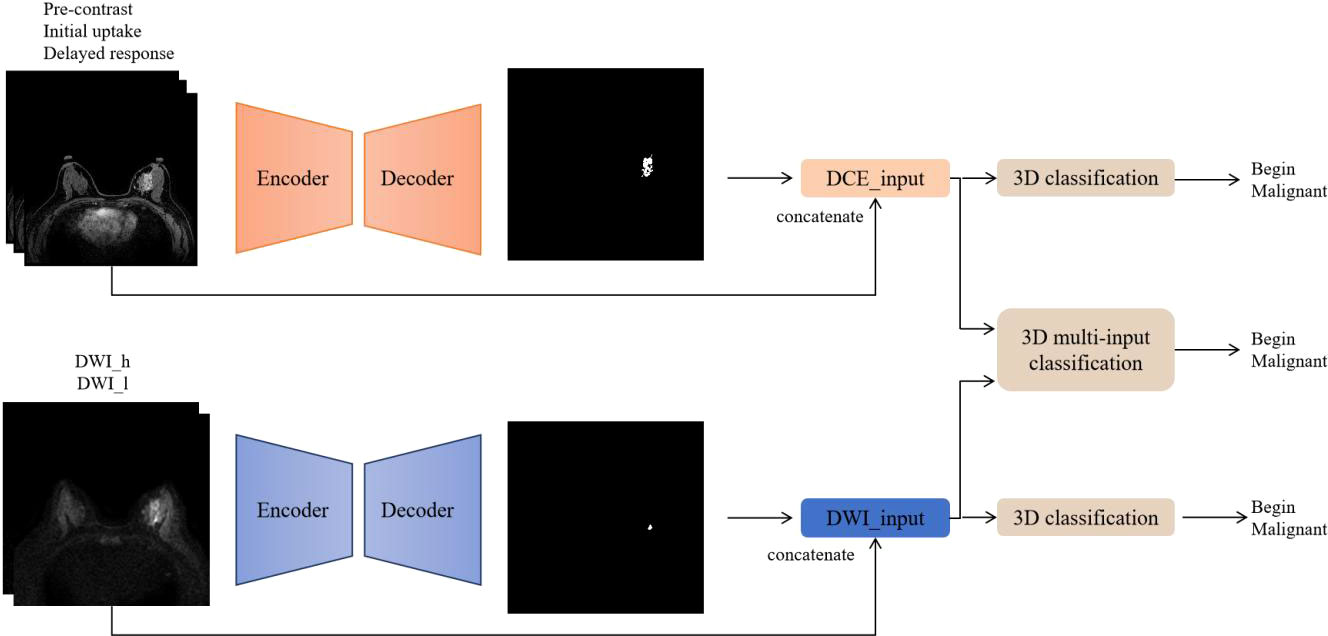
Figure 2 Flowchart of the deep learning algorithm. DCE and DWI were respectively input into the AI model to obtain lesion segmentation results and preliminary diagnosis. Then, the images from the two sequences were integrated and input into the 3D multi-input model to obtain the ultimate diagnosis.
3.2.1 Imaging segmentation of breast lesions
A 2D VNet framework was implemented for DCE imaging of lesion segmentation (23, 25). On DCE sequence, three phases, the precontrast, initial uptake, and 8–10 min delay, were selected as the input of the model, with the size of 512 * 512 * 3. Since the number of slices of DWI is less than that of DCE due to the influence of thickness, the segmentation model of DWI adopted the Attention-UNet (46). The high b-value and low b-value images of DWI were input into the network as different channels, with the size of 256 * 256 * 2. Both VNet and Attention-UNet used the same segmentation loss function. The loss function is a combination of binary cross-entropy (BCE) and DSC on each of the above four semantic levels, which is described as
where Yi is the ground truth and is the predicted probability for all the M pixels and the sums run over the N voxels of the predicted binary segmentation volume pi ∈P and the ground truth binary volume gi ∈G.
In the training set, 80 epochs in total with Adam optimization and a momentum of 0.9 were used. Due to the limitation of GPU memory, the batch size parameter was set to 16. The initial learning rate was 0.0001 and multiplied by 0.1 every 6 epochs. In the inference subset, a breast MRI volume can be segmented by processing it in a feedforward manner through the network. The output of the last convolutional layer, after sigmoid, consists of a probability map for background and foreground. The voxels having a higher probability (>0.5) that belong to the foreground than to the background are considered part of the anatomy.
3.2.2 Lesion characterization of benign and malignant
A 3D version of ResNet was implemented for lesion characterization (47). The final workflow schematic is shown in Figure 3. Considering that DCE contains more lesion information than DWI, 48 filters were set for DCE and 16 filters were set for DWI and then concatenated to form 64 filters. The network consists of 4 Residual blocks, and the basic block was repeated 3, 4, 6, and 3 times within the Residual blocks, respectively. The basic block consists of 3 * 3 * 3 convolution, Relu, Batch Normalization layer, and a shortcut connection. A single dense layer with a sigmoid activation function was used to generate the final likelihood values. To initialize the weight parameters of the network, He initialization was used (48). Since the models are easy to get overfitted and the scanning mode can be widely ranged among radiologists, to improve the generalization performance and robustness of our models, we changed the image orientation by implementing a combination of randomly flip and rotate on our input images as data augmentation. Flip is to turn over the images horizontally and vertically along the given axis, and rotation is to turn about the images around 90° along the specified axis. To optimize the weights, we used stochastic gradients with Adam momentum of 0.9. During training, we used a batch size of 12 and an initial learning rate of 0.001, divided by 10 after the 5th epoch.
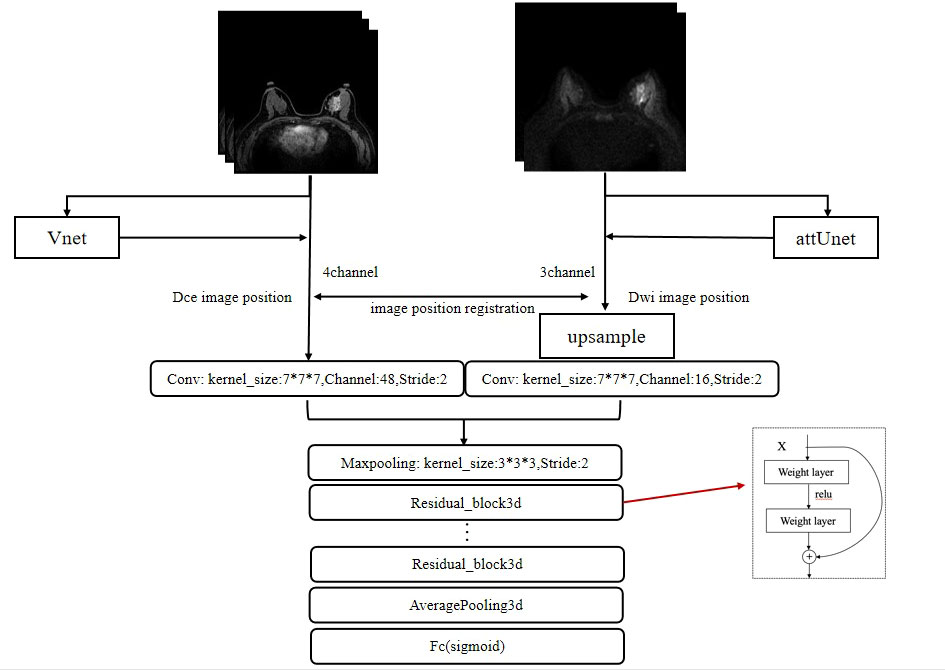
Figure 3 The framework for the segmentation of the breast images and the characterization of lesions. The whole framework is divided into two parts. The upper part represents the image segmentation process. By inputting images into the segmentation networks, such as VNet and attUNet, the mask of the breast region is obtained. By applying the mask to the input image, the breast lesion can be segmented. The following part represents the target characterization. The DCE and DWI sequences of the unilateral breast are input to the multi-input model to obtain the probability of malignancy.
To compare the effects of different sequences on the characterization of breast lesions, DCE, DWI, DCE and DWI, and their corresponding segmentation results were used as inputs to the model, respectively, and thus, two single-input models and one multi-input model were obtained. The images were organized into two categories and tested using the three learned models to obtain the benign or malignant labels. In addition, Grad-CAM, a visualization method, was used to create a heat map that highlights the essential parts of the input image that are considered important in each block for character distinction (49).
3.3 Statistical evaluation
For lesion segmentation, the manual segmentation results by the radiologist in DCE were defined as the ground truth, and the DSC was used to perform a quantitative comparison between the model and the ground truth (50).
For lesion characterization, histopathology was used as the diagnostic criterion standard to analyze the sensitivity, specificity, positive predictive value (PPV), negative predictive value (NPV), diagnostic accuracy, and ROC curves with AUCs of the models and radiologists. In assessing the performance of radiologists, the BI-RADS category was dichotomized. BI-RADS 2 and 3 were considered as benign and BI-RADS 4 and 5 were considered as malignant. Moreover, considering that BI-RADS 4 had a wide range of probabilities of malignancy, extending from greater than 2% to less than 95% (51), we decided to include such type of lesions as benign for reassessment. All statistical analyses were performed with Python 3.6.8 statistic modules. Standard deviations and confidence intervals were calculated by using bootstrap analysis with 100,000-fold resampling as in Litjens et al. (52). For clinical evaluation, the McNemar test was used to compare the categorical characterization results of the three models and radiologists with p-values <0.05 considered statistically significant.
4 Results
4.1 Study population and lesion characteristics
The internal dataset analysis cohort consisted of bilateral breast mpMRI datasets from 3,303 patients [mean age, 45.4 ± 11.3 years (standard deviation); range, 11–89 years] and 304 patients have bilateral breast lesions. In total, there were 3,607 enhancing lesions identified and segmented: 1,394 (38.6%) were benign and 2,213 (54.6%) were malignant. Detailed pathological information of the lesions included in the dataset is summarized in Table 1.
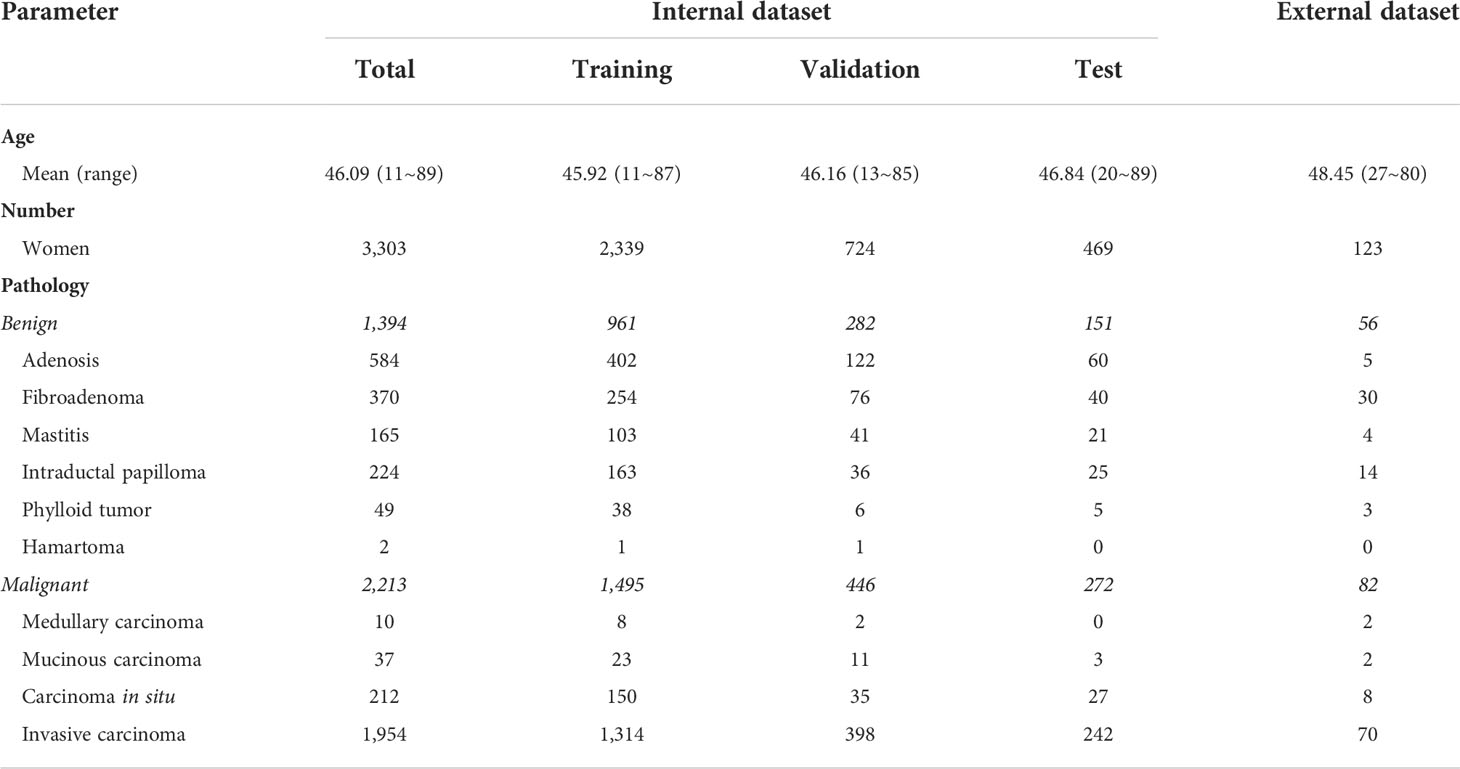
Table 1 The characteristics and pathological types of patients included in the study.
4.2 Imaging segmentation
In this section, we compare the segmentation method based on VNet with UNet and Attention-UNet. The VNet architecture achieved the highest DSC of 0.860 with precision and recall of 0.867 and 0.853, respectively. Furthermore, the statistical results of all comparison methods are summarized in Table 2. Figure 4 shows example images of the 2D breast lesion segmentation results, the masks produced by the VNet were quite similar to the region segmented manually, and significant structural details of the lesions were further preserved.

Table 2 The results of the segmentation models.
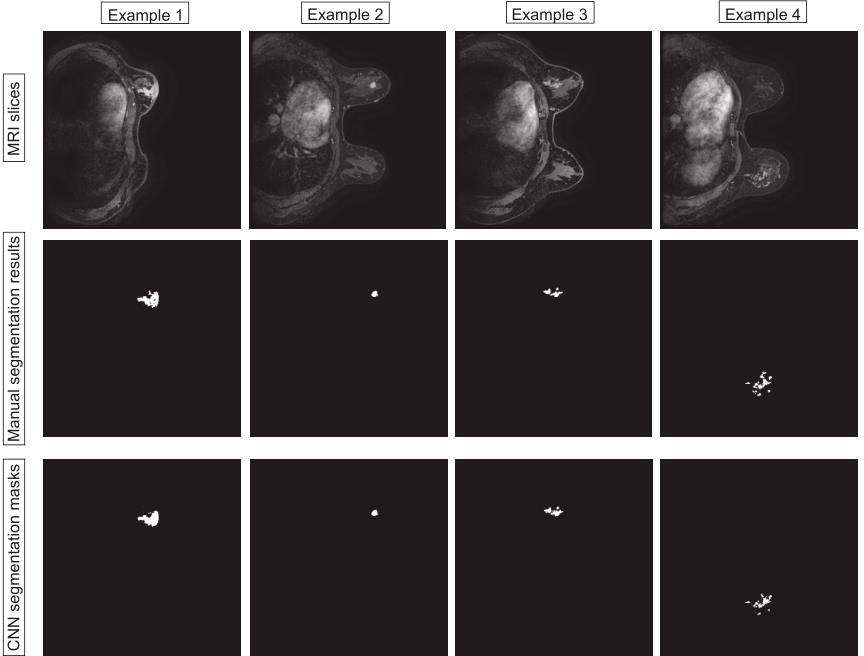
Figure 4 Examples of the 2D breast lesion segmentation results. Examples 1 and 2: the fibroglandular structure was dense and the lesions showed mass-like enhancement with an irregular lobulated pattern and hairy margins. Examples 3 and 4: the lesions showed non-mass-like enhancement with a distribution characterized by lobular segments and internal enhancement characterized by inhomogeneous string–ring-like and patch-like features, respectively.
4.3 Model visualization
Two malignant tumors and one benign tumor correctly diagnosed by the model were selected to visualize the regions of interest. From Figure 5, it can be observed that the heat maps generated from the Grad-CAM are able to locate the lesion areas with higher activations than normal areas, with deeper color indicating higher activation, which presented an intuitive interpretation of what the models have learned from the training data and proved the networks can be automatically driven to focus on the lesions.
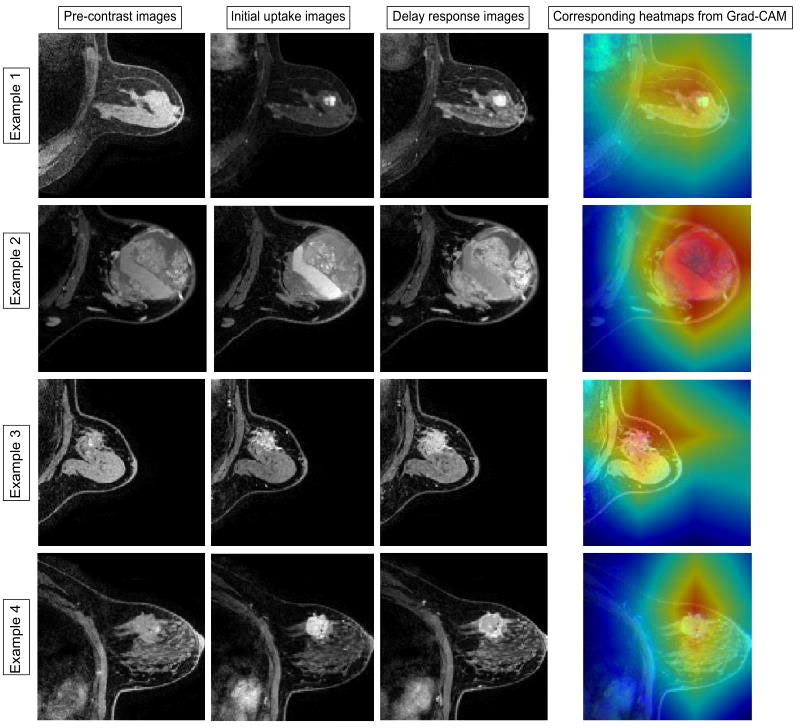
Figure 5 Examples of the attended regions through the Grad-CAM. The pathological types of the four cases were adenosis, benign lobular tumor, ductal carcinoma in situ, and invasive carcinoma. With the visual model display, the brighter area that contains lesion extent can be observed, demonstrating that the classification model can focus on the lesion area effectively.
4.4 Lesion characterization
The sensitivities, specificities, PPVs, NPVs, diagnostic accuracies, AUCs, and the corresponding 95% CI for the three models and radiologists are summarized in Table 3.
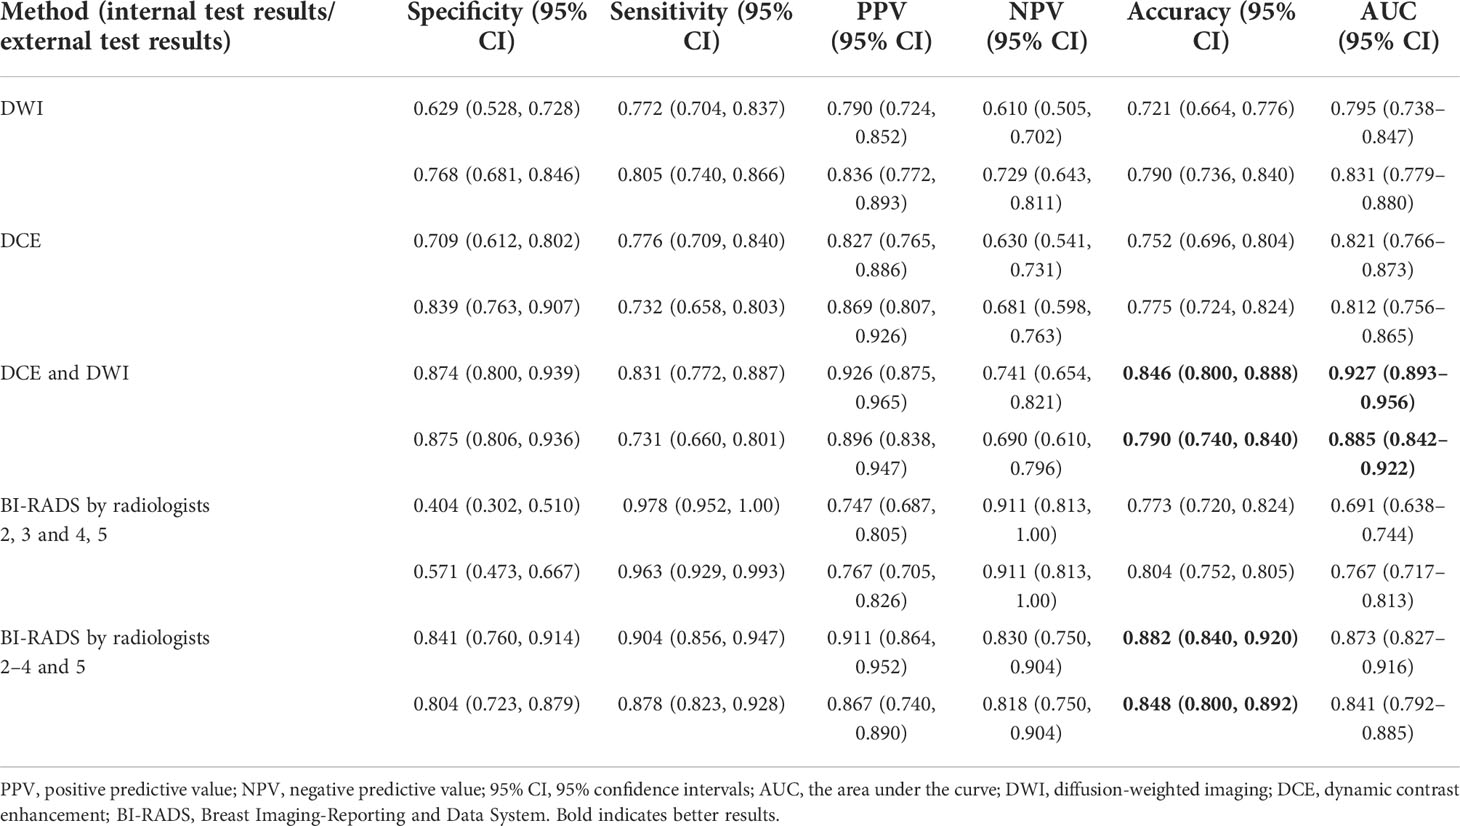
Table 3 The diagnostic performances of the characterization models and radiologists.
For the internal test, in the three models of single-input DWI or DCE and multi-input mpMRI, the overall accuracies were 0.721, 0.752, and 0.846, respectively. Compared with the other two single-input models, the multi-input model obtained the highest sensitivity of 0.831, specificity of 0.874, and accuracy of 0.846. In addition, by increasing the input sequence, the PPV of the model increased from 0.827 to 0.926 and the NPV increased from 0.630 to 0.741. For the external test, the single-input DWI and multi-input models were almost identical in terms of accuracy with 0.790, outperforming the single-input DCE of 0.775. The multi-input model achieved the highest specificity of 0.875, but the highest sensitivity was obtained by the single-input DWI model of 0.805.
The performance of the radiologists was also evaluated. When both categories 4 and 5 were classified as malignant, the sensitivity, specificity, and accuracy were 0.978, 0.404, and 0.773, respectively. When category 5 was classified as malignant, the sensitivity, specificity, and accuracy were 0.904, 0.841, and 0.882, respectively. Regardless of whether using BI-RADS category 3 or 4 as the cutoff point, radiologists had higher sensitivity with statistical significance than either of the models.
Further comparisons were performed to assess whether there are differences between the model and the radiologist’s characterization methods in clinical terms (Supplementary Table 1). There was no statistically significant difference between single-input DCE or DWI and multi-input mpMRI in the characterization results (p = 0.057, p = 0.260). Multi-input mpMRI and two classifications of diagnostic results by radiologists both have different results with higher detection rates by radiologists (p < 0.001, p = 0.003).
The ROC curves of the classification task in the three different models and radiologists are given in Figure 6. The multi-input model obtained the highest AUC values in both internal and external tests: 0.927 (95% CI, 0.893–0.956) and 0.885 (95% CI, 0.842–0.922), respectively.
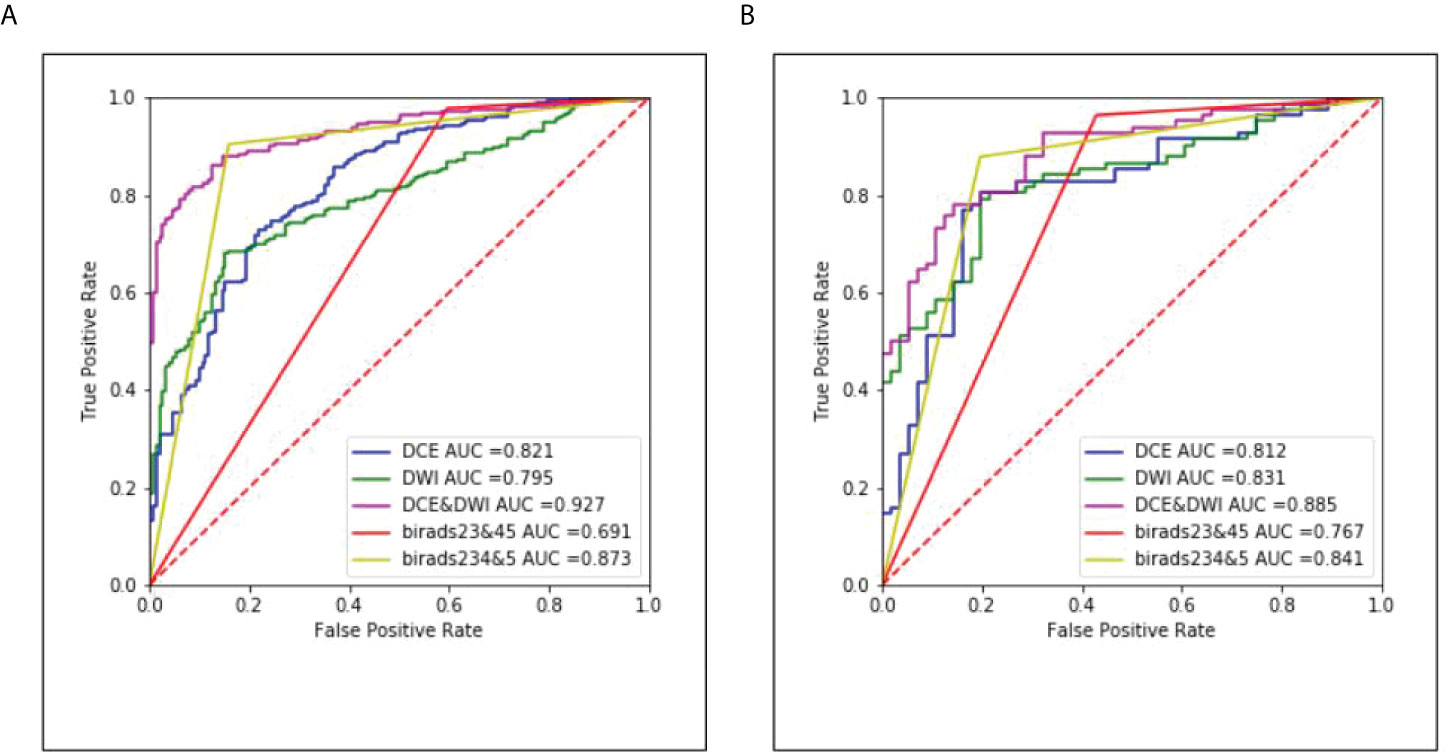
Figure 6 The corresponding ROC curves of the three different models and radiologists. (A) Results of the internal test set and (B) results of the external test set.
5 Discussion
In this study, we developed a CADx model, combining a VNet-based segmentation model and a ResNet-based classification model for implementing benign and malignant characterization of breast lesions in mpMRI. The multi-input model achieved the best classification performance with an accuracy of 0.846 and an AUC of 0.927, demonstrating the superiority of multiple sequences over a single sequence. Moreover, in comparison with the characterization results of the radiologists, it obtained a generally comparable accuracy while significantly improving the specificity.
Previous research studies have reported the usefulness of DL for diagnostic imaging of breast lesions with MRI (17, 18, 31, 53–55). Truhn et al. (18) constructed a deep residual neural network (ResNet18) for the characterization of enhancing lesions in MRI and achieved superior performance compared to radiomic analyses. In their study, the radiologist must first identify the lesion to make use of the system, yet this process may lead to detection errors. Zhou et al. (54) used the entire segmented breast as input to predict the presence of lesions inside. The main innovation was to localize the lesion, but their model could only detect lesions with a high probability of malignancy. In our study, two CNN models were firstly used to identify and segment lesions prior to diagnosis, reducing the time radiologists take to review images to locate lesions, especially for non-mass-like enhancements. We also compared the sample size and DSC with other relevant research on breast lesion segmentation (56–60). Maicas et al. (59) proposed a segmentation method that combined global inference in the continuous space with deep learning for the problem of breast mass segmentation from DCE-MRI and obtained a DSC of 0.77. The study of Zhang et al. (56) also included only mass-type lesions. The difference was that they customized a 3D model in addition to a 2D model to take advantage of the potential spatial information of MRI volume. Compared to the 2D model, the 3D model achieved slightly better performance in terms of the DSC on the same dataset. In order to integrate the advantages of 2D and 3D networks, Wang et al. (58) proposed a mixed 2D and 3D convolutional network with a multiscale context (M2D3D-MC) for lesion segmentation with 90 studies and obtained a DSC of 0.77. This method focused on 2D as well as 3D information, but due to the limitation of data, the result of the DSC was not very good.
Since our AI diagnosis system used a tandem of the segmentation model and the classification model, we used 2D slices from three temporal phases of DCE images and DWI images with different b-values for segmentation and input the results into the classification model, which not only had a much lighter computation and higher calculation speed but also effectively preserved 3D contextual information. Furthermore, our study included 2,247 cases with 100,164 slices. Despite differences in the training datasets and some heterogeneity of MRI parameters, our model achieved comparable DSC performance similar to the published methods and is well-accepted by radiologists.
Currently, DCE is most commonly used in AI diagnostic models (33, 35, 61, 62). The addition of other sequences, such as DWI, to obtain higher diagnostic specificity has also started to be explored (63–65). Dalmiş et al. (17) investigated a DL model with an mpMRI protocol combining DCE-MRI, T2, and DWI. Unlike us, they used the apparent diffusion coefficient (ADC) value obtained from DWI and applied random forest to integrate the results. In comparison, considering that lesion heterogeneity is insufficiently described by a single ADC threshold, our model used the DWI images to retrieve more detailed structural and functional features and trained only one model to input multisequences, accomplishing lesion characterization. Hu et al. (55) also employed a CNN to extract and pool low- to mid-level features and trained a support vector machine classifier on CNN features to distinguish benign and malignant lesions. Their method involved more manual intervention without implementing a complete end-to-end process. Our multi-input characterization model adopted the early fusion method to learn the shallow information of the two sequences of DCE and DWI and fused the two sequences to learn the deeper information in the later stage. Although this approach differs from previous methods, it proves to be more simple, accessible, and effective, showing comparable diagnostic performance to the radiologists.
It is worth noting that there were misdiagnosis cases, both by the AI model and radiologists. We examined the findings of mpMRI, the results of radiologists, and the pathological features of these cases.
For false-positive (FP) lesions, the main pathological types of lesions produced by the AI model are mastitis and intraductal papilloma. These benign lesions may occasionally show suspicious features on breast MRI, but generally do not require specific treatment with minimal risk of future cancer development (66). Of the 21 cases of mastitis, the model misdiagnosed 10 cases, while the radiologists included 17 cases as category 4 or 5, compared to a mild improvement. Of the 25 cases of intraductal papillomas, the model misdiagnosed 5 cases, 3 of which were associated with atypical ductal hyperplasia (ADH), a low-grade neoplastic intraductal hyperplasia with varying risks of progression (67). Therefore, it is reasonable to classify them as malignant and recommend biopsy or other treatments. Overall, the automatic classification yielded 19 false positives, 47 fewer than the radiologists, effectively improving diagnostic specificity.
For false-negative (FN) lesions, the pathological types of lesions produced by the AI model were invasive carcinoma, ductal carcinoma in situ, and mucinous carcinoma. Lesions of invasive carcinoma with a maximum diameter of less than 1 cm were more likely to be recognized as benign lesions. In some of the cases, radiologists could make a correct diagnosis, but the AI system overlooks the lesions. Several factors may explain the discrepancy. When two or more lesions present in the breast simultaneously, especially in the coexistence of benign and malignant pathologies, the model may give average results, leading to an underestimation of the malignancy. In addition, a few lesions are accompanied by swollen lymph nodes, but this factor was not considered in our study. Mammography has obvious advantages in detecting ductal carcinoma in situ with microcalcification (68–70). Radiologists can combine mammogram results and perform clinical breast examinations for suspicious lesions, hence a higher accuracy. Finally, for the missed diagnosis of mucinous carcinoma, our main consideration was the included data were so little that the model may not be comprehensive in learning the characteristics of such lesions.
To sum up, our results showed that the multi-input model is beneficial for BI-RADS category 4 lesions by proving additional specificity. Therefore, we suggest that the added value of the current multi-input model could be as an adjunct decision-supporting tool for lesions of lower clinical suspicion to make a confident diagnosis of benignity, thus obviating biopsy intervention. In addition, paying attention to the characteristics of FN lesions and comprehending the disadvantages of the CNN model based on the results of this study may help radiologists use this model effectively and improve their diagnostic performance possibly.
Furthermore, the technical variability of scanning imaging has also been studied through another institution and different MRI scanners. In this external test, we observed a decrease in performance in terms of AUC of 4.2% points. Through retrospective analysis of FN and FP results, the error modes are similar to those of the previous internal test set. Therefore, we concluded that the model was robust and the decrease in its effectiveness was mainly due to the selection bias of the data. In the external dataset, the DWI single-input model showed an increase in AUC from 0.71 to 0.76 compared with the DCE. We attributed it to the fact that the DWI images in the external dataset were obtained with the b-value set to 1,000 s/mm2, resulting in a reduced image signal-to-noise ratio and better sharpness compared to the partial DWI images in the internal dataset with a b-value of 800sec/mm2.
It is important to acknowledge that this study has some limitations. First, since data from only two medical centers were utilized, it is difficult to evince from the presented results how the developed models might perform with data acquired under differing protocols. Future studies should focus on collecting representative, large, and multi-institutional datasets to test the CADx model. Second, we cannot determine whether the diagnostic performance of radiologists will be significantly improved with the aid of the multi-input model. Another observer study is necessary, in which two reading conditions would be evaluated: reading without AI aid and reading with AI aid. Lastly, our model uses only two breast MR sequences. It is necessary to design a complete automated diagnostic system incorporating other MRI sequences and patients’ clinical information.
6 Conclusion
The findings of this diagnostic trial demonstrated that the use of mpMRI in combination with DL had significantly improved the diagnostic performance and achieved acceptable diagnostic accuracy at the clinic level. It can be expected that the proposed DL-based CADx model can help radiologists by providing preliminary diagnosis, enabling greater efficiencies in interpreting breast mpMRI images.
Data availability statement
The raw data supporting the conclusions of this article will be made available by the authors, without undue reservation.
Ethics statement
The studies involving human participants were reviewed and approved by the Ethics Committee of Chinese People’s Liberation Army General Hospital (No. S2019-093-01). Written informed consent from the participants’ legal guardian/next of kin was not required to participate in this study in accordance with the national legislation and the institutional requirements.
Author contributions
JZ and JG: study design, experiments, and manuscript writing. JZ, JG, WS, and HS: experiments, analysis, and interpretation of data. BZ, XD, and ML: collection and interpretation of data. XL and LC: interpretation of data and manuscript revision. All authors contributed to the article and approved the submitted version.
Conflict of interest
The authors declare that the research was conducted in the absence of any commercial or financial relationships that could be construed as a potential conflict of interest.
Publisher’s note
All claims expressed in this article are solely those of the authors and do not necessarily represent those of their affiliated organizations, or those of the publisher, the editors and the reviewers. Any product that may be evaluated in this article, or claim that may be made by its manufacturer, is not guaranteed or endorsed by the publisher.
Supplementary material
The Supplementary Material for this article can be found online at: https://www.frontiersin.org/articles/10.3389/fonc.2022.946580/full#supplementary-material
References
1. Ma D, Lu F, Zou X, Zhang H, Li Y, Zhang L, et al. Intravoxel incoherent motion diffusion-weighted imaging as an adjunct to dynamic contrast-enhanced MRI to improve accuracy of the differential diagnosis of benign and malignant breast lesions. Magn Reson Imag (2017) 36:175–9. doi: 10.1016/j.mri.2016.10.005
2. Pinker K, Bogner W, Baltzer P, Gruber S, Bickel H, Brueck B, et al. Improved diagnostic accuracy with multiparametric magnetic resonance imaging of the breast using dynamic contrast-enhanced magnetic resonance imaging, diffusion-weighted imaging, and 3-dimensional proton magnetic resonance spectroscopic imaging. Invest Radiol (2014) 49(6):421–30. doi: 10.1097/RLI.0000000000000029
3. Plana MN, Carreira C, Muriel A, Chiva M, Abraira V, Emparanza JI, et al. Magnetic resonance imaging in the preoperative assessment of patients with primary breast cancer: Systematic review of diagnostic accuracy and meta-analysis. Eur Radiol (2012) 22(1):26–38. doi: 10.1007/s00330-011-2238-8
4. Baltzer A, Dietzel M, Kaiser CG, Baltzer PA. Combined reading of contrast enhanced and diffusion weighted magnetic resonance imaging by using a simple sum score. Eur Radiol (2016) 26(3):884–91. doi: 10.1007/s00330-015-3886-x
5. Pinker K, Bickel H, Helbich TH, Gruber S, Dubsky P, Pluschnig U, et al. Combined contrast-enhanced magnetic resonance and diffusion-weighted imaging reading adapted to the "Breast imaging reporting and data system" for multiparametric 3-T imaging of breast lesions. Eur Radiol (2013) 23(7):1791–802. doi: 10.1007/s00330-013-2771-8
6. Ei Khouli RH, Jacobs MA, Mezban SD, Huang P, Kamel IR, Macura KJ, et al. Diffusion-weighted imaging improves the diagnostic accuracy of conventional 3.0-T breast MR imaging. Radiology (2010) 256(1):64–73. doi: 10.1148/radiol.10091367
7. Zhang M, Horvat JV, Bernard-Davila B, Marino MA, Leithner D, Ochoa-Albiztegui RE, et al. Multiparametric MRI model with dynamic contrast-enhanced and diffusion-weighted imaging enables breast cancer diagnosis with high accuracy. J Magn Reson Imag (2019) 49(3):864–74. doi: 10.1002/jmri.26285
8. Zhang Q, Peng Y, Liu W, Bai J, Zheng J, Yang X, et al. Radiomics based on multimodal MRI for the differential diagnosis of benign and malignant breast lesions. J Magn Reson Imag (2020) 52(2):596–607. doi: 10.1002/jmri.27098
9. American College of Radiology (ACR). ACR BI-RADS-Magnetic Resonance Imaging. In: ACR Breast Imaging Reporting and Data System, Breast Imaging Atlas. Reston, VA. American College of Radiology (2003).
10. Yabuuchi H, Matsuo Y, Kamitani T, Setoguchi T, Okafuji T, Soeda H, et al. Non-mass-like enhancement on contrast-enhanced breast MR imaging: lesion characterization using combination of dynamic contrast-enhanced and diffusion-weighted MR images. Eur J Radiol (2010) 75(1):e126–32. doi: 10.1016/j.ejrad.2009.09.013
11. Yabuuchi H, Matsuo Y, Okafuji T, Kamitani T, Soeda H, Setoguchi T, et al. Enhanced mass on contrast-enhanced breast MR imaging: Lesion characterization using combination of dynamic contrast-enhanced and diffusion-weighted MR images. J Magn Reson Imag (2008) 28(5):1157–65. doi: 10.1002/jmri.21570
12. Litjens G, Kooi T, Bejnordi BE, Setio AAA, Ciompi F, Ghafoorian M, et al. A survey on deep learning in medical image analysis. Med Imag Anal (2017) 42:60–88. doi: 10.1016/j.media.2017.07.005
13. Lai Z, Deng H. Medical image classification based on deep features extracted by deep model and statistic feature fusion with multilayer Perceptron(). Comput Intell Neurosci (2018) 2018:2061516–. doi: 10.1155/2018/2061516
14. Reig B, Heacock L, Geras KJ, Moy L. Machine learning in breast MRI. J Magn Reson Imag (2020) 52(4):998–1018. doi: 10.1002/jmri.26852
15. Codari M, Schiaffino S, Sardanelli F, Trimboli RM. Artificial intelligence for breast MRI in 2008-2018: A systematic mapping review. AJR Am J Roentgenol (2019) 212(2):280–92. doi: 10.2214/AJR.18.20389
16. Ou WC, Polat D, Dogan BE. Deep learning in breast radiology: current progress and future directions. Eur Radiol (2021) 31(7):4872–85. doi: 10.1007/s00330-020-07640-9
17. Dalmiş MU, Gubern-Mérida A, Vreemann S, Bult P, Karssemeijer N, Mann R, et al. Artificial intelligence–based classification of breast lesions imaged with a multiparametric breast MRI protocol with ultrafast DCE-MRI, T2, and DWI. Invest Radiol (2019) 54(6):325–32. doi: 10.1097/RLI.0000000000000544
18. Truhn D, Schrading S, Haarburger C, Schneider H, Merhof D, Kuhl C. Radiomic versus convolutional neural networks analysis for classification of contrast-enhancing lesions at multiparametric breast MRI. Radiology (2019) 290(2):290–7. doi: 10.1148/radiol.2018181352
19. Liao GJ, Henze Bancroft LC, Strigel RM, Chitalia RD, Kontos D, Moy L, et al. Background parenchymal enhancement on breast MRI: A comprehensive review. J Magn Reson Imag (2020) 51(1):43–61. doi: 10.1002/jmri.26762
20. Avanzo M, Porzio M, Lorenzon L, Milan L, Sghedoni R, Russo G, et al. Artificial intelligence applications in medical imaging: A review of the medical physics research in Italy. Phys Med (2021) 83:221–41. doi: 10.1016/j.ejmp.2021.04.010
21. Hosny A, Parmar C, Quackenbush J, Schwartz LH, Aerts H. Artificial intelligence in radiology. Nat Rev Canc (2018) 18(8):500–10. doi: 10.1038/s41568-018-0016-5
22. Cireşan DC, Giusti A, Gambardella LM, Schmidhuber J. Deep neural networks segment neuronal membranes in electron microscopy images. In Proceedings of the 25th International Conference on Neural Information Processing Systems - Volume 2 (NIPS'12). Red Hook, NY, USA,:Curran Associates Inc. (2012). Pp. 2843–51. doi: 10.5555/2999325.2999452
23. Ronneberger O, Fischer P, Brox T eds. U-Net: Convolutional networks for biomedical image segmentation. In: Navab N, Hornegger J, Wells W, Frangi A (eds) Medical Image Computing and Computer-Assisted Intervention – MICCAI 2015. MICCAI 2015. Lecture Notes in Computer Science. Cham: Springer (2015). vol 9351.
24. Çiçek Ö, Abdulkadir A, Lienkamp SS, Brox T, Ronneberger O eds. (2016). 3D U-net: Learning dense volumetric segmentation from sparse annotation In: Ourselin S, Joskowicz L, Sabuncu M, Unal G, Wells W (eds) Medical Image Computing and Computer-Assisted Intervention – MICCAI 2016. MICCAI 2016. Lecture Notes in Computer Science(), vol 9901. Cham:Springer (2016). doi: 10.1007/978-3-319-46723-8_49
25. Milletari F, Navab N, Ahmadi S eds. (2016). V-Net: Fully convolutional neural networks for volumetric medical image segmentation, in: 2016 Fourth International Conference on 3D Vision (3DV). Stanford, CA, USA: IEEE (2016). pp. 565–71. doi: 10.1109/3DV.2016.7
26. Chen M, Zheng H, Lu C, Tu E, Yang J, Kasabov N eds. (2018). A spatio-temporal fully convolutional network for breast lesion segmentation in DCE-MRI. In: Cheng L, Leung A, Ozawa S (eds) Neural Information Processing. ICONIP 2018. Lecture Notes in Computer Science(), vol 11307. Cham: Springer (2018). doi: 10.1007/978-3-030-04239-4_32
27. Piantadosi G, Marrone S, Galli A, Sansone M, Sansone C eds. (2019). DCE-MRI breast lesions segmentation with a 3TP U-net deep convolutional neural network, in: 2019 IEEE 32nd International Symposium on Computer-Based Medical Systems (CBMS). Cordoba, Spain: IEEE (2019). pp. 628–33. doi: 10.1109/CBMS.2019.00130
28. Galli A, Marrone S, Piantadosi G, Sansone M, Sansone C. A pipelined tracer-aware approach for lesion segmentation in breast DCE-MRI. J Imaging (2021) 7(12):276–92. doi: 10.3390/jimaging7120276
29. Sheth D, Giger ML. Artificial intelligence in the interpretation of breast cancer on MRI. J Magn Reson Imag (2020) 51(5):1310–24. doi: 10.1002/jmri.26878
30. Herent P, Schmauch B, Jehanno P, Dehaene O, Saillard C, Balleyguier C, et al. Detection and characterization of MRI breast lesions using deep learning. Diagn Interv Imag (2019) 100(4):219–25. doi: 10.1016/j.diii.2019.02.008
31. Zhou J, Zhang Y, Chang KT, Lee KE, Wang O, Li J, et al. Diagnosis of benign and malignant breast lesions on DCE-MRI by using radiomics and deep learning with consideration of peritumor tissue. J Magn Reson Imag (2020) 51(3):798–809. doi: 10.1002/jmri.26981
32. Antropova N, Huynh BQ, Giger ML. A deep feature fusion methodology for breast cancer diagnosis demonstrated on three imaging modality datasets. Med Phys (2017) 44(10):5162–71. doi: 10.1002/mp.12453
33. Hizukuri A, Nakayama R, Nara M, Suzuki M, Namba K. Computer-aided diagnosis scheme for distinguishing between benign and malignant masses on breast DCE-MRI images using deep convolutional neural network with Bayesian optimization. J Digit Imag (2021) 34(1):116–23. doi: 10.1007/s10278-020-00394-2
34. Antropova N, Abe H, Giger ML. Use of clinical MRI maximum intensity projections for improved breast lesion classification with deep convolutional neural networks. J Med Imaging (Bellingham) (2018) 5(1):014503. doi: 10.1117/1.JMI.5.1.014503
35. Adachi M, Fujioka T, Mori M, Kubota K, Kikuchi Y, Xiaotong W, et al. Detection and diagnosis of breast cancer using artificial intelligence based assessment of maximum intensity projection dynamic contrast-enhanced magnetic resonance images. Diagnost (Basel) (2020) 10(5):330–43. doi: 10.3390/diagnostics10050330
36. Pinker K, Moy L, Sutton EJ, Mann RM, Weber M, Thakur SB, et al. Diffusion-weighted imaging with apparent diffusion coefficient mapping for breast cancer detection as a stand-alone parameter: Comparison with dynamic contrast-enhanced and multiparametric magnetic resonance imaging. Invest Radiol (2018) 53(10):587–95. doi: 10.1097/RLI.0000000000000465
37. Parekh VS, Jacobs MA. Integrated radiomic framework for breast cancer and tumor biology using advanced machine learning and multiparametric MRI. NPJ Breast Canc (2017) 3:43. doi: 10.1038/s41523-017-0045-3
38. Bhooshan N, Giger M, Lan L, Li H, Marquez A, Shimauchi A, et al. Combined use of T2-weighted MRI and T1-weighted dynamic contrast-enhanced MRI in the automated analysis of breast lesions. Magn Reson Med (2011) 66(2):555–64. doi: 10.1002/mrm.22800
39. Verburg E, van Gils CH, Bakker MF, Viergever MA, Pijnappel RM, Veldhuis WB, et al. Computer-aided diagnosis in multiparametric magnetic resonance imaging screening of women with extremely dense breasts to reduce false-positive diagnoses. Invest Radiol (2020) 55(7):438–44. doi: 10.1097/RLI.0000000000000656
40. Zhu Z, Albadawy E, Saha A, Zhang J, Harowicz MR, Mazurowski MA. Deep learning for identifying radiogenomic associations in breast cancer. Comput Biol Med (2019) 109:85–90. doi: 10.1016/j.compbiomed.2019.04.018
41. Zhang Y, Chen JH, Lin Y, Chan S, Zhou J, Chow D, et al. Prediction of breast cancer molecular subtypes on DCE-MRI using convolutional neural network with transfer learning between two centers. Eur Radiol (2021) 31(4):2559–67. doi: 10.1007/s00330-020-07274-x
42. Ha R, Chin C, Karcich J, Liu MZ, Chang P, Mutasa S, et al. Prior to initiation of chemotherapy, can we predict breast tumor response? Deep learning convolutional neural networks approach using a breast MRI tumor dataset. J Digit Imag (2019) 32(5):693–701. doi: 10.1007/s10278-018-0144-1
43. Liu MZ, Mutasa S, Chang P, Siddique M, Jambawalikar S, Ha R. A novel CNN algorithm for pathological complete response prediction using an I-SPY TRIAL breast MRI database. Magn Reson Imag (2020) 73:148–51. doi: 10.1016/j.mri.2020.08.021
44. El Adoui M, Drisis S, Benjelloun M. Multi-input deep learning architecture for predicting breast tumor response to chemotherapy using quantitative MR images. Int J Comput Assist Radiol Surg (2020) 15(9):1491–500. doi: 10.1007/s11548-020-02209-9
45. Comes MC, Fanizzi A, Bove S, Didonna V, Diotaiuti S, La Forgia D, et al. Early prediction of neoadjuvant chemotherapy response by exploiting a transfer learning approach on breast DCE-MRIs. Sci Rep (2021) 11(1):14123. doi: 10.1038/s41598-021-93592-z
46. Ozan O, Schlemper J, Folgoc LL, Lee M, Heinrich M, Misawa K, et al. Attention U-Net: Learning Where to Look for the Pancreas. 1st Conference on Medical Imaging with Deep Learning (MIDL 2018). Amsterdam, The Netherlands : arXiv (2018).
47. He KM, Zhang XY, Ren SQ, Sun J. Deep residual learning for image recognition. 2016 IEEE Conference on Computer Vision and Pattern Recognition (CVPR). Las Vegas, NV, USA: IEEE (2016). pp 770–8. doi: 10.1109/CVPR.2016.90
48. He K, Zhang X, Ren S, Sun J eds. (2015). Delving deep into rectifiers: Surpassing human-level performance on ImageNet classification, in: 2015 IEEE International Conference on Computer Vision (ICCV). Santiago, Chile: IEEE (2015). pp. 1026–34. doi: 10.1109/CVPR.2016.90
49. Selvaraju RR, Cogswell M, Das A, Vedantam R, Parikh D, Batra D. Grad-CAM: Visual explanations from deep networks via gradient-based localization. 2017 IEEE International Conference on Computer Vision (ICCV). Venice, Italy: IEEE (2019). pp. 618–26. doi: 10.1109/ICCV.2017.74
50. Dice LR. Measures of the amount of ecologic association between species. Ecology (1945) 26(3):297–302. doi: 10.2307/1932409
51. Leithner D, Wengert G, Helbich T, Morris E, Pinker K. MRI In the assessment of BI-RADS® 4 lesions. Top Magn Reson Imag (2017) 26(5):191–9. doi: 10.1097/RMR.0000000000000138
52. Litjens G, Sanchez CI, Timofeeva N, Hermsen M, Nagtegaal I, Kovacs I, et al. Deep learning as a tool for increased accuracy and efficiency of histopathological diagnosis. Sci Rep (2016) 6:26286. doi: 10.1038/srep26286
53. Ayatollahi F, Shokouhi SB, Mann RM, Teuwen J. Automatic breast lesion detection in ultrafast DCE-MRI using deep learning. Med Phys (2021) 48(10):5897–907. doi: 10.1002/mp.15156
54. Zhou J, Luo LY, Dou Q, Chen H, Chen C, Li GJ, et al. Weakly supervised 3D deep learning for breast cancer classification and localization of the lesions in MR images. J Magn Reson Imag (2019) 50(4):1144–51. doi: 10.1002/jmri.26721
55. Hu Q, Whitney HM, Giger ML. A deep learning methodology for improved breast cancer diagnosis using multiparametric MRI. Sci Rep (2020) 10(1):10536. doi: 10.1038/s41598-020-67441-4
56. Zhang L, Luo Z, Chai R, Arefan D, Sumkin J, Wu S. Deep-learning method for tumor segmentation in breast DCE-MRI2019. Medical Imaging 2019: Imaging Informatics for Healthcare, Research, and Applications (Proceedings Volume 10954). San Diego, California, United States: SPIE Medical Imaging (2019). doi: 10.1109/ICCV.2017.74
57. Zhang Y, Chan S, Park VY, Chang KT, Mehta S, Kim MJ, et al. Automatic detection and segmentation of breast cancer on MRI using mask r-CNN trained on non-Fat-Sat images and tested on fat-sat images. Acad Radiol (2020) 29(Suppl 1):S135–44. doi: 10.1016/j.acra.2020.12.001.
58. Wang H, Cao J, Feng J, Xie Y, Yang D, Chen B. Mixed 2D and 3D convolutional network with multi-scale context for lesion segmentation in breast DCE-MRI. Biomed Signal Process Contr (2021) 68:102607. doi: 10.1016/j.bspc.2021.102607
59. Maicas G, Carneiro G, Bradley AP eds. (2017). Globally optimal breast mass segmentation from DCE-MRI using deep semantic segmentation as shape prior, in: 2017 IEEE 14th International Symposium on Biomedical Imaging (ISBI 2017). Melbourne, VIC, Australia:IEEE (2017). pp. 305–309. doi: 10.1109/ISBI.2017
60. Spuhler KD, Ding J, Liu C, Sun J, Serrano-Sosa M, Moriarty M, et al. Task-based assessment of a convolutional neural network for segmenting breast lesions for radiomic analysis. Magn Reson Med (2019) 82(2):786–95. doi: 10.1002/mrm.27758
61. Jiao H, Jiang X, Pang Z, Lin X, Huang Y, Li L. Deep convolutional neural networks-based automatic breast segmentation and mass detection in DCE-MRI. Comput Math Methods Med (2020) 2020:2413706. doi: 10.1155/2020/2413706
62. Ma M, Gan L, Jiang Y, Qin N, Li C, Zhang Y, et al. Radiomics analysis based on automatic image segmentation of DCE-MRI for predicting triple-negative and nontriple-negative breast cancer. Comput Math Methods Med (2021) 2021:2140465. doi: 10.1155/2021/2140465
63. Spick C, Pinker-Domenig K, Rudas M, Helbich TH, Baltzer PA. MRI-Only lesions: application of diffusion-weighted imaging obviates unnecessary MR-guided breast biopsies. Eur Radiol (2014) 24(6):1204–10. doi: 10.1007/s00330-014-3153-6
64. Dijkstra H, Dorrius MD, Wielema M, Pijnappel RM, Oudkerk M, Sijens PE. Quantitative DWI implemented after DCE-MRI yields increased specificity for BI-RADS 3 and 4 breast lesions. J Magnet Reson Imag (2016) 44(6):1642–9. doi: 10.1002/jmri.25331
65. Maforo N, Li H, Weiss W, Lan L, Giger M. SU-D-BRA-02: Radiomics of multi-parametric breast MRI in breast cancer diagnosis: A quantitative investigation of diffusion weighted imaging, dynamic contrast-enhanced, and T2-weighted magnetic resonance imaging. Med Phys (2015) 42(6Part3):3213. doi: 10.1118/1.4923882
66. Visscher DW, Nassar A, Degnim AC, Frost MH, Vierkant RA, Frank RD, et al. Sclerosing adenosis and risk of breast cancer. Breast Cancer Res Treat (2014) 144(1):205–12. doi: 10.1007/s10549-014-2862-5
67. Rageth CJ, O'Flynn EAM, Pinker K, Kubik-Huch RA, Mundinger A, Decker T, et al. Second international consensus conference on lesions of uncertain malignant potential in the breast (B3 lesions). Breast Cancer Res Treat (2019) 174(2):279–96. doi: 10.1007/s10549-018-05071-1
68. Tuttle TM, Jarosek S, Durham S, Virnig BA. Use of preoperative MRI among older women with ductal carcinoma in situ and locally invasive breast cancer: Data Points # 13. In: Data Points Publication Series [Internet]. Rockville (MD): Agency for Healthcare Research and Quality (US) (2011).
69. Scimeca M, Bonfiglio R, Menichini E, Albonici L, Urbano N, De Caro MT, et al. Microcalcifications drive breast cancer occurrence and development by macrophage-mediated epithelial to mesenchymal transition. Int J Mol Sci (2019) 20(22):5633. doi: 10.3390/ijms20225633
Keywords: breast, magnetic resonance imaging, convolutional neural networks, deep learning, artificial intelligence
Citation: Zhu J, Geng J, Shan W, Zhang B, Shen H, Dong X, Liu M, Li X and Cheng L (2022) Development and validation of a deep learning model for breast lesion segmentation and characterization in multiparametric MRI. Front. Oncol. 12:946580. doi: 10.3389/fonc.2022.946580
Received: 17 May 2022; Accepted: 12 July 2022;
Published: 11 August 2022.
Edited by:
Annarita Fanizzi, National Cancer Institute Foundation (IRCCS), ItalyReviewed by:
Davide Quaresmini, National Cancer Institute Foundation (IRCCS), ItalyStefano Marrone, University of Naples Federico II, Italy
Copyright © 2022 Zhu, Geng, Shan, Zhang, Shen, Dong, Liu, Li and Cheng. This is an open-access article distributed under the terms of the Creative Commons Attribution License (CC BY). The use, distribution or reproduction in other forums is permitted, provided the original author(s) and the copyright owner(s) are credited and that the original publication in this journal is cited, in accordance with accepted academic practice. No use, distribution or reproduction is permitted which does not comply with these terms.
*Correspondence: Liuquan Cheng, MTM5MTAyMDk5ODJAMTM5LmNvbQ==; Xiru Li, MjQ2OGxpQHNpbmEuY29t
†These authors have contributed equally to this work and share first authorship