 Yan Zhang
 Yuwei Ding1,2†
 Mi Mi
Mi Mi Yier Lu
 Shanshan Weng
 Ying Yuan
- 1Department of Medical Oncology (Key Laboratory of Cancer Prevention and Intervention, China National Ministry of Education, Key Laboratory of Molecular Biology in Medical Sciences, Zhejiang Province, China), The Second Affiliated Hospital, Zhejiang University School of Medicine, Hangzhou, Zhejiang, China
- 2Zhejiang Provincial Clinical Research Center for CANCER, Hangzhou, Zhejiang, China
- 3Department of Medical Geriatrics, School of Medicine, The Second Affiliated Hospital of Zhejiang University, Hangzhou, Zhejiang, China
- 4Cancer Center, Zhejiang University, Hangzhou, Zhejiang, China
Background: The exponential growth of the cancer burden attributable to metabolic factors deserves global attention. We investigated the trends of cancer mortality attributable to metabolic factors in 204 countries and regions between 1990 and 2019.
Methods: We extracted data from the Global Burden of Disease Study (GBD) 2019 and assessed the mortality, age-standardized death rate (ASDR), and population attributable fractions (PAFs) of cancers attributable to metabolic factors. Average annual percentage changes (AAPCs) were calculated to assess the changes in the ASDR. The cancer mortality burden was evaluated according to geographic location, SDI quintiles, age, sex, and changes over time.
Results: Cancer attributable to metabolic factors contributed 865,440 (95% UI, 447,970-140,590) deaths in 2019, a 167.45% increase over 1990. In the past 30 years, the increase in the number of deaths and ASDR in lower SDI regions have been significantly higher than in higher SDI regions (from high to low SDIs: the changes in death numbers were 108.72%, 135.7%, 288.26%, 375.34%, and 288.26%, and the AAPCs were 0.42%, 0.58%, 1.51%, 2.36%, and 1.96%). Equatorial Guinea (AAPC= 5.71%), Cabo Verde (AAPC=4.54%), and Lesotho (AAPC=4.42%) had the largest increase in ASDR. Large differences were observed in the ASDRs by sex across different SDIs, and the male-to-female ratios of ASDR were 1.42, 1.50, 1.32, 0.93, and 0.86 in 2019. The core population of death in higher SDI regions is the age group of 70 years and above, and the lower SDI regions are concentrated in the age group of 50-69 years. The proportion of premature deaths in lower SDI regions is significantly higher than that in higher SDI regions (from high to low SDIs: 2%, 4%, 7%, 7%, and 9%). Gastrointestinal cancers were the core burden, accounting for 50.11% of cancer deaths attributable to metabolic factors, among which the top three cancers were tracheal, bronchus, and lung cancer, followed by colon and rectum cancer and breast cancer.
Conclusions: The cancer mortality burden attributable to metabolic factors is shifting from higher SDI regions to lower SDI regions. Sex differences show regional heterogeneity, with men having a significantly higher burden than women in higher SDI regions but the opposite is observed in lower SDI regions. Lower SDI regions have a heavier premature death burden. Gastrointestinal cancers are the core of the burden of cancer attributable to metabolic factors.
Introduction
Cancer is a major public health challenge, with 19.29 million new cases and 9.96 million deaths in 2020 (1). Related risk factors play a key role in the occurrence and development of cancer, such as hypertension, tobacco use, and air pollution. The cancer mortality burden attributable to these factors is preventable and controllable (2). In 2014, cancer deaths among Chinese adults aged 20 and above accounted for 45.2% of all deaths (3). The prevention and control of cancer mortality is the top priority in reducing the global cancer burden. In recent years, the cancer burden attributable to tobacco (4) and alcohol use (5) has decreased significantly under effective policies to control tobacco and alcohol use. Although there is heterogeneity in the cancer burden attributable to dietary risks (heterogeneity of regions and cancer types), the overall cancer burden attributable to dietary risks has decreased (6–9). In general, due to the increase in body weight of the global population and the poor control of metabolic-related diseases (such as diabetes), the related cancer mortality burden has shown an upward trend to varying degrees (2).
Motivated by the increasing occurrence of metabolic diseases and the related mortality burden of cancer, this study extracted data from the Global Burden of Disease (GBD) 2019 study and explored the distribution and time trends of the cancer burden attributable to metabolic factors in different regions, countries, sexes, and age groups to formulate appropriate strategies for prevention and control.
Materials and methods
Data sources
The data used in this study were collected by the Global Burden of Disease Study 2019 using the Global Heath Data Exchange Tool (https://ghdx.healthdata.org/gbd-results-tool). Deaths, age-standardized death rate (ASDR), summary exposure values (SEVs), population attributable fractions (PAFs) and their 95% uncertainty intervals (UIs) from 1990 to 2019 among 5 sociodemographic index (SDI) quintiles, 21 GBD regions, and 204 countries and territories were extracted. Temporal trends in death rates were assessed by the average annual percentage change (AAPC), which was calculated based on the Joinpoint regression model.
SDI is an indicator to measure the lagging distribution of a country’s overall fertility rate, education level and per capita income, ranging from 0 to 1. According to their SDI values in 2019, countries and regions were divided into five categories (high>0.81, medium high 0.70-0.81, medium high 0.61-0.69, medium low 0.46-0.60 and low<0.46).
Cancers are classified according to the International Classification of Diseases (ICD). All cancer death rates were obtained from a single cancer registry or a summary database of cancer registries, including the cancer incidence (CI5), surveillance, epidemiology and final results (SEER) on five continents, and the Nordic Cancer Registry (NORDCAN). The classification of cancers attributable to metabolic factors retrieved from the GBD data includes 15 kinds: breast cancer, colon and rectum cancer, liver cancer, ovarian cancer, pancreatic cancer, esophageal cancer, gallbladder and malignant tract cancer, kidney cancer, leukemia, multiple myeloma, non-Hodgkin lymphoma, thyroid cancer, uterine cancer, bladder cancer, and tracheal-bronchus and lung cancer (10, 11).
Attributable risk factors
The first-level risk factors in GBD are divided into behavioral, metabolic, and environmental/occupational risks. Attributable risks of cancer were estimated to be 11 risk factors: air pollution, occupational risks, and other environmental risks, which are environmental factors; tobacco, dietary risks, alcohol use, unsafe sex, drug use, and low physical activity, which are behavioral factors; and high fasting plasma glucose and high body mass index, which are metabolic factors (2).
The summary exposure values (SEVs) of the metabolic factors (including high fasting plasma glucose and high body mass index), the population attributable fractions (PAFs) of various cancers, and the cancer burden and trend attributable to metabolic factors were analyzed.
Statistical analysis
The age-standardized rate (ASR) is expressed as the number of people per 100 000 population. Regression analysis was performed to calculate the average annual percentage change (AAPC) and 95% confidence interval (CI) for the average standardized death rate (ASDR) using Joinpoint 4.2.0.1 software. The joinpoint regression model is used to evaluate the time trend in a structured way and test that the trend between joint points is statistically significant (12, 13). When the slope of the trend (AAPC) is significantly different from zero, the terms “decrease” or “increase” are used. R language software was used to analyze the correlation between ASDR and SDI in 21 GBD regions and to plot the changes in the number of deaths, ASDR and AAPC map distribution in 204 countries and territories. P values less than 0.05 were considered statistically significant.
Results
In contrast to other risk factors, the cancer mortality burden attributable to metabolic factors shows a significant upward trend worldwide
Globally, attributable cancer mortality accounted for 44.16% of all cancer mortality, of which metabolic factors accounted for 8.59% (high body-mass index accounted for 4.59%, high fasting plasma glucose accounted for 4.16%), behavior factors accounted for 36.70% (tobacco accounted for 25.80%, dietary risks accounted for 6.01%, alcohol use accounted for 4.91%, low physical activity accounted for 0.70%), and environmental risks accounted for 7.31% (Figure 1A). In the past 30 years, among these attributable cancer mortality burdens, the related risks represented by tobacco and alcohol use showed a significant downward trend, while metabolic factors, including high body mass index and high fasting plasma glucose, were different from all of the other factors, showing a significant increasing trend (Figure 1B). Meanwhile, 5 SDIs and 21 GBD regions showed the same trend (Figure S1).
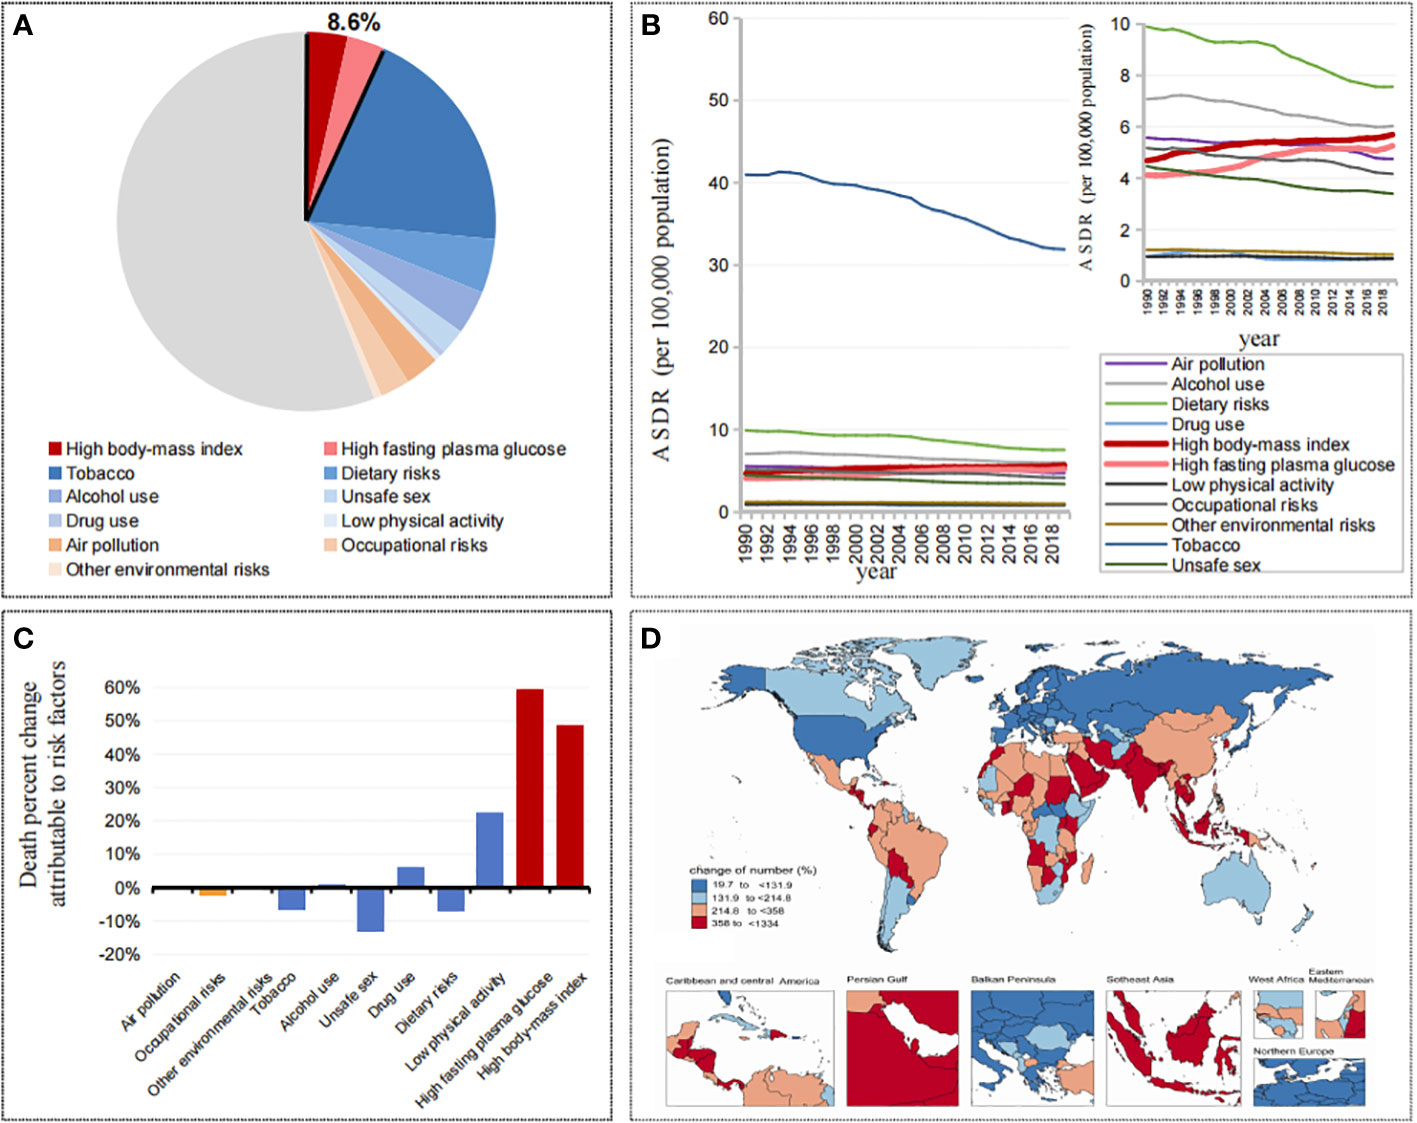
Figure 1 (A) Contributions of attributable death cases by different risk factors in 2019. (B) The trend of ASDRs in cancers attributable to different risk factors from 1990 to 2019. (C) Changes of death percent in cancers attributable to different risk factors from 1990 to 2019. (D) Changes of death cases in cancers attributable to metabolic factors by countries and territories from 1990 to 2019.
From 1990 to 2019, in the death percent change attributable to risk factors, metabolic factors increased significantly, among which high fasting plasma glucose was 59.60%, high body mass index was 48.55%, and low physical activity was 22.24%, while alcohol use, tobacco and dietary risks decreased by -0.83%, -6.84%, and -7.17%, respectively (Figure 1C). Among the 204 countries and territories, the vast majority of countries (113/204) showed a doubling trend in the number of cancer deaths attributable to metabolic factors, with the fastest growth in the United Arab Emirates (1334.02%), Djibouti (930.67%) and Qatar (913.30%), and with the smallest increase in Kyrgyzstan (42.18%), Kazakhstan (35.53%) and Ukraine (19.73%) (Figure 1D).
The cancer mortality burden attributable to metabolic factors is shifting from the higher SDI regions to the lower SDI regions
Over the past 30 years, the number of cancer deaths attributable to metabolic factors has doubled worldwide, from 323,590 (95% UI, 151,880-545,070) to 865,440 (95% UI, 447,970-1,405,900) (Figures 2A, B and Table 1). The ASDR increased from 8.67 (95% UI, 4.07-14.66) per 100,000 people in 1990 to 10.74 (95% UI, 5.53-17.5) per 100,000 people in 2019 (Figure 2C and Table 1), and the AAPC was 0.74% (95% UI, 0.71%-0.76%) (Table 1). Notably, the prevalence patterns of cancer mortality burden attributable to metabolic factors changed in differently in different SDI regions.
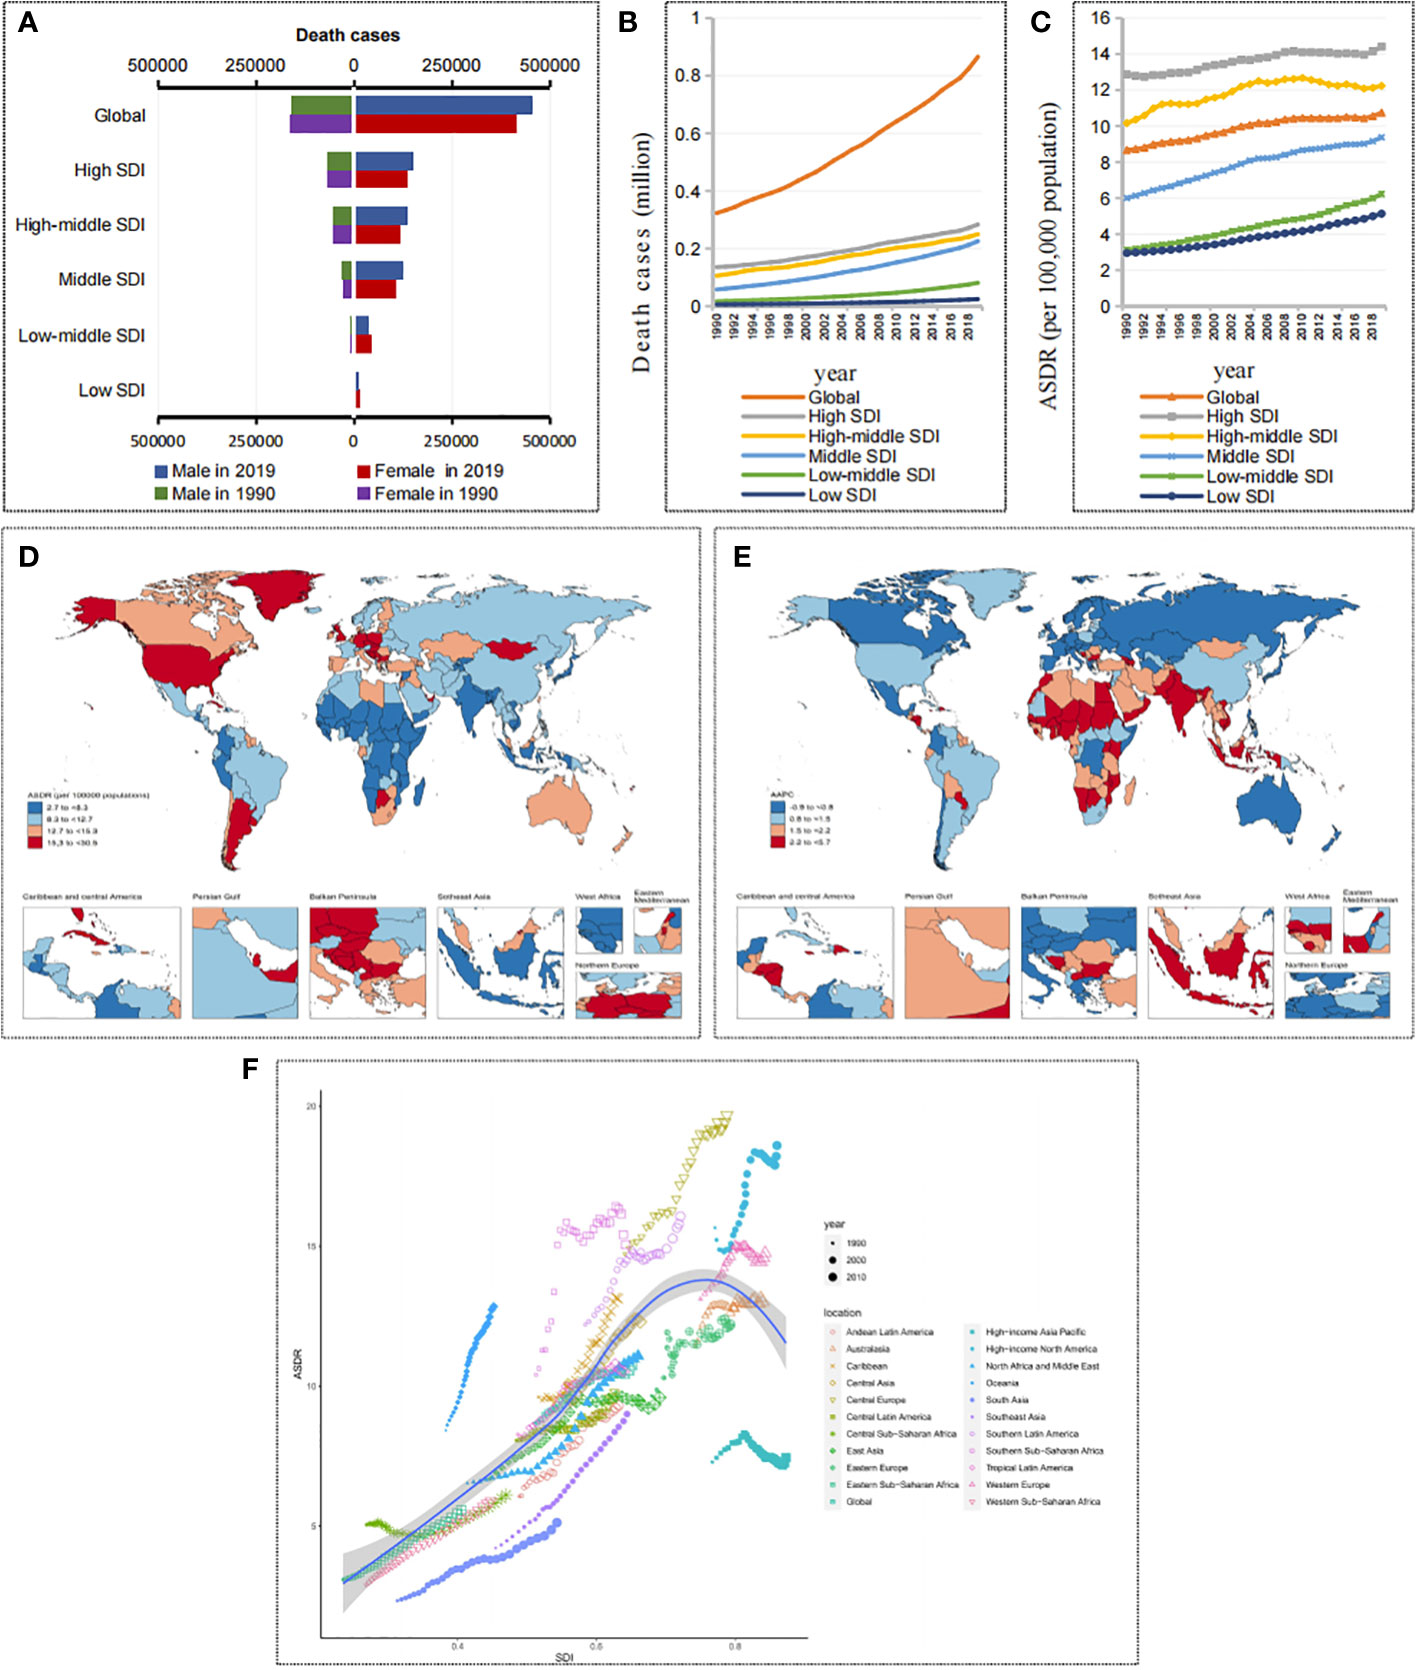
Figure 2 Death burden in cancers attributable to metabolic factors. (A) Death cases in cancers attributable to metabolic factors by SDIs and sexes in 1990 and 2019. (B) The trend of death cases in cancers attributable to metabolic factors by SDIs from 1990 to 2019. (C) The trend of ASDRs in cancers attributable to metabolic factors by SDIs from 1990 to 2019. (D) ASDRs of cancers attributable to metabolic factors by countries and territories in 2019. (E) AAPC of ASDRs in cancers attributable to metabolic factors by countries and territories from 1990 to 2019. (F) ASDRs of cancers attributable to metabolic factors by GBD regions from 1990 to 2019.
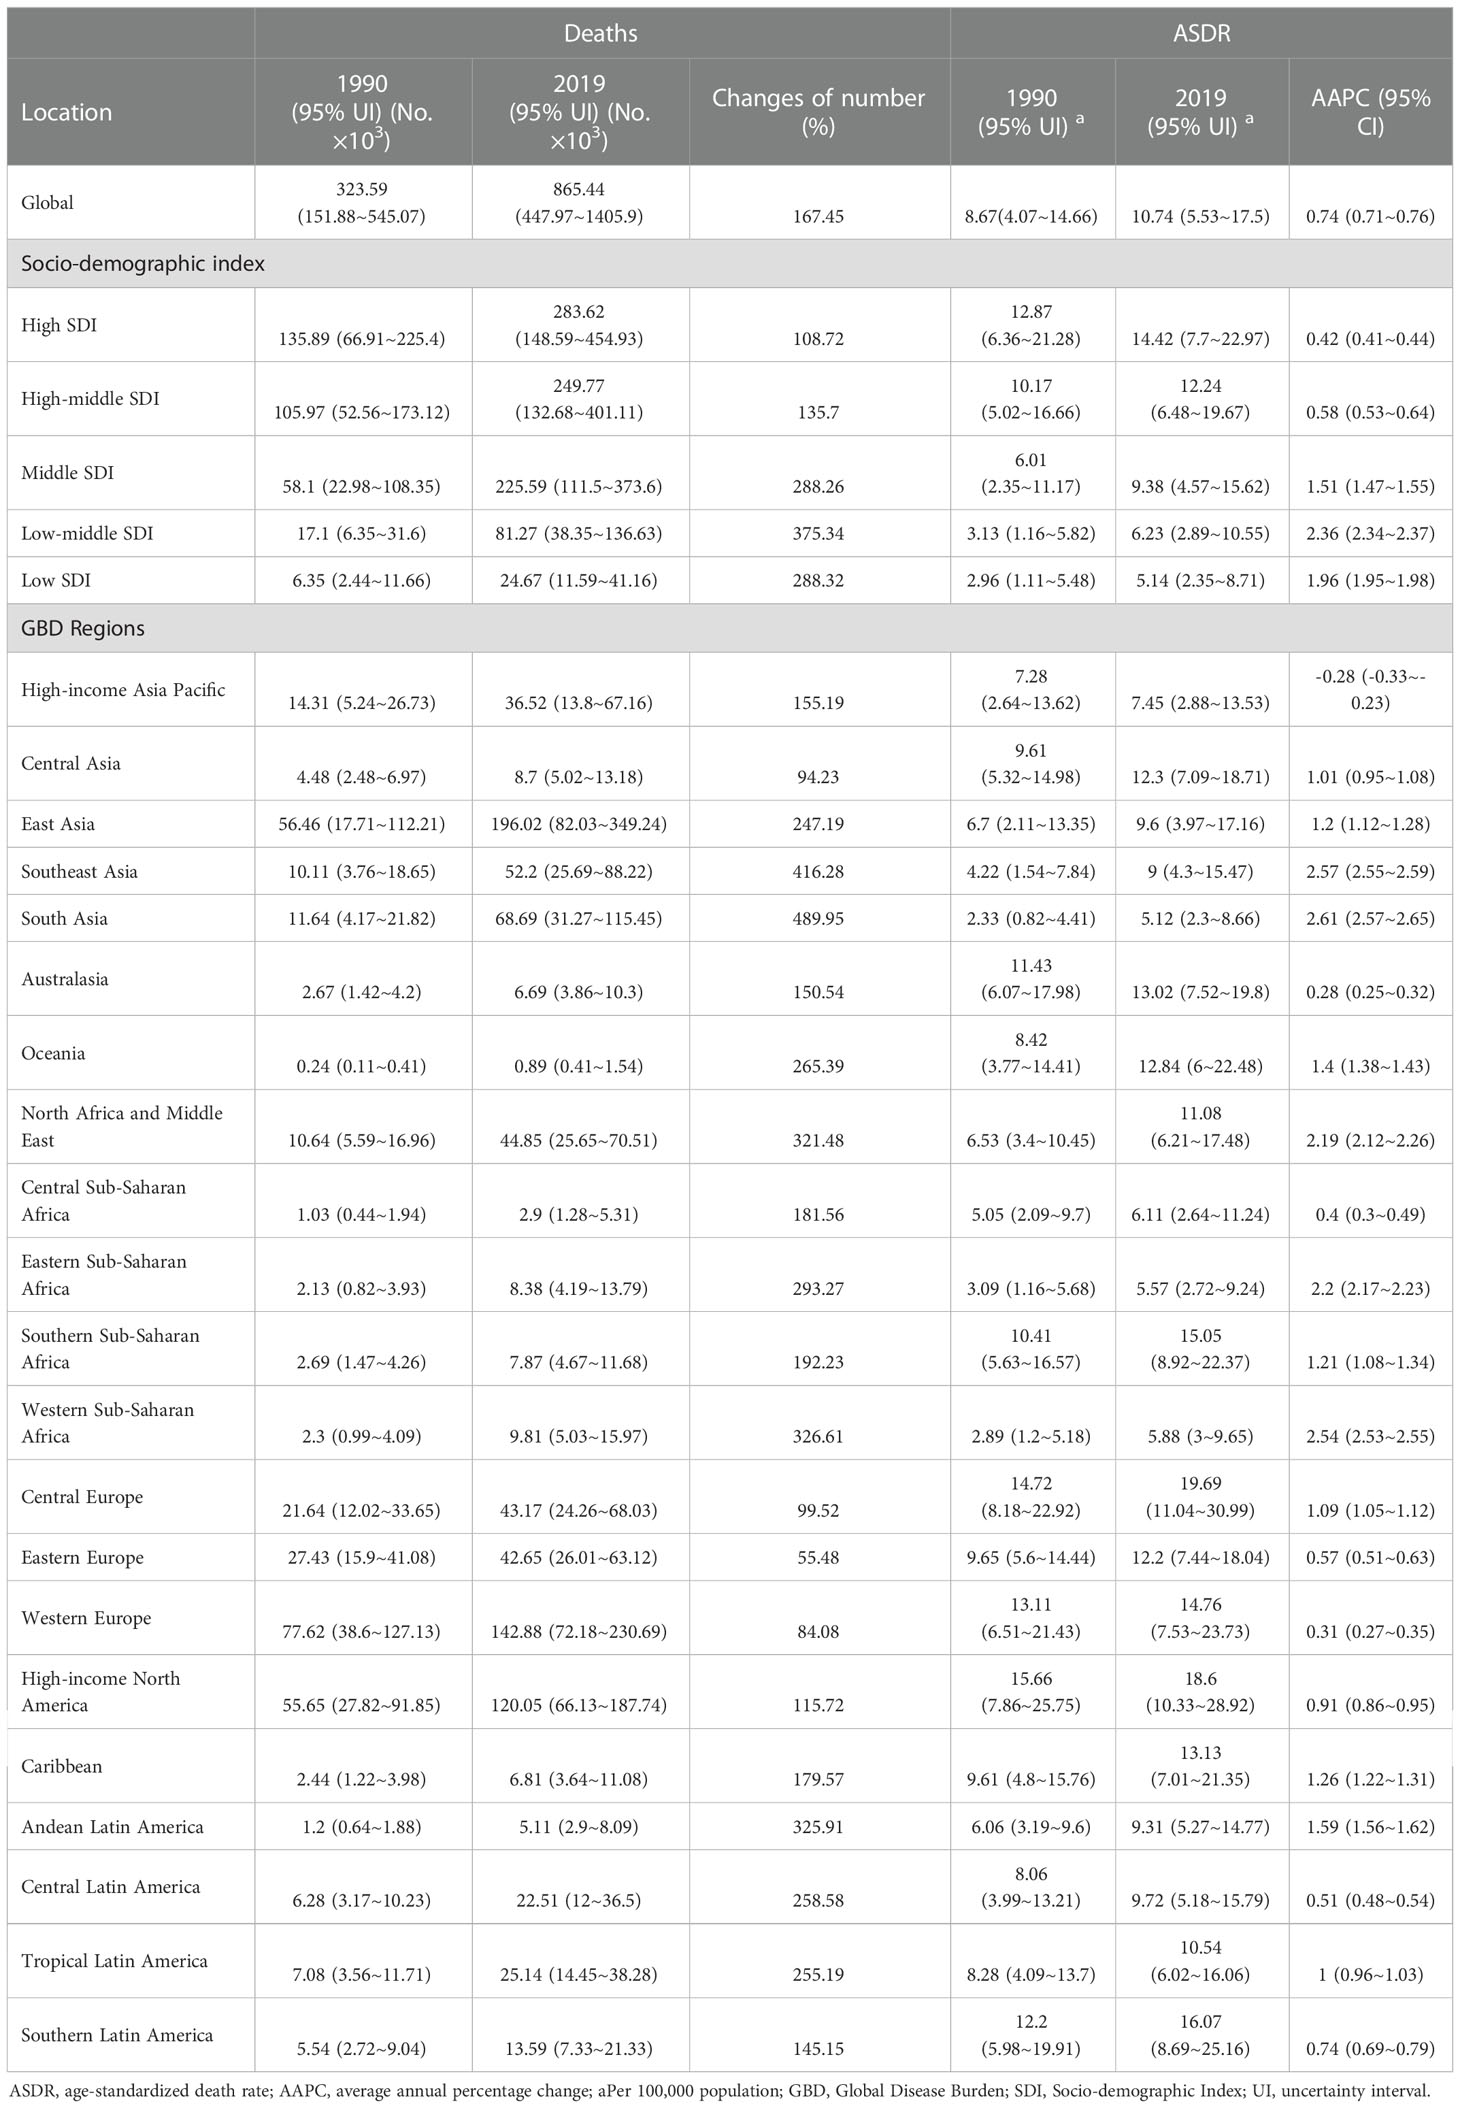
Table 1 The death cases, ASDR of cancers attributable to metabolic factors in 1990 and 2019, and their variations from 1990 to 2019.
In 2019, the number of cancer deaths attributable to metabolic factors from high to low SDI regions was 0.28, 0.25, 0.23, 0.08, and 0.02 million, and the ASDRs were 14.42, 12.23, 9.38, 6.23, and 5.14 per 100,000 people, respectively (Figures 2B, C). It is obvious that higher SDI regions have a higher mortality burden than lower SDI regions. However, in the past 30 years, there has been a more significant growth trend in lower SDI regions. The change in death numbers from high to low SDI regions was 108.72%, 135.7%, 288.26%, 375.34%, and 288.32%, and the AAPCs of the ASDR were 0.42%, 0.58%, 1.51%, 2.36%, and 1.96%, respectively (Figure 2C and Table 1). Based on the significant growth trend in lower SDI regions, the gap in mortality burden is narrowing compared with higher SDI regions. In other words, the cancer mortality burden attributable to metabolic factors is gradually shifting from higher SDI regions to lower SDI regions.
Among the 21 GBD regions, the trends were consistent with the 5 SDI regions, with mortality rates trending upward in most GBD regions over the past 30 years. However, the high-income Asia Pacific showed a downward trend (AAPC of ASDR = -0.28%). In contrast, lower SDI regions such as South Asia, Southeast Asia, Western Sub-Saharan Africa, North Africa and the Middle East showed a clear upward trend in mortality, with South Asia showing the most obvious upward trend (changes in death numbers=489.95%, AAPC of ASDR = 2.61%) (Table 1 and Figure 2F).
Among the 204 countries and territories, the countries with the top three ASDRs in 2019 were Qatar, Mongolia and American Samoa, and the countries with the bottom three ASDRs were Bangladesh, Niger and Somalia. In the past 30 years, 73 countries had an increase of more than 300% in cancer deaths attributable to metabolic factors, 71 countries had AAPCs of ASDR greater than 2%, and the vast majority of these countries were concentrated in lower SDI regions (Figures 2D, E).
Significant regional heterogeneity in sex differences was observed in the cancer mortality burden attributable to metabolic factors
In 2019, there were 0.453 million cancer deaths attributable to metabolic factors in men and 0.412 million in women, which were 2.82 times and 2.54 times those in 1990, respectively (Figure 3A). From 1990 to 2019, the ASDR increased from 9.63 to 12.39 per 100,000 people (AAPC=0.878%) in men and 7.90 to 9.38 per 100,000 people (AAPC=0.587%) in women (Figures 3B, D). It is worth noting that there is regional heterogeneity in sex differences.
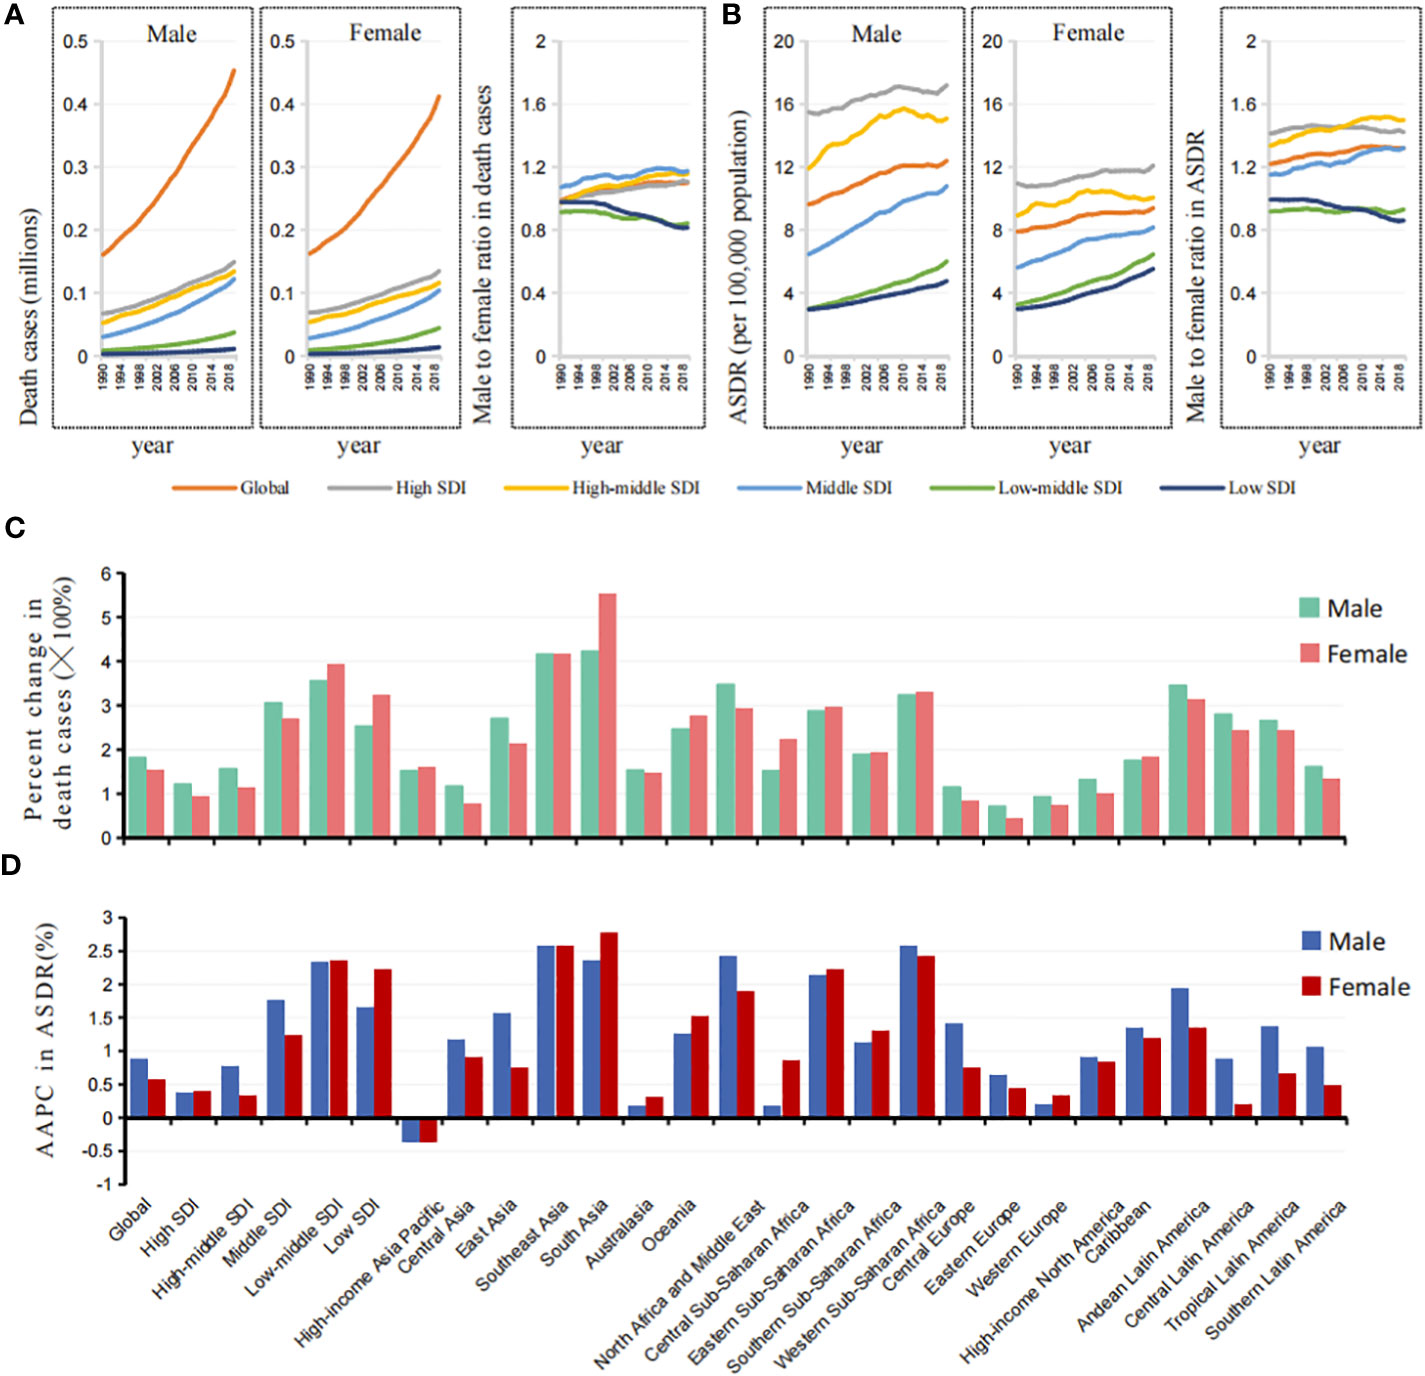
Figure 3 Sex differences and trends of ASDR in cancers attributable to metabolic factors by different SDIs and GBD regions. (A) The death cases in cancers attributable to metabolic factors in males and females, and male to female ratios by SDIs from 1990 to 2019. (B) The ASDRs in cancers attributable to metabolic factors in males and females, and male to female ratios by SDIs from 1990 to 2019. (C) The changes of death cases in cancers attributable to metabolic factors in males and females by SDIs and GBD regions from 1990 to 2019. (D) The AAPCs of ASDR in cancers attributable to metabolic factors in males and females by SDIs and GBD regions from 1990 to 2019.
In higher SDI regions, such as high, high-middle, and middle SDI regions, the male-to-female ratio of the death number and ASDR were greater than 1, and the values showed a clear upward trend in the past 30 years, which was completely opposite to the findings in the low-middle and low SDI regions (Figures 3A, B).
Among the 21 GBD regions, the percent changes in death cases and ASDR attributable to metabolic factors in women were significantly higher than those in men in South Asia, Oceania, and most areas of Africa, while the regions located in North Africa and the Middle East were the opposite (Figures 3C, D, S2).
It is clear that the metabolic cancer burden in men was greater than that in women in higher SDI regions, the exact opposite of the findings in lower SDI regions. Moreover, the sex gap between regions is widening.
The cancer mortality burden attributable to metabolic factors tends to affect younger people in lower SDI regions
To analyze the trends in death across age groups, starting at age 20, we divided every five years into an age group for a total of 14 age groups.
In higher SDI regions (high, high-middle SDI), the mortality burden was mainly concentrated in the age group of 70 years and above. In lower SDI regions, deaths tended to be at younger ages. The proportion of premature deaths under the age of 50 was significantly higher than that in high SDI regions (Figure 4A). It is worth mentioning that in lower SDI regions, doubling trends in all age groups were observed, which was more obvious in the age group of 50 years and above (Figure 4B).
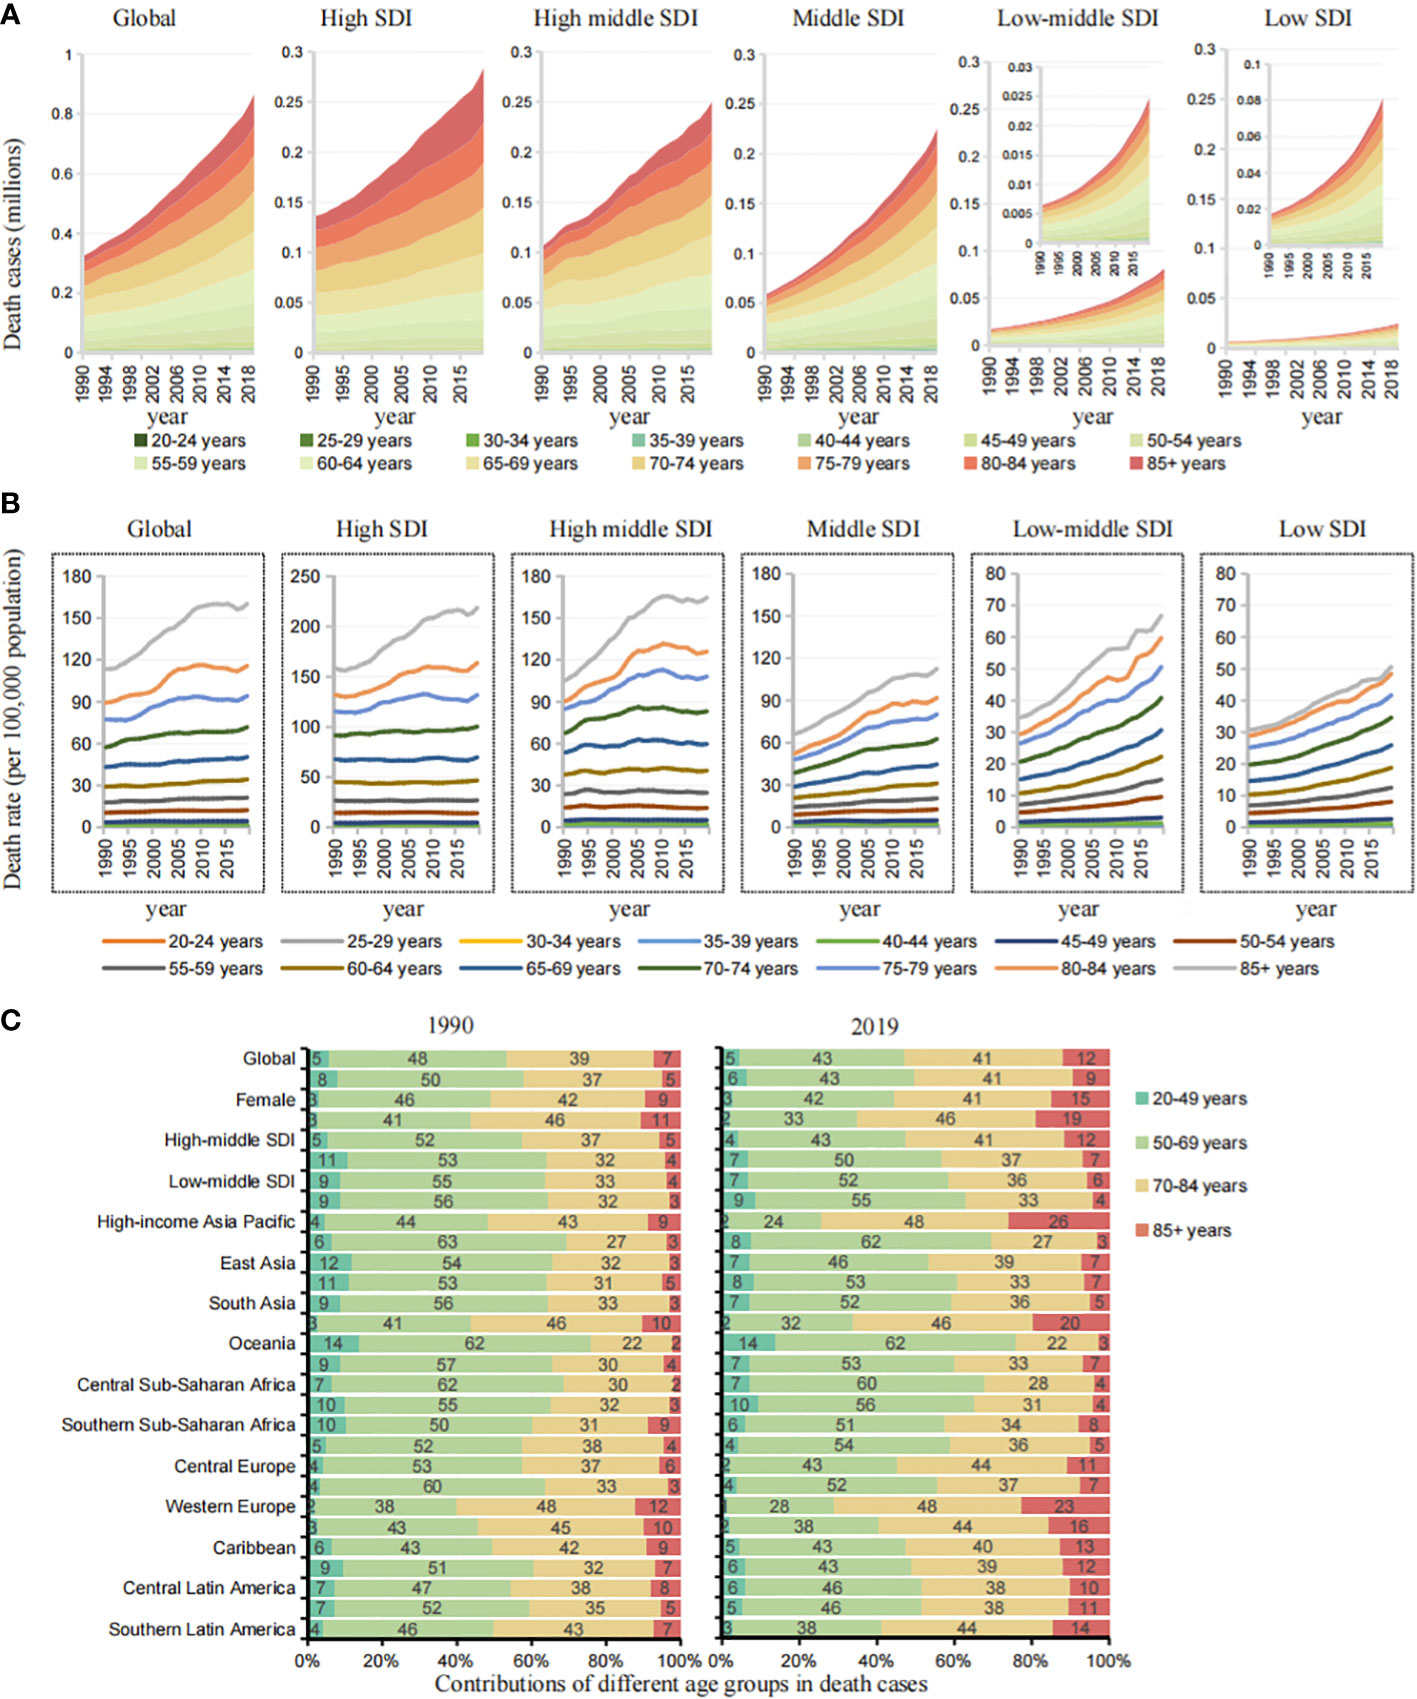
Figure 4 Age group differences and trends of cases in cancers by different SDIs and GBD regions. (A) The death cases trend of age groups in cancers attributable to metabolic factors by SDIs from 1990 to 2019. (B) The death rate trend of age groups in cancers attributable to metabolic factors by SDIs from 1990 to 2019. (C) Contributions of four age groups to cancer deaths attributable to metabolic factors by SDIs and GBD regions in 1990 and 2019.
To further analyze regional differences in age, we simplified the age groups into four groups: 20-49, 50-69, 70-84, and ≥85 years (Figures 4C, S3). In the lower SDI regions (middle, middle-low, low SDI), the age group of 20-49 years accounted for 7%, 7%, and 9% of deaths in 2019, an increase of 150.39%, 264.18%, and 292.23% over 1990. In the higher SDI regions (high, high-middle SDI), the age group of 20-49 years accounted for 2% and 4%, an increase of 54.9% and 88.1% over 1990, and the age group of 85 years and above accounted for 19% and 12%, significantly higher than that in lower SDI regions. The main mortality burden was concentrated in the 70-84 years age group in higher SDI regions and in the 50–69 years age group in the lower SDI regions. Among the 21 GBD regions, Oceania, Eastern sub-Saharan Africa and South Asia had low SDI values, and the age group of 20-49 years accounted for 14%, 10%, and 7% of the deaths in 2019, respectively, an increase of 274.38%, 278.06% and 542.77% over 1990.
In lower SDI regions, the cancer mortality burden attributable to metabolic factors tends to affect younger people, and the burden of premature death is more obvious.
Gastrointestinal cancers are the major cancer mortality burden attributable to metabolic factors
Significant changes in the standardized exposure values (SEVs) of the high body mass index and high fasting plasma glucose occurred in the past 30 years, which are highly associated with the prevalent changes in the cancer mortality burden attributable to metabolic factors during these years (Supplementary File 2). To better explore the burden attributable to specific metabolic factors, we performed a trend analysis of two risk factors (a high body mass index and a high fasting plasma glucose) for different cancer types, 5 SDI regions, and 21 GBD regions.
Significant heterogeneity was observed in the cancer mortality burden attributable to a high body-mass index and a high fasting plasma glucose (Figure 5A). In 2019, the proportion of ASDR (from high to low SDI) attributable to a high body mass index was 5.69%, 5.17%, 4.14%, 2.85% and 2.54%, respectively, 40.36%, 42.92%, 73.87%, 113.22% and 83.93% higher than that in 1990, while the proportion of ASDR attributable to a high fasting plasma glucose was 5.46%, 4.19%, 3.70%, 3.31% and 2.61%, respectively, 42.73%, 58.92%, 80.29%, 87.66%, and 69.46% higher than that in 1990. Among the 21 GBD regions, lower SDI regions such as South Asia and Southeast Asia had the largest increases in ASDR attributable to a high body mass index (168.53% and 155.55%, respectively), while Central Asia and Andean Latin America had the largest increases in ASDR attributable to a high fasting plasma glucose (106.04% and 102.86%, respectively). Globally, there were more significant sex differences found for a high fasting plasma glucose than a high body mass index (Figure S4). Among the age proportions, the age group of 50-69 years was the core population of the cancer mortality burden attributable to a high body mass index, while the cancer mortality burden attributable to a high fasting plasma glucose was more concentrated in the age group of 70-84 years (Figure S5).
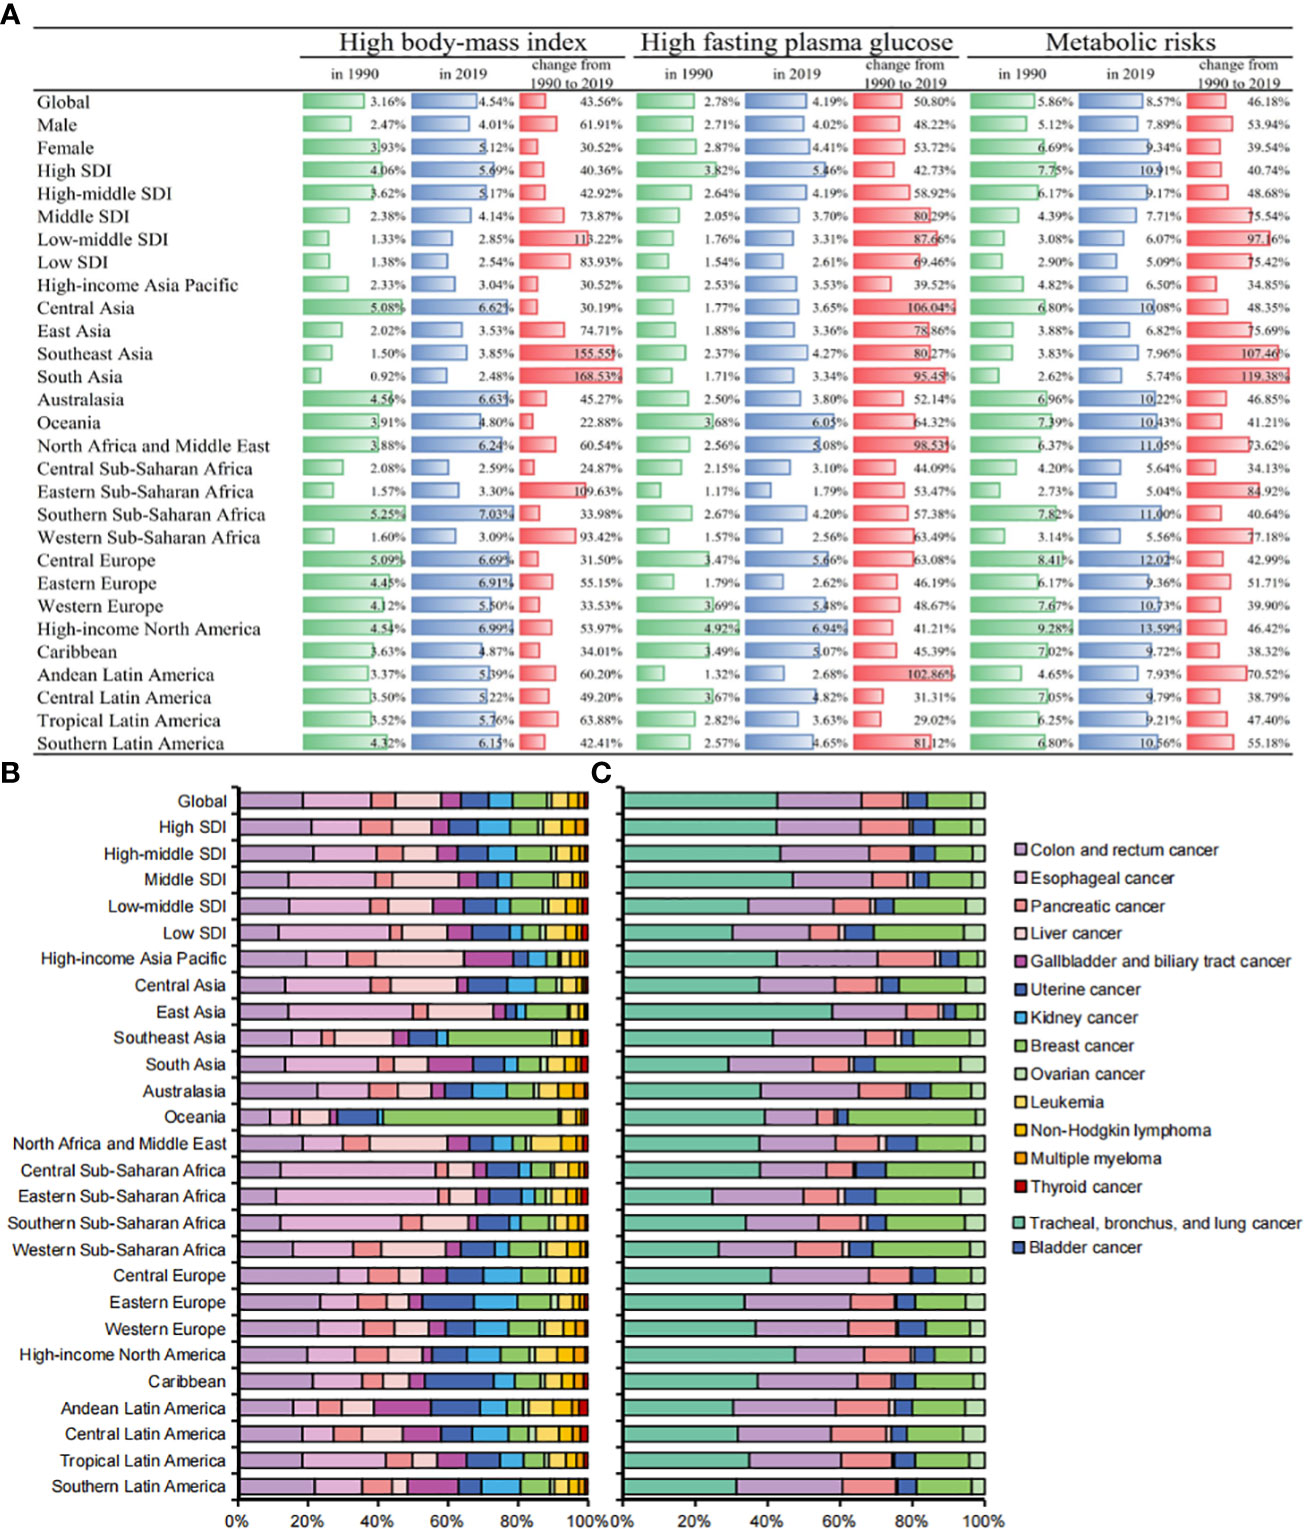
Figure 5 (A) Percentages of ASDRs in cancers attributable to metabolic factors by SDIs and GBD regions in 1990, 2019, and changes from 1990 to 2019. (B) Contributions of different cancers to total cancer deaths attributable to high-body mass index by SDIs and GBD regions in 2019. (C) Contributions of different cancers to total cancer deaths attributable to high fasting plasma glucose by SDIs and GBD regions in 2019.
We further analyzed the cancer mortality burden attributable to metabolic factors in different cancers. Digestive system tumors (esophageal cancer, colon and rectum cancer, pancreatic cancer, liver cancer, cholangiocarcinoma) accounted for 50.11% (433,700 deaths) of all deaths. Digestive system cancers were the core burden of death attributable to metabolic factors. Esophageal cancer, colon and rectum cancer, and pancreatic cancer are the top three cancers attributable to a high body-mass index, with 89,900, 85,900, and 60,800 deaths in 2019, respectively. Tracheal, bronchus, and lung cancer, colon and rectum cancer, and breast cancer are the top three cancers attributable to a high fasting plasma glucose, with 179,000, 9,7600, and 51,100 deaths in 2019, respectively. Uterine cancer and kidney cancer had the highest proportion of deaths attributable to metabolic factors, accounting for 39.8% and 19.0% of all deaths from metabolic cancer, respectively (Table 2).
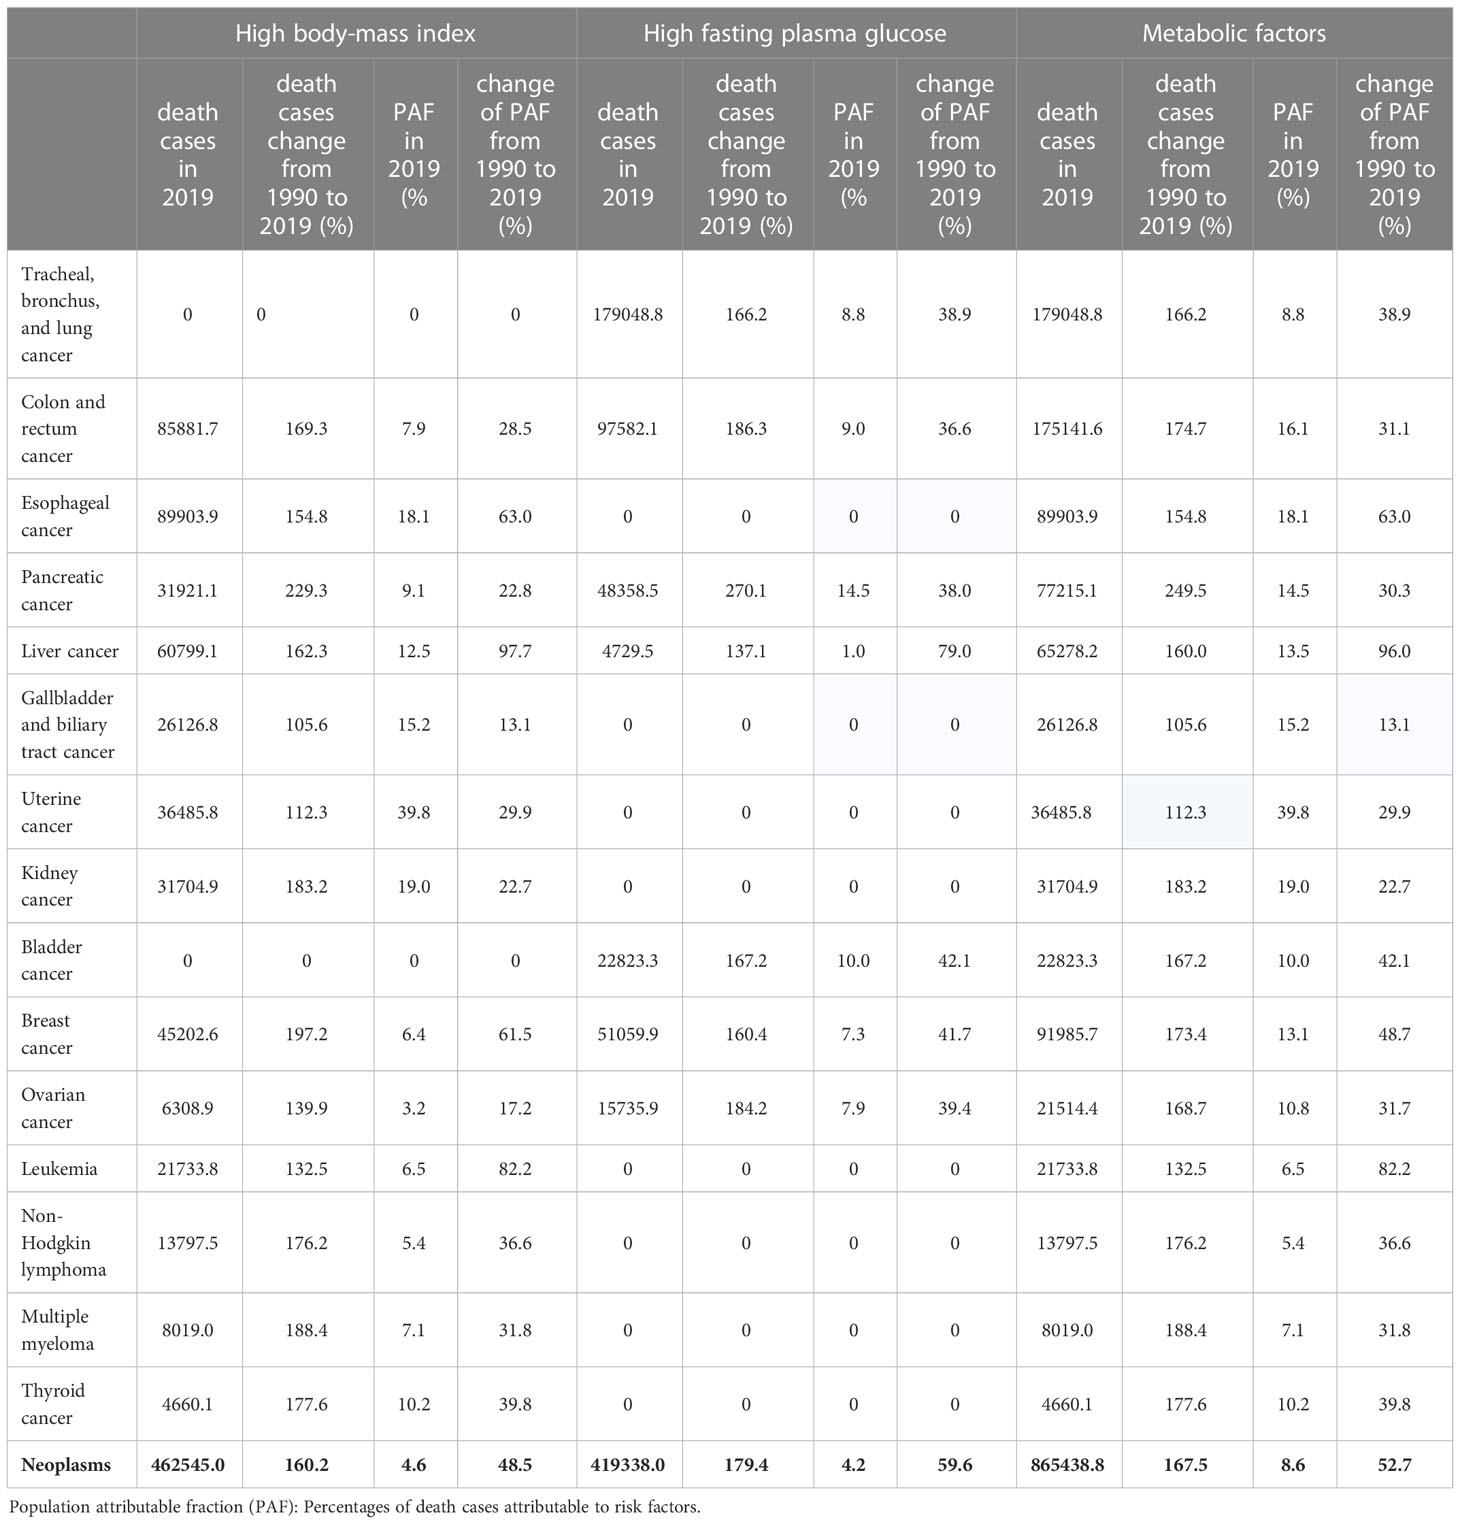
Table 2 Population attributable fraction of cancers by metabolic factors in 2019, and changes from 1990 to 2019.
In 2019, cancer deaths attributable to a high body mass index were mainly gastrointestinal cancers such as colon and rectum cancer, esophageal cancer and pancreatic cancer. Cancer deaths attributable to a high fasting plasma glucose were mainly respiratory system cancers and digestive system cancers such as tracheal, bronchus, and lung cancer, colon and rectum cancer, and pancreatic cancer. In addition, we found that Africa and Asia other than South Asia accounted for the vast majority of gastrointestinal cancer deaths attributable to a high body mass index. East Asia and high-income North America had the highest mortality burden of respiratory system cancers attributable to a high fasting plasma glucose (Figures 5B, C).
Discussion
Metabolic factors are important risk factors for cancer mortality and are also a focus of cancer prevention and control. In the past 30 years, under global cancer prevention and control policies, the cancer burden attributable to most factors, such as tobacco, alcohol use, dietary risks, and environmental risks, has shown a downward trend to varying degrees. However, the cancer burden attributable to metabolic factors shows a clear upward trend. Our study is based on the latest data from GBD2019; to our knowledge, it is the only study that has conducted in-depth and detailed research on the cancer burden attributable to metabolic factors.
In 2019, the number of cancer deaths attributable to metabolic factors was 0.87 million, an increase of 167.45% over 1990, and the ASDR was 10.74 per 100,000, an increase of 23.88% over 1990. The increase in the number of deaths was significantly higher than the increase in the ASDR, indicating that population growth and aging also contributed to the increase in the absolute value. The cancer burden attributable to metabolic factors has become an important public health issue worldwide. Due to the lack of control of high fasting plasma glucose and high body mass index in low-SDI regions, the gap in the related cancer mortality burden between low-SDI regions and high-SDI regions has gradually narrowed.
In high SDI regions such as Australia and the United States, the incidence of metabolic diseases has also risen sharply with economic development. Nevertheless, due to the successful transition of the economy and the government’s gradual emphasis on basic health, the mortality rate related to metabolic diseases has decreased in recent years (14, 15). For example, as early as 2000, the United States began screening young people aged 10 years and above for fasting plasma glucose levels, and by 2018, the screening targeted high-risk youth with a high body mass index and ≥2 risk factors, and found a quarter of the U.S. youth were eligible for prediabetes screening (16). Australia’s National Health and Medical Research Council developed clinical practice guidelines for managing overweight and obesity in Australian adults, adolescents and children (17). Under the abovementioned health policies, the incidence of diabetes (18) and obesity (19) in many high-income regions has remained stable, so the increase in cancer burden attributable to metabolic factors is not obvious. In contrast, in lower SDI regions, such as the Middle East and North Africa, the Gulf Cooperation Council greatly promoted the prosperity of the energy and oil industries (20), and rapid economic transformation, industrialization, urbanization and globalization have brought about dramatic changes, reduced opportunities for physical activity, and unusual changes in dietary patterns (21) toward a “Western diet” characterized by high intakes of refined carbohydrates, added sugars, fats and animal-sourced foods (22), leading to a significant increase in the prevalence of diabetes (23) and a high body-mass index (19), with a corresponding increase in the cancer burden. At the same time, suboptimal health care services (24), limited access to large-scale cancer screening programs (25) and poverty (26) also contribute to the rising cancer burden. Therefore, low SDI regions need to pay more attention to the cancer burden attributable to metabolic factors. The government needs to equip the health care system to support the primary prevention of metabolic diseases and strengthen education about healthy lifestyles.
Significant heterogeneity in the burden by sex in different regions was observed. In lower SDI regions, the burden on women is significantly higher than on men, which is diametrically the opposite of higher SDI regions. Occupation is a significant source of physical activity in many lower SDI regions. In South Asia, North Africa, the Middle East, Sub-Saharan Africa, Latin America and the Caribbean, men have significantly higher daily physical activity levels than women (27–32). The influx of refined carbohydrates and sweet foods, along with sex differences in related metabolic capabilities, contributes to a greater increase in triglyceride levels (33) and fasting plasma glucose levels in women. Therefore, in lower SDI regions, women are more likely to have a higher body mass index (34), leading to a corresponding increase in their cancer mortality burden. Increasing awareness of metabolic factors, better obesity management and fasting plasma glucose level monitoring are essential to narrow the sex gap.
In high SDI regions, the main death burden is concentrated in the age group of 70 years and above, which is closely related to the significant aging trend and the improvement of medical care standards in high SDI regions (35). In contrast, in low-SDI regions, the death burden population is mainly concentrated among people aged 50-69 years, and the trend of premature death is significantly higher than that in high-SDI regions. Poor health infrastructure (36), ineffective screening or lack of early application of effective screening methods and poor access to effective treatment (37) are probably responsible for this difference. Younger populations are the most economically productive members of society, and improving cancer prevention and diagnostic efficacy would not only lead to a huge societal impact but could also be cost-effective (38). Therefore, in low SDI regions, the government urgently needs to strengthen the construction of health infrastructure, encourage young people to engage in outdoor sports, reverse poor dietary patterns, and carry out management and screening of young groups for a high fasting plasma glucose and a high body mass index.
Our results show that the common main cancer type of cancer mortality burden attributable to metabolic factors is digestive system cancer (accounting for 50.11%), which is the core burden. Many epidemiological studies have consistently found that obese individuals have an increased risk of esophageal adenocarcinoma and colorectal cancer (39). Compared with nonhyperglycemic patients, gastrointestinal patients with elevated fasting plasma glucose have a higher risk of death (40), which may be related to increased circulating insulin levels (41) and chronic inflammation (42). In addition, high fasting plasma glucose and high body mass index are also closely related to the incidence of lung cancer and breast cancer (43–45). Therefore, controlling and preventing high fasting plasma glucose and high body mass index is an urgent problem to be solved in cancer prevention and control.
Conclusion
In conclusion, the global burden of cancer mortality attributable to metabolic factors has increased dramatically. Higher SDI regions have a higher burden, but the burden is shifting to lower SDI regions due to the increasing trend in lower SDI regions. Significant regional heterogeneity in sex differences was observed, and the burden on women in low SDI regions was significant. Metabolic-related cancer mortality tends to occur at younger ages, with a heavy premature death burden in low SDI regions. Gastrointestinal cancers are at the core of the current cancer mortality burden attributable to metabolic factors. Policies should be adopted in the future to reduce the burden of high body mass index and high fasting plasma glucose in the general population.
Data availability statement
Publicly available datasets were analyzed in this study. This data can be found here: http://ghdx.healthdata.org/gbd-results-tool.
Author contributionss
YZ contributed to study design, data collection, data analysis, data interpretation, and writing of the manuscript. YD contributed study conduct, data collection, and writing of the manuscript. NZ contributed data collection, analysis, and interpretation. MM contributed review, interpretation, and analysis. YL contributed data collection, data analysis, and data interpretation. JZ contributed data collection, data analysis, and data interpretation. SW and YY contributed study concept and design, chairing of steering committee, oversight of study implementation, extensive data analysis and interpretation, and writing and approval of final version of manuscript. All authors contributed to the article and approved the submitted version.
Funding
This study was supported by the Key R&D Program of Zhejiang Province (2021C03125 to YY), the National Natural Science Foundation of China (81872481 to YY, 82000619 to Yang Tian).
Acknowledgments
We highly appreciate the works by the Global Burden of Disease Study 2019 collaborators.
Conflict of interest
The authors declare that the research was conducted in the absence of any commercial or financial relationships that could be construed as a potential conflict of interest.
Publisher’s note
All claims expressed in this article are solely those of the authors and do not necessarily represent those of their affiliated organizations, or those of the publisher, the editors and the reviewers. Any product that may be evaluated in this article, or claim that may be made by its manufacturer, is not guaranteed or endorsed by the publisher.
Supplementary material
The Supplementary Material for this article can be found online at: https://www.frontiersin.org/articles/10.3389/fonc.2023.1032749/full#supplementary-material
References
1. Sung H, Ferlay J, Siegel RL, Laversanne M, Soerjomataram I, Jemal A, et al. Global cancer statistics 2020: GLOBOCAN estimates of incidence and mortality worldwide for 36 cancers in 185 countries. CA Cancer J Clin (2021) 71:209–49. doi: 10.3322/caac.21660
2. Murray CJL, Aravkin AY, Zheng P, Abbafati C, Abbas KM, Abbasi-Kangevari M, et al. Global burden of 87 risk factors in 204 countries and territories, 1990–2019: a systematic analysis for the global burden of disease study 2019. Lancet (2020) 396:1223–49. doi: 10.1016/S0140-6736(20)30752-2
3. Chen W, Xia C, Zheng R, Zhou M, Lin C, Zeng H, et al. Disparities by province, age, and sex in site-specific cancer burden attributable to 23 potentially modifiable risk factors in China: a comparative risk assessment. Lancet Glob Health (2019) 7:e257–69. doi: 10.1016/S2214-109X(18)30488-1
4. Safiri S, Nejadghaderi SA, Abdollahi M, Carson-Chahhoud K, Kaufman JS, Bragazzi NL, et al. Global, regional, and national burden of cancers attributable to tobacco smoking in 204 countries and territories, 1990–2019. Cancer Med (2022) 11:2662–78. doi: 10.1002/cam4.4647
5. Safiri S, Nejadghaderi SA, Karamzad N, Carson-Chahhoud K, Bragazzi NL, Sullman MJM, et al. Global, regional, and national cancer deaths and disability-adjusted life-years (DALYs) attributable to alcohol consumption in 204 countries and territories, 1990-2019. Cancer (2022) 128:1840–52. doi: 10.1002/cncr.34111
6. Deng Y, Wei B, Zhai Z, Zheng Y, Yao J, Wang S, et al. Dietary risk-related colorectal cancer burden: Estimates from 1990 to 2019. Front Nutr (2021) 8:690663. doi: 10.3389/fnut.2021.690663
7. GBD 2017 Colorectal Cancer Collaborators. The global, regional, and national burden of colorectal cancer and its attributable risk factors in 195 countries and territories, 1990–2017: a systematic analysis for the global burden of disease study 2017. Lancet Gastroenterol Hepatol (2019) 4:913–33. doi: 10.1016/S2468-1253(19)30345-0
8. GBD 2017 Oesophageal Cancer Collaborators. The global, regional, and national burden of oesophageal cancer and its attributable risk factors in 195 countries and territories, 1990–2017: a systematic analysis for the global burden of disease study 2017. Lancet Gastroenterol Hepatol (2020) 5:582–97. doi: 10.1016/S2468-1253(20)30007-8
9. GBD 2017 Stomach Cancer Collaborators. The global, regional, and national burden of stomach cancer in 195 countries, 1990–2017: a systematic analysis for the global burden of disease study 2017. Lancet Gastroenterol Hepatol (2019) 5:42–54. doi: 10.1016/S2468-1253(19)30328-0
10. GBD 2019 Diseases and Injuries Collaborators. Global burden of 369 diseases and injuries in 204 countries and territories, 1990-2019: a systematic analysis for the global burden of disease study 2019. Lancet (London England) (2020) 396:1204–22. doi: 10.1016/S0140-6736(20)30925-9
11. Lin L, Li Z, Yan L, Liu Y, Yang H, Li H. Global, regional, and national cancer incidence and death for 29 cancer groups in 2019 and trends analysis of the global cancer burden, 1990-2019. J Hematol Oncol (2021) 14:197. doi: 10.1186/s13045-021-01213-z
12. Qiu H, Cao S, Xu R. Cancer incidence, mortality, and burden in China: a time-trend analysis and comparison with the united states and united kingdom based on the global epidemiological data released in 2020. Cancer Commun (Lond) (2021) 41:1037–48. doi: 10.1002/cac2.12197
13. Kim HJ, Fay MP, Feuer EJ, Midthune DN. Permutation tests for joinpoint regression with applications to cancer rates. Stat Med (2000) 19:335–51. doi: 10.1002/(sici)1097-0258(20000215)19:3<335::aid-sim336>3.0.co;2-z
14. Lin X, Xu Y, Pan X, Xu J, Ding Y, Sun X, et al. Global, regional, and national burden and trend of diabetes in 195 countries and territories: an analysis from 1990 to 2025. Sci Rep (2020) 10:1–11. doi: 10.1038/s41598-020-71908-9
15. Xie W, Lundberg DJ, Collins JM, Johnston SS, Waggoner JR, Hsiao CW. Association of weight loss between early adulthood and midlife with all-cause mortality risk in the US. JAMA Netw Open (2020) 3. doi: 10.1001/jamanetworkopen.2020.13448
16. Wallace AS, Wang D, Shin J-I, Selvin E. Screening and diagnosis of prediabetes and diabetes in US children and adolescents. Pediatrics (2020) 146:e20200265. doi: 10.1542/peds.2020-0265
17. Turner LR, Harris MF, Mazza D. Obesity management in general practice: does current practice match guideline recommendations? Med J Aust (2015) 202:370–2. doi: 10.5694/mja14.00998
18. Magliano DJ, Chen L, Islam RM, Carstensen B, Gregg EW, Pavkov ME, et al. Trends in the incidence of diagnosed diabetes: a multicountry analysis of aggregate data from 22 million diagnoses in high-income and middle-income settings. Lancet Diabetes Endocrinol (2021) 9:203–11. doi: 10.1016/S2213-8587(20)30402-2
19. NCD Risk Factor Collaboration (NCD-RisC). Worldwide trends in body-mass index, underweight, overweight, and obesity from 1975 to 2016: a pooled analysis of 2416 population-based measurement studies in 128·9 million children, adolescents, and adults. Lancet Lond Engl (2017) 390:2627–42. doi: 10.1016/S0140-6736(17)32129-3
20. Hwalla N, Jaafar Z, Sawaya S. Dietary management of type 2 diabetes in the MENA region: A review of the evidence. Nutrients (2021) 13:1060. doi: 10.3390/nu13041060
21. Sung H, Siegel RL, Torre LA, Pearson-Stuttard J, Islami F, Fedewa SA, et al. Global patterns in excess body weight and the associated cancer burden. CA Cancer J Clin (2019) 69:88–112. doi: 10.3322/caac.21499
22. Gerbens-Leenes PW, Nonhebel S, Krol MS. Food consumption patterns and economic growth. increasing affluence and the use of natural resources. Appetite (2010) 55:597–608. doi: 10.1016/j.appet.2010.09.013
23. NCD Risk Factor Collaboration (NCD-RisC). Worldwide trends in diabetes since 1980: a pooled analysis of 751 population-based studies with 4.4 million participants. Lancet Lond Engl (2016) 387:1513–30. doi: 10.1016/S0140-6736(16)00618-8
24. Brown R, Kerr K, Haoudi A, Darzi A. Tackling cancer burden in the middle East: Qatar as an example. Lancet Oncol (2012) 13:e501–508. doi: 10.1016/S1470-2045(12)70461-8
25. Ginsberg GM, Lauer JA, Zelle S, Baeten S, Baltussen R. Cost effectiveness of strategies to combat breast, cervical, and colorectal cancer in sub-Saharan Africa and south East Asia: Mathematical modelling study. BMJ (2012) 344:e614. doi: 10.1136/bmj.e614
26. Harford JB. Barriers to overcome for effective cancer control in Africa. Lancet Oncol (2015) 16:e385–393. doi: 10.1016/S1470-2045(15)00160-6
27. Singh RB, Pella D, Mechirova V, Kartikey K, Demeester F, Tomar RS, et al. Prevalence of obesity, physical inactivity and undernutrition, a triple burden of diseases during transition in a developing economy. the five city study group. Acta Cardiol (2007) 62:119–27. doi: 10.2143/AC.62.2.2020231
28. Kelishadi R, Alikhani S, Delavari A, Alaedini F, Safaie A, Hojatzadeh E. Obesity and associated lifestyle behaviours in Iran: findings from the first national non-communicable disease risk factor surveillance survey. Public Health Nutr (2008) 11:246–51. doi: 10.1017/S1368980007000262
29. Al-Othaimeen AI, Al-Nozha M, Osman AK. Obesity: an emerging problem in Saudi arabia. analysis of data from the national nutrition survey. East Mediterr Health J Rev Sante Mediterr Orient Al-Majallah Al-Sihhiyah Li-Sharq Al-Mutawassit (2007) 13:441–8.
30. Rashidy-Pour A, Malek M, Eskandarian R, Ghorbani R. Obesity in the Iranian population. Obes Rev Off J Int Assoc Study Obes (2009) 10:2–6. doi: 10.1111/j.1467-789X.2008.00536.x
31. Sodjinou R, Agueh V, Fayomi B, Delisle H. Obesity and cardio-metabolic risk factors in urban adults of Benin: relationship with socio-economic status, urbanisation, and lifestyle patterns. BMC Public Health (2008) 8:84. doi: 10.1186/1471-2458-8-84
32. Bernstein A. Emerging patterns in overweight and obesity in Ecuador. Rev Panam Salud Publica Pan Am J Public Health (2008) 24:71–4. doi: 10.1590/s1020-49892008000700010
33. Knopp RH, Paramsothy P, Retzlaff BM, Fish B, Walden C, Dowdy A, et al. Gender differences in lipoprotein metabolism and dietary response: basis in hormonal differences and implications for cardiovascular disease. Curr Atheroscler Rep (2005) 7:472–9. doi: 10.1007/s11883-005-0065-6
34. NCD Risk Factor Collaboration (NCD-RisC) – Africa Working Group. Trends in obesity and diabetes across Africa from 1980 to 2014: an analysis of pooled population-based studies. Int J Epidemiol (2017) 46:1421–32. doi: 10.1093/ije/dyx078
35. Prince MJ, Wu F, Guo Y, Robledo LMG, O’Donnell M, Sullivan R, et al. The burden of disease in older people and implications for health policy and practice. Lancet (2015) 385:549–62. doi: 10.1016/S0140-6736(14)61347-7
36. Magrath I, Epelman S. Cancer in adolescents and young adults in countries with limited resources. Curr Oncol Rep (2013) 15:332–46. doi: 10.1007/s11912-013-0327-3
37. Gelband H, Sankaranarayanan R, Gauvreau CL, Horton S, Anderson BO, Bray F, et al. Costs, affordability, and feasibility of an essential package of cancer control interventions in low-income and middle-income countries: key messages from disease control priorities, 3rd edition. Lancet Lond Engl (2016) 387:2133–44. doi: 10.1016/S0140-6736(15)00755-2
38. Bleyer A. Young adult oncology: The patients and their survival challenges. CA Cancer J Clin (2007) 57:242–55. doi: 10.3322/canjclin.57.4.242
39. Donohoe CL, Pidgeon GP, Lysaght J, Reynolds JV. Obesity and gastrointestinal cancer. Br J Surg (2010) 97:628–42. doi: 10.1002/bjs.7079
40. Barone BB, Yeh H-C, Snyder CF, Peairs KS, Stein KB, Derr RL, et al. Long-term all-cause mortality in cancer patients with preexisting diabetes mellitus: a systematic review and meta-analysis. JAMA (2008) 300:2754–64. doi: 10.1001/jama.2008.824
41. Nead KT, Sharp SJ, Thompson DJ, Painter JN, Savage DB, Semple RK, et al. Evidence of a causal association between insulinemia and endometrial cancer: A mendelian randomization analysis. J Natl Cancer Inst (2015) 107:djv178. doi: 10.1093/jnci/djv178
42. Giovannucci E, Harlan DM, Archer MC, Bergenstal RM, Gapstur SM, Habel LA, et al. Diabetes and cancer: a consensus report. Diabetes Care (2010) 33:1674–85. doi: 10.2337/dc10-0666
43. Kang C, LeRoith D, Gallagher EJ. Diabetes, obesity, and breast cancer. Endocrinology (2018) 159:3801–12. doi: 10.1210/en.2018-00574
44. Yi ZH, Luther Y, Xiong GH, Ni YL, Yun F, Chen J. Association between diabetes mellitus and lung cancer: Meta-analysis. Eur J Clin Invest (2020) 50. doi: 10.1111/eci.13332
Keywords: global burden of disease study (GBD), cancer, mortality, age standardized rate (ASR), average annual percentage change (AAPC)
Citation: Zhang Y, Ding Y, Zhu N, Mi M, Lu Y, Zheng J, Weng S and Yuan Y (2023) Emerging patterns and trends in global cancer burden attributable to metabolic factors, based on the Global Burden of Disease Study 2019. Front. Oncol. 13:1032749. doi: 10.3389/fonc.2023.1032749
Received: 21 September 2022; Accepted: 05 January 2023;
Published: 19 January 2023.
Edited by:
Shailesh Advani, Terasaki Institute for Biomedical Innovation, United StatesReviewed by:
Priyadarshani Dharia, Moderna Inc., United StatesMarianna De Camargo Cancela, National Cancer Institute (INCA), Brazil
Copyright © 2023 Zhang, Ding, Zhu, Mi, Lu, Zheng, Weng and Yuan. This is an open-access article distributed under the terms of the Creative Commons Attribution License (CC BY). The use, distribution or reproduction in other forums is permitted, provided the original author(s) and the copyright owner(s) are credited and that the original publication in this journal is cited, in accordance with accepted academic practice. No use, distribution or reproduction is permitted which does not comply with these terms.
*Correspondence: Ying Yuan, eXVhbnlpbmcxOTk5QHpqdS5lZHUuY24=; Shanshan Weng, MjMxMDA1M0B6anUuZWR1LmNu
†These authors have contributed equally to this work and share first authorship