Abstract
Objective:
To investigate the correlations between quantitative diffusion parameters and prognostic factors and molecular subtypes of breast cancer, based on a single fast high-resolution diffusion-weighted imaging (DWI) sequence with mono-exponential (Mono), intravoxel incoherent motion (IVIM), diffusion kurtosis imaging (DKI) models.
Materials and Methods:
A total of 143 patients with histopathologically verified breast cancer were included in this retrospective study. The multi-model DWI-derived parameters were quantitatively measured, including Mono-ADC, IVIM-D, IVIM-D*, IVIM-f, DKI-Dapp, and DKI-Kapp. In addition, the morphologic characteristics of the lesions (shape, margin, and internal signal characteristics) were visually assessed on DWI images. Next, Kolmogorov–Smirnov test, Mann-Whitney U test, Spearman’s rank correlation, logistic regression, receiver operating characteristic (ROC) curve, and Chi-squared test were utilized for statistical evaluations.
Results:
The histogram metrics of Mono-ADC, IVIM-D, DKI-Dapp, and DKI-Kapp were significantly different between estrogen receptor (ER)-positive vs. ER-negative groups, progesterone receptor (PR)-positive vs. PR-negative groups, Luminal vs. non-Luminal subtypes, and human epidermal receptor factor-2 (HER2)-positive vs. non-HER2-positive subtypes. The histogram metrics of Mono-ADC, DKI-Dapp, and DKI-Kapp were also significantly different between triple-negative (TN) vs. non-TN subtypes. The ROC analysis revealed that the area under the curve considerably improved when the three diffusion models were combined compared with every single model, except for distinguishing lymph node metastasis (LNM) status. For the morphologic characteristics of the tumor, the margin showed substantial differences between ER-positive and ER-negative groups.
Conclusions:
Quantitative multi-model analysis of DWI showed improved diagnostic performance for determining the prognostic factors and molecular subtypes of breast lesions. The morphologic characteristics obtained from high-resolution DWI can be identifying ER statuses of breast cancer.
Introduction
Diffusion-weighted imaging (DWI) has been proven to be a potential diagnostic tool for the evaluation of breast lesions (1). In clinical practice, single-shot echo planar imaging (ss-EPI) sequence is commonly utilized in breast DWI protocols due to fast acquisition time (2, 3). However, previous studies have seldom evaluated the morphologic analysis of lesions on ss-EPI images due to geometric distortion and poor spatial resolution (4, 5). Readout-segmented EPI (rs-EPI) can reduce distortions and maintain high resolution, but it was limited by long scan times (6). Recently, the simultaneous multislice (SMS) technique, which allows the exciting acquire multiple slices at once, has been introduced to reduce the scan time (7, 8). The SMS technique was combined with rs-EPI to generate images with less image distortion and higher spatial resolution for breast lesions in a clinically acceptable scanning duration (9, 10). The application of SMS rs-EPI makes it feasible to qualitatively assess the morphologic characteristics of breast lesions.
In addition to the qualitative analysis of SMS rs-EPI images, our study also focused on the quantitative analysis of multi-model DWI. Conventional DWI is based on a mono-exponential (Mono) model that was first proposed to reflect the random Brownian motion of water molecules diffusing into biological media by quantifying apparent diffusion coefficient (ADC) values (11). However, water diffusion in complex biological media may be influenced by the blood microcirculation in capillaries, leading to a non-Gaussian distribution (12, 13). To address this, advanced diffusion models, including intravoxel incoherent motion (IVIM) and diffusion kurtosis imaging (DKI), have been developed to reflect the diffusion behavior of water molecules in tumors more accurately (14). A few studies have investigated the correlations between IVIM- or DKI-derived parameters with several clinical prognostic factors and molecular subtypes. However, the conclusions have still not reached a consensus (15, 16). Furthermore, most studies have reported that more information can be parsed from histogram analysis, which can reflect the microstructures and heterogeneity of breast cancer (17–20).
Therefore, the aim of this study was to apply three diffusion models (Mono, IVIM, and DKI) to determine the parameters valuable for differentiating between prognostic factor statuses and molecular subtypes, as well as to assess the correlations of morphologic characteristics with prognostic factors and molecular subtypes.
Materials and methods
Patients
This retrospective study was approved by our institutional review board, and informed consent was obtained. From September 2020 to May 2021, 216 female patients who underwent breast MRI in our hospital and fulfilled the following criteria were selected: (1) the patients did not undergo chemotherapy, or any other interventions before they were examined by MRI; (2) the pathologic type of breast lesions was confirmed by surgery or biopsy; and (3) relevant pathologic data of patients were complete. The exclusion criteria included: 1) non-mass like enhancement lesions detected on dynamic contrast-enhanced (DCE)-MRI (n = 34); 2) the max diameter of mass lesions< 1cm (n = 16); 3) poor DWI image quality due to patient motion or susceptibility artifact (n = 23). Only the largest lesion was analyzed when multiple lesions were detected in the bilateral breast. Finally, 143 patients (mean age, 48.57 ± 12.01 years, range, 26 – 81 years) with 143 mass lesions (mean diameter, 2.48 ± 0.95 cm) were included in the study. More detailed characteristics of the 143 patients are summarized in Table 1.
Table 1
| Characteristics | N (%) | |
|---|---|---|
| Age at diagnosis | ≤ 50 | 78 (54.5) |
| > 50 | 65 (45.5) | |
| Long diameter (cm) | > 2 | 91 (63.6) |
| ≤ 2 | 52 (36.4) | |
| Side | Right | 68 (47.6) |
| Left | 75 (52.4) | |
| Menopausal status | Premenopausal | 74 (51.7) |
| Postmenopausal | 69 (48.3) | |
| Histological type | IDC | 109 (76.2) |
| ILC | 11 (7.7) | |
| Papillary carcinoma | 8 (5.6) | |
| DCIS | 15 (10.5) | |
| ER | Positive | 80 (55.9) |
| Negative | 63 (44.1) | |
| PR | Positive | 76 (53.1) |
| Negative | 67 (46.9) | |
| HER2 | Positive | 48 (33.6) |
| Negative | 95 (66.4) | |
| Ki-67 | Positive | 79 (55.2) |
| Negative | 64 (44.8) | |
| LNM | Positive | 49 (34.3) |
| Negative | 94 (65.7) | |
| Molecular subtypes | ||
| Luminal A | 45 (31.5) | |
| Luminal B | 41 (28.7) | |
| HER2-positive | 25 (17.5) | |
| Triple-negative | 32 (22.3) | |
| Morphological features | ||
| Shape | Round | 24 (16.8) |
| Oval | 49 (34.3) | |
| Irregular | 70 (48.9) | |
| Margin | Smooth | 76 (53.1) |
| Spiculated | 16 (11.2) | |
| Irregular | 51 (35.7) | |
| Signal | Homogenous | 55 (38.4) |
| Heterogenous | 64 (44.8) | |
| Rim | 24 (16.8) | |
Study population and histopathological characteristics.
DCIS, Ductal carcinoma in situ; IDC, Invasive ductal carcinoma; ILC, Invasive lobular carcinoma; ER, Estrogen receptor; PR, Progesterone receptor; HER2, Human epidermal growth factor receptor 2; LNM, Lymph nodes metastasis; TN, Triple-negative.
MRI scans
Breast MRI was performed on a 3T MRI scanner (MAGNETOM Skyra, Siemens Healthcare, Erlangen, Germany) using a dedicated 16-channel phased-array bilateral breast surface coil. The breast MRI protocol included the following sequences: axial fat-saturated T2-weighted imaging, T1-weighted DCE-MRI with the time-resolved angiography (TWIST) with a volumetric interpolated breath-hold examination (VIBE) technique, and SMS rs-EPI sequence. Detailed imaging parameters are provided in Table 2.
Table 2
| Parameters | T2WI | SMS rs-EPI | DCE-MRI |
|---|---|---|---|
| Repetition time (ms) | 3700 | 2350 | 5.24 |
| Echo time (ms) | 101 | 72 | 2.46 |
| Field of view (mm2) | 320 x 320 | 280 x 280 | 320 x 320 |
| Matrix | 224 x 320 | 122 x 188 | 182 x 320 |
| Slice thickness (mm) | 4 | 5 | 1.5 |
| Pixel bandwidth (Hz/Px) | 347 | 887 | 780 |
| Parallel imaging | GRAPPA (x2) | GRAPPA (x2) | CAIPIRINHA (x4) |
| b-values (sec/mm2) | / | 0, 50, 100, 200, 400, 800, 1000, 2000 | / |
| Readout segment | / | 5 | / |
| Multi-slice mode | / | Slice acceleration (x2) | / |
| Temporal resolution (sec/phase) | / | / | 5.74 |
| Acquisition time (min:sec) | 2:06 | 4:39 | 5:57 |
Sequence parameters for T2-weighted imaging, SMS rs-EPI, and DCE-MRI.
SMS, Simultaneous multi-slice; DCE, Dynamic contrast-enhanced; GRAPPA, Generalized autocalibrating partially parallel acquisition; CAIPIRINHA, Controlled aliasing in parallel imaging results in higher acceleration.
/ indicates Non-applicable.
Image analysis
The images were independently analyzed by two breast readers (with 3 and 5 years of experience, respectively) using an in-house-developed DKI tool software. Both readers were informed that the patients had breast cancer but were blinded to the detailed pathologic data. Two-dimensional (2D) region of interest (ROI) were manually delineated, which excluded the cystic or necrotic portions of the tumor, on high-b-value (b=1000 s/mm2) SMS rs-EPI images, with the reference of the corresponding T2-weighted and DCE-MRI images. The ROI was then copied to other parametric maps [including ADC, pure diffusion (D), pseudo-diffusion coefficient (D*), perfusion fraction (f), apparent diffusional kurtosis (Kapp), and apparent diffusion coefficient (Dapp) maps] using the DKI tool software. Finally, the histogram information of each ROI map was generated, including mean, median, percentile values (25th and 75th), kurtosis, and skewness. For example, the mean and 75th percentile metrics of Mono-ADC were presented as Mono-ADCmean and Mono-ADC75th, respectively.
The corresponding mathematical expressions were as follows:
1. Mono-exponential model (16):
where Sb is the signal intensity on the DWI image at a certain b value (800 sec/mm2) and S0 is the signal intensity value in the voxels with b values of 0.
2.DKI model (21):
where Sb is he signal intensity on the DWI image according to all b-values (0, 50, 100, 200, 400, 800, 1000, and 2000 sec/mm2). Dapp represents the non-Gaussian diffusion coefficient and Kapp represents the apparent kurtosis coefficient without unit.
3. IVIM model (22):
where Sb is he signal intensity on the DWI image according to the b-value (0, 50, 100, 200, and 400 sec/mm2). D is the true diffusion coefficient representing the simple movement of water molecules in the tissue (unit: mm2/s), D* is the pseudo-diffusion coefficient representing perfusion-related diffusion (unit: mm2/s), and f is the fraction of fast diffusion representing the diffusion linked to microcirculation (0 ≤ f ≤ 1).
Morphologic analysis
Two experienced readers independently assessed several morphologic characteristics on SMS rs-EPI images with b = 1000 mm2/s according to the Breast Imaging Reporting and Data System lexicon (BI-RADS edition 2013). Since enhancement is mostly used to evaluate breast lesions on DCE-MRI, two readers evaluated breast lesions on DWI images using internal signal characteristics, which were defined as lesions with homogeneous signal, heterogeneous signal, or only high-signal at the rim (23, 24). Each morphological characteristic was specifically evaluated as follows:
-
Lesion shape: 1 for round, 2 for oval, 3 for irregular.
-
Lesion margin: 1 for smooth, 2 for spiculated, 3 for irregular.
-
Lesion internal signal characteristics: 1 for heterogeneous, 2 for homogeneous, 3 for rim.
-
The max diameter of lesion was measured on the largest tumor section.
Histopathologic assessment
Histopathologic results were obtained from the electronic medical records of each patient in our hospital. Estrogen receptor (ER) positivity and progesterone receptor (PR) positivity were defined as the presence of 1% or more positively stained nuclei in 10 high-power fields (25). Human epidermal growth factor receptor 2 (HER2) was considered positive if it was scored 3+ for immunohistochemically stained tissue, or gene amplification was observed with fluorescence in situ hybridization (FISH) (26). More than 20% of cancer nuclei were positively stained for Ki-67 (12). Lymph node metastasis (LNM) was confirmed by the clinician performing the histopathologic examination (13). According to the statuses of ER, PR, HER2, and Ki-67, the breast tumors were further classified as Luminal A, Luminal B, HER2-positive, and triple-negative (TN) (27).
Statistical analysis
All statistical analyses were performed using MedCalc software (version 15.0, Ostend, Belgium) and SPSS software (version 26.0, IL, USA). The inter-reader agreement for diffusion parameters and morphological characteristics was assessed by using the intraclass correlation coefficient (ICC): ICC ≤ 0.40, poor agreement; 0.40 - 0.59, fair agreement; 0.60 - 0.74, good agreement; 0.75 - 1.00, excellent agreement. The categorical variables were as follows: prognostic factors including ER, PR, HER2, Ki-67, and LNM (positive vs. negative) and molecular subtypes (Luminal type vs. non-Luminal type, TN type vs. non-TN type, and HER2-positive type vs. non-HER2-positive type). All data were tested first with the Kolmogorov–Smirnov test for normality analysis. The quantitative diffusion parameters and max diameter of lesions between different subgroups were compared using the Mann–Whitney U test. Spearman correlations were used to characterize the correlations of multi-model-derived histogram metrics with prognostic factors and molecular subtypes. With pathologic results as the gold standard, the receiver operating characteristic (ROC) curve analysis was used to assess the diagnostic efficacy of each parameter or each model, and the area under the ROC curve (AUC) was calculated. Then, the largest AUC of each parameter was selected to establish the IVIM model (D, D*, and f), the DKI model (Kapp and Dapp), and the combined three diffusion models (Mono, IVIM, and DKI) using logistic regression. The AUC comparisons were performed using the DeLong test. The morphologic characteristics were compared using the Chi-squared test. For all tests, the significance was set at p< 0.05/8 = 0.00625 (control for multiple comparisons across five prognostic factors and three molecular subtypes).
Results
Inter-reader agreement
As shown in Table 3, there was an excellent agreement between two readers regarding the representative mean and median metrics of diffusion parameters (range of ICCs, 0.827 – 0.939) and morphological characteristics including the shape, margin, and internal signal (range of ICCs, 0.857 – 0.890).
Table 3
| Parameters | Metrics | ICC | 95% Confidence Interval |
|---|---|---|---|
| Mono-ADC | mean | 0.893 | 0.854 – 0.922 |
| median | 0.882 | 0.839 – 0.914 | |
| IVIM-D | mean | 0.861 | 0.807 – 0.900 |
| median | 0.827 | 0.759 – 0.875 | |
| IVIM-D* | mean | 0.939 | 0.915 – 0.956 |
| median | 0.918 | 0.885 – 0.941 | |
| IVIM-f | mean | 0.832 | 0.766 – 0.879 |
| median | 0.871 | 0.820 – 0.907 | |
| DKI-Kapp | mean | 0.889 | 0.849 – 0.919 |
| median | 0.933 | 0.908 – 0.951 | |
| DKI-Dapp | mean | 0.927 | 0.900 – 0.947 |
| median | 0.918 | 0.888 – 0.940 | |
| Morphological characteristics | |||
| Shape | 0.857 | 0.807 – 0.895 | |
| Margin | 0.867 | 0.819 – 0.902 | |
| Internal signal | 0.890 | 0.851 – 0.920 | |
Interobserver agreement for diffusion parameters and morphological characteristics by two readers.
ICC, intraclass correlation coefficient. D* is pseudo-diffusion coefficient.
Relationship of diffusion parameters with prognostic factors and molecular subtypes
The histogram metrics of various diffusion parameters among prognostic factors and molecular subtypes of breast cancer are displayed in Table 4. For Mono-ADC, IVIM-D, and DKI-Dapp, all histogram metrics (mean, median, 25th, and 75th percentile) were significantly lower while DKI-Kapp histogram metrics were significantly higher in ER-positive groups compared to those in ER-negative groups (all p< 0.0625), the same trend was found in PR-positive groups compared with the PR-negative groups (all p< 0.0625).
Table 4
| ER | PR | HER2 | Ki-67 | ||||||
|---|---|---|---|---|---|---|---|---|---|
| Parameters | Histogram metrics | Negative | Positive | Negative | Positive | Negative | Positive | Negative | Positive |
| Mono-ADC | 25th | 0.869 ± 0.147 | 0.739 ± 0.118 | 0.853 ± 0.149 | 0.746 ± 0.125 | 0.789 ± 0.148 | 0.809 ± 0.144 | 0.788 ± 0.135 | 0.803 ± 0.156 |
| Median | 0.963 ± 0.163 | 0.812 ± 0.122 | 0.948 ± 0.163 | 0.817 ± 0.130 | 0.867 ± 0.160 | 0.902 ± 0.159 | 0.868 ± 0.144 | 0.888 ± 0.172 | |
| Mean | 0.979 ± 0.163 | 0.827 ± 0.126 | 0.964 ± 0.165 | 0.832 ± 0.131 | 0.880 ± 0.161 | 0.921 ± 0.160 | 0.881 ± 0.145 | 0.904 ± 0.174 | |
| 75th | 1.073 ± 0.192 | 0.906 ± 0.141 | 1.060 ± 0.192 | 0.909 ± 0.146 | 0.960 ± 0.181 | 1.018 ± 0.187 | 0.964 ± 0.168 | 0.991 ± 0.198 | |
| Kurtosis | 3.739 ± 1.815 | 3.650 ± 1.859 | 3.615 ± 1.783 | 3.755 ± 1.887 | 3.903 ± 2.001 | 3.266 ± 1.370 | 3.597 ± 1.708 | 3.764 ± 1.937 | |
| Skewness | 0.612 ± 0.676 | 0.509 ± 0.717 | 0.615 ± 0.633 | 0.500 ± 0.752 | 0.582 ± 0.741 | 0.499 ± 0.610 | 0.453 ± 0.764 | 0.636 ± 0.634 | |
| IVIM-D | 25th | 0.990 ± 0.234 | 0.857 ± 0.205 | 0.971 ± 0.231 | 0.867 ± 0.214 | 0.914 ± 0.229 | 0.919 ± 0.228 | 0.909 ± 0.230 | 0.921 ± 0.227 |
| Median | 1.128 ± 0.226 | 0.994 ± 0.174 | 1.113 ± 0.226 | 1.000 ± 0.178 | 1.044 ± 0.210 | 1.072 ± 0.207 | 1.041 ± 0.189 | 1.063 ± 0.224 | |
| Mean | 1.147 ± 0.223 | 1.008 ± 0.168 | 1.131 ± 0.224 | 1.016 ± 0.172 | 1.059 ± 0.205 | 1.091 ± 0.206 | 1.056 ± 0.181 | 1.080 ± 0.224 | |
| 75th | 1.280 ± 0.238 | 1.136 ± 0.185 | 1.266 ± 0.241 | 1.141 ± 0.184 | 1.182 ± 0.214 | 1.235 ± 0.232 | 1.183 ± 0.190 | 1.213 ± 0.243 | |
| Kurtosis | 3.440 ± 1.553 | 3.349 ± 1.366 | 3.376 ± 1.519 | 3.401 ± 1.390 | 3.585 ± 1.613 | 3.002 ± 0.944 | 3.416 ± 1.583 | 3.367 ± 1.337 | |
| Skewness | 0.459 ± 0.628 | 0.390 ± 0.608 | 0.481 ± 0.597 | 0.366 ± 0.631 | 0.465 ± 0.650 | 0.331 ± 0.537 | 0.328 ± 0.682 | 0.495 ± 0.550 | |
| IVIM-D* | 25th | 3.211 ± 4.432 | 2.775 ± 3.992 | 2.884 ± 3.961 | 3.040 ± 4.393 | 3.188 ± 4.477 | 2.530 ± 3.531 | 3.292 ± 4.543 | 2.704 ± 3.875 |
| Median | 8.321 ± 5.900 | 7.307 ± 5.040 | 7.857 ± 5.536 | 7.663 ± 5.387 | 7.818 ± 5.462 | 7.627 ± 5.448 | 8.050 ± 5.501 | 7.513 ± 5.412 | |
| Mean | 10.022 ± 4.871 | 9.096 ± 4.040 | 9.533 ± 4.460 | 9.478 ± 4.439 | 9.583 ± 4.435 | 9.347 ± 4.472 | 9.741 ± 4.719 | 9.312 ± 4.208 | |
| 75th | 14.621 ± 6.304 | 13.424 ± 5.334 | 14.180 ± 6.017 | 13.749 ± 5.617 | 14.020 ± 5.387 | 13.816 ± 6.576 | 13.963 ± 6.027 | 13.941 ± 5.632 | |
| Kurtosis | 5.959 ± 9.492 | 5.912 ± 4.516 | 5.874 ± 5.417 | 5.984 ± 4.538 | 5.868 ± 5.174 | 6.060 ± 4.527 | 5.445 ± 3.703 | 6.327 ± 5.762 | |
| Skewness | 1.282 ± 1.001 | 1.278 ± 0.907 | 1.256 ± 1.004 | 1.301 ± 0.898 | 1.236 ± 0.961 | 1.367 ± 0.921 | 6.327 ± 5.762 | 1.333 ± 1.029 | |
| IVIM-f | 25th | 0.027 ± 0.025 | 0.025 ± 0.023 | 0.026 ± 0.025 | 0.026 ± 0.025 | 0.027 ± 0.025 | 0.024 ± 0.021 | 0.026 ± 0.024 | 0.026 ± 0.023 |
| Median | 0.052 ± 0.029 | 0.051 ± 0.031 | 0.052 ± 0.029 | 0.052 ± 0.032 | 0.052 ± 0.032 | 0.052 ± 0.027 | 0.055 ± 0.033 | 0.050 ± 0.029 | |
| Mean | 0.058 ± 0.028 | 0.057 ± 0.030 | 0.057 ± 0.028 | 0.058 ± 0.031 | 0.057 ± 0.031 | 0.059 ± 0.027 | 0.061 ± 0.032 | 0.055 ± 0.027 | |
| 75th | 0.082 ± 0.041 | 0.081 ± 0.046 | 0.082 ± 0.040 | 0.082 ± 0.047 | 0.080 ± 0.046 | 0.084 ± 0.041 | 0.087 ± 0.049 | 0.077 ± 0.039 | |
| Kurtosis | 3.695 ± 2.332 | 3.597 ± 2.970 | 3.533 ± 2.255 | 3.735 ± 3.049 | 3.814 ± 3.168 | 3.296 ± 1.327 | 3.388 ± 1.720 | 3.845 ± 3.283 | |
| Skewness | 0.626 ± 0.709 | 0.624 ± 0.758 | 0.591 ± 0.702 | 0.654 ± 0.765 | 0.662 ± 0.786 | 0.551 ± 0.619 | 0.611 ± 0.643 | 0.635 ± 0.804 | |
| DKI-Kapp | 25th | 0.796 ± 0.128 | 0.901 ± 0.158 | 0.811 ± 0.126 | 0.893 ± 0.167 | 0.872 ± 0.159 | 0.820 ± 0.139 | 0.867 ± 0.142 | 0.844 ± 0.163 |
| Median | 0.883 ± 0.125 | 0.993 ± 0.165 | 0.895 ± 0.126 | 0.988 ± 0.171 | 0.956 ±0.168 | 0.921 ± 0.136 | 0.966 ± 0.137 | 0.927 ± 0.173 | |
| Mean | 0.878 ± 0.124 | 0.991 ± 0.148 | 0.890 ± 0.122 | 0.986 ± 0.155 | 0.956 ± 0.151 | 0.911 ± 0.140 | 0.957 ± 0.144 | 0.928 ± 0.151 | |
| 75th | 0.963 ± 0.133 | 1.081 ± 0.160 | 0.973 ± 0.128 | 1.078 ± 0.169 | 1.037 ± 0.164 | 1.013 ± 0.149 | 1.051 ± 0.154 | 1.011 ± 0.162 | |
| Kurtosis | 3.594 ± 2.031 | 3.653 ± 1.885 | 3.618 ± 2.153 | 3.635 ± 1.753 | 3.751 ± 1.909 | 3.381 ± 2.009 | 3.567 ± 1.765 | 3.675 ± 2.087 | |
| Skewness | -0.124 ± 0.752 | 0.005 ± 0.812 | -0.136 ± 0.742 | 0.023 ± 0.821 | 0.021 ± 0.804 | -0.195 ± 0.738 | -0.046 ± 0.813 | -0.056 ± 0.769 | |
| DKI-Dapp | 25th | 1.179 ± 0.209 | 1.003 ± 0.208 | 1.148 ± 0.211 | 1.014 ± 0.217 | 1.072 ± 0.238 | 1.087 ± 0.194 | 1.079 ± 0.206 | 1.075 ± 0.239 |
| Median | 1.318 ± 0.227 | 1.124 ± 0.203 | 1.298 ± 0.227 | 1.131 ± 0.213 | 1.195 ± 0.241 | 1.238 ± 0.219 | 1.205 ± 0.217 | 1.213 ± 0.249 | |
| Mean | 1.335 ± 0.223 | 1.146 ± 0.205 | 1.316 ± 0.225 | 1.153 ± 0.211 | 1.215 ± 0.241 | 1.259 ± 0.211 | 1.222 ± 0.217 | 1.236 ± 0.245 | |
| 75th | 1.481 ± 0.265 | 1.274 ± 0.220 | 1.467 ± 0.265 | 1.276 ± 0.224 | 1.339 ± 0.262 | 1.417 ± 0.256 | 1.352 ± 0.245 | 1.377 ± 0.275 | |
| Kurtosis | 3.469 ± 1.641 | 3.311 ± 1.160 | 3.314 ± 1.575 | 3.439 ± 1.210 | 3.552 ± 1.528 | 3.041 ± 0.992 | 3.419 ± 1.243 | 3.349 ± 1.505 | |
| Skewness | 0.503 ± 0.671 | 0.471 ± 0.604 | 0.507 ± 0.602 | 0.466 ± 0.661 | 0.540 ± 0.657 | 0.377 ± 0.571 | 0.387 ± 0.673 | 0.562 ± 0.590 | |
| LNM | Luminal | TN | HER2 | ||||||
| Parameters | Histogram metrics | Negative | Positive | Non-Luminal | Luminal | Non-TN | TN | Non-HER2-positive | HER2-positive |
| Mono-ADC | 25th | 0.805 ± 0.151 | 0.780 ± 0.137 | 0.878 ± 0.142 | 0.742 ± 0.123 | 0.772 ± 0.139 | 0.878 ± 0.143 | 0.779 ± 0.142 | 0.877 ± 0.144 |
| Median | 0.885 ± 0.165 | 0.867 ± 0.150 | 0.975 ± 0.159 | 0.815 ± 0.126 | 0.853 ± 0.150 | 0.967 ± 0.163 | 0.856 ± 0.152 | 0.984 ± 0.155 | |
| Mean | 0.903 ± 0.167 | 0.877 ± 0.150 | 0.991 ± 0.160 | 0.830 ± 0.128 | 0.869 ± 0.152 | 0.982 ± 0.165 | 0.871 ± 0.154 | 1.002 ± 0.155 | |
| 75th | 0.986 ± 0.192 | 0.966 ± 0.172 | 1.087 ± 0.190 | 0.908 ± 0.143 | 0.953 ± 0.174 | 1.071 ± 0.196 | 0.952 ± 0.174 | 1.107 ± 0.184 | |
| Kurtosis | 3.726 ± 1.954 | 4.084 ± 2.561 | 3.733 ± 1.897 | 3.660 ± 1.802 | 3.645 ± 1.780 | 3.842 ± 2.032 | 3.709 ± 1.860 | 3.593 ± 1.738 | |
| Skewness | 0.645 ± 0.635 | 0.380 ± 0.785 | 0.616 ± 0.667 | 0.513 ± 0.720 | 0.525 ± 0.704 | 0.657 ± 0.680 | 0.552 ± 0.709 | 0.564 ± 0.661 | |
| IVIM-D | 25th | 0.920 ± 0.249 | 0.907 ± 0.182 | 0.996 ± 0.236 | 0.862 ± 0.206 | 0.897 ± 0.210 | 0.981 ± 0.273 | 0.895 ± 0.231 | 1.016 ± 0.181 |
| Median | 1.057 ± 0.225 | 1.046 ± 0.174 | 1.138 ± 0.227 | 0.997 ± 0.175 | 1.034 ± 0.195 | 1.120 ± 0.240 | 1.030 ± 0.201 | 1.160 ± 0.212 | |
| Mean | 1.073 ± 0.220 | 1.063 ± 0.177 | 1.158 ± 0.224 | 1.011 ± 0.169 | 1.049 ± 0.189 | 1.142 ± 0.242 | 1.047 ± 0.199 | 1.178 ± 0.202 | |
| 75th | 1.201 ± 0.232 | 1.198 ± 0.199 | 1.294 ± 0.239 | 1.137 ± 0.184 | 1.178 ± 0.209 | 1.276 ± 0.248 | 1.174 ± 0.211 | 1.319 ± 0.231 | |
| Kurtosis | 3.437 ± 1.540 | 3.296 ± 1.259 | 3.368 ± 1.521 | 3.403 ± 1.405 | 3.323 ± 1.354 | 3.617 ± 1.737 | 3.461 ± 1.497 | 3.049 ± 1.145 | |
| Skewness | 0.429 ± 0.614 | 0.403 ± 0.625 | 0.470 ± 0.590 | 0.387 ± 0.633 | 0.394 ± 0.613 | 0.513 ± 0.628 | 0.421 ± 0.632 | 0.416 ± 0.547 | |
| IVIM-D* | 25th | 3.278 ± 4.341 | 2.371 ± 3.831 | 3.033 ± 4.076 | 2.923 ± 4.275 | 2.779 ± 4.028 | 3.619 ± 4.689 | 3.112 ± 4.381 | 2.282 ± 3.055 |
| Median | 8.010 ± 5.551 | 7.262 ± 5.238 | 8.117 ± 5.747 | 7.513 ± 5.246 | 7.642 ± 5.281 | 8.140 ± 6.029 | 7.683 ± 5.450 | 8.088 ± 5.488 | |
| Mean | 9.706 ± 4.516 | 9.116 ± 4.289 | 9.726 ± 4.687 | 9.356 ± 4.278 | 9.356 ± 4.298 | 10.015 ± 4.913 | 9.535 ± 4.447 | 9.357 ± 4.454 | |
| 75th | 14.146 ± 5.909 | 13.578 ± 5.599 | 14.291 ± 6.284 | 13.736 ± 5.466 | 13.732 ± 5.710 | 14.712 ± 6.095 | 13.994 ± 5.634 | 13.752 ± 6.604 | |
| Kurtosis | 6.106 ± 5.296 | 5.600 ± 4.243 | 5.984 ± 5.763 | 5.899 ± 4.367 | 6.014 ± 4.668 | 5.648 ± 5.904 | 5.831 ± 4.806 | 6.412 ± 5.668 | |
| Skewness | 1.287 ± 0.998 | 1.267 ± 0.847 | 1.270 ± 1.049 | 1.287 ± 0.878 | 1.306 ± 0.933 | 1.191 ± 1.002 | 1.261 ± 0.910 | 1.371 ± 1.118 | |
| IVIM-f | 25th | 0.027 ± 0.023 | 0.023 ± 0.025 | 0.027 ± 0.025 | 0.025 ± 0.023 | 0.025 ± 0.023 | 0.029 ± 0.028 | 0.026 ± 0.024 | 0.024 ± 0.022 |
| Median | 0.053 ± 0.030 | 0.049 ± 0.032 | 0.053 ± 0.030 | 0.051 ± 0.031 | 0.051 ± 0.030 | 0.055 ± 0.034 | 0.052 ± 0.032 | 0.050 ± 0.025 | |
| Mean | 0.059 ± 0.030 | 0.055 ± 0.029 | 0.059 ± 0.029 | 0.057 ± 0.030 | 0.056 ± 0.028 | 0.062 ± 0.035 | 0.058 ± 0.031 | 0.054 ± 0.019 | |
| 75th | 0.083 ± 0.045 | 0.079 ± 0.042 | 0.084 ± 0.042 | 0.080 ± 0.045 | 0.080 ± 0.041 | 0.088 ± 0.052 | 0.082 ± .047 | 0.078 ± 0.024 | |
| Kurtosis | 3.719 ± 3.064 | 3.490 ± 1.825 | 3.597 ± 2.395 | 3.669 ± 2.896 | 3.570 ± 2.628 | 3.882 ± 2.965 | 3.727 ± 2.904 | 3.231 ± 1.335 | |
| Skewness | 0.618 ± 0.785 | 0.638 ± 0.632 | 0.591 ± 0.744 | 0.647 ± 0.731 | 0.607 ± 0.713 | 0.684 ± 0.814 | 0.657 ± 0.751 | 0.471 ± 0.641 | |
| DKI-Kapp | 25th | 0.846 ± 0.169 | 0.871 ± 0.119 | 0.794 ± 0.124 | 0.895 ± 0.159 | 0.867 ± 0.164 | 0.813 ± 0.106 | 0.873 ± 0.151 | 0.769 ± 0.141 |
| Median | 0.936 ± 0.170 | 0.960 ± 0.133 | 0.879 ± 0.125 | 0.988 ± 0.164 | 0.961 ± 0.164 | 0.887 ± 0.121 | 0.961 ± 0.159 | 0.867 ± 0.131 | |
| Mean | 0.932 ± 0.156 | 0.957 ± 0.132 | 0.873 ± 0.119 | 0.986 ± 0.149 | 0.957 ± 0.155 | 0.886 ± 0.105 | 0.959 ± 0.145 | 0.856 ± 0.136 | |
| 75th | 1.020 ± 0.167 | 1.047 ± 0.144 | 0.956 ± 0.127 | 1.077 ± 0.161 | 1.049 ± 0.165 | 0.961 ± 0.117 | 1.046 ± 0.158 | 0.950 ± 0.141 | |
| Kurtosis | 3.388 ± 1.489 | 4.084 ± 2.561 | 3.738 ± 2.298 | 3.553 ± 1.679 | 3.629 ± 1.951 | 3.619 ± 1.951 | 3.571 ± 1.749 | 3.891 ± 2.713 | |
| Skewness | -0.068 ± 0.708 | -0.020 ± 0.926 | -0.151 ± 0.789 | 0.015 ± 0.782 | -0.060 ± 0.801 | -0.023 ± 0.744 | 0.001 ± 0.769 | -0.315 ± 0.830 | |
| DKI-Dapp | 25th | 1.084 ± 0.235 | 1.062 ± 0.201 | 1.185 ±0.197 | 1.005 ± 0.212 | 1.044 ± 0.217 | 1.192 ± 0.211 | 1.056 ± 0.227 | 1.176 ± 0.182 |
| Median | 1.214 ±0.243 | 1.201 ± 0.219 | 1.335 ±0.218 | 1.126 ± 0.207 | 1.176 ± 0.225 | 1.326 ± 0.230 | 1.180 ± 0.230 | 1.345 ± 0.205 | |
| Mean | 1.238 ± 0.242 | 1.214 ± 0.213 | 1.352 ± 0.216 | 1.148 ± 0.206 | 1.196 ± 0.221 | 1.347 ± 0.234 | 1.202 ± 0.231 | 1.359 ± 0.195 | |
| 75th | 1.371 ± 0.270 | 1.354 ± 0.246 | 1.503 ± 0.261 | 1.275 ±0.220 | 1.331 ± 0.249 | 1.483 ± 0.272 | 1.331 ± 0.252 | 1.527 ± 0.250 | |
| Kurtosis | 3.458 ± 1.483 | 3.231 ± 1.189 | 3.414 ± 1.674 | 3.358 ± 1.174 | 3.290 ± 1.182 | 3.694 ± 1.937 | 3.449 ± 1.420 | 3.057 ± 1.026 | |
| Skewness | 0.563 ± 0.622 | 0.337 ± 0.631 | 0.500 ± 0.636 | 0.476 ± 0.633 | 0.444 ± 0.623 | 0.628 ± 0.654 | 0.517 ± 0.639 | 0.336 ± 0.585 | |
Comparisons of mono, IVIM and DKI histogram metrics between different groups with molecular prognostic factors and subtypes.
The data for significance is shown in bold (p < 0.0625). ER, Estrogen receptor; PR, Progesterone receptor; HER2, Human epidermal growth factor receptor 2; LNM, Lymph nodes metastasis; TN, Triple-negative.
Luminal type vs. non-Luminal type revealed that considerable differences originated from histogram metrics (mean, median, 25th, and 75th percentile) of Mono-ADC, IVIM-D, DKI-Kapp, and DKI-Dapp (all p< 0.0625). Significantly higher histogram metrics (mean, median, 25th, and 75th percentile) of Mono-ADC and DKI-Dapp while lower histogram metrics (mean, median, 25th, and 75th percentile) of DKI-Kapp were found in the TN type than in the non-TN type (all p< 0.0625). Additionally, the Mono-ADC (mean, median, 25th, and 75th percentile), IVIM-D(mean, median, and 75th percentile), and DKI-Dapp (mean, median, 25th, and 75th percentile) values were significantly higher and the DKI-Kapp (mean, median, and 25th percentile) values were significantly lower in the HER2-positive type than in the non-HER2-positive type (all p< 0.0625). No statistically significant difference was observed in the negative and positive groups between HER2, Ki-67, and LNM (all p > 0.00625).
Considerable correlations were observed between ER and PR groups as well as Luminal, TN, and HER2-positive types. Diffusion parameters (Mono-ADC, IVIM-D, DKI-Dapp, and DKI-Kapp) largely involved the histogram metrics (mean, median, 25th, and 75th percentile). When including all parameters in three diffusion models, 74 correlations were remarkable (Figure 1).
Figure 1
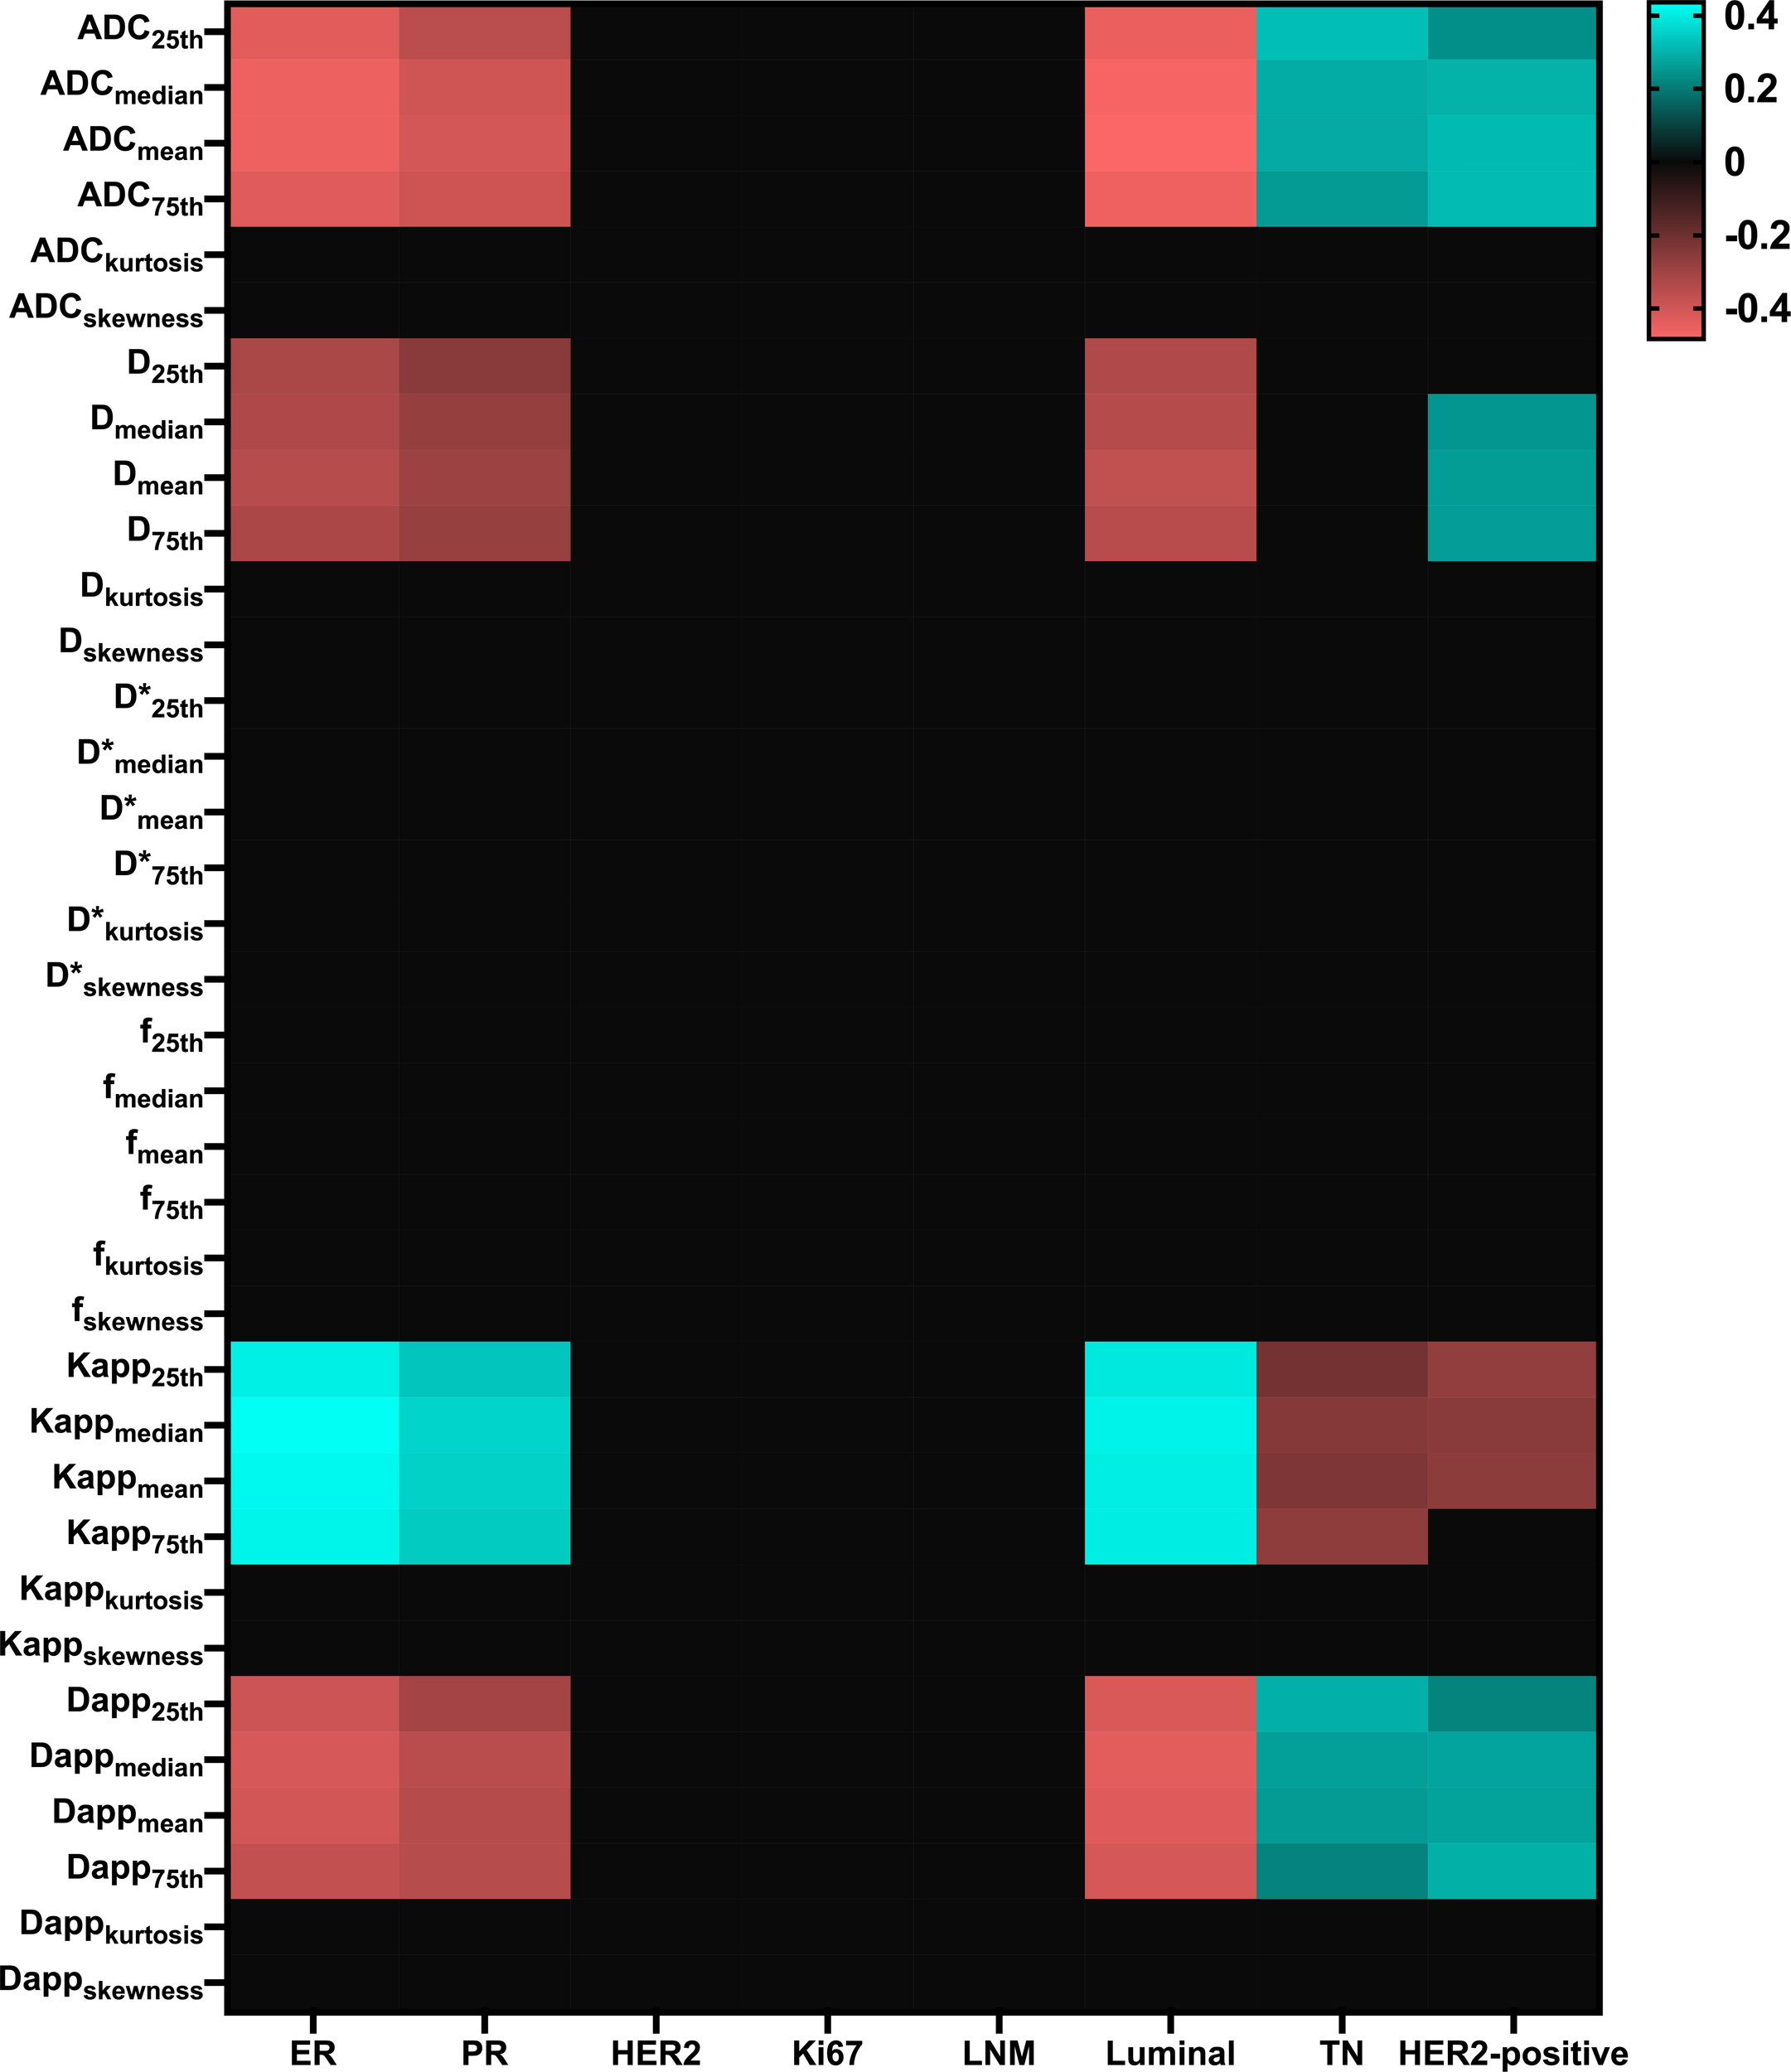
Matrix plot of the Pearson correlation coefficients between multi-model histogram parameters with molecular prognostic factors and subtypes. Colored entries indicate significant correlations (p<0.0625) with positive (blue) or negative (red). ER, Estrogen receptor; PR, Progesterone receptor; HER2, Human epidermal growth factor receptor 2; LNM, Lymph nodes metastasis; TN, Triple-negative.; D*, pseudo-diffusion coefficient.
Among single model parameters, Mono-ADCmedian and Mono-ADCmean generated the best AUC in the positive and negative groups between ER (AUC = 0.766, p< 0.001) and PR (AUC = 0.735, p< 0.001), respectively. Meanwhile, DKI-Kappkurtosis, IVIM-Dskewness, and DKI-Dappskewness generated the best AUC in the positive and negative groups between HER2 (AUC = 0.632, p = 0.010), Ki-67 (AUC = 0.572, p = 0.049), and LNM (AUC = 0.603, p = 0.044), respectively. Regarding the differentiation of Luminal type vs. non-Luminal type, TN type vs. non-TN type, as well as HER2-positive type vs. non-HER2-positive type, the best AUC was derived from the Mono-ADCmean (AUC = 0.785, p< 0.001), Mono-ADC25th (AUC = 0.719, p< 0.001), and Mono-ADC75th (AUC = 0.738, p< 0.001), respectively (Table 5).
Table 5
| ADC | D | D* | f | Kapp | Dapp | ADC | D | D* | f | Kapp | Dapp | |
|---|---|---|---|---|---|---|---|---|---|---|---|---|
| Metrics | ER-positive vs.ER-negative | PR-positive vs. PR-negative | ||||||||||
| 25th | 0.752 | 0.687 | 0.513 | 0.523 | 0.737 | 0.752 | 0.705 | 0.648 | 0.511 | 0.508 | 0.692 | 0.679 |
| Median | 0.766 | 0.693 | 0.551 | 0.512 | 0.753 | 0.739 | 0.730 | 0.662 | 0.510 | 0.512 | 0.707 | 0.704 |
| Mean | 0.765 | 0.702 | 0.555 | 0.511 | 0.746 | 0.734 | 0.735 | 0.671 | 0.506 | 0.507 | 0.704 | 0.699 |
| 75th | 0.750 | 0.689 | 0.585 | 0.526 | 0.742 | 0.717 | 0.728 | 0.665 | 0.534 | 0.531 | 0.698 | 0.701 |
| Kurtosis | 0.504 | 0.521 | 0.523 | 0.515 | 0.55 | 0.531 | 0.457 | 0.541 | 0.559 | 0.533 | 0.575 | 0.596 |
| Skewness | 0.518 | 0.537 | 0.535 | 0.514 | 0.538 | 0.507 | 0.516 | 0.549 | 0.556 | 0.527 | 0.558 | 0.514 |
| Single model | 0.766 | 0.706 | 0.755 | 0.735 | 0.671 | 0.719 | ||||||
| Three models | 0.784 | 0.747 | ||||||||||
| Metrics | HER2-positive vs. HER2-negative | Ki-67-positive vs. Ki-67-negative | ||||||||||
| 25th | 0.537 | 0.518 | 0.529 | 0.523 | 0.607 | 0.517 | 0.515 | 0.504 | 0.539 | 0.502 | 0.526 | 0.506 |
| Median | 0.565 | 0.541 | 0.500 | 0.540 | 0.581 | 0.557 | 0.518 | 0.508 | 0.524 | 0.557 | 0.544 | 0.505 |
| Mean | 0.584 | 0.552 | 0.503 | 0.559 | 0.581 | 0.566 | 0.524 | 0.516 | 0.522 | 0.563 | 0.535 | 0.509 |
| 75th | 0.593 | 0.578 | 0.509 | 0.575 | 0.547 | 0.602 | 0.525 | 0.519 | 0.502 | 0.558 | 0.542 | 0.519 |
| Kurtosis | 0.602 | 0.617 | 0.527 | 0.504 | 0.632 | 0.593 | 0.514 | 0.503 | 0.501 | 0.539 | 0.527 | 0.538 |
| Skewness | 0.554 | 0.579 | 0.545 | 0.537 | 0.572 | 0.588 | 0.569 | 0.572 | 0.508 | 0.508 | 0.508 | 0.560 |
| Single model | 0.602 | 0.620 | 0.622 | 0.569 | 0.588 | 0.611 | ||||||
| Three models | 0.659 | 0.630 | ||||||||||
| Metrics | LNM-positive vs. LNM-negative | Luminal vs. Non-Luminal | ||||||||||
| 25th | 0.550 | 0.540 | 0.563 | 0.577 | 0.546 | 0.543 | 0.766 | 0.697 | 0.501 | 0.521 | 0.733 | 0.746 |
| Median | 0.534 | 0.514 | 0.541 | 0.568 | 0.544 | 0.521 | 0.781 | 0704 | 0.5234 | 0.526 | 0.741 | 0.758 |
| Mean | 0.546 | 0.507 | 0.543 | 0.548 | 0.554 | 0.535 | 0.785 | 0.718 | 0.528 | 0.527 | 0.738 | 0.752 |
| 75th | 0.529 | 0.510 | 0.536 | 0.540 | 0.557 | 0.521 | 0.772 | 0.706 | 0.5151 | 0.545 | 0.737 | 0.741 |
| Kurtosis | 0.505 | 0.513 | 0.525 | 0.502 | 0.559 | 0.517 | 0.519 | 0.545 | 0.556 | 0.523 | 0.553 | 0.565 |
| Skewness | 0.592 | 0.501 | 0.514 | 0.514 | 0.525 | 0.603 | 0.503 | 0.529 | 0.561 | 0.529 | 0.562 | 0.532 |
| Single model | 0.592 | 0.580 | 0.617 | 0.785 | 0.722 | 0.773 | ||||||
| Three models | 0.616 | 0.796 | ||||||||||
| Metrics | TN vs. Non-TN | HER2-positive vs. Non-HER2-positive | ||||||||||
| 25th | 0.719 | 0.630 | 0.531 | 0.541 | 0.647 | 0.704 | 0.679 | 0.672 | 0.535 | 0.514 | 0.696 | 0.663 |
| Median | 0.701 | 0.625 | 0.525 | 0.513 | 0.673 | 0.684 | 0.726 | 0.689 | 0.527 | 0.526 | 0.696 | 0.707 |
| Mean | 0.697 | 0.636 | 0.532 | 0.529 | 0.662 | 0.678 | 0.737 | 0.698 | 0.508 | 0.511 | 0.701 | 0.705 |
| 75th | 0.677 | 0.620 | 0.549 | 0.526 | 0.685 | 0.648 | 0.738 | 0.699 | 0.526 | 0.543 | 0.672 | 0.723 |
| Kurtosis | 0.508 | 0.531 | 0.573 | 0.514 | 0.513 | 0.503 | 0.541 | 0.512 | 0.505 | 0.522 | 0.572 | 0.612 |
| Skewness | 0.531 | 0.569 | 0.577 | 0.526 | 0.519 | 0.555 | 0.532 | 0.624 | 0.509 | 0.579 | 0.625 | 0.620 |
| Single model | 0.719 | 0.655 | 0.714 | 0.738 | 0.714 | 0.738 | ||||||
| Three models | 0.736 | 0.747 | ||||||||||
AUC of histogram metrics derived from mono, IVIM, and DKI models to predict molecular prognostic factors and subtypes.
The best AUC of every diffusion parameter is shown in bold. ER, Estrogen receptor; PR, Progesterone receptor; HER2, Human epidermal growth factor receptor 2; LNM, Lymph nodes metastasis; TN, Triple-negative; D*, pseudo-diffusion coefficient.
Among single models, the DKI model generated the best AUC in the HER2-positive and HER2-negative groups (AUC = 0.622, p = 0.017), Ki-67-negative and Ki-67-positive groups (AUC = 0.611, p = 0.022), and LNM-positive and LNM-negative groups (AUC = 0.617, p = 0.022). The Mono model generated the best AUC in the ER-positive and ER-negative groups (AUC = 0.766, p< 0.001), PR-positive and PR-negative groups (AUC = 0.735, p< 0.001), Luminal type vs. non-Luminal type (AUC = 0.785, p< 0.001), as well as TN type vs. non-TN type (AUC = 0.719, p< 0.001). Both Mono and DKI models generated the best AUC in the HER2-positive type vs. non-HER2-positive type (AUC = 0.738, p< 0.001) (Table 5).
Regarding the differentiation of positive and negative groups between ER, PR, HER2, and Ki-67, the AUC of the combination of Mono, IVIM, and DKI resulted in the best discriminatory power compared with either model alone. The comparisons of Luminal type versus non-Luminal type, TN type versus non-TN type, and HER2-positive type versus non-HER2-positive type revealed that AUC considerably improved when the combination of Mono, IVIM, and DKI was used compared with either model alone (Table 5).
Comparison of morphologic characteristics between the groups of molecular prognostic factors and subtypes
As summarized in Table 6, the results demonstrated that the margin of breast cancer had significant differences between the ER-positive and ER-negative groups (p = 0.002). No significant differences were observed in residual groups (all p > 0.00625). Two representative cases are shown in Figures 2; 3.
Table 6
| Max diameter | Shape | Margin | Internal signal | ||||||||||||
|---|---|---|---|---|---|---|---|---|---|---|---|---|---|---|---|
| groups | p-value | Round | Oval | Irregular | p-value | smooth | spiculated | irregular | p-value | homogeneous | heterogeneous | rim | p-value | ||
| ER | Positive | 2.40 ± 0.96 | 0.269 | 11 | 37 | 32 | 0.092 | 52 | 13 | 15 | 0.002* | 39 | 27 | 14 | 0.040 |
| Negative | 2.59 ± 1.00 | 13 | 18 | 32 | 31 | 4 | 28 | 19 | 34 | 10 | |||||
| PR | Positive | 2.39 ± 0.90 | 0.209 | 11 | 34 | 31 | 0.253 | 49 | 9 | 18 | 0.187 | 21 | 34 | 12 | 0.097 |
| Negative | 2.59 ± 1.01 | 13 | 21 | 33 | 34 | 8 | 25 | 9 | 11 | 14 | |||||
| HER2 | Positive | 2.44 ± 0.90 | 0.788 | 10 | 16 | 22 | 0.544 | 27 | 6 | 15 | 0.953 | 20 | 19 | 9 | 0.840 |
| Negative | 2.51 ± 0.99 | 14 | 39 | 42 | 56 | 11 | 28 | 38 | 42 | 15 | |||||
| Ki-67 | Positive | 2.52 ± 0.94 | 0.409 | 17 | 30 | 32 | 0.214 | 51 | 7 | 21 | 0.186 | 30 | 34 | 15 | 0.668 |
| Negative | 2.43 ± 0.97 | 7 | 25 | 32 | 32 | 10 | 22 | 28 | 27 | 9 | |||||
| LNM | Positive | 2.48 ± 0.95 | 0.992 | 6 | 18 | 25 | 0.443 | 26 | 6 | 17 | 0.652 | 20 | 21 | 8 | 0.994 |
| Negative | 2.48 ± 0.96 | 12 | 39 | 35 | 57 | 11 | 26 | 38 | 40 | 16 | |||||
| Luminal vs. | 2.40 ± 0.93 | 0.230 | 12 | 16 | 29 | 0.106 | 55 | 13 | 18 | 0.010 | 42 | 30 | 14 | 0.034 | |
| Non-Luminal type | 2.60 ± 0.10 | 5 | 16 | 10 | 28 | 4 | 25 | 16 | 31 | 10 | |||||
| TN vs. | 2.62 ± 0.99 | 0.301 | 6 | 10 | 16 | 0.636 | 16 | 3 | 13 | 0.332 | 8 | 19 | 5 | 0.074 | |
| Non-TN type | 2.45 ± 0.95 | 18 | 45 | 48 | 67 | 14 | 30 | 50 | 42 | 19 | |||||
| HER2-positive vs. | 2.58 ± 1.03 | 0.680 | 6 | 6 | 13 | 0.230 | 12 | 1 | 12 | 0.069 | 8 | 12 | 5 | 0.626 | |
| Non-HER2-poitive type | 2.46 ± 0.84 | 18 | 49 | 51 | 71 | 16 | 31 | 50 | 49 | 19 | |||||
Magnetic resonance imaging morphological characteristics of molecular prognostic factors and subtypes.
*indicates that the correlation is significant at the level of 0.00625 (double-tailed). ER, Estrogen receptor; PR, Progesterone receptor; HER2, Human epidermal growth factor receptor 2; LNM, Lymph nodes metastasis; TN, Triple-negative.
Figure 2
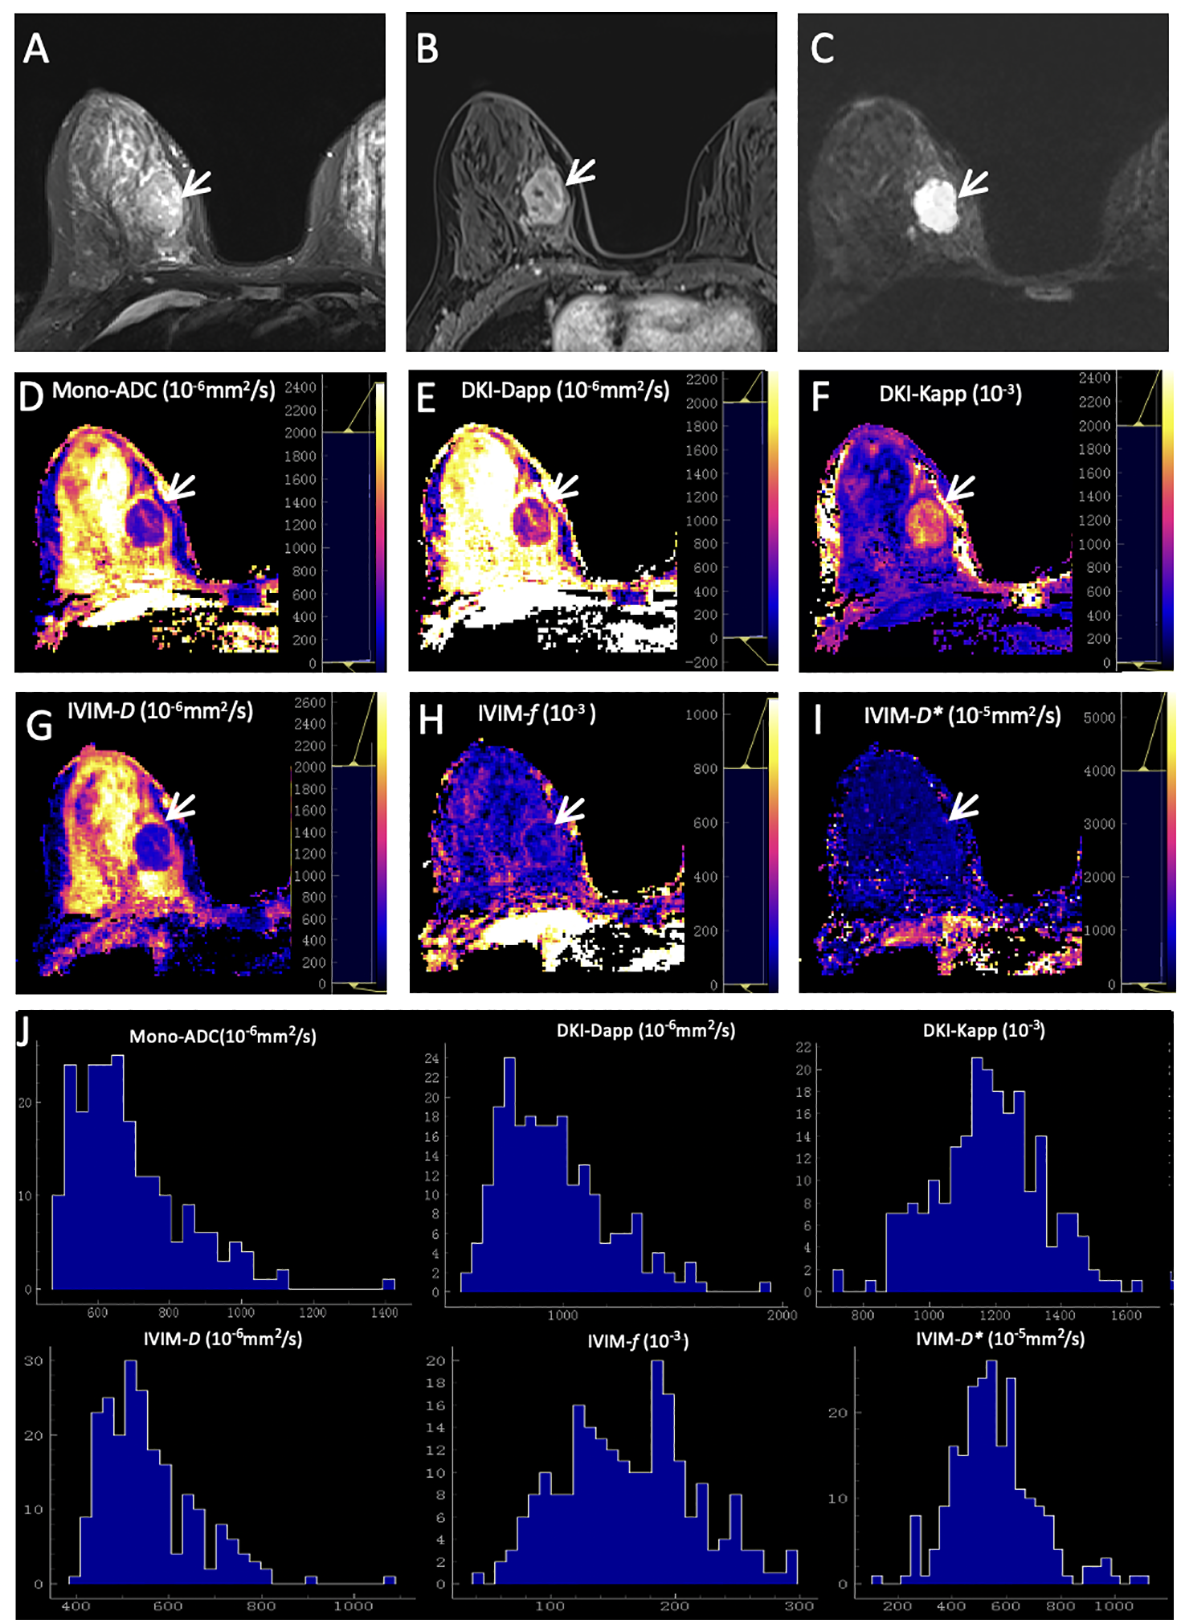
Representative images of a grade 2 invasive ductal carcinoma in the right breast of a 42-year-old woman. This tumor was with positive expression of estrogen receptor (95%) and progesterone receptor (20%), high Ki-67 (40%), and negative HER2 expression. (A) T2WI. (B) This mass is oval and with obvious enhancement (arrow) on axial DCE-MRI. (C) This mass shows oval shape, smooth margin, and homogeneous signal on DWI (b-value = 1000 mm2/s) (arrow). ADC (D), Dapp (E), Kapp (F), D(G), f(H), and D*(I) maps and histograms of each map (J) are as shown.
Figure 3
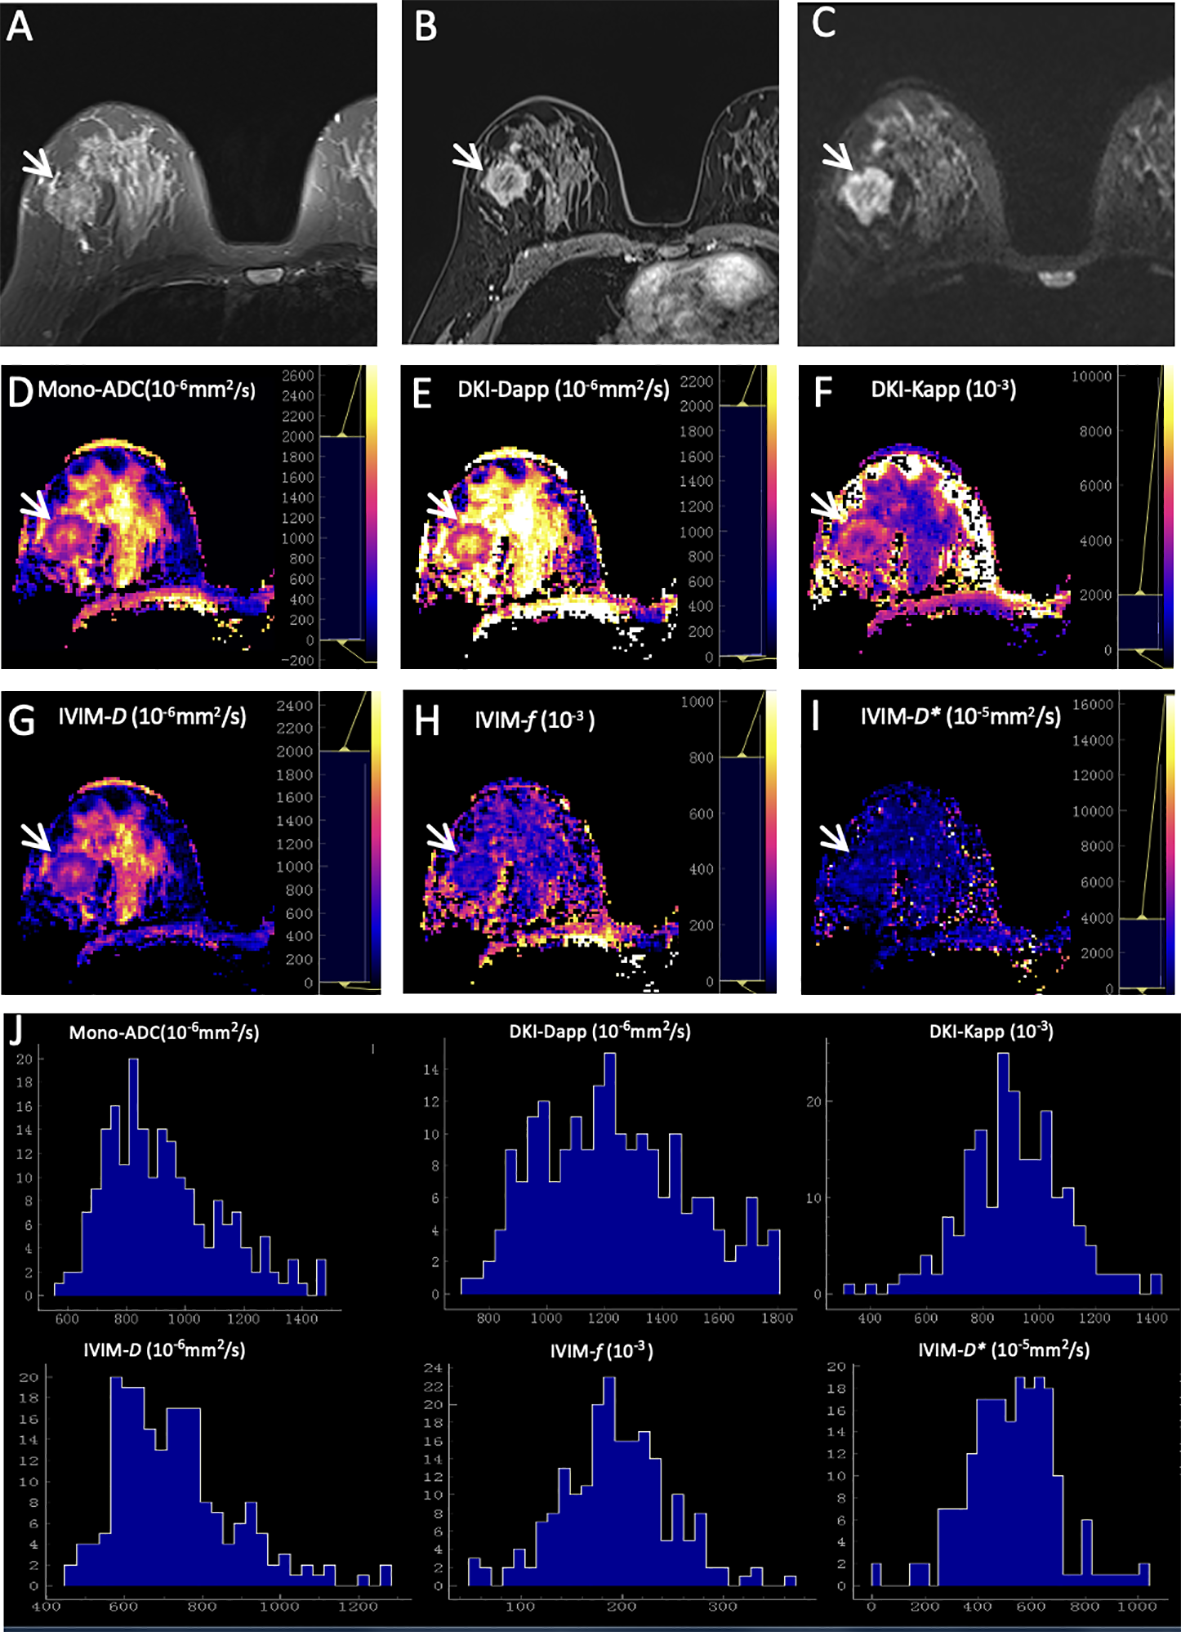
Representative images of a grade 3 invasive ductal carcinoma in the right breast of a 48-year-old woman. This tumor was with negative expression of estrogen receptor (0) and progesterone receptor (0), high Ki-67 (50%), and positive HER2 expression. (A) T2WI. (B) This mass is irregular and with obvious enhancement (arrow) on axial DCE-MRI. (C) This mass shows irregular shape, irregular margin, and heterogeneous signal on DWI (b-value = 1000 mm2/s) (arrow). ADC (D), Dapp (E), Kapp (F), D(G), f(H), and D*(I) maps and histograms of each map (J) are as shown.
Discussion
In this study, we evaluated the correlation of Mono, IVIM, and DKI parameters with prognostic factors and molecular subtypes of breast cancer using histogram analysis. The Mono and DKI models yielded greater AUC to discriminate prognostic factors and molecular subtypes compared with the IVIM model. The AUC significantly improved when the combination of the three diffusion models was used compared with either model alone except for discriminating LNM-positive and negative. Additionally, the qualitative DWI analysis based on the morphologic characteristics could distinguish between ER-positive and -negative groups.
Previous studies have demonstrated the correlations of diffusion parameters derived from Mono, IVIM, and DKI models with breast cancer prognostic factors (18, 26, 28, 29). ER overexpression could inhibit angiogenesis to reduce perfusion contribution as well as increase cellularity to restrict water diffusion (11, 12, 29). Low perfusion contribution and high cellularity could both result in decreased histogram metrics of Mono-ADC, DKI-Dapp, and IVIM-D and increased histogram metrics of DKI-Kapp in the ER-positive group. The higher DKI-Kappmean in ER-positive tumors was consistent with the result of Yang et al. (16). Due to similarities in hormone receptor effects, PR-positive tumors also have same trend as ER-positive tumors. In our study, the histogram metrics of various diffusion parameters failed to reveal a remarkable difference between the statuses of HER2, Ki-67, and LNM. We speculated that this difference might be related to the inclusion of lesions, the selection of the b values, and the delineation of the ROI.
In terms of molecular subtypes, we analyzed them statistically in the form of binary classification. Previous studies demonstrated that IVIM-D75th was lower in the Luminal type than in the HER2-positive type, and higher IVIM-D and lower IVIM-D* in Luminal A type than in the other subtypes (25, 30). These results were not entirely consistent with our study. Due to the Luminal type being defined as ER and/or PR positive, histogram metrics of Mono-ADC, IVIM-D, DKI-Dapp, and DKI-Kapp can be used to distinguish Luminal type from non-Luminal type, as similar to distinguishing ER and PR status. You et al. revealed that DKI-Kapp entropy value could identify the HER2-positive type and non-HER2-positive type (20). Our study also showed DKI-Kapp histogram metrics, particularly mean, median, and 25th percentile, could differentiate HER2-positive type and non-HER2-positive type. Suo et al. have demonstrated higher Mono-ADC values in the TN subtype than in other subtypes (12); this tendency was also observed in our study with higher Mono-ADC, IVIM-D, and DKI-Dapp histogram metrics in the TN type than those in the non-TN type. The reason may be that the TN type shows a decrease in tumor cellularity with an associated increase in diffusion (31, 32). In summary, various diffusion parameters can quantify tissue cell density, perfusion contribution, and water motion in vivo and may serve as a potential biomarker for differentiating molecular subtypes.
Besides comparing individual parameters, the ROC of various models was also compared. The present study revealed that the AUC of the Mono or DKI model was higher than that of the IVIM model. That is, the Mono or DKI model was superior to the IVIM model in evaluating the correlations of prognostic factors and molecular subtypes of breast cancers. Yang et al. demonstrated that the DKI model was not superior to the Mono model in reflecting the prognostic information of breast cancer (16). Cho et al. demonstrated that the AUC of the IVIM model was higher than that of the Mono model, whereas Feng reported that the AUC of the IVIM model was lower than that of the Mono model (15, 17). The contradictory results might have resulted from the distinct choices of multi-b values and poor repeatability of multi-models. Therefore, the diagnostic value of the three models with various ranges of multi-b values needs further exploration.
Kul et al. reported that the morphology evaluated on DWI provided 83%-84% accuracy in distinguishing between benign and malignant lesions (33). However, Kang et al. reported that the specificity of the high-signal rim in DWI was higher than that of the ADCmean value (80.6% vs. 63.9%) (34). Related studies include one by Cho, who showed that ER-positive tumor tends to show a not-circumscribed margin in mammography compared to ER-negative tumors (35). Different from our present study, the characteristic of smooth margin was more frequently observed in ER-positive tumors. Another study by Yuan et al, reported that the rate of burr sign in ER-positive in DCE-MRI was higher than that in negative groups (36). The trend was also observed in our study but was not significant. Although this study was a preliminary work, the morphologic characteristics assessed using SMS rs-EPI might provide a noninvasive tool for assessing the biologic characteristics and heterogeneity of breast cancers.
The present study had several limitations. First, the patient population was relatively small, and hence a selection bias might exist. Second, 2D ROI was manually drawn on the slice with the largest tumor diameter. This method did not reflect the overall tumor heterogeneity. Third, all MRI data were obtained in a single institution. Further studies are needed to verify the generalizability and reproducibility of our results.
In conclusion, the histogram metrics of multiparametric DWI and morphologic characteristics might be of use in providing prognostic information regarding breast cancer, thus potentially contributing to individualized treatment plans for patients with breast cancer.
Statements
Data availability statement
The datasets presented in this article are not readily available because the datasets generated or analyzed during the study are available from the corresponding author on reasonable request. Requests to access the datasets should be directed to YQ, yanjinqin125@163.com.
Author contributions
Conceptualization: YQ, FW, and TA. Data curation: YQ, CT, QH, LH. Formal analysis: YQ, QH, FW, and LH. Investigation: YQ, JY, and QH. Methodology: YQ, FW, CT, and MH. Project administration: TA. Software: TY and HZ. Supervision: TA. Visualization: YQ, FW, and MH. Writing - original draft: YQ and FW. Writing - review and editing: TA and TY. All authors contributed to the article and approved the submitted version.
Funding
This research was supported by the Keypoint Research and Development Program of Hubei Province (Grant Number: 2022BCE019).
Conflict of interest
Authors HZ and TY were employed by the company Siemens Healthineers Ltd.
The remaining authors declare that the research was conducted in the absence of any commercial or financial relationships that could be construed as a potential conflict of interest.
Publisher’s note
All claims expressed in this article are solely those of the authors and do not necessarily represent those of their affiliated organizations, or those of the publisher, the editors and the reviewers. Any product that may be evaluated in this article, or claim that may be made by its manufacturer, is not guaranteed or endorsed by the publisher.
References
1
Luo HB Du MY Liu YY Wang M Qing HM Wen ZP et al . Differentiation between luminal a and b molecular subtypes of breast cancer using pharmacokinetic quantitative parameters with histogram and texture features on preoperative dynamic contrast-enhanced magnetic resonance imaging. Acad Radiol (2020) 27(3):e35–44. doi: 10.1016/j.acra.2019.05.002
2
Weiss J Martirosian P Taron J Othman AE Kuestner T Erb M et al . Feasibility of accelerated simultaneous multislice diffusion-weighted MRI of the prostate. J Magn Reson Imaging (2017) 46(5):1507–15. doi: 10.1002/jmri.25665
3
Hu Y Zhan C Yang Z Zhang X Zhang H Liu W et al . Accelerating acquisition of readout-segmented echo planar imaging with a simultaneous multi-slice (SMS) technique for diagnosing breast lesions. Eur Radiol (2021) 31(5):2667–76. doi: 10.1007/s00330-020-07393-5
4
Tang C Qin Y Hu Q Ai T . Diagnostic value of multi-model high-resolution diffusion-weighted MR imaging in breast lesions: based on simultaneous multi-slice readout-segmented echo-planar imaging. Eur J Radiol (2022) 154:110439. doi: 10.1016/j.ejrad.2022.110439
5
Filli L Ghafoor S Kenkel D Liu W Weiland E Andreisek G et al . Simultaneous multi-slice readout-segmented echo planar imaging for accelerated diffusion-weighted imaging of the breast. Eur J Radiol (2016) 85(1):274–8. doi: 10.1016/j.ejrad.2015.10.009
6
Jiang JS Zhu LN Wu Q Sun Y Liu W Xu XQ et al . Feasibility study of using simultaneous multi-slice RESOLVE diffusion weighted imaging to assess parotid gland tumors: comparison with conventional RESOLVE diffusion weighted imaging. BMC Med Imaging (2020) 20(1):93. doi: 10.1186/s12880-020-00492-1
7
McKay JA Church AL Rubin N Emory TH Hoven NF Kuehn-Hajder JE et al . A comparison of methods for high-Spatial-Resolution diffusion-weighted imaging in breast MRI. Radiology (2020) 297(2):304–12. doi: 10.1148/radiol.2020200221
8
Phi Van VD Becker AS Ciritsis A Reiner CS Boss A . Intravoxel incoherent motion analysis of abdominal organs: application of simultaneous multislice acquisition. Invest Radiol (2018) 53(3):179–85. doi: 10.1097/RLI.0000000000000426
9
Barth M Breuer F Koopmans PJ Norris DG Poser BA . Simultaneous multislice (SMS) imaging techniques. Magn Reson Med (2016) 75(1):63–81. doi: 10.1002/mrm.25897
10
Tavakoli A Attenberger UI Budjan J Stemmer A Nickel D Kannengiesser S et al . Improved liver diffusion-weighted imaging at 3 T using respiratory triggering in combination with simultaneous multislice acceleration. Invest Radiol (2019) 54(12):744–51. doi: 10.1097/RLI.0000000000000594
11
Maric J Boban J Ivkovic-Kapicl T Djilas D Vucaj-Cirilovic V Bogdanovic-Stojanovic D . Differentiation of breast lesions and distinguishing their histological subtypes using diffusion-weighted imaging and ADC values. Front Oncol (2020) 10:332. doi: 10.3389/fonc.2020.00332
12
Suo S Zhang D Cheng F Cao M Hua J Lu J et al . Added value of mean and entropy of apparent diffusion coefficient values for evaluating histologic phenotypes of invasive ductal breast cancer with MR imaging. Eur Radiol (2019) 29(3):1425–34. doi: 10.1007/s00330-018-5667-9
13
Huang Y Lin Y Hu W Ma C Lin W Wang Z et al . Diffusion kurtosis at 3.0T as an in vivo imaging marker for breast cancer characterization: correlation with prognostic factors. J Magn Reson Imaging (2019) 49(3):845–56. doi: 1002/jmri.26249
14
He M Song Y Li H Lu J Li Y Duan S et al . Histogram analysis comparison of monoexponential, advanced diffusion-weighted imaging, and dynamic contrast-enhanced MRI for differentiating borderline from malignant epithelial ovarian tumors. J Magn Reson Imaging (2020) 52(1):257–68. doi: 10.1002/jmri.27037
15
Cho GY Moy L Kim SG Baete SH Moccaldi M Babb JS et al . Evaluation of breast cancer using intravoxel incoherent motion (IVIM) histogram analysis: comparison with malignant status, histological subtype, and molecular prognostic factors. Eur Radiol (2016) 26(8):2547–58. doi: 10.1007/s00330-015-4087-3
16
Yang ZL Li Y Zhan CA Hu YQ Guo YH Xia LM et al . Evaluation of suspicious breast lesions with diffusion kurtosis MR imaging and connection with prognostic factors. Eur J Radiol (2021) 145:110014. doi: 10.1016/j.ejrad.2021.110014
17
Feng W Gao Y Lu XR Xu YS Guo ZZ Lei JQ . Correlation between molecular prognostic factors and magnetic resonance imaging intravoxel incoherent motion histogram parameters in breast cancer. Magn Reson Imaging (2022) 85:262–70. doi: 10.1016/j.mri.2021.10.027
18
Kim EJ Kim SH Park GE Kang BJ Song BJ Kim YJ et al . Histogram analysis of apparent diffusion coefficient at 3.0t: correlation with prognostic factors and subtypes of invasive ductal carcinoma. J Magn Reson Imaging (2015) 42(6):1666–78. doi: 10.1002/jmri.24934
19
Choi Y Kim SH Youn IK Kang BJ Park WC Lee A et al . Rim sign and histogram analysis of apparent diffusion coefficient values on diffusion-weighted MRI in triple-negative breast cancer: comparison with ER-positive subtype. PloS One (2017) 12(5):e0177903. doi: 10.1371/journal.pone.0177903
20
You C Li J Zhi W Chen Y Yang W Gu Y et al . The volumetric-tumour histogram-based analysis of intravoxel incoherent motion and non-Gaussian diffusion MRI: association with prognostic factors in HER2-positive breast cancer. J Transl Med (2019) 17(1):182. doi: 10.1186/s12967-019-1911-6
21
Kang HS Kim JY Kim JJ Kim S Lee NK Lee JW et al . Diffusion kurtosis MR imaging of invasive breast cancer: correlations with prognostic factors and molecular subtypes. J Magn Reson Imaging (2022) 56(1):110–20. doi: 10.1002/jmri.27999
22
Le Bihan D . What can we see with IVIM MRI? Neuroimage (2019) 187:56–67. doi: 10.1016/j.neuroimage.2017.12.062
23
Kishimoto AO Kataoka M Iima M Honda M Miyake KK Ohashi A et al . The comparison of high-resolution diffusion weighted imaging (DWI) with high-resolution contrast-enhanced MRI in the evaluation of breast cancers. Magn Reson Imaging (2020) 71:161–9. doi: 10.1016/j.mri.2020.03.007
24
Barentsz MW Taviani V Chang JM Ikeda DM Miyake KK Banerjee S et al . Assessment of tumor morphology on diffusion-weighted (DWI) breast MRI: diagnostic value of reduced field of view DWI. J Magn Reson Imaging (2015) 42(6):1656–65. doi: 10.1002/jmri.24929
25
Lee YJ Kim SH Kang BJ Kang YJ Yoo H Yoo J et al . Intravoxel incoherent motion (IVIM)-derived parameters in diffusion-weighted MRI: associations with prognostic factors in invasive ductal carcinoma. J Magn Reson Imaging (2017) 45(5):1394–406. doi: 10.1002/jmri.25514
26
Suo S Cheng F Cao M Kang J Wang M Hua J et al . Multiparametric diffusion-weighted imaging in breast lesions: association with pathologic diagnosis and prognostic factors. J Magn Reson Imaging (2017) 46(3):740–50. doi: 10.1002/jmri.25612
27
Boria F Tagliati C Baldassarre S Ercolani P Marconi E Simonetti BF et al . Morphological MR features and quantitative ADC evaluation in invasive breast cancer: correlation with prognostic factors. Clin Imaging (2018) 50:141–6. doi: 10.1016/j.clinimag.2018.02.011
28
Horvat JV Iyer A Morris EA Apte A Bernard-Davila B Martinez DF et al . Histogram analysis and visual heterogeneity of diffusion-weighted imaging with apparent diffusion coefficient mapping in the prediction of molecular subtypes of invasive breast cancers. Contrast Media Mol Imaging (2019) 2019:2972189. doi: 10.1155/2019/2972189
29
Horvat JV Bernard-Davila B Helbich TH Zhang M Morris EA Thakur SB et al . Diffusion-weighted imaging (DWI) with apparent diffusion coefficient (ADC) mapping as a quantitative imaging biomarker for prediction of immunohistochemical receptor status, proliferation rate, and molecular subtypes of breast cancer. J Magn Reson Imaging (2019) 50(3):836–46. doi: 10.1002/jmri.26697
30
Kawashima H Miyati T Ohno N Ohno M Inokuchi M Ikeda H et al . Differentiation between luminal-a and luminal-b breast cancer using intravoxel incoherent motion and dynamic contrast-enhanced magnetic resonance imaging. Acad Radiol (2017) 24(12):1575–81. doi: 10.1016/j.acra.2017.06.016
31
Li Q Xiao Q Yang M Chai Q Huang Y Wu PY et al . Histogram analysis of quantitative parameters from synthetic MRI: correlations with prognostic factors and molecular subtypes in invasive ductal breast cancer. Eur J Radiol (2021) 139:109697. doi: 10.1016/j.ejrad.2021.109697
32
Youk JH Son EJ Chung J Kim JA Kim EK . Triple-negative invasive breast cancer on dynamic contrast-enhanced and diffusion-weighted MR imaging: comparison with other breast cancer subtypes. Eur Radiol (2012) 22(8):1724–34. doi: 10.1007/s00330-012-2425-2
33
Kul S Metin Y Kul M Metin N Eyuboglu I Ozdemir O et al . Assessment of breast mass morphology with diffusion-weighted MRI: beyond apparent diffusion coefficient. J Magn Reson Imaging (2018) 48(6):1668–77. doi: 10.1002/jmri.26175
34
Kang BJ Lipson JA Planey KR Zackrisson S Ikeda DM Kao J et al . Rim sign in breast lesions on diffusion-weighted magnetic resonance imaging: diagnostic accuracy and clinical usefulness. J Magn Reson Imaging (2015) 41(3):616–23. doi: 10.1002/jmri.24617
35
Cho N . Imaging features of breast cancer molecular subtypes: state of the art. J Pathol Transl Med (2021) 55(1):16–25. doi: 10.4132/jptm.2020.09.03
36
Yuan C Jin F Guo X Zhao S Li W Guo H et al . Correlation analysis of breast cancer DWI combined with DCE-MRI imaging features with molecular subtypes and prognostic factors. J Med Syst (2019) 43(4):83. doi: 10.1007/s10916-019-1197-5
Summary
Keywords
diffusion weight imaging, diffusion kurtosis imaging, intravoxel incoherent motion, breast cancer, prognosis, molecular subtypes
Citation
Qin Y, Wu F, Hu Q, He L, Huo M, Tang C, Yi J, Zhang H, Yin T and Ai T (2023) Histogram analysis of multi-model high-resolution diffusion-weighted MRI in breast cancer: correlations with molecular prognostic factors and subtypes. Front. Oncol. 13:1139189. doi: 10.3389/fonc.2023.1139189
Received
06 January 2023
Accepted
17 April 2023
Published
28 April 2023
Volume
13 - 2023
Edited by
Maryam Afzali, University of Leeds, United Kingdom
Reviewed by
Mami Iima, Kyoto University, Japan; Yan Lin, Second Affiliated Hospital of Shantou University Medical College, China
Updates
Copyright
© 2023 Qin, Wu, Hu, He, Huo, Tang, Yi, Zhang, Yin and Ai.
This is an open-access article distributed under the terms of the Creative Commons Attribution License (CC BY). The use, distribution or reproduction in other forums is permitted, provided the original author(s) and the copyright owner(s) are credited and that the original publication in this journal is cited, in accordance with accepted academic practice. No use, distribution or reproduction is permitted which does not comply with these terms.
*Correspondence: Tao Ai, aitao007@hotmail.com
†These authors have contributed equally to this work
Disclaimer
All claims expressed in this article are solely those of the authors and do not necessarily represent those of their affiliated organizations, or those of the publisher, the editors and the reviewers. Any product that may be evaluated in this article or claim that may be made by its manufacturer is not guaranteed or endorsed by the publisher.