 An Xu
An Xu Xiang-Nan Xu2†
- 1Medical College of Yangzhou University, Yangzhou, Jiangsu, China
- 2Department of Thyroid and Breast Surgery, Northern Jiangsu People’s Hospital, Yangzhou, Jiangsu, China
Background: Cancer-associated fibroblasts (CAFs) play a pivotal role in cancer progression and are known to mediate endocrine and chemotherapy resistance through paracrine signaling. Additionally, they directly influence the expression and growth dependence of ER in Luminal breast cancer (LBC). This study aims to investigate stromal CAF-related factors and develop a CAF-related classifier to predict the prognosis and therapeutic outcomes in LBC.
Methods: The Cancer Genome Atlas (TCGA) and Gene Expression Omnibus (GEO) databases were utilized to obtain mRNA expression and clinical information from 694 and 101 LBC samples, respectively. CAF infiltrations were determined by estimating the proportion of immune and cancer cells (EPIC) method, while stromal scores were calculated using the Estimation of STromal and Immune cells in MAlignant Tumors using Expression data (ESTIMATE) algorithm. Weighted gene co-expression network analysis (WGCNA) was used to identify stromal CAF-related genes. A CAF risk signature was developed through univariate and least absolute shrinkage and selection operator method (LASSO) Cox regression model. The Spearman test was used to evaluate the correlation between CAF risk score, CAF markers, and CAF infiltrations estimated through EPIC, xCell, microenvironment cell populations-counter (MCP-counter), and Tumor Immune Dysfunction and Exclusion (TIDE) algorithms. The TIDE algorithm was further utilized to assess the response to immunotherapy. Additionally, Gene set enrichment analysis (GSEA) was applied to elucidate the molecular mechanisms underlying the findings.
Results: We constructed a 5-gene prognostic model consisting of RIN2, THBS1, IL1R1, RAB31, and COL11A1 for CAF. Using the median CAF risk score as the cutoff, we classified LBC patients into high- and low-CAF-risk groups and found that those in the high-risk group had a significantly worse prognosis. Spearman correlation analyses demonstrated a strong positive correlation between the CAF risk score and stromal and CAF infiltrations, with the five model genes showing positive correlations with CAF markers. In addition, the TIDE analysis revealed that high-CAF-risk patients were less likely to respond to immunotherapy. Gene set enrichment analysis (GSEA) identified significant enrichment of ECM receptor interaction, regulation of actin cytoskeleton, epithelial-mesenchymal transition (EMT), and TGF-β signaling pathway gene sets in the high-CAF-risk group patients.
Conclusion: The five-gene prognostic CAF signature presented in this study was not only reliable for predicting prognosis in LBC patients, but it was also effective in estimating clinical immunotherapy response. These findings have significant clinical implications, as the signature may guide tailored anti-CAF therapy in combination with immunotherapy for LBC patients.
1 Introduction
Breast cancer (BC) is the most prevalent cancer among women worldwide and the second leading cause of cancer deaths (1, 2). While the current standard treatment for breast cancer has greatly improved survival, it remains a public health issue on a global scale (3). LBC is a subtype of breast cancer, including Luminal A and Luminal B, characterized by the presence of estrogen and/or progesterone receptors on the surface of cancer cells (4). Although LBC has the best prognosis among breast cancer subtypes, approximately 20-40% of LBCs eventually develop distant metastases, with half occurring 5 years or later after the diagnosis of the primary tumor (5). The tumor microenvironment (TME) in breast cancer comprises local factors, cancer cells, immune cells and stromal cells of the local and distant tissues (6, 7). Accumulating evidence indicated that the interaction between LBC cells and their microenvironment plays important roles in tumor proliferation, propagation and response to therapies (8–10).
CAFs are important components of the tumor microenvironment (TME) and are widely distributed in tumor stroma (11, 12). They play a crucial role in promoting tumor growth through direct effects on tumor cells and various interactions with receptors and ligands (13, 14). Moreover, they indirectly stimulate tumor growth and migration by releasing growth factors, cytokines, and exosomes, inducing metabolic reprogramming and anti-tumor resistance, and suppressing the immune system (15–17). Additionally, CAFs help to create a physical barrier through the deposition and reorganization of the extracellular matrix, which supports tumor cell invasion and restrains antitumor leukocyte infiltration, leading to tumor progression, immune evasion, and therapy resistance (18).
Studies have shown that CAFs can affect the response of LBC to hormone therapy, a common treatment, by altering the expression of estrogen receptors on cancer cells (19–21). Targeting CAFs can be achieved through various methods such as influencing secreted factors and signaling pathways, inducing a quiescent state in CAFs or targeting CAF-derived cells (18, 22). For example, losartan, an angiotensin receptor blocker, can convert myofibroblast CAFs into a quiescent state and enhance immune cell activity, thus improving the response of breast cancer cells to immune checkpoint blockers (23). In addition, blocking CD10 and GPR77 with neutralizing antibodies can decrease tumor growth and increase chemotherapy sensitivity in breast cancer models (24). Therefore, identifying common markers of CAFs can lead to the discovery of more specific markers and therapeutic targets for LBC.
Weighted gene co-expression network analysis (WGCNA) is a powerful bioinformatics algorithm that can identify highly and coordinately expressed genes and group them into gene modules to explore their relationships with a phenotype of interest (25). WGCNA has been previously used to identify cancer-associated fibroblast (CAF) markers (26–29). However, there has been no WGCNA analysis conducted on CAF and stromal infiltrations in LBC.
In this study, we employed WGCNA simultaneously on two transcriptome datasets from TCGA and GEO databases. We identified hub modules that were most correlated with stromal CAF infiltrations. Using univariate and Least Absolute Shrinkage and Selection Operator (LASSO) Cox regression analyses, we identified RIN2, THBS1, IL1R1, RAB31, and COL11A1 as prognostic CAF markers. We then constructed a five-gene CAF signature that could predict prognosis and therapeutic responses in LBC. Our findings suggest that the CAF model could be a promising anti-CAF therapeutic approach for LBC.
2 Materials and methods
2.1 The collection and preparation of data
The transcript per million (TPM) format RNA-seq data and clinical information relevant to Breast Invasive Carcinoma (TCGA-BRCA) samples were obtained from TCGA datasets (https://portal.gdc.cancer.gov/). The gene expression profiling dataset (GSE47994) was obtained from the Gene Expression Omnibus (https://www.ncbi.nlm.nih.gov/) database (30). We then screened a total of 694 LBC patients from the TCGA-BRCA dataset and 101 LBC patients from the GSE47994 dataset who had prognostic data available, with follow-up times exceeding 365 days.
2.2 The estimation of CAF infiltration and the calculation of stromal score
Four methods were utilized to estimate the abundance of CAFs, including the Estimate the Proportion of Immune and Cancer cells (EPIC) algorithm based on cell-type deconvolution using constrained least square optimization (31), the xCell algorithm based on gene signature enrichment (32), the microenvironment cell populations-counter (MCP-counter) based on marker gene expressions (33), and the Tumor Immune Dysfunction and Exclusion (TIDE) algorithms, which also can predict anti-PD1 and anti-CTLA4 responses in tumor patients (34). The first three methods were executed via the deconvolute() function of the immunedeconv R package (version 2.0.3) (35), while the TIDE method was implemented through http://tide.dfci.harvard.edu/. Additionally, the Estimation of STromal and Immune cells in MAlignant Tumor tissues using Expression data (ESTIMATE) algorithm was utilized to calculate the stromal score, which indicates the level of stromal infiltration in each tumor sample, through the estimate R package (version 1.0.13) (36).
2.3 The creation of CAF and stromal co-expression networks
The WGCNA R package (version 1.72) was utilized to construct co-expression networks and identify hub genes that target cancer-associated fibroblast (CAF) infiltrations and stromal scores (25). The input genes for network construction were selected based on the median absolute deviation (MAD), with the top 5,000 genes selected for both the TCGA-BRCA and GSE47994 cohorts. The Pearson’s correlation similarity matrix was calculated between each pair of genes (sij, where ij represents the gene pairs) and raised to a soft-thresholding power β (), based on the scale-free topology network criterion. The adjacency matrix was then clustered using the topological overlap measure (TOM) and dissimilarity (1-TOM) between genes, and a dynamic tree cut algorithm was applied to the dendrogram to identify gene modules with a minimum of 30 genes in each module. The first principal component of each module’s expression was summarized as a module eigengene (ME), and the Pearson’s correlations between MEs and EPIC-quantified CAF infiltrations, as well as the stromal score, were assessed to identify the most correlated module for further analysis. Hub genes were then identified by overlapping the most correlated module genes between the TCGA-BRCA and GSE47994 cohorts.
2.4 The analysis of gene ontology and the kyoto encyclopedia of genes and genomes
The clusterProfiler R package (version 3.14.3) was utilized to analyze the hub genes’ biological functions, which included biological processes (BPs), molecular functions (MFs), and cellular components (CCs), as well as pathways according to GO and KEGG databases (37). p < 0.05 was considered statistically significant.
2.5 The creation and verification of a predictive algorithm
For CAF risk model construction, 694 LBC cases from TCGA-BRCA were selected based on their large sample size. The validation cohort consisted of 101 LBC cases from GSE47994 cohort. Univariate Cox regression analysis was performed to identify prognostic stromal CAF hub genes for overall survival (OS). Genes with p < 0.05 were selected for LASSO Cox regression analysis with 1,000 iterations using glmnet R package to reduce the number of genes (38). Then, the CAF risk model was constructed as follows: CAF risk score = ∑ (βi * Expi), where βi is the LASSO coefficient of ith gene and Expi is the expression value of ith gene. Using the median CAF risk score of the training cohort as the threshold, LBC patients from both cohorts were classified into high- and low-CAF-risk groups and the OS difference between the two groups was estimated using Kaplan–Meier curves and the log-rank test.
2.6 The collection of CAF markers and the analysis of their correlation
We collected CAF specific and nonspecific markers from published literature (39, 40). To verify the reliability of our CAF model markers in LBC, we examined the Spearman’s correlations between the CAF risk score and the stromal score, as well as various CAF infiltration estimates (EPIC, xCell, MCP-counter, and TIDE). We also analyzed the correlations between CAF model genes and published CAF markers in both TCGA-BRCA and GSE47994 cohorts.
2.7 The prediction of chemotherapy and immunotherapy responses
Using the Genomics of Drug Sensitivity in Cancer [GDSC (https://www.cancerrxgene.org/)] database (41), half-maximal inhibitory concentration (IC50) values of common drugs (bleomycin, lapatinib, paclitaxel, camptothecin, cisplatin, docetaxel, methotrexate, and sunitinib) in each LBC sample were estimated based on the transcriptome data by ridge regression with ten-fold cross-validation in pRRophetic R package (version 0.5) (42). The TIDE (http://tide.dfci.harvard.edu/) online algorithm was then adopted for immune checkpoint blockade therapy response predictions (34). The chi-squared test was used to examine differences in response rates between high- and low-CAF-risk groups. The predictive efficacy of the CAF risk signature was evaluated by ROC curves and area under the curve (AUC) values.
2.8 Analysis of enrichment
To explore the enriched hallmark and KEGG pathway gene sets between high- and low-CAF-risk groups in GSE47994, gene set enrichment analysis (GSEA) was performed using the enrichplot and clusterProfiler R packages. The gene sets used were derived from the Molecular Signatures Database (MSigDB), specifically the “c2.cp.kegg.v7.4.symbols” and “h.all.v7.4.symbols” gene sets (43). Additionally, the enrichment scores of ECM receptor interaction, regulation of actin cytoskeleton, and TGF-β signaling pathway hallmark gene sets were calculated using ssGSEA (44). Finally, Spearman’s correlation analysis was performed to assess the correlation between the CAF risk score and gene set enrichment scores.
2.9 The verification of results using the cancer cell line encyclopedia and human protein atlas databases
To validate the findings at the cellular level, mRNA expressions of the identified markers in 38 fibroblasts and 51 BC cell lines were downloaded from the Cancer Cell Line Encyclopedia [CCLE (https://portals.broadinstitute.org/ccle)] database (45). Expression patterns of these markers in fibroblasts and CRC cell lines were examined using heat maps and Wilcoxon tests. Additionally, immunohistochemical (IHC) staining images of these markers in LBC tissues were downloaded from the Human Protein Atlas [HPA (https://www.proteinatlas.org/)] online database (46).
2.10 Statistical analysis of the data
R software (version 4.2.2; https://www.r-project.org/) was used for all statistical analyses. The median CAF risk score was used as the cutoff value for each cohort to divide LBC patients into high- and low-CAF-risk subgroups. Pairwise comparisons were performed using the Wilcoxon test. Pearson correlation coefficient analysis was performed to evaluate the correlation between genes. Overall survival comparisons were made using the Kaplan-Meier curve with the log-rank test, which were adopted via the survival and survminer R packages. p < 0.05 was considered statistically significant.
3 Results
3.1 The prognostic value of CAF infiltrations and stromal scores in LBC patients
The flowchart of this research is displayed in Figure 1. CAF infiltrations were predicted by multiple methods, including EPIC, xCell, MCP-counter, and TIDE. The stromal score was calculated by the estimate algorithm. Their prognostic values on overall survival (OS) were evaluated via log-rank tests. Kaplan-Meier curves indicated that multiple higher CAF infiltrations and stromal scores were significantly associated with poorer OS in LBC patients. CAF_EPIC, CAF_TIDE, and stromal scores were significantly associated with poorer OS in TCGA-BRCA (Figures 2A–C), and CAF_EPIC, CAF_mcp-counter, and stromal scores were significantly associated with poorer OS in GSE47994 (Figures 2D–F), which highlights the importance of further studies exploring CAF and stromal-associated genes in LBC. In this study, the EPIC-estimated CAF abundances and stromal scores were summarized as phenotype data for subsequent analysis, and the data from the other three estimated CAF infiltrations were used for external validation of the identified CAF model.

Figure 1 Work flow of this study.
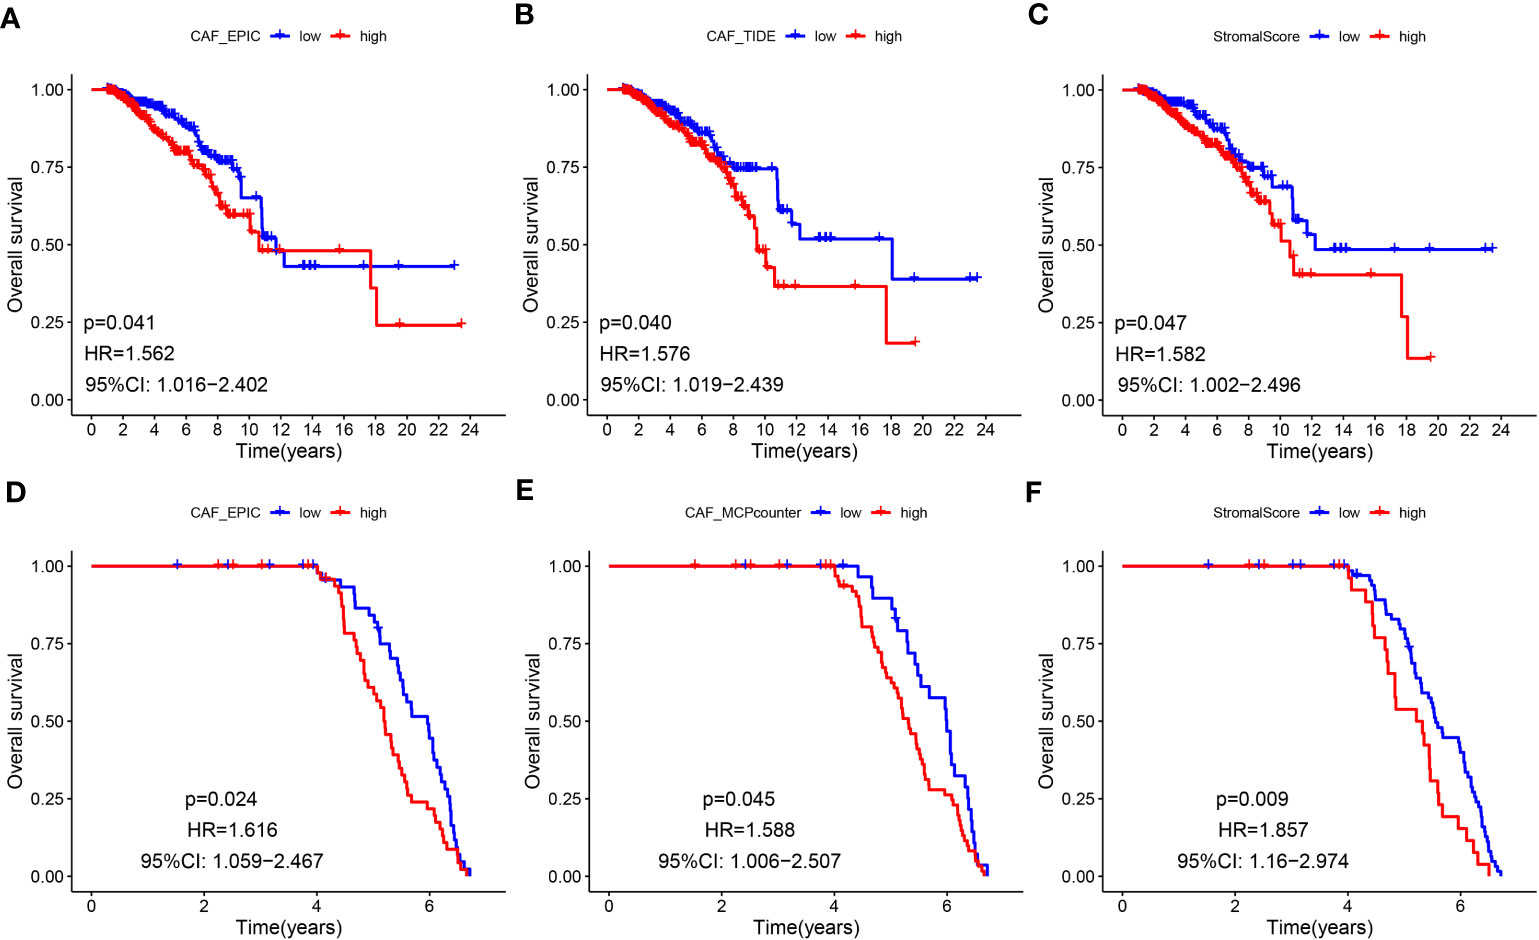
Figure 2 (A-F) Kaplan–Meier analyses of LBC patients. Multiple higher CAF infiltrations and stromal scores were significantly associated with worse overall survival in TCGA-BRCA (A–C) and GSE47994 (D–F).
3.2 Co-expression network analysis of CAF and stromal scores in two LBC datasets
WGCNA analysis was conducted on both TCGA-BRCA and GSE47994 datasets. To build a scale-free topology network, we estimated the soft threshold power (β) of 7 in TCGA-BRCA (scale-free R2 = 0.86) (Figure 3A) and 17 in GSE47994 (scale-free R2 = 0.86) (Figure 3B). In TCGA-BRCA, the hierarchical clustering tree identified 8 co-expression models (Figure 3C), and the magenta module exhibited the strongest positive correlation with the CAF proportion (Cor = 0.54, P = 7e-54) and stromal score (Cor = 0.78, P = 5e-144) (Figure 3E). In GSE47994, the dynamic hybrid cutting clustered 6 co-expression models (Figure 3D), with the brown module showing the strongest positive correlation with the CAF proportion (Cor = 0.88, P = 5e-25) and stromal score (Cor = 0.92, P = 2e-31) (Figure 3F). Therefore, we focused on these two modules for further investigations. A total of 1718 and 158 genes were included in the magenta and brown modules, respectively. In the magenta module, scatter plots indicated strong correlations between MM and GS for CAF (Cor = 0.64, p =1.3e-198) and stromal scores (Cor = 0.88, p < 1e-200) (Figure 3G). Similarly, in the brown module, strong correlations were observed between MM and GS for CAF (Cor = 0.64, P = 1.1e-19) and stromal scores (Cor = 0.82, p = 7e-40) (Figure 3H). Consequently, we selected 1718 genes from the TCGA-BRCA magenta module and 158 genes from the GSE47994 brown module as highly associated with CAF and stromal scores.
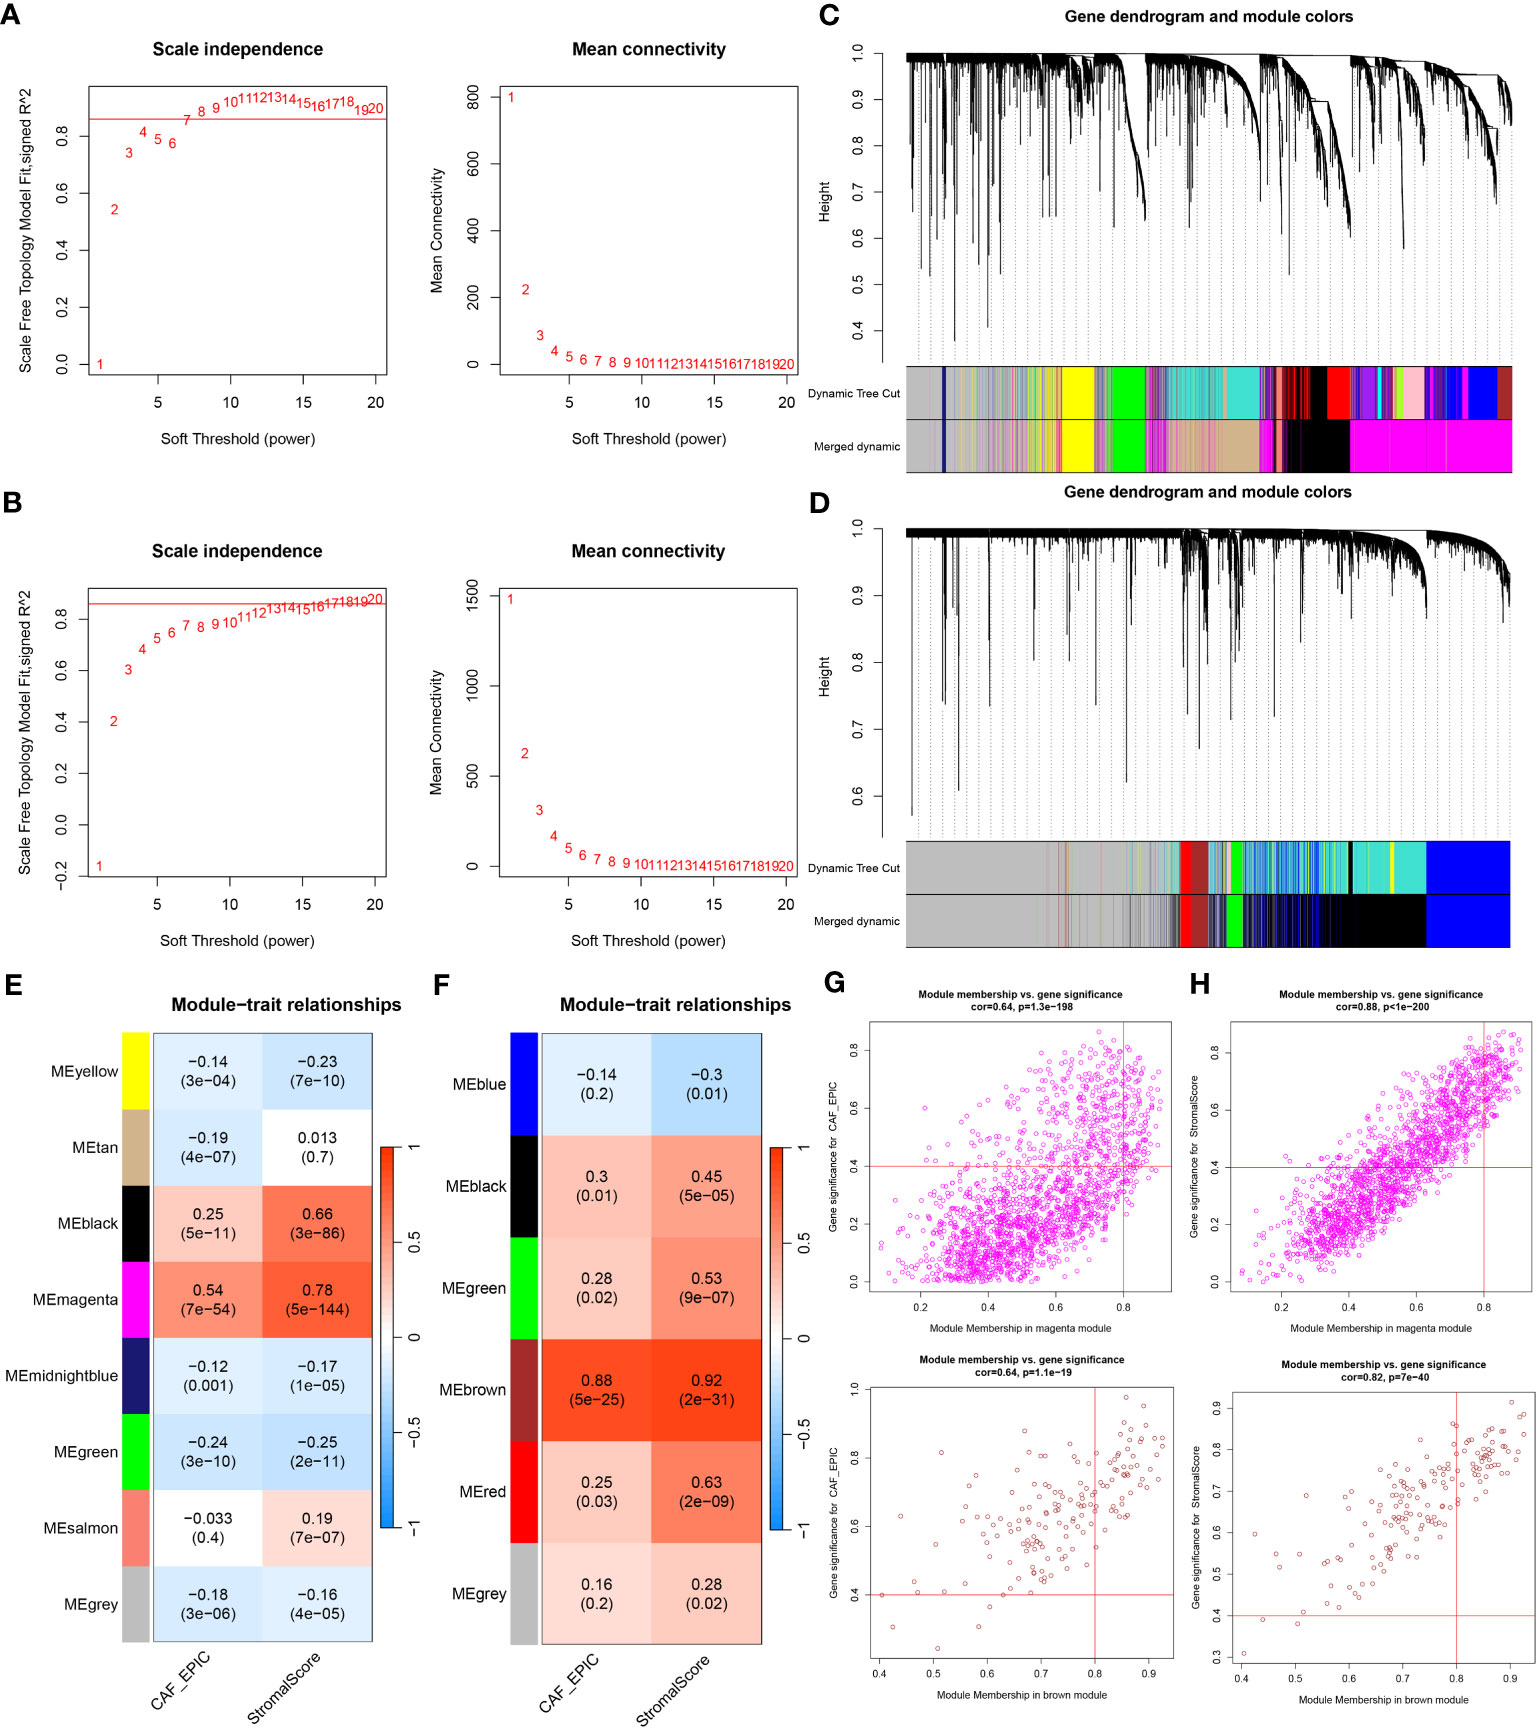
Figure 3 (A, B) Co-expression network constructed by WGCNA. The soft-thresholding power (β) of 7 and 17 was, respectively, selected based on the scale-free topology criterion in TCGA-BRCA (A) and GSE47994 (B). (C, D). Clustering dendrograms showing genes with similar expression patterns were clustered into co-expression modules in TCGA-BRCA (C) and GSE47994 (D). The gray module indicates that genes were not assigned to any module. (E, F) Module-trait relationships revealing the correlations between each gene module eigengene and phenotype in TCGA-BRCA (E) and GSE47994 (F). (G, H) Scatter plots of the module membership (MM) and gene significance (GS) of each gene in the magenta module of TCGA-BRCA (G) and the brown module of GSE47994 (H). The horizontal axis is the correlation between the gene and co-expression module, and the vertical axis is the correlation between the gene and phenotype.
3.3 Functional analyses of CAF-related genes
The above CAF-related genes were overlapped and screened to 135 hub genes (Figure 4A). These genes were subjected to Gene Ontology (GO) and Kyoto Encyclopedia of Genes and Genomes (KEGG) analyses. The major enriched GO terms were related to extracellular matrix organization, extracellular structure organization, external encapsulating structure organization (BP), collagen-containing extracellular matrix and endoplasmic reticulum lumen (CC), and extracellular matrix structural constituents and collagen binding (MF) (Figure 4B). The main enriched KEGG pathways were human papillomavirus infection, the PI3K-Akt signaling pathway, and protein digestion and absorption (Figure 4C).
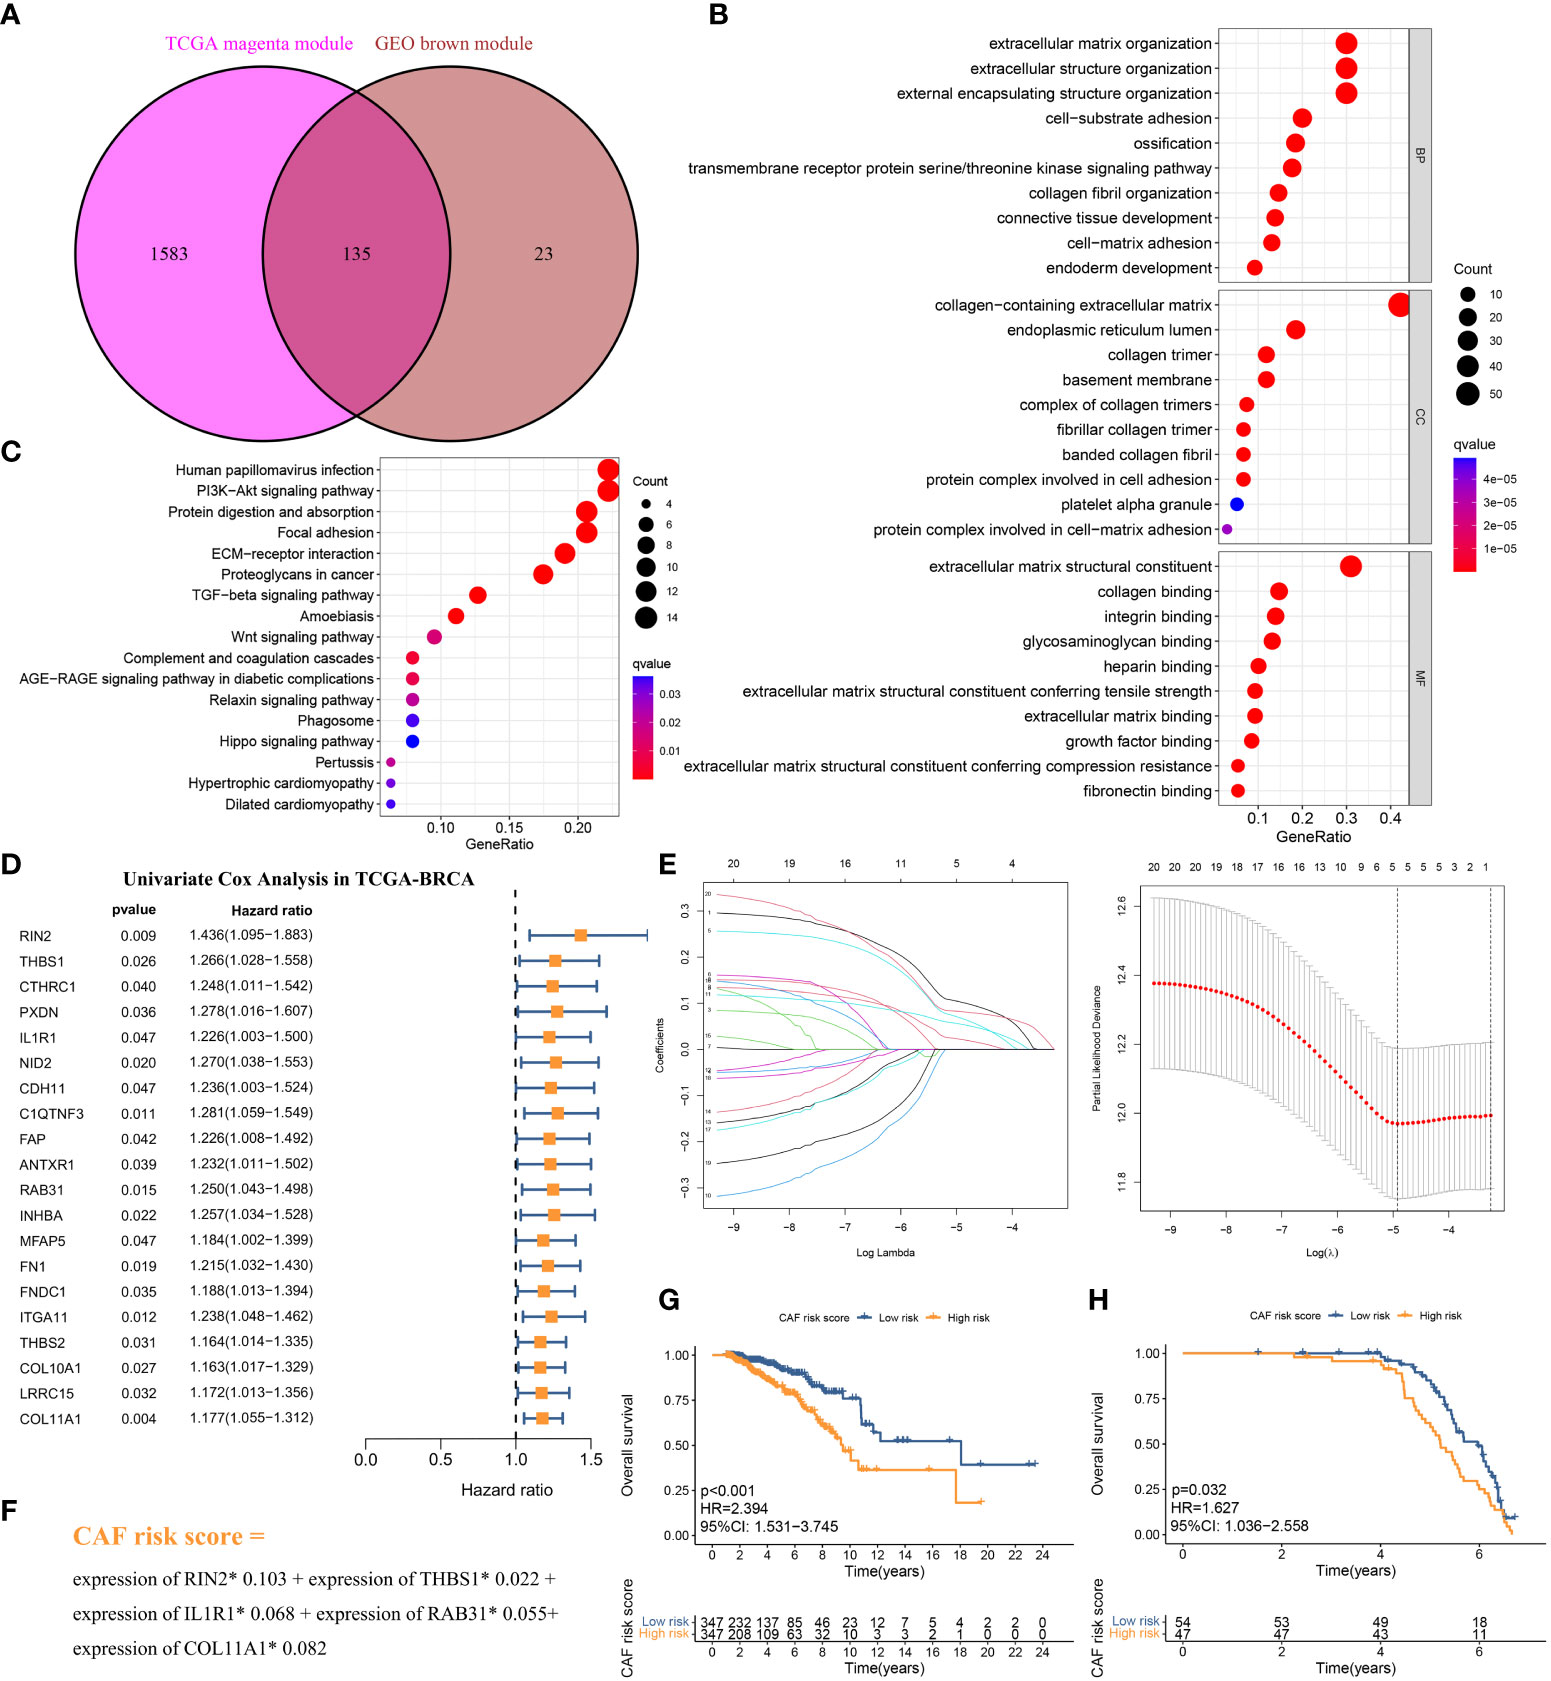
Figure 4 (A) The intersection of TCGA-BRCA magenta and GSE47994 brown module genes was presented in the Venn diagram. (B, C) GO analyses of the enriched biological process (BP), cellular component (CC), and molecular function (MF) terms (B) and KEGG pathway analysis (C) of the 135 genes. (D) Univariate Cox analysis for the screening of overall survival-associated genes in TCGA-BRCA. (E) Coefficient profiles of least absolute shrinkage and selection operator (LASSO) Cox regression analysis, and the adjustment parameter (lambda) was calculated based on the partial likelihood deviance with ten-fold cross validation. (F) Formulation of the CAF risk model. (G, H) Kaplan–Meier analyses identified gastric cancer patients in the high–CAF-risk group which exhibited worse overall survival in both TCGA-BRCA (G) and GSE47994 (H) cohorts.
3.4 Construction a risk model based on stromal CAF
The 694 LBC samples from TCGA- BRCA were used as the training cohort owing to the larger sample size, and 101 GSE47994 samples were used as the validation group. By performing univariate Cox regression analysis of the 135 common hub genes, 20 OS-related genes with p < 0.05 were screened out and subjected to the following LASSO Cox regression analysis (Figures 4D, E). Five genes were finally identified for the CAF risk model construction: CAF risk score = expression of RIN2* 0.103 + expression of THBS1* 0.022 + expression of IL1R1* 0.068 + expression of RAB31* 0.055 + expression of COL11A1* 0.082 (Figure 4F). The median CAF risk score of the training cohort was 1.85, which was used as the cut-off value to classify LBC patients from each cohort into high- and low-CAF-risk groups. LBC patients in each cohort were divided into high– and low–CAF-risk groups with the median risk score as the cutoff value. Kaplan–Meier curves revealed that LBC patients in the high–CAF-risk group experienced worse OS than those in the low–CAF-risk group in both TCGA- BRCA (HR = 2.394, 95%CI: 1.531–3.745, log-rank p < 0.001) (Figure 4G) and GSE47994 (HR = 1.627, 95%CI: 1. 036−2.558, log-rank p = 0.032) (Figure 4H). These results indicated CAF and stromal-related signature genes were crucial prognostic markers in LBC.
3.5 Validation of the CAF risk score and the five-gene signature as indicators of CAF infiltrations
To evaluate the robustness of the CAF model as an indicator of CAF infiltrations, Spearman’s correlation analyses were performed between the CAF risk score and stromal score as well as CAF abundances predicted by EPIC and three other methods: xCell, MCP-counter, and TIDE. The CAF risk score was strongly and positively correlated with multi-estimated CAF infiltrations and the stromal score in both TCGA-BRCA (Figure 5A) and GSE47994 (Figure 5B) cohorts. These results confirmed that the CAF risk score was a reliable predictor of CAF infiltrations. To further validate the correlation of the expression levels of the five genes with CAFs, their expression levels were compared with a set of collected CAF markers in both TCGA-BRCA (Figures 5C, E) and GSE47994 (Figures 5D, F) cohorts. A high and positive correlation was observed between the expression levels of the five genes and most of the CAF markers in both cohorts. These results demonstrated that the five genes were representative of CAFs.
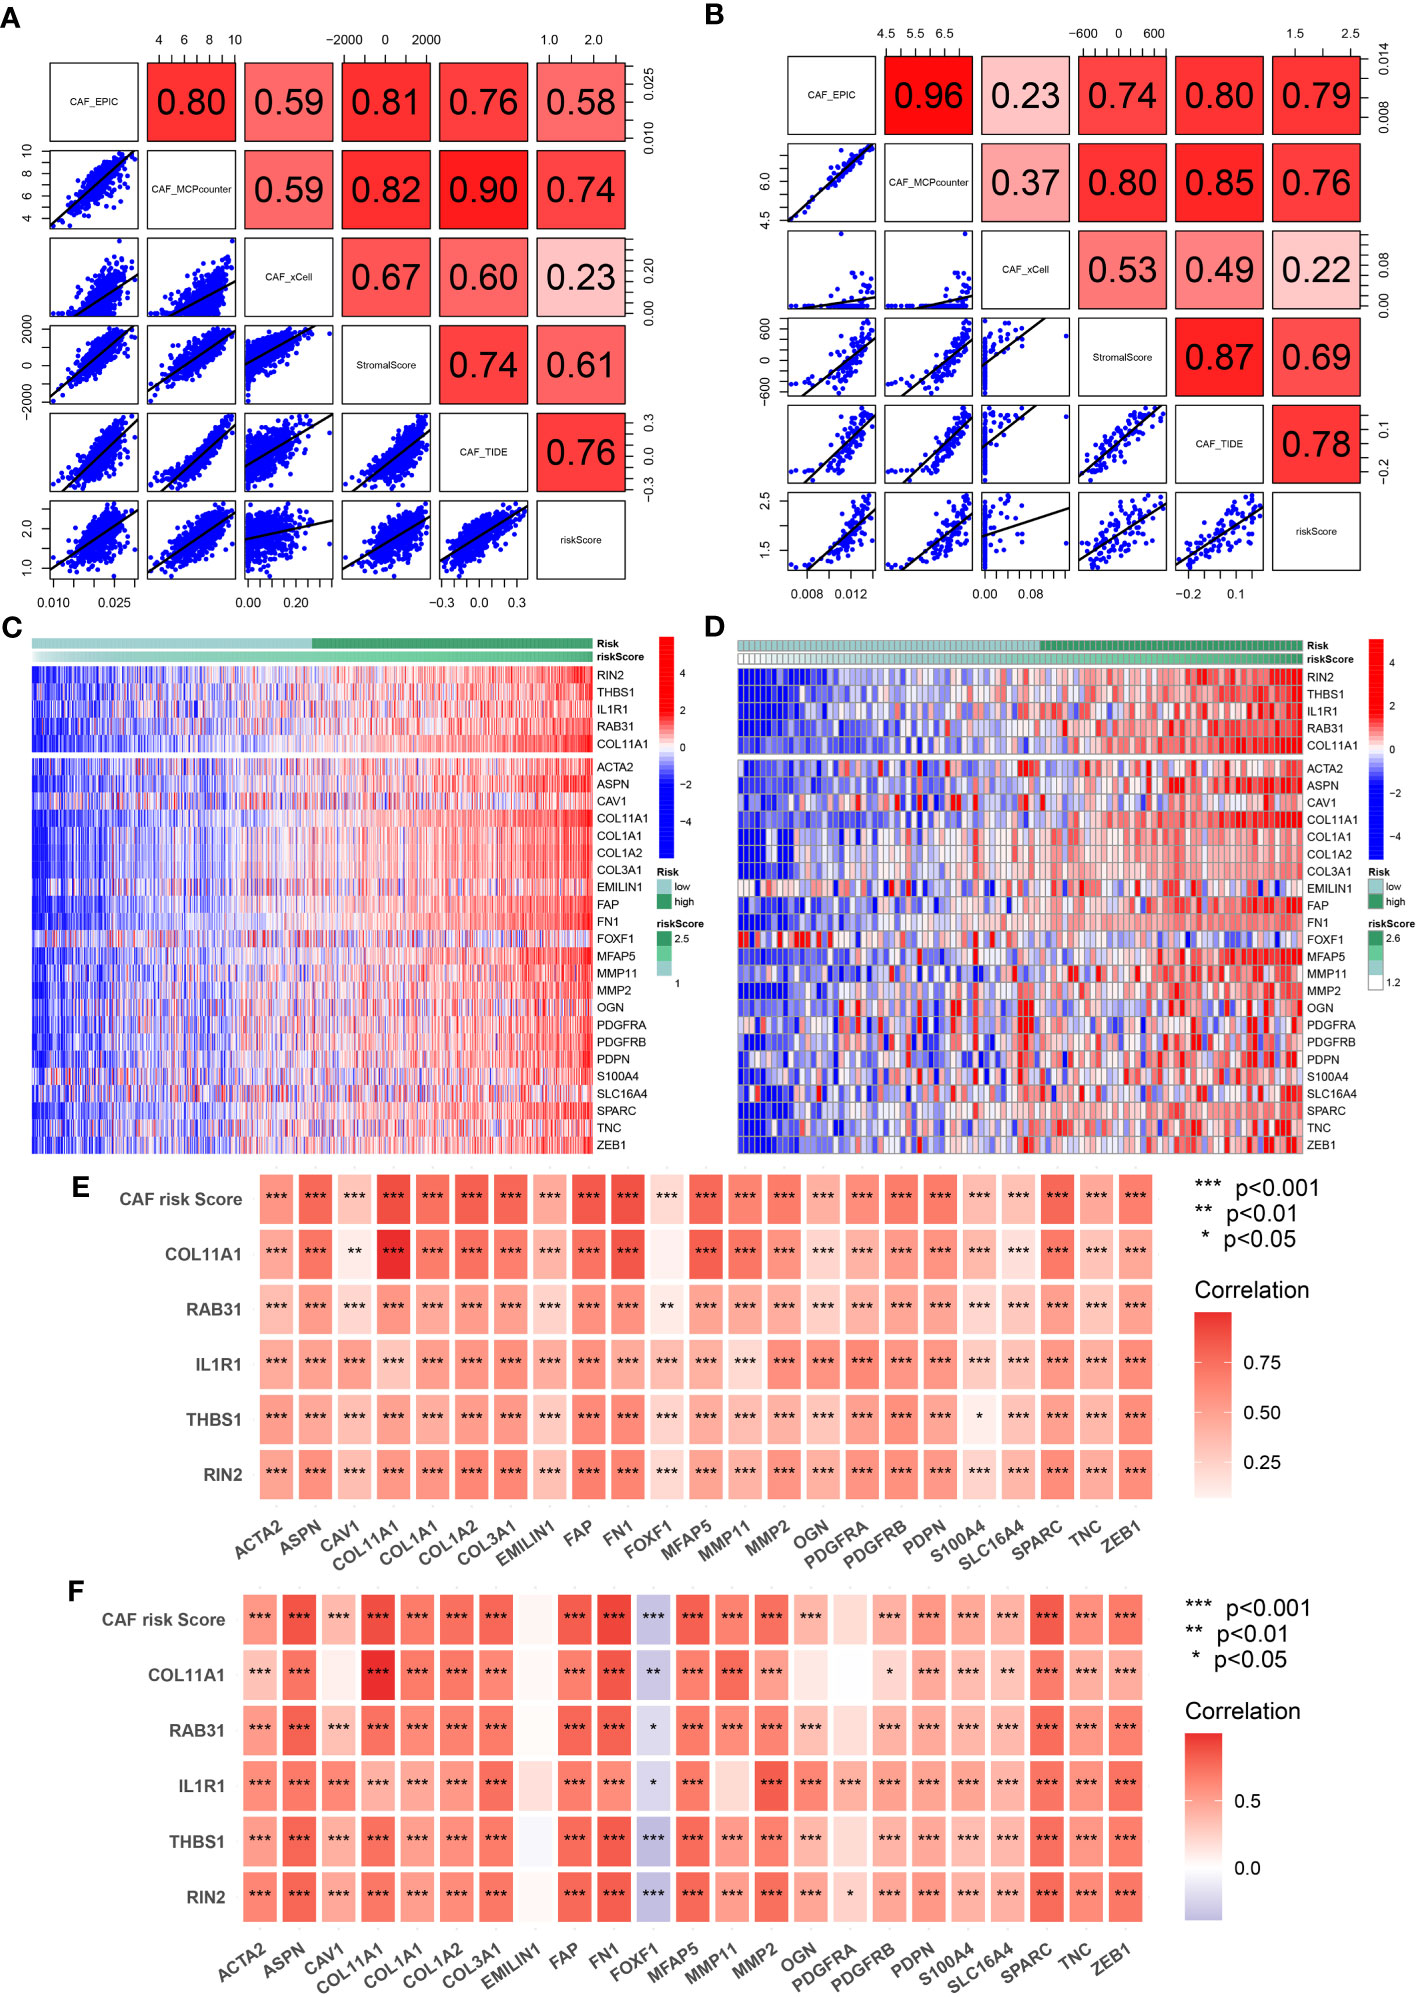
Figure 5 (A, B) Spearman’s correlation analyses revealing the CAF risk score was strongly and positively correlated with stromal scores and multi-estimated CAF infiltrations in TCGA-BRCA (A) and GSE47994 (B) cohorts. (C, D) The heat map revealing the expression patterns of CAF markers identified five CAF genes with the CAF risk score in TCGA-BRCA (C) and GSE47994 (D) cohorts. (E, F) The CAF risk score and five signature genes were positively correlated with literature that reported CAF markers in TCGA-BRCA (E) and GSE47994 (F) cohorts.
3.6 Chemotherapy and immunotherapy responses across CAF-risk groups
The standard treatment for LBC patients involves radical surgery followed by adjuvant chemotherapy and endocrine therapy (47). IC50 values for multiple anti-tumor drugs, including those used in breast cancer treatment, were estimated using the GDSC database for both the TCGA-BRCA (Figure 6A) and GSE47994 (Figure 6B) cohorts. Wilcoxon analyses indicated significant differences in IC50 values between high- and low-CAF-risk LBC patients. As for commonly used chemotherapy drugs for breast cancer, although not both datasets showed statistical significance, the results indicated that high-CAF-risk patients were sensitive to Alpelisib and Epirubicin, while low-CAF-risk patients were sensitive to Docetaxel, Fulvestrant, Lapatinib, Palbociclib, Ribociclib and Tamoxifen. However, Cyclophosphamide and Zoledronic acid exhibited different trends between the two datasets. In addition, the results from both datasets showed that high-CAF-risk patients were insensitive to several other drugs, including Axitinib, Dabrafenib, Irinotecan, Sorafenib, Topotecan, and Venetoclax. This suggests that higher CAF risk scores are more likely to induce resistance to these drugs in breast cancer patients. Immunotherapy is among the most important advances in recent oncology, particularly for triple-negative and HER-2-positive breast cancer (48). Trials are also underway to assess the efficacy of immune checkpoint inhibitors such as pembrolizumab for Luminal breast cancer (49–51). To evaluate the CAF risk score as an immunotherapy predictor for LBC patients, the TIDE method was used. In TCGA-BRCA, the non-responder subgroup (n = 492) exhibited significantly higher CAF scores than the responder subgroup (n = 202) (p < 2.2e-16; Figure 6C). Low-CAF-risk patients (144/347) displayed higher immunotherapy sensitivity and lower TIDE scores than high-CAF-risk patients (58/347) (p < 0.001; Figures 6D, E). In GSE47994, the non-responder subgroup (n = 63) also had a significantly higher CAF score than the responder subgroup (n = 38) (p = 1.9e-7; Figure 6G). Low-CAF-risk patients (31/54) exhibited higher immunotherapy sensitivity and lower TIDE scores than high-CAF-risk patients (7/47) (p < 0.001; Figures 6H, I). The AUC values of 0.711 in TCGA-BRCA (Figure 6F) and 0.811 in GSE47994 (Figure 6J) indicate the excellent performance of the CAF model for predicting immunotherapy response.
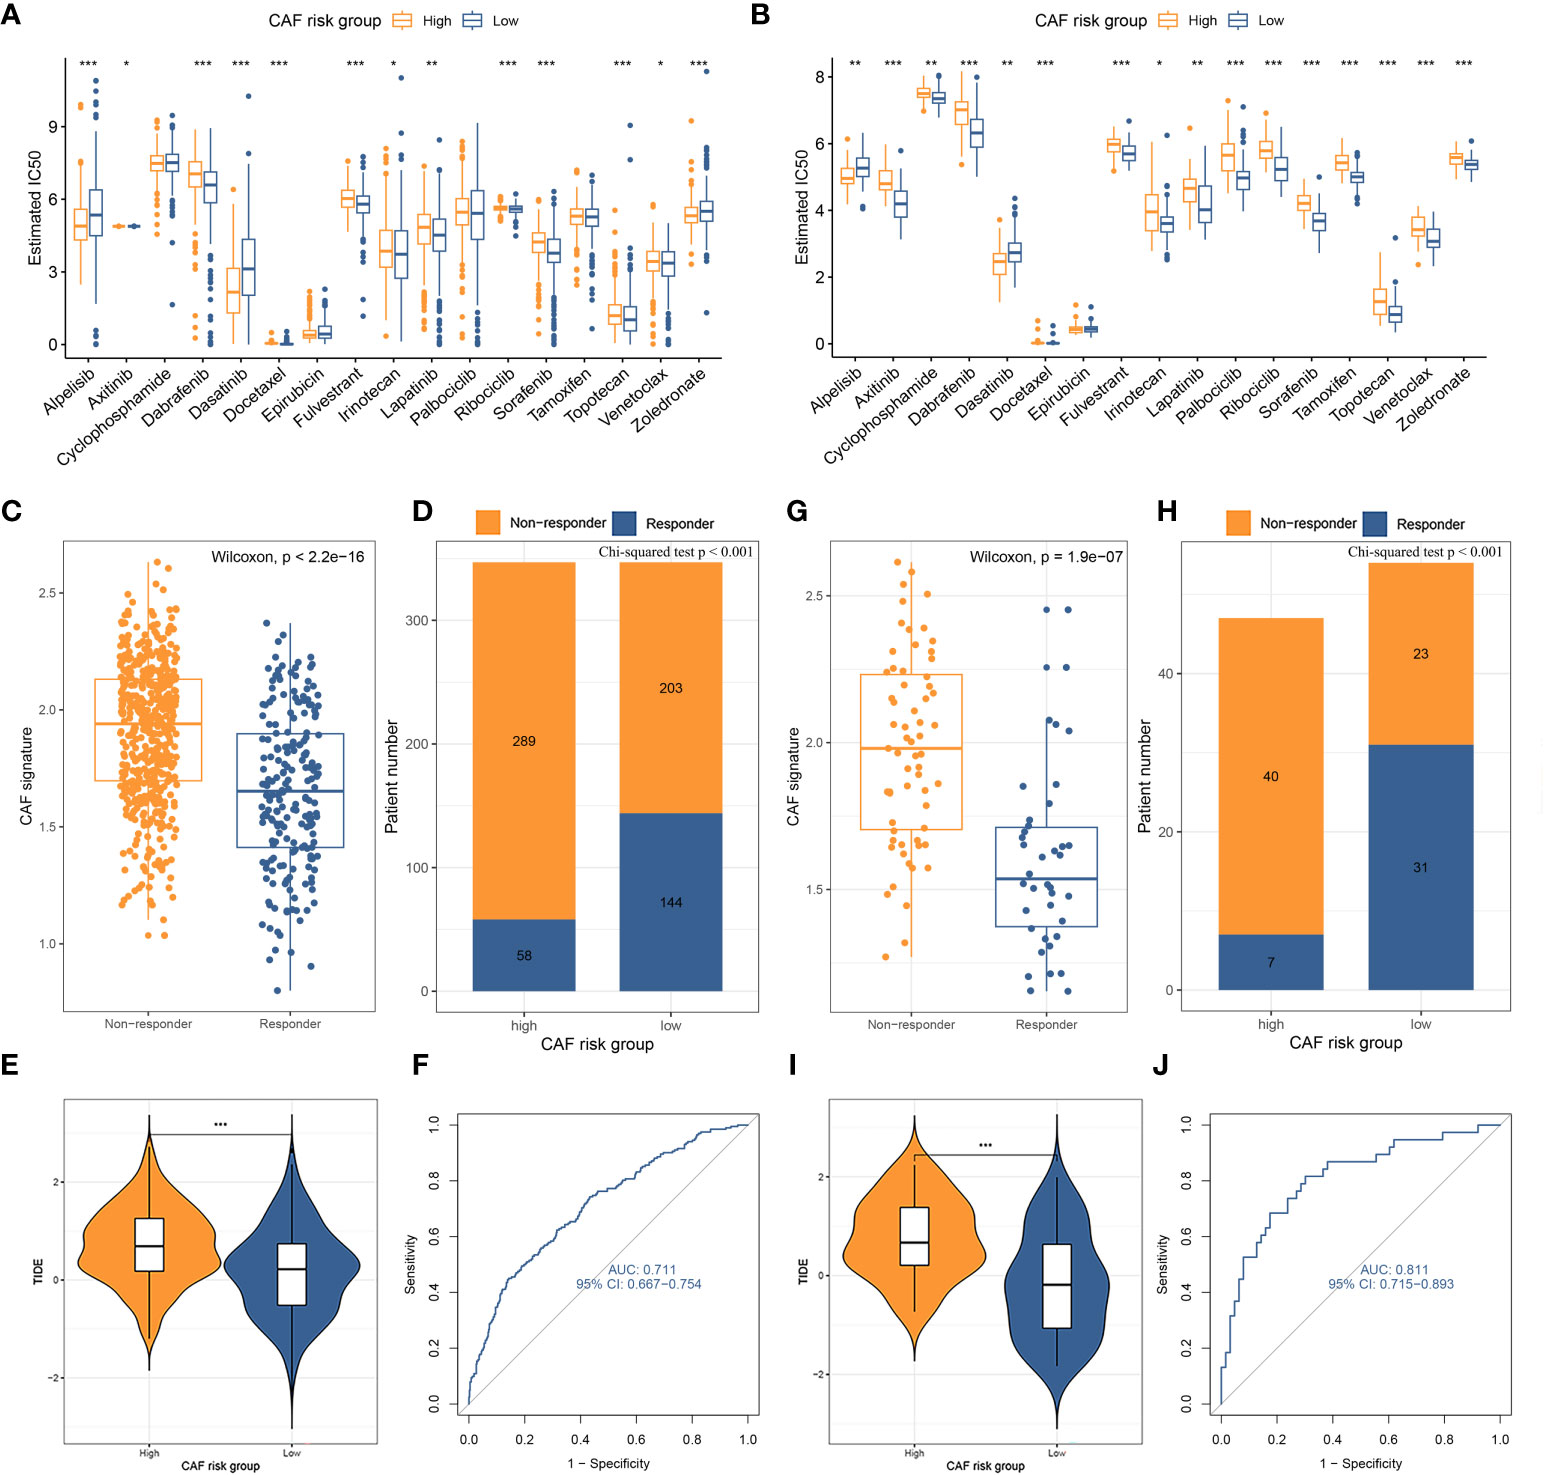
Figure 6 (A, B) Box plots comparing IC50 values of several chemotherapy drugs between high– and low–CAF-risk groups in TCGA-BRCA (A) and GSE47994 (B) cohorts. (C–J) TIDE immunotherapy prediction analyses. (C, G) The CAF risk score between TIDE-predicted immunotherapy-responders and non-responders in TCGA-BRCA (C) and GSE47994 (G); (D, H) Distributions of responders and non-responders in high– and low– CAF-risk groups in TCGA-BRCA (D) and GSE47994 (H); (E, I) Distributions of TIDE scores in high– and low– CAF-risk groups in TCGA-BRCA (E) and GSE47994 (I); (F, J) ROC curves of the CAF risk score in predicting immunotherapy responses in TCGA-BRCA (F) and GSE47994 (J). ∗p < 0.05, ∗∗p < 0.01, ∗∗∗p < 0.001.
3.7 GSEA of the five-gene CAF signature
To investigate the functional enrichment of the CAF signature, GSEA was conducted on the TCGA-BRCA dataset to compare the high- and low-CAF-risk groups. The analysis revealed significant enrichment in KEGG signaling pathways associated with ECM receptor interaction, focal adhesion, pathways in cancer, regulation of actin cytoskeleton, and tight junction in the high-CAF-risk group (Figure 7A). Moreover, the genes in the high-CAF-risk group were significantly enriched in Hallmarker gene sets related to angiogenesis, apical junction, coagulation, epithelial-mesenchymal transition (EMT), and inflammatory response (Figure 7B). Additionally, ssGSEA results indicated that the CAF risk score was positively correlated with enrichment scores for ECM receptor interaction, regulation of actin cytoskeleton, and TGF-β signaling pathway in both TCGA-BRCA (Figure 7C) and GSE47994 (Figure 7D).
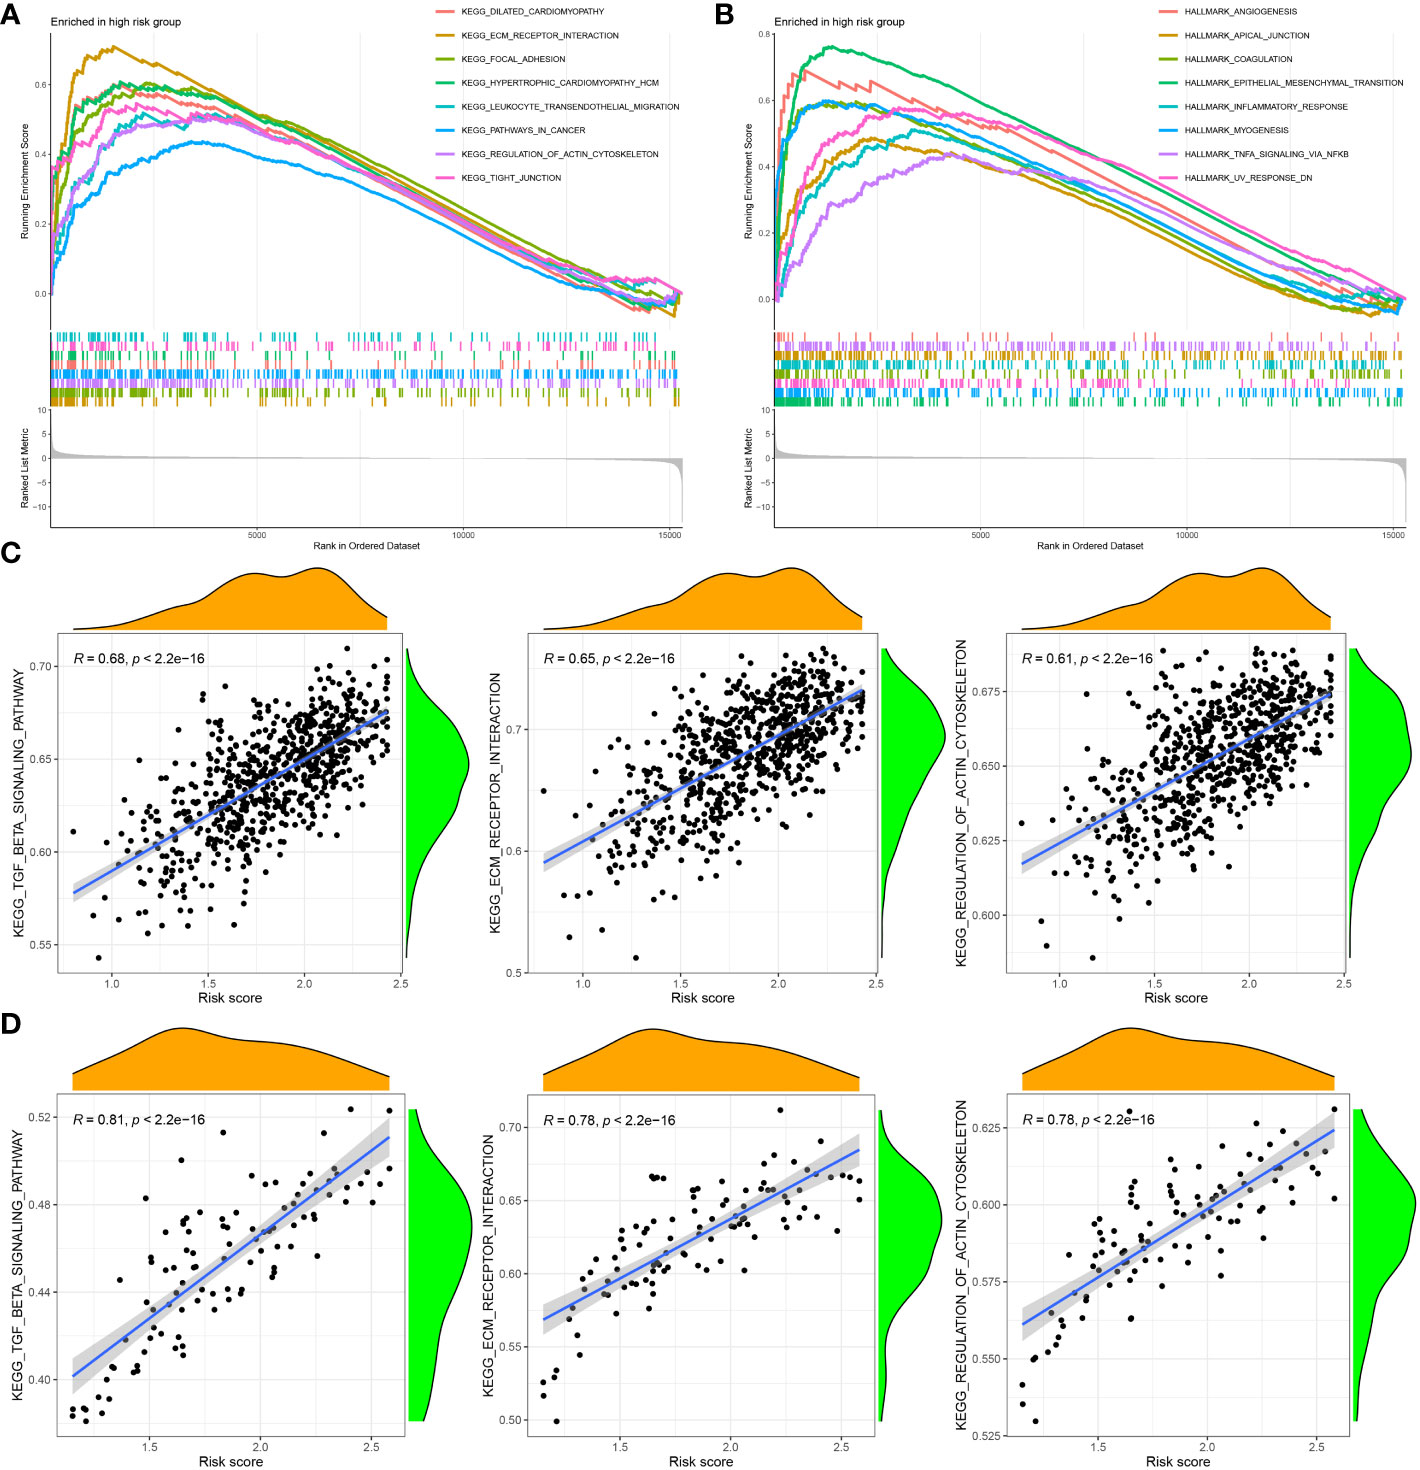
Figure 7 Gene set enrichment analysis (GSEA) of KEGG (A) and hallmark (B) gene sets between high‐and low‐CAF risk groups. (C, D) ssGSEA results showed CAF risk score was positively correlated with ECM receptor interaction, regulation of actin cytoskeleton, and TGF-β signaling pathway enrichment scores in both TCGA-BRCA (C) and GSE47994 (D).
3.8 Cross-dataset validation of important genes in CCLE and HPA
Based on the CCLE database, the mRNA expressions of the five hub genes (RIN2, THBS1, IL1R1, RAB31, COL11A1) were verified to be higher in fibroblast cell lines than those in BC cell lines (Wilcoxon test, all p < 0.001; Figures 8A, B). Additionally, to determine the protein expression characteristics of these CAF signature genes, the IHC images from the HPA database were analyzed. The data demonstrated that these proteins (RIN2, THBS1, IL1R1 and RAB31) were deeply stained in BC stroma (Figure 8C). These verifications suggest that these genes might be CAF-specific markers.
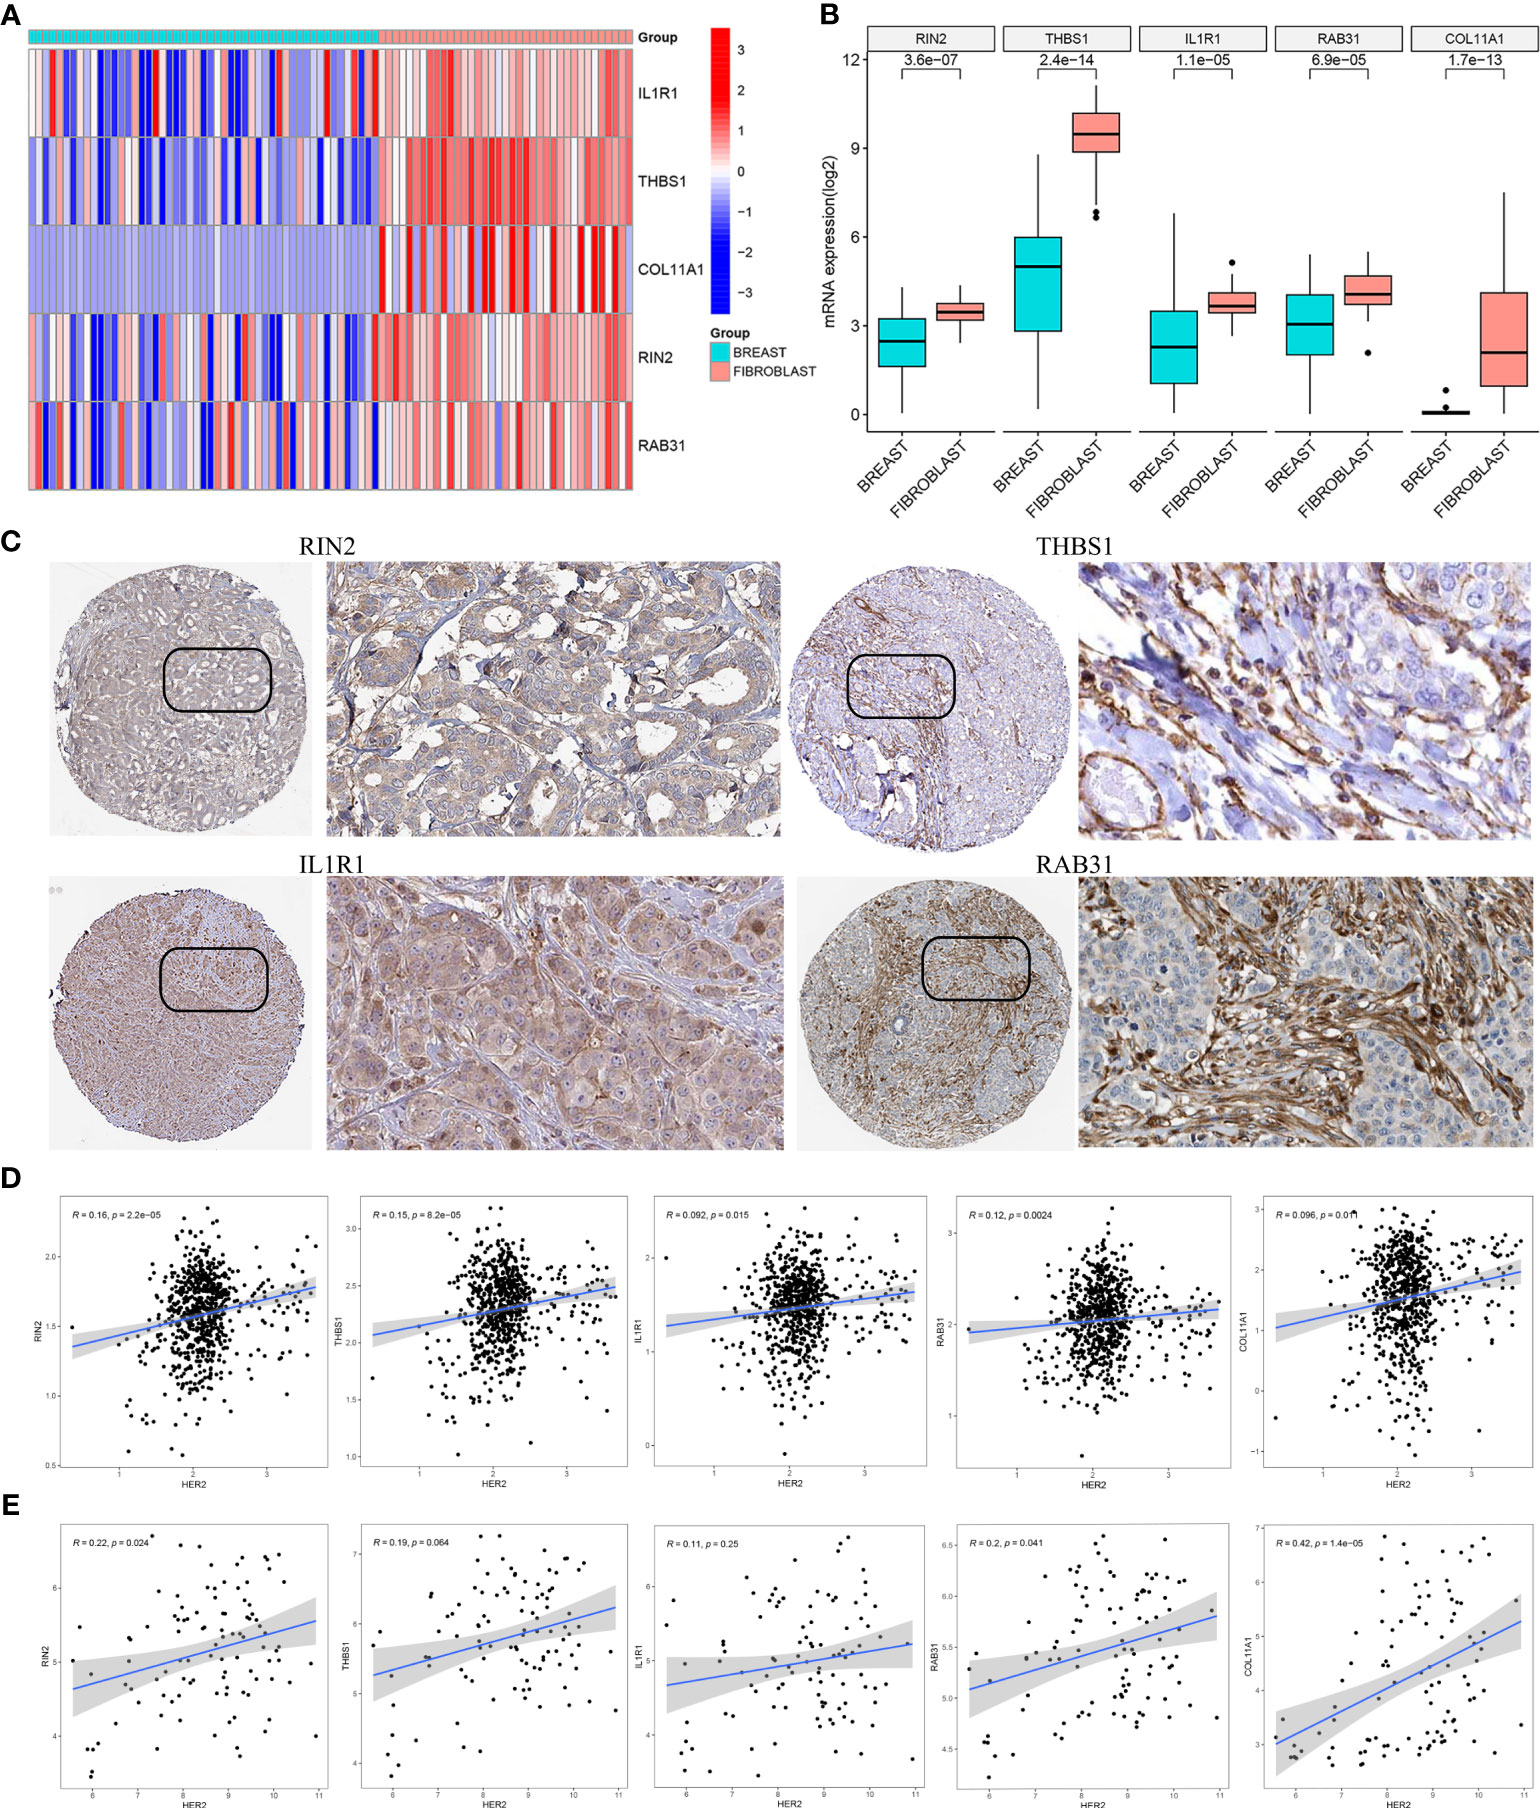
Figure 8 (A, B) The mRNA expression levels of the five CAF genes in the fibroblasts and breast cancer cell lines were illustrated in the heat map (A) and compared by Wilcoxon analysis (B). (C) Protein expressions of RIN2, THBS1, IL1R1 and RAB31 in breast cancer specimens from the Human Protein Atlas database. Correlation between five hub genes and HER2 in TCGA-BRCA (D) and GSE47994 (E).
3.9 Correlation between hub genes and HER2 in LBC
It is well known that the HER2 gene plays an important role in breast cancer, and overexpression or amplification of HER2 can lead to excess HER2 protein on the surface of breast cancer cells, leading to uncontrolled cell growth, tumor development and progression. To evaluate the correlation between the expression of the five hub genes (RIN2, THBS1, IL1R1, RAB31, COL11A1) and HER2 gene expression, we analyzed the gene expression data from TCGA-BRCA (Figure 8D) and GSE47994 (Figure 8E). Pearson correlation coefficient analysis revealed a significant positive correlation between the expression levels of these genes and HER2 gene expression (p < 0.05), with the exception of THBS1 and IL1R1 in GSE47994.
4 Discussion
Breast cancer is a complex and heterogeneous disease, consisting of multiple subtypes with distinct molecular and clinical characteristics (52). LBC is one of the most common subtypes, and some patients develop drug resistance and distant metastasis, and the prognosis of these patients is poor (4). While the molecular mechanisms underlying LBC development and progression have been extensively studied, the role of CAF in this subtype remains unclear. CAFs are a key component of the tumor microenvironment and have been shown to play a critical role in promoting tumor growth and progression, including in LBC (14, 19). Consistently, we observed that higher CAF and stromal scores were associated with worse OS after initial treatment in LBC. Therefore, identifying CAF-related factors and developing a CAF-related classifier for predicting prognosis and therapeutic effects in LBC is of great significance. This is the first study utilizing WGCNA and multiple computational algorithms to uncover mutual co-expression networks between CAF and stromal components in two LBC cohorts: TCGA-BRCA and GSE47994. Through the application of univariate Cox and LASSO regression algorithms, a five-gene prognostic model for CAF (comprising RIN2, THBS1, IL1R1, RAB31, and COL11A1) was developed and subsequently validated. We found that LBC patients with a low CAF risk (using the median CAF risk score of 1.85 in the training set as a threshold) may benefit from a variety of antineoplastic agents, such as Axitinib, Docetaxel, Fulvestrant, Lapatinib, Palbociclib, Ribociclib, Tamoxifen, and others, indicating that high CAF infiltration may contribute to these drugs resistance. On the other hand, LBC patients with a high CAF risk may be more responsive to treatments such as Alpelisib, Epirubicin, and dasatinib. We also utilized the TIDE online algorithm and observed a strong correlation between lower CAF risk scores and improved immunotherapeutic response in LBC patients. However, Further experiments are required to elucidate the interplay between CAFs and Immunotherapy. It’s worth noting that the TIDE algorithm primarily predicts the responses to anti-PD1 and anti-CTLA4 treatments in tumor patients, thus making pembrolizumab a more suitable candidate for follow-up studies.
To ensure the robustness of our model and avoid over-fitting, we employed four bioinformatics methods to quantify CAF infiltrations in LBC. We used the EPIC method for model construction and xCell, MCP-counter, and TIDE methods for correlation verification. Our results demonstrated a strong correlation between our model and CAF infiltrations, as well as CAF markers. Furthermore, based on analysis of the CCLE and HPA databases, we identified five genes as CAF-specific markers for LBC, with significantly higher expression observed in fibroblast cell lines and stromal parts of LBC. These findings further support the accuracy of our model in assessing CAF infiltration levels in LBC.
To investigate biological pathways associated with CAF risk in LBC, we performed GSEA analysis on TCGA-BRCA and GSE47994 dataset. GSEA revealed that ECM receptor interaction, focal adhesion, pathways in cancer, regulation of actin cytoskeleton and tight junction were highly and significantly enriched in the high–CAF-risk group; ssGSEA results also showed that the CAF risk score was positively correlated with ECM receptor interaction, regulation of actin cytoskeleton, and TGF-β signaling pathway enrichment scores in both two cohorts. CAFs play a crucial role in cancer progression by altering the extracellular matrix (ECM) composition and promoting cancer cell invasion and metastasis through the interaction of ECM proteins with specific receptors on the surface of cells (53–55). Furthermore, CAFs secrete fibronectin, which activates integrin receptors on cancer cells, triggering signaling pathways that enhance cancer cell proliferation, survival, and migration (56, 57). In addition, CAFs regulate the actin cytoskeleton of cancer cells, facilitating their ability to invade and migrate, by secreting growth factors such as TGF-β that promote the formation of stress fibers essential for cell migration and invasion (58, 59).
With respect to the five identified markers in the model, RIN2 is a gene that encodes a protein that interacts with Ras and Rab proteins, which are involved in cell signaling and membrane trafficking (60, 61). Biallelic defects in RIN2 are associated with MACS syndrome, a condition characterized by macrocephaly, alopecia, cutis laxa, and scoliosis, as well as with RIN2 syndrome, a related connective tissue disorder presenting similar symptoms (60, 62). Chiara Sandri et al. identified the Ras and Rab5 interacting protein RIN2 as a key effector in endothelial cells that interacts with R-Ras and mediates the pro-adhesion and tumor angiogenic activities of R-Ras (63). Furthermore, RIN2 has been identified as a signature gene that can be used to evaluate the clinical prognosis of patients with colorectal cancer, enabling more personalized diagnosis and treatment of the disease (64). THBS1 is a gene that encodes thrombospondin 1, a protein that is involved in cell adhesion, angiogenesis and inflammation (65). Previous studies have shown that THBS1 is highly expressed in gastric cancer (66), breast cancer (67), melanoma (68) and oral squamous carcinoma (69), promoting tumor cell adhesion, proliferation, apoptosis, invasion and metastasis. THBS1 can modulate the invasion and migration of BC cells by affecting the TME, especially the CAFs (70). We observed that high-CAF-risk group LBC patients were less sensitive to several drugs, including docetaxel, which is consistent with the finding that up-regulation of THBS1 following neoadjuvant chemotherapy containing docetaxel was associated with docetaxel chemotherapy resistance in breast cancer patients (71). Additionally, THBS1 can protect MCF-7 cells from docetaxel-induced apoptosis by activating the integrin β1/mTOR pathway (71). IL1R1 is expressed in various types of cancer cells and CAF, which are stromal cells that support tumor growth and survival (72–74). IL1R1 signaling can modulate various aspects of tumor biology, such as angiogenesis, invasion, metastasis, immunity and drug resistance (75). Rosamaria et al. found that the expression of IL1R1 is regulated by hypoxia-inducible factor 1α (HIF-1α) and G-protein estrogen receptor (GPER) in breast cancer cells and CAFs (72). Puran Zhang et al. found that high expression of IL1R1 in gastric cancer is indicative of poor prognosis and a poorer response to 5-fluorouracil-based adjuvant chemotherapy and immune checkpoint blockade (74). In addition, IL1R1 has been found to be upregulated in ALDH+ cells and plays a crucial role in driving cancer stem cell (CSC) activity, which can lead to resistance to adjuvant endocrine therapies, including tamoxifen and fulvestrant, in breast cancer and promote bone metastasis (76, 77). RAB31, a protein secreted by CAF, is associated with malignant behavior in breast (78), hepatocellular (79), gastric (80), and colorectal cancers (81). Studies have shown the expression levels of RAB31 may serve as a crucial regulator of the transition between invasiveness and proliferation of breast cancer cells (78, 82). Recent research has shown that RAB31 is capable of inhibiting the TGF-β pathway by decreasing TGFB1 mRNA and antigen levels, thereby exerting an impact on the migration, invasion, and apoptosis of breast cancer cells (82). Additionally, Rab31 mediates cisplatin resistance and metastasis in stomach adenocarcinoma via epithelial-mesenchymal transition pathway (83). COL11A1 is a gene that encodes for collagen type XI alpha 1, a protein that is part of the extracellular matrix (ECM) (84). Studies have shown that COL11A1 can activate CAFs by stimulating the TGF-β signaling pathway that regulates cell proliferation and differentiation (85, 86). COL11A1 can also promotes cancer cell migration, metastasis, and therapy resistance by activating multiple signaling pathways (84, 87). Notably, COL11A1 has been shown to induce chemoresistance to cisplatin and paclitaxel in ovarian cancer cells through the AKT and Twist1 pathways (88, 89). Moreover, it may promote tumor immune infiltration and lead to a poor prognosis in breast cancer patients (90). However, there is not much functional validation of the five genes involved in risk signatures in the CAFs of LBC, which requires us to conduct further experiments on the five CAF markers in the future to evaluate the invasion and metastasis, drug resistance and immunosuppression of LBC.
It is worth mentioning that, in the initial analysis, we conducted the same analysis in the TCGA-BRCA database for different subtypes of breast cancer and found no significant difference in survival when analyzing CAF infiltration and stromal score in triple-negative breast cancer and HER2-positive breast cancer. However, Pearson correlation coefficient analysis revealed a significant positive correlation between the expression levels of these genes and HER2 gene expression in LBC. Meanwhile, targeted immunotherapy targeting cancer-associated fibroblasts has been reported to overcome drug resistance in HER2+ breast cancer treatment (91). Therefore, more analytical methods and experiments are needed to investigate the potential relationship between HER2 gene and CAF signature genes.
In conclusion, our study identified a five-gene CAF signature for predicting prognosis and therapeutic responses in LBC. Our findings provide important insights into the role of CAFs in promoting tumor growth and progression and highlight the importance of developing combination therapies that target both CAFs and the immune system. Our study has important clinical implications for guiding tailored anti-CAF therapy in combination with immunotherapy for LBC patients. There are also some limitations to our study. First, our study is retrospective, and therefore, our findings should be validated in a prospective study. Second, we did not perform functional experiments to validate the role of the identified CAF markers in promoting tumor growth and progression in LBC. Future studies should investigate the molecular mechanisms underlying the identified CAF markers and develop targeted therapies that can inhibit CAFs and promote anti-tumor immune responses.
Data availability statement
The original contributions presented in the study are included in the article/supplementary material. Further inquiries can be directed to the corresponding author.
Author contributions
AX and X-NX contributed to the conception and design. AX and ZL extracted the data from the databases. AX, X-NX, and XH contributed to the data analysis and interpretation. AX and X-NX drafted the manuscript. XH and D-YF revised the manuscript. D-YF supervised the entire study. All authors contributed to the article and approved the submitted version.
Funding
The National Natural Science Foundation of China (No.82072909).
Conflict of interest
The authors declare that the research was conducted in the absence of any commercial or financial relationships that could be construed as a potential conflict of interest.
Publisher’s note
All claims expressed in this article are solely those of the authors and do not necessarily represent those of their affiliated organizations, or those of the publisher, the editors and the reviewers. Any product that may be evaluated in this article, or claim that may be made by its manufacturer, is not guaranteed or endorsed by the publisher.
References
1. Giaquinto AN, Sung H, Miller KD, Kramer JL, Newman LA, Minihan A, et al. Breast cancer statistics, 2022. CA Cancer J Clin (2022) 72(6):524–41. doi: 10.3322/caac.21754
2. Siegel RL, Miller KD, Wagle NS, Jemal A. Cancer statistics, 2023. CA Cancer J Clin (2023) 73(1):17–48. doi: 10.3322/caac.21763
3. Wilkinson L, Gathani T. Understanding breast cancer as a global health concern. Br J Radiol (2022) 95(1130):20211033. doi: 10.1259/bjr.20211033
4. Pellegrino B, Hlavata Z, Migali C, De Silva P, Aiello M, Willard-Gallo K, et al. Luminal breast cancer: Risk of recurrence and tumor-associated immune suppression. Mol Diagn Ther (2021) 25(4):409–24. doi: 10.1007/s40291-021-00525-7
5. Pan H, Gray R, Braybrooke J, Davies C, Taylor C, McGale P, et al. 20-year risks of breast-cancer recurrence after stopping endocrine therapy at 5 years. N Engl J Med (2017) 377(19):1836–46. doi: 10.1056/NEJMoa1701830
6. Li JJ, Tsang JY, Tse GM. Tumor microenvironment in breast cancer-updates on therapeutic implications and pathologic assessment. Cancers (Basel) (2021) 13(16):4233. doi: 10.3390/cancers13164233
7. Mittal S, Brown NJ, Holen I. The breast tumor microenvironment: Role in cancer development, progression and response to therapy. Expert Rev Mol Diagn (2018) 18(3):227–43. doi: 10.1080/14737159.2018.1439382
8. Wang Y, Zhu M, Guo F, Song Y, Fan X, Qin G. Identification of tumor microenvironment-related prognostic biomarkers in luminal breast cancer. Front Genet (2020) 11:555865. doi: 10.3389/fgene.2020.555865
9. Zeppellini A, Galimberti S, Leone BE, Pacifico C, Riva F, Cicchiello F, et al. Comparison of tumor microenvironment in primary and paired metastatic Er+/Her2- breast cancers: Results of a pilot study. BMC Cancer (2021) 21(1):260. doi: 10.1186/s12885-021-07960-z
10. Lv J, Ren J, Zheng J, Zhang F, Han M. Prognosis of tumor microenvironment in luminal b-type breast cancer. Dis Markers (2022) 2022:5621441. doi: 10.1155/2022/5621441
11. Rimal R, Desai P, Daware R, Hosseinnejad A, Prakash J, Lammers T, et al. Cancer-associated fibroblasts: Origin, function, imaging, and therapeutic targeting. Adv Drug Delivery Rev (2022) 189:114504. doi: 10.1016/j.addr.2022.114504
12. Papait A, Romoli J, Stefani FR, Chiodelli P, Montresor MC, Agoni L, et al. Fight the cancer, hit the caf! Cancers (Basel) (2022) 14(15):3570. doi: 10.3390/cancers14153570
13. Wu F, Yang J, Liu J, Wang Y, Mu J, Zeng Q, et al. Signaling pathways in cancer-associated fibroblasts and targeted therapy for cancer. Signal Transduct Target Ther (2021) 6(1):218. doi: 10.1038/s41392-021-00641-0
14. Mao X, Xu J, Wang W, Liang C, Hua J, Liu J, et al. Crosstalk between cancer-associated fibroblasts and immune cells in the tumor microenvironment: New findings and future perspectives. Mol Cancer (2021) 20(1):131. doi: 10.1186/s12943-021-01428-1
15. Tan S, Yang Y, Yang W, Han Y, Huang L, Yang R, et al. Exosomal cargos-mediated metabolic reprogramming in tumor microenvironment. J Exp Clin Cancer Res (2023) 42(1):59. doi: 10.1186/s13046-023-02634-z
16. Hu JL, Wang W, Lan XL, Zeng ZC, Liang YS, Yan YR, et al. Cafs secreted exosomes promote metastasis and chemotherapy resistance by enhancing cell stemness and epithelial-mesenchymal transition in colorectal cancer. Mol Cancer (2019) 18(1):91. doi: 10.1186/s12943-019-1019-x
17. Li Z, Sun C, Qin Z. Metabolic reprogramming of cancer-associated fibroblasts and its effect on cancer cell reprogramming. Theranostics (2021) 11(17):8322–36. doi: 10.7150/thno.62378
18. Barrett RL, Pure E. Cancer-associated fibroblasts and their influence on tumor immunity and immunotherapy. Elife (2020) 9:e57243. doi: 10.7554/eLife.57243
19. Brechbuhl HM, Finlay-Schultz J, Yamamoto TM, Gillen AE, Cittelly DM, Tan AC, et al. Fibroblast subtypes regulate responsiveness of luminal breast cancer to estrogen. Clin Cancer Res (2017) 23(7):1710–21. doi: 10.1158/1078-0432.CCR-15-2851
20. Louault K, Bonneaud TL, Seveno C, Gomez-Bougie P, Nguyen F, Gautier F, et al. Interactions between cancer-associated fibroblasts and tumor cells promote mcl-1 dependency in estrogen receptor-positive breast cancers. Oncogene (2019) 38(17):3261–73. doi: 10.1038/s41388-018-0635-z
21. Sansone P, Berishaj M, Rajasekhar VK, Ceccarelli C, Chang Q, Strillacci A, et al. Evolution of cancer stem-like cells in endocrine-resistant metastatic breast cancers is mediated by stromal microvesicles. Cancer Res (2017) 77(8):1927–41. doi: 10.1158/0008-5472.CAN-16-2129
22. Glabman RA, Choyke PL, Sato N. Cancer-associated fibroblasts: Tumorigenicity and targeting for cancer therapy. Cancers (Basel) (2022) 14(16):3906. doi: 10.3390/cancers14163906
23. Chauhan VP, Chen IX, Tong R, Ng MR, Martin JD, Naxerova K, et al. Reprogramming the microenvironment with tumor-selective angiotensin blockers enhances cancer immunotherapy. Proc Natl Acad Sci U.S.A. (2019) 116(22):10674–80. doi: 10.1073/pnas.1819889116
24. Su S, Chen J, Yao H, Liu J, Yu S, Lao L, et al. Cd10(+)Gpr77(+) cancer-associated fibroblasts promote cancer formation and chemoresistance by sustaining cancer stemness. Cell (2018) 172(4):841–56 e16. doi: 10.1016/j.cell.2018.01.009
25. Langfelder P, Horvath S. Wgcna: An r package for weighted correlation network analysis. BMC Bioinf (2008) 9:559. doi: 10.1186/1471-2105-9-559
26. Feng S, Xu Y, Dai Z, Yin H, Zhang K, Shen Y. Integrative analysis from multicenter studies identifies a wgcna-derived cancer-associated fibroblast signature for ovarian cancer. Front Immunol (2022) 13:951582. doi: 10.3389/fimmu.2022.951582
27. Zheng H, Liu H, Li H, Dou W, Wang X. Weighted gene co-expression network analysis identifies a cancer-associated fibroblast signature for predicting prognosis and therapeutic responses in gastric cancer. Front Mol Biosci (2021) 8:744677. doi: 10.3389/fmolb.2021.744677
28. Liu B, Zhan Y, Chen X, Hu X, Wu B, Pan S. Weighted gene co-expression network analysis can sort cancer-associated fibroblast-specific markers promoting bladder cancer progression. J Cell Physiol (2021) 236(2):1321–31. doi: 10.1002/jcp.29939
29. Liu B, Chen X, Zhan Y, Wu B, Pan S. Identification of a gene signature for renal cell carcinoma-associated fibroblasts mediating cancer progression and affecting prognosis. Front Cell Dev Biol (2020) 8:604627. doi: 10.3389/fcell.2020.604627
30. Loi S, Michiels S, Salgado R, Sirtaine N, Jose V, Fumagalli D, et al. Tumor infiltrating lymphocytes are prognostic in triple negative breast cancer and predictive for trastuzumab benefit in early breast cancer: Results from the finher trial. Ann Oncol (2014) 25(8):1544–50. doi: 10.1093/annonc/mdu112
31. Racle J, de Jonge K, Baumgaertner P, Speiser DE, Gfeller D. Simultaneous enumeration of cancer and immune cell types from bulk tumor gene expression data. Elife (2017) 6:e26476. doi: 10.7554/eLife.26476
32. Aran D, Hu Z, Butte AJ. Xcell: Digitally portraying the tissue cellular heterogeneity landscape. Genome Biol (2017) 18(1):220. doi: 10.1186/s13059-017-1349-1
33. Becht E, Giraldo NA, Lacroix L, Buttard B, Elarouci N, Petitprez F, et al. Estimating the population abundance of tissue-infiltrating immune and stromal cell populations using gene expression. Genome Biol (2016) 17(1):218. doi: 10.1186/s13059-016-1070-5
34. Jiang P, Gu S, Pan D, Fu J, Sahu A, Hu X, et al. Signatures of t cell dysfunction and exclusion predict cancer immunotherapy response. Nat Med (2018) 24(10):1550–8. doi: 10.1038/s41591-018-0136-1
35. Sturm G, Finotello F, List M. Immunedeconv: An r package for unified access to computational methods for estimating immune cell fractions from bulk rna-sequencing data. Methods Mol Biol (2020) 2120:223–32. doi: 10.1007/978-1-0716-0327-7_16
36. Yoshihara K, Shahmoradgoli M, Martinez E, Vegesna R, Kim H, Torres-Garcia W, et al. Inferring tumour purity and stromal and immune cell admixture from expression data. Nat Commun (2013) 4:2612. doi: 10.1038/ncomms3612
37. Yu G, Wang LG, Han Y, He QY. Clusterprofiler: An r package for comparing biological themes among gene clusters. OMICS (2012) 16(5):284–7. doi: 10.1089/omi.2011.0118
38. Simon N, Friedman J, Hastie T, Tibshirani R. Regularization paths for cox's proportional hazards model Via coordinate descent. J Stat Softw (2011) 39(5):1–13. doi: 10.18637/jss.v039.i05
39. Han C, Liu T, Yin R. Biomarkers for cancer-associated fibroblasts. biomark Res (2020) 8(1):64. doi: 10.1186/s40364-020-00245-w
40. Nurmik M, Ullmann P, Rodriguez F, Haan S, Letellier E. In search of definitions: Cancer-associated fibroblasts and their markers. Int J Cancer (2020) 146(4):895–905. doi: 10.1002/ijc.32193
41. Yang W, Soares J, Greninger P, Edelman EJ, Lightfoot H, Forbes S, et al. Genomics of drug sensitivity in cancer (Gdsc): A resource for therapeutic biomarker discovery in cancer cells. Nucleic Acids Res (2013) 41(Database issue):D955–61. doi: 10.1093/nar/gks1111
42. Geeleher P, Cox N, Huang RS. Prrophetic: An r package for prediction of clinical chemotherapeutic response from tumor gene expression levels. PloS One (2014) 9(9):e107468. doi: 10.1371/journal.pone.0107468
43. Liberzon A, Birger C, Thorvaldsdottir H, Ghandi M, Mesirov JP, Tamayo P. The molecular signatures database (Msigdb) hallmark gene set collection. Cell Syst (2015) 1(6):417–25. doi: 10.1016/j.cels.2015.12.004
44. Hanzelmann S, Castelo R, Guinney J. Gsva: Gene set variation analysis for microarray and rna-seq data. BMC Bioinf (2013) 14:7. doi: 10.1186/1471-2105-14-7
45. Ghandi M, Huang FW, Jane-Valbuena J, Kryukov GV, Lo CC, McDonald ER 3rd, et al. Next-generation characterization of the cancer cell line encyclopedia. Nature (2019) 569(7757):503–8. doi: 10.1038/s41586-019-1186-3
46. Uhlen M, Karlsson MJ, Zhong W, Tebani A, Pou C, Mikes J, et al. A genome-wide transcriptomic analysis of protein-coding genes in human blood cells. Science (2019) 366(6472):eaax9198. doi: 10.1126/science.aax9198
47. Goldner M, Pandolfi N, Maciel D, Lima J, Sanches S, Ponde N. Combined endocrine and targeted therapy in luminal breast cancer. Expert Rev Anticancer Ther (2021) 21(11):1237–51. doi: 10.1080/14737140.2021.1960160
48. Emens LA. Breast cancer immunotherapy: Facts and hopes. Clin Cancer Res (2018) 24(3):511–20. doi: 10.1158/1078-0432.CCR-16-3001
49. Rugo H, Delord J, Im S, Ott P, Piha-Paul S, Bedard P, et al. Abstract S5-07: Preliminary efficacy and safety of pembrolizumab (Mk-3475) in patients with Pd-L1–positive, estrogen receptor-positive (Er+)/Her2-negative advanced breast cancer enrolled in keynote-028. Cancer Res (2016) 76(4_Supplement):S5–07. doi: 10.1158/1538-7445.SABCS15-S5-07
50. Pusztai L, Han HS, Yau C, Wolf D, Wallace AM, Shatsky R, et al. Abstract Ct011: Evaluation of durvalumab in combination with olaparib and paclitaxel in high-risk Her2 negative stage Ii/Iii breast cancer: Results from the i-spy 2 trial. Cancer Res (2020) 80(16_Supplement):CT011–1. doi: 10.1158/1538-7445.AM2020-CT011
51. Tolaney SM, Barroso-Sousa R, Keenan T, Li T, Trippa L, Vaz-Luis I, et al. Effect of eribulin with or without pembrolizumab on progression-free survival for patients with hormone receptor-positive, Erbb2-negative metastatic breast cancer: A randomized clinical trial. JAMA Oncol (2020) 6(10):1598–605. doi: 10.1001/jamaoncol.2020.3524
52. Tsang JYS, Tse GM. Molecular classification of breast cancer. Adv Anat Pathol (2020) 27(1):27–35. doi: 10.1097/PAP.0000000000000232
53. Najafi M, Farhood B, Mortezaee K. Extracellular matrix (Ecm) stiffness and degradation as cancer drivers. J Cell Biochem (2019) 120(3):2782–90. doi: 10.1002/jcb.27681
54. Li C, Teixeira AF, Zhu HJ, Ten Dijke P. Cancer associated-Fibroblast-Derived exosomes in cancer progression. Mol Cancer (2021) 20(1):154. doi: 10.1186/s12943-021-01463-y
55. Winkler J, Abisoye-Ogunniyan A, Metcalf KJ, Werb Z. Concepts of extracellular matrix remodelling in tumour progression and metastasis. Nat Commun (2020) 11(1):5120. doi: 10.1038/s41467-020-18794-x
56. Wen S, Hou Y, Fu L, Xi L, Yang D, Zhao M, et al. Cancer-associated fibroblast (Caf)-derived Il32 promotes breast cancer cell invasion and metastasis Via integrin Beta3-P38 mapk signalling. Cancer Lett (2019) 442:320–32. doi: 10.1016/j.canlet.2018.10.015
57. Miyazaki K, Togo S, Okamoto R, Idiris A, Kumagai H, Miyagi Y. Collective cancer cell invasion in contact with fibroblasts through integrin-Alpha5beta1/Fibronectin interaction in collagen matrix. Cancer Sci (2020) 111(12):4381–92. doi: 10.1111/cas.14664
58. Chandra Jena B, Sarkar S, Rout L, Mandal M. The transformation of cancer-associated fibroblasts: Current perspectives on the role of tgf-beta in caf mediated tumor progression and therapeutic resistance. Cancer Lett (2021) 520:222–32. doi: 10.1016/j.canlet.2021.08.002
59. Kapoor M, Chinnathambi S. Tgf-Beta1 signalling in alzheimer's pathology and cytoskeletal reorganization: A specialized tau perspective. J Neuroinflamm (2023) 20(1):72. doi: 10.1186/s12974-023-02751-8
60. Rosato S, Syx D, Ivanovski I, Pollazzon M, Santodirocco D, De Marco L, et al. Rin2 syndrome: Expanding the clinical phenotype. Am J Med Genet A (2016) 170(9):2408–15. doi: 10.1002/ajmg.a.37789
61. Yuan W, Song C. The emerging role of Rab5 in membrane receptor trafficking and signaling pathways. Biochem Res Int (2020) 2020:4186308. doi: 10.1155/2020/4186308
62. Syx D, Malfait F, Van Laer L, Hellemans J, Hermanns-Le T, Willaert A, et al. The Rin2 syndrome: A new autosomal recessive connective tissue disorder caused by deficiency of ras and rab interactor 2 (Rin2). Hum Genet (2010) 128(1):79–88. doi: 10.1007/s00439-010-0829-0
63. Sandri C, Caccavari F, Valdembri D, Camillo C, Veltel S, Santambrogio M, et al. The r-Ras/Rin2/Rab5 complex controls endothelial cell adhesion and morphogenesis Via active integrin endocytosis and rac signaling. Cell Res (2012) 22(10):1479–501. doi: 10.1038/cr.2012.110
64. Wang XQ, Xu SW, Wang W, Piao SZ, Mao XL, Zhou XB, et al. Identification and validation of a novel DNA damage and DNA repair related genes based signature for colon cancer prognosis. Front Genet (2021) 12:635863. doi: 10.3389/fgene.2021.635863
65. Isenberg JS, Roberts DD. Thbs1 (Thrombospondin-1). Atlas Genet Cytogenet Oncol Haematol (2020) 24(8):291–9. doi: 10.4267/2042/70774
66. Zhang X, Huang T, Li Y, Qiu H. Upregulation of Thbs1 is related to immunity and chemotherapy resistance in gastric cancer. Int J Gen Med (2021) 14:4945–57. doi: 10.2147/IJGM.S329208
67. Shen J, Cao B, Wang Y, Ma C, Zeng Z, Liu L, et al. Hippo component yap promotes focal adhesion and tumour aggressiveness Via transcriptionally activating Thbs1/Fak signalling in breast cancer. J Exp Clin Cancer Res (2018) 37(1):175. doi: 10.1186/s13046-018-0850-z
68. Jayachandran A, Anaka M, Prithviraj P, Hudson C, McKeown SJ, Lo PH, et al. Thrombospondin 1 promotes an aggressive phenotype through epithelial-to-Mesenchymal transition in human melanoma. Oncotarget (2014) 5(14):5782–97. doi: 10.18632/oncotarget.2164
69. Pal SK, Nguyen CT, Morita KI, Miki Y, Kayamori K, Yamaguchi A, et al. Thbs1 is induced by Tgfb1 in the cancer stroma and promotes invasion of oral squamous cell carcinoma. J Oral Pathol Med (2016) 45(10):730–9. doi: 10.1111/jop.12430
70. Folgueira MA, Maistro S, Katayama ML, Roela RA, Mundim FG, Nanogaki S, et al. Markers of breast cancer stromal fibroblasts in the primary tumour site associated with lymph node metastasis: A systematic review including our case series. Biosci Rep (2013) 33(6):e00085. doi: 10.1042/BSR20130060
71. Wang T, Srivastava S, Hartman M, Buhari SA, Chan CW, Iau P, et al. High expression of intratumoral stromal proteins is associated with chemotherapy resistance in breast cancer. Oncotarget (2016) 7(34):55155–68. doi: 10.18632/oncotarget.10894
72. Lappano R, Talia M, Cirillo F, Rigiracciolo DC, Scordamaglia D, Guzzi R, et al. The Il1beta-Il1r signaling is involved in the stimulatory effects triggered by hypoxia in breast cancer cells and cancer-associated fibroblasts (Cafs). J Exp Clin Cancer Res (2020) 39(1):153. doi: 10.1186/s13046-020-01667-y
73. Sun R, Gao DS, Shoush J, Lu B. The il-1 family in tumorigenesis and antitumor immunity. Semin Cancer Biol (2022) 86(Pt 2):280–95. doi: 10.1016/j.semcancer.2022.05.002
74. Zhang P, Gu Y, Fang H, Cao Y, Wang J, Liu H, et al. Intratumoral il-1r1 expression delineates a distinctive molecular subset with therapeutic resistance in patients with gastric cancer. J Immunother Cancer (2022) 10(2):e004047. doi: 10.1136/jitc-2021-004047
75. De Francesco EM, Lappano R, Santolla MF, Marsico S, Caruso A, Maggiolini M. Hif-1alpha/Gper signaling mediates the expression of vegf induced by hypoxia in breast cancer associated fibroblasts (Cafs). Breast Cancer Res (2013) 15(4):R64. doi: 10.1186/bcr3458
76. Sarmiento-Castro A, Caamano-Gutierrez E, Sims AH, Hull NJ, James MI, Santiago-Gomez A, et al. Increased expression of interleukin-1 receptor characterizes anti-Estrogen-Resistant aldh(+) breast cancer stem cells. Stem Cell Rep (2020) 15(2):307–16. doi: 10.1016/j.stemcr.2020.06.020
77. Eyre R, Alferez DG, Santiago-Gomez A, Spence K, McConnell JC, Hart C, et al. Microenvironmental Il1beta promotes breast cancer metastatic colonisation in the bone Via activation of wnt signalling. Nat Commun (2019) 10(1):5016. doi: 10.1038/s41467-019-12807-0
78. Grismayer B, Solch S, Seubert B, Kirchner T, Schafer S, Baretton G, et al. Rab31 expression levels modulate tumor-relevant characteristics of breast cancer cells. Mol Cancer (2012) 11:62. doi: 10.1186/1476-4598-11-62
79. Sui Y, Zheng X, Zhao D. Rab31 promoted hepatocellular carcinoma (Hcc) progression Via inhibition of cell apoptosis induced by Pi3k/Akt/Bcl-2/Bax pathway. Tumour Biol (2015) 36(11):8661–70. doi: 10.1007/s13277-015-3626-5
80. Tang CT, Liang Q, Yang L, Lin XL, Wu S, Chen Y, et al. Rab31 targeted by mir-30c-2-3p regulates the Gli1 signaling pathway, affecting gastric cancer cell proliferation and apoptosis. Front Oncol (2018) 8:554. doi: 10.3389/fonc.2018.00554
81. Yang L, Tian X, Chen X, Lin X, Tang C, Gao Y, et al. Upregulation of Rab31 is associated with poor prognosis and promotes colorectal carcinoma proliferation Via the Mtor/P70s6k/Cyclin D1 signalling pathway. Life Sci (2020) 257:118126. doi: 10.1016/j.lfs.2020.118126
82. Soelch S, Beaufort N, Loessner D, Kotzsch M, Reuning U, Luther T, et al. Rab31-dependent regulation of transforming growth factor β expression in breast cancer cells. Mol Med (2021) 27(1):158. doi: 10.1186/s10020-021-00419-8
83. Chen K, Xu J, Tong YL, Yan JF, Pan Y, Wang WJ, et al. Rab31 promotes metastasis and cisplatin resistance in stomach adenocarcinoma through Twist1-mediated emt. Cell Death Dis (2023) 14(2):115. doi: 10.1038/s41419-023-05596-4
84. Nallanthighal S, Heiserman JP, Cheon DJ. Collagen type xi alpha 1 (Col11a1): A novel biomarker and a key player in cancer. Cancers (Basel) (2021) 13(5):935. doi: 10.3390/cancers13050935
85. Wu YH, Chang TH, Huang YF, Huang HD, Chou CY. Col11a1 promotes tumor progression and predicts poor clinical outcome in ovarian cancer. Oncogene (2014) 33(26):3432–40. doi: 10.1038/onc.2013.307
86. Wu YH, Huang YF, Chang TH, Chen CC, Wu PY, Huang SC, et al. Col11a1 activates cancer-associated fibroblasts by modulating tgf-Beta3 through the nf-Kappab/Igfbp2 axis in ovarian cancer cells. Oncogene (2021) 40(26):4503–19. doi: 10.1038/s41388-021-01865-8
87. Liu Z, Lai J, Jiang H, Ma C, Huang H. Collagen xi alpha 1 chain, a potential therapeutic target for cancer. FASEB J (2021) 35(6):e21603. doi: 10.1096/fj.202100054RR
88. Wu YH, Chang TH, Huang YF, Chen CC, Chou CY. Col11a1 confers chemoresistance on ovarian cancer cells through the activation of Akt/C/Ebpbeta pathway and Pdk1 stabilization. Oncotarget (2015) 6(27):23748–63. doi: 10.18632/oncotarget.4250
89. Wu YH, Huang YF, Chang TH, Chou CY. Activation of Twist1 by Col11a1 promotes chemoresistance and inhibits apoptosis in ovarian cancer cells by modulating nf-Kappab-Mediated ikkbeta expression. Int J Cancer (2017) 141(11):2305–17. doi: 10.1002/ijc.30932
90. Luo Q, Li J, Su X, Tan Q, Zhou F, Xie S. Col11a1 serves as a biomarker for poor prognosis and correlates with immune infiltration in breast cancer. Front Genet (2022) 13:935860. doi: 10.3389/fgene.2022.935860
Keywords: luminal breast cancer (LBC), cancer-associated fibroblasts (CAFs), weighted gene co-expression network analysis (WGCNA), prognostic CAF markers, anti-CAF therapeutic approach
Citation: Xu A, Xu X-N, Luo Z, Huang X, Gong R-Q and Fu D-Y (2023) Identification of prognostic cancer-associated fibroblast markers in luminal breast cancer using weighted gene co-expression network analysis. Front. Oncol. 13:1191660. doi: 10.3389/fonc.2023.1191660
Received: 22 March 2023; Accepted: 24 April 2023;
Published: 03 May 2023.
Edited by:
Deniz Can Guven, Hacettepe University, TürkiyeCopyright © 2023 Xu, Xu, Luo, Huang, Gong and Fu. This is an open-access article distributed under the terms of the Creative Commons Attribution License (CC BY). The use, distribution or reproduction in other forums is permitted, provided the original author(s) and the copyright owner(s) are credited and that the original publication in this journal is cited, in accordance with accepted academic practice. No use, distribution or reproduction is permitted which does not comply with these terms.
*Correspondence: De-Yuan Fu, ZmR5MTAwM0AxNjMuY29t
†These authors have contributed equally to this work