 Ananya Bhattacharjee1†
 Sameh Rabea2*
 Abhishek Bhattacharjee3*†
 Eslam B. Elkaeed2R. Murugan1*Heba Mohammed Refat M. Selim2,4
 Ram Kumar Sahu5*Gamal A. Shazly6
 Mounir M. Salem Bekhit6
- 1Bio-Medical Imaging Laboratory (BIOMIL), Department of Electronics and Communication Engineering, National Institute of Technology Silchar, Silchar, India
- 2Department of Pharmaceutical Sciences, College of Pharmacy, AlMaarefa University, Riyadh, Saudi Arabia
- 3Department of Pharmaceutical Sciences, Assam University (A Central University), Silchar, India
- 4Microbiology and Immunology Department, Faculty of Pharmacy (Girls); Al-Azhar University, Cairo, Egypt
- 5Department of Pharmaceutical Sciences, Hemvati Nandan Bahuguna Garhwal University (A Central University), Tehri Garhwal, India
- 6Kayyali Chair for Pharmaceutical Industry, Department of Pharmaceutics, College of Pharmacy, King Saud University, Riyadh, Saudi Arabia
Lung cancer is a fatal disease caused by an abnormal proliferation of cells in the lungs. Similarly, chronic kidney disorders affect people worldwide and can lead to renal failure and impaired kidney function. Cyst development, kidney stones, and tumors are frequent diseases impairing kidney function. Since these conditions are generally asymptomatic, early, and accurate identification of lung cancer and renal conditions is necessary to prevent serious complications. Artificial Intelligence plays a vital role in the early detection of lethal diseases. In this paper, we proposed a modified Xception deep neural network-based computer-aided diagnosis model, consisting of transfer learning based image net weights of Xception model and a fine-tuned network for automatic lung and kidney computed tomography multi-class image classification. The proposed model obtained 99.39% accuracy, 99.33% precision, 98% recall, and 98.67% F1-score for lung cancer multi-class classification. Whereas, it attained 100% accuracy, F1 score, recall and precision for kidney disease multi-class classification. Also, the proposed modified Xception model outperformed the original Xception model and the existing methods. Hence, it can serve as a support tool to the radiologists and nephrologists for early detection of lung cancer and chronic kidney disease, respectively.
1 Introduction
Lung cancer is one of the world’s most life-threatening diseases. In 2023, smoking cigarettes will directly cause around 81% lung cancer deaths, with second-hand smoke contributing to an additional 3,560 of the 127,070 fatalities Siegel et al. (1). There are two primary categories of lung nodules: benign and malignant. Lung nodules that are benign remain firmly in their original position and do not spread to other bodily areas Heuvelmans et al. (2). Most benign lung nodules are not malignant. Diet, stress, genetics, local damage, and radiation exposure are among the potential contributory factors to benign tumors Takamori et al. (3). Malignant lung nodules, on the other hand, spread uncontrollably throughout the body through the lymphatic or blood systems Gu et al. (4). A malignant lung tumor needs immediate treatment, and if detected early, the patient may be treated by surgery and chemotherapy. On the other hand, Chronic Kidney Disease (CKD) is a degenerative ailment that affects more than 10% of the world’s population, leading to 800 million individuals (5). Persons with diabetes mellitus and hypertension, older adults and women are more likely to develop CKD. Low- and middle-income nations are particularly burdened by CKD, because they are least prepared to handle its effects Hill et al. (6). It is graded as the 16th leading cause of death worldwide and is anticipated to move up to 5th place by 2040 Foreman et al. (7). The most common kidney disorders that impair kidney function are renal cell carcinoma (kidney tumor), cyst development, and nephrolithiasis (kidney stones). A hard object made up of chemicals from the urine constitutes the kidney stone disease Alelign and Petros (8). On the other hand, a kidney cyst consists of fluid within a thin wall that develops on the surface of the kidney Sanna et al. (9). Whereas kidney tumor accounts for the 10 most prevailing cancers worldwide Hsieh et al. (10).
Computed tomography (CT) scan is one of the best methods for examining lung cancer and CKD patients, because it produces images with excellent contrast and provides 3D information Brisbane et al. (11). Due to a global shortage of nephrologists and radiologists, manual inspection of medical images is expensive and time consuming and may result in misdiagnosis. CT images play a crucial part in diagnosing many lung and kidney diseases. Still, the necessity for a second opinion owing to a shortage of healthcare professionals significantly impacts the process. Consequently, early detection of renal problems such as kidney stones, cysts, and tumors and lung diseases appear to be critical in preventing kidney failure Bi et al. (12) and lung cancer Monkam et al. (13).
Traditional healthcare management has its limits, but predictive techniques such as deep learning (DL) algorithms can help to overcome these constraints Chen et al. (14); Singh et al. (15); Krishnamurthy et al. (16); Bhattacharjee et al. (17). The application of DL-based detection may reduce invasive procedures, enhancing the efficacy and sustainability of current healthcare methods Akter et al. (18); Alsuhibany et al. (19); Ardila et al. (20). Nowadays, it is feasible to manage enormous and useful data to enhance lung cancer and CKD diagnosis in decision making by using DL classification algorithms Khan et al. (21); Bhaskar and Manikandan (22); Coudray et al. (23). When healthcare practitioners integrate this information with data from other sources, new solutions using predictive analytics can be developed for early CKD and lung cancer diagnosis, related health concerns, and precision therapy. DL algorithms applied to CT images offer an advantage over conventional techniques in medical image classification scenarios. It eliminates the need for subject expertise by automatically learning high-level features from annotated images. DL techniques contributed to advances in oncology and kidney-related domains by reducing manual interventions. Numerous cancer types, namely, prostate cancer Almeida and Tavares (24), pelvic cancer Kalantar et al. (25) and lung cancer Xie et al. (26) have benefited from DL-based classification algorithms. Therefore, the severe negative effects of CKD and lung cancer on many afflicted people, the global shortage of nephrologists and the onset of AI-based computer-aided diagnosis systems motivated us to propose a DL-based classification model that can assist in early CKD and lung cancer detection.
This paper proposes a DL-based modified Xception model for automatically classifying lung cancer patients and kidney diseases such as cysts, stones, and tumors. The Xception model is modified in such a way that both transfer learning-based pre-trained “imagenet” weights and fine-tuned structure is incorporated into the proposed model and hence, is the novelty of the proposed model. Its main contributions are listed below:
1. An effective multi-class modified Xception model is proposed to ensure the least false positives and negative cases for lung cancer and renal diseases, respectively.
2. The proposed model improved the classification model’s convergence by ensuring no overfitting cases.
3. The proposed model outperformed the existing state-of-the-art techniques.
The remainder of the paper is structured as follows. Section 2 contains the related literature survey. This paper’s materials and methods, including the dataset and the architecture, are described in Section 3. Sections 4 and 5 discuss the obtained results and the inferences drawn from them. Finally, Section 6 presents the Conclusion.
2 Related work
This section introduces the various DL architectures used for lung cancer and renal disease classification based on different image modalities. This section is broadly divided into two classes: binary and multi-class classifications of lung cancer and renal diseases, respectively.
A combination of VGG16, AlexNet, and LeNet models was employed for lung cancer diagnosis. The features were best extracted by AlexNet, which was then coupled with the KNN classifier to reach a classification accuracy of 98.74% ToğCheck that all equations and special characters are displayed correctly.açar et al. (27). A cross-residual CNN was employed for binary classification of lung CT images that achieved 92.19% accuracy Lyu et al. (28). A lung tumor identification technique was introduced that employed a deep CNN model for classification and achieved 97.3% accuracy Rani and Jawhar (29). A DL-based binary classification of Squamous Cell Carcinoma (SCC) and Adenocarcinoma (ADC) was performed that achieved AUC of 94.14 and 95.94%, respectively Chen et al. (30). Computer-aided diagnostic approach for determining the possibility of lung nodule malignancy was employed using a SVM classifier and achieved AUC score of 90.05% Gonçalves et al. (31). A novel CNN method was employed for binary classification of lung CT images Asuntha and Srinivasan (32). A maximum intensity projection based CNN model for automatically detecting lung cancer system was introduced that achieved a sensitivity of 92.7% Zheng et al. (33). A radiomics and CNN approach was used for binary classification of SCC and ADC that yielded AUC of 71% Chaunzwa et al. (34). A ResNeXt feature extractor followed by DenseNet classifier was employed for binary lung CT image classification that obtained 93.78% accuracy Zhang et al. (35). A multi-view CNN was introduced for binary classification of lung benign and malignant CT images that attained 90.49% sensitivity Liu and Kang (36).
In lung multiclass classification, Reddy et al. (37) identified Malignant, Normal, and Benign (MNoB) CT images using an advanced CNN model and pre-trained Resnet50 and Xception models. The highest accuracy obtained was 97.40%. Kareem et al. (38) presented a computer vision system for lung cancer identification through five stages, namely, pre-processing, image enhancement, segmentation, feature extraction, and SVM classifier for multi-class classification of MNoB CT images and obtained an accuracy of 89.88%. A. Bhattacharjee et al. (39) compared the performances of DenseNet 121, NASNet Large, and modified EfficientNet networks for MNoB multi-class classification.
In kidney binary classification, an automated DL-based kidney stone detection model was proposed using CT images and obtained an accuracy of 96.82% Yildirim et al. (40). An FCN-based kidney segmentation followed by a fully automatic framework using abdominal CT scans was proposed for kidney cysts detection and achieved a true positive rate of 84.3% Blau et al. (41). A cascaded Convolutional Neural Network (CNN) was proposed for stone detection based on CT images and obtained the highest accuracy of 95% Parakh et al. (42). A morphological cascaded CNN on CT images was proposed for renal lesion detection and obtained an AUC of 87.1% Zhang et al. (43). The presence of kidney tumors in CT images were incorporated using 2D CNN, ResNet 50, and VGG16 of 6, 50, and 16 layers, respectively. The 2D CNN, VGG16, and ResNet 50 achieved accuracy of 97, 60, and 96%, respectively Alzu’bi et al. (44). A residual dual attention-based U-Net model followed by convolution and softmax layer was used for kidney cysts segmentation and classification, respectively. Precision and recall for the model were 96.34 and 96.88%, respectively. Out of a total of 79 CT images, 27 were used as test images Fu et al. (45). An MLP and backpropagation-based ANN was proposed to classify the kidney stones ultrasound images and obtained an accuracy of 98.8% Viswanath and Gunasundari (46). A ResNet-based deep neural network was proposed to distinguish between renal stone and normal CT images and achieved 99.1% Caglayan et al. (47). A 3D U-Net model was used for kidney segmentation followed by a DL-based classification model for kidney stone detection Cui et al. (48). A novel ensembling classifier was proposed for four different types of models such as Bayesian, Decision Tree, ANN, and rule-based classifier. The proposed approach used a genetic algorithm for weight assignment and achieved 97.1% accuracy Kazemi and Mirroshandel (49). Different algorithms such as Random Forest (RF), Decision Tree, Multi-layer perceptron, Naive Bayes, K-Nearest Neighbor, Support Vector Machine (SVM), and CNN were applied to get the best x-ray image classification model for kidney stone and healthy patients. The decision tree model achieved the highest F1 score of 85.3% Aksakalli et al. (50). A conventional and DL transfer learning methods were integrated to feed as input to an SVM classifier, which obtained a maximum of 88% specificity in distinguishing between normal and unhealthy renal ultrasound images Zheng et al. (51).
In kidney multiclass classification, an ensembled deep neural network, consisting of ResNet 101, MobileNet V2, and ShuffleNet networks classified Normal, Cyst, Tumor, and Stone (NCTS) ultrasound images and obtained a maximum multi-class classification accuracy of 96.54% Sudharson and Kokil (52). A VGG19 model was customized by replacing the fully connected layers with a naive inception module and dense layers to classify NCTS CT images Asif et al. (53). This method yielded a classification accuracy of 99.25%. CNN model was employed to classify NCTS CT images and obtained an accuracy of 99.36% Narmada et al. (54). The NCTS CT images classification was performed by first extracting the features through a DenseNet model followed by RF classifier and obtained an accuracy of 99.44% Qadir and Abd (55). Six DL classifiers such as swin transformer, Compact Convolutional Transformer, External Attention Transformer, Inception V3, VGG16, and ResNet were used for NCTS CT images. The maximum accuracy obtained was 99.30% Islam et al. (56).
In summary, various image modalities such as x-ray, ultrasound and CT images were used for lung cancer and renal disease classification. However, the majority of the work is based on binary classification of abnormal and normal images instead of multi-class classification. Considering the gap in the research findings of the above articles and inspired by the work in Bhattacharjee et al. (17), we proposed a fine-tuned and pre-trained transfer learning technique based modified Xception model for automatic multi-class classification of MNoB lung CT images. The present study is also extended for kidney NCTS CT images.
3 Materials and methods
The dataset utilized in this study and the proposed improved Xception architecture along with its mathematical equations are covered in detail in this section.
3.1 Materials
In this study, two datasets are used, namely, Iraq-Oncology Teaching Hospital/National Center for Cancer Diseases (IQ-OTH/NCCD) Kareem (57) and CT Kidney dataset Islam et al. (56).
The IQ-OTH/NCCD dataset consists of healthy and unhealthy subjects suffering from lung cancer in various stages. This dataset can also be accessed from the Kaggle website Kareem (57). In 2019, the data were gathered for more than 3 months. All of the slides were annotated by the radiologists and oncologists of these two centers. The dataset contains 1,190 images featuring CT scan slices from 110 different instances. The dataset is divided into three categories: MNoB. There are 55 normal cases, 40 malignant cases, and 15 benign cases. Digital Imaging and Communications in Medicine (DICOM) format was used to originally gather the images. However, the JPEG format was subsequently included by the IQ-OTH/NCCD dataset itself. Siemens SOMATOM scanner is employed. One millimeter thick slices are used. The dataset is approved by the institutional review boards of the participating hospitals. Each CT scan is composed of 80 to 200 distinct slices. Every slice is a representation of a distinct angle and side of the human chest. For the 40 malignant instances, there are a total of 561 CT images. The majority of the subjects are from Iraq’s middle area. Figure 1 shows sample images of each MNoB class.
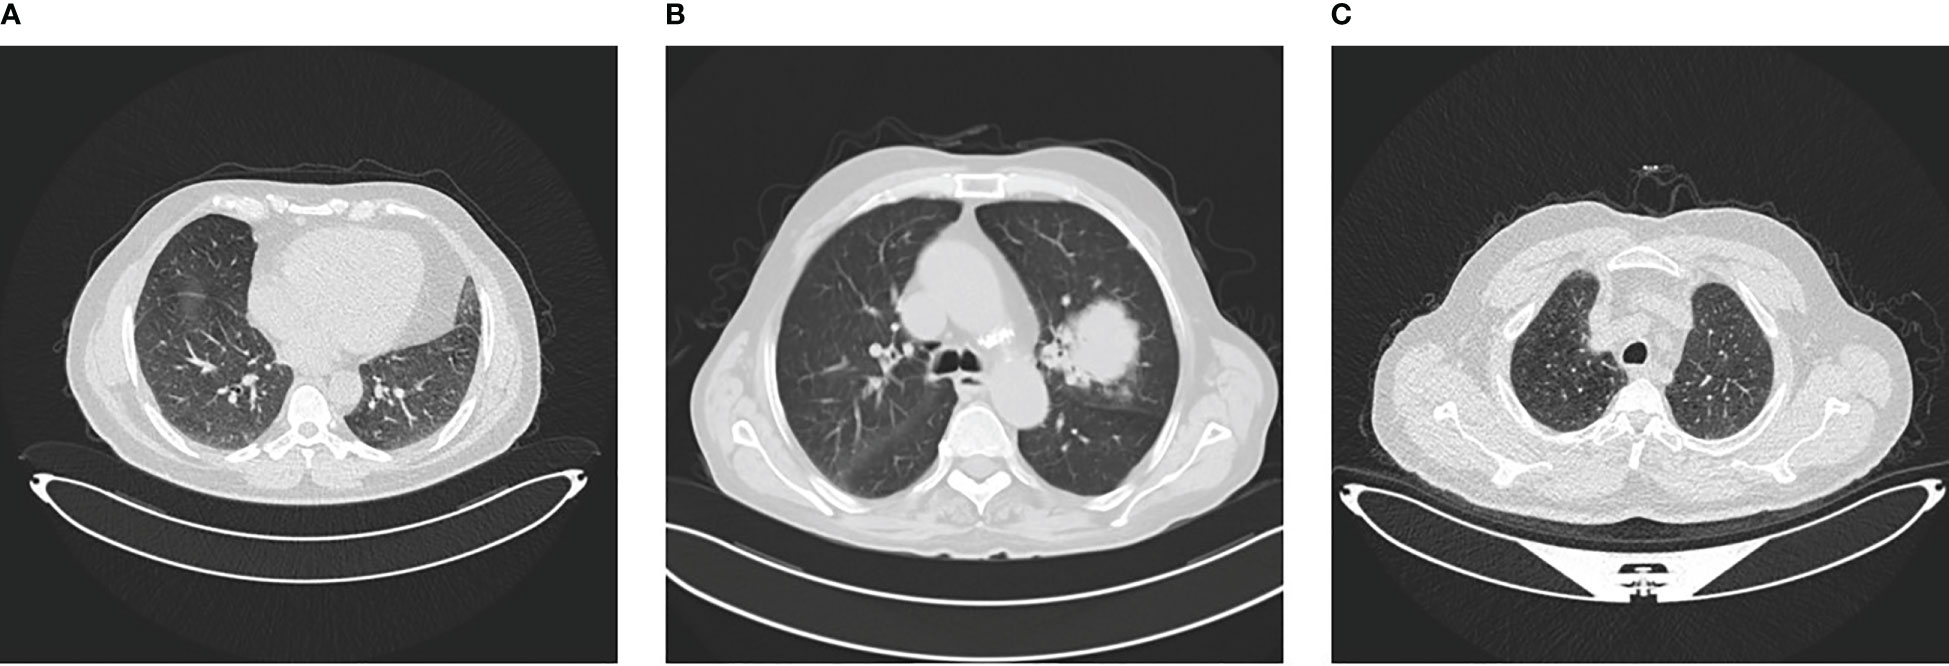
Figure 1 IQ-OTHNCCD dataset (A) Benign (B) Malignant (C) Normal.
The NCTS dataset was gathered from Dhaka hospital, Bangladesh. Proper consent was taken from all the subjects before collecting the data, which was then approved by Dhaka Central International Medical College and Hospital. The dataset consists of 12,446 total abdomen and urogram CT images, where the axial and coronal cuts were taken. Out of this, the number of NCTS images is 5077, 3709, 2283, and 1377, respectively. The dataset can be accessed from the Kaggle website Islam and Mehedi (58). The dataset was originally in DICOM format, which was later converted to JPEG images through the Sante Dicom editor tool. The CT images were annotated by the Philips IntelliSpace Portal application, which was re-verified by a physician and medical technician to avoid any incorrect annotations. Figure 2 shows sample images of each NCTS class.
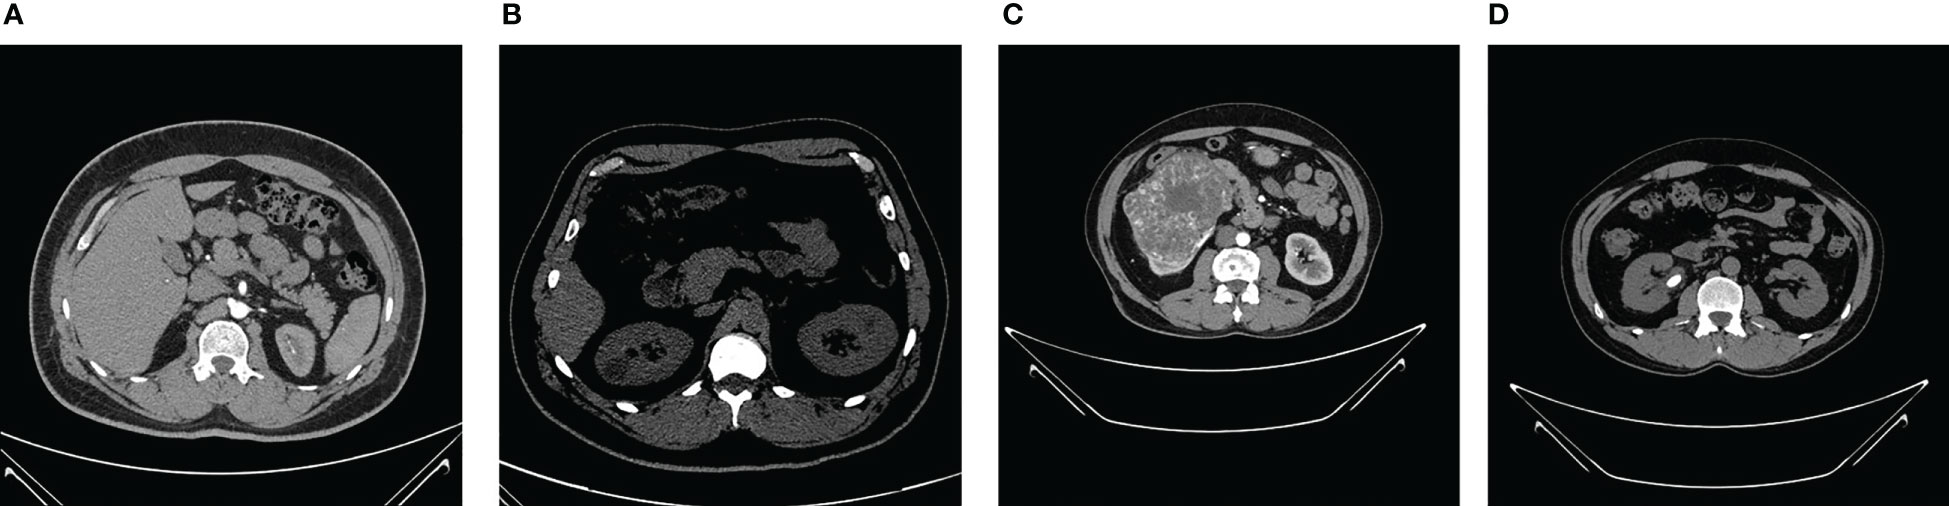
Figure 2 CT Kidney dataset (A) Normal (B) Cyst (C) Tumor (D) Stone.
3.2 Methodology
The proposed modified Xception model, short for the “modified Extreme Inception” model, mainly consists of transferring the weights of the “imagenet” to the target network through transfer learning followed by the fine-tuned network, as shown in figure effig:3. The target network is the modified Xception architecture. In the beginning, the input image is first resized from to during pre-processing for reduced complexity. Then, there are mainly three stages, namely, STAGE-I, STAGE-II, and STAGE-III. First, the source “imagenet” dataset is fed to the original XceptionNet, which is passed over 36 convolutional (conv) layers. Out of these, the number of regular conv and depth-wise Separable Conv 2D layers (Sep Conv 2D) is 2 and 34, respectively. The first block consists of two conv layers of kernels, followed by a Batch Normalization (BN) and Rectified Linear Unit (ReLU) activation function. All blocks, except Blocks 1 and 14, contain a linear stack of residually connected Sep Conv 2D layers. The input (I/P) and output (O/P) dimensions determine whether the residual connections are identity or convolution blocks. When the I/P and O/P dimensions are identical, identity mapping is performed, as shown in Block 5 of Figure 3. Otherwise, a linear projection is executed using short connections to make the dimensions match each other. Blocks 2, 3, 4, and 13 have a linear projection of conv filter of kernel. These blocks also undergo max-pooling operations to extract sharp and smooth features and lower the computing cost by decreasing the amount of parameters that must be learned. BN is included after every conv 2D and Sep Conv 2D layers circumvent the local minima issue by translating the activations to the zero mean and unit variance, hence allowing larger gradient steps for faster convergence Ioffe and Szegedy (59). The use of Sep Conv 2D overcomes the limitation of CNN by segregating the regular conv operations into depth-wise/spatial conv and sequential point-wise conv. This results in fewer parameters compared with regular conv and hence reduces the chances of overfitting Chollet (60). Block 5 is repeated five times having identity mappings. The last block 14 is fed to the softmax layer which finally classifies a thousand classes of imagenet dataset such as kite, bulbul, candle, corn, and so on.
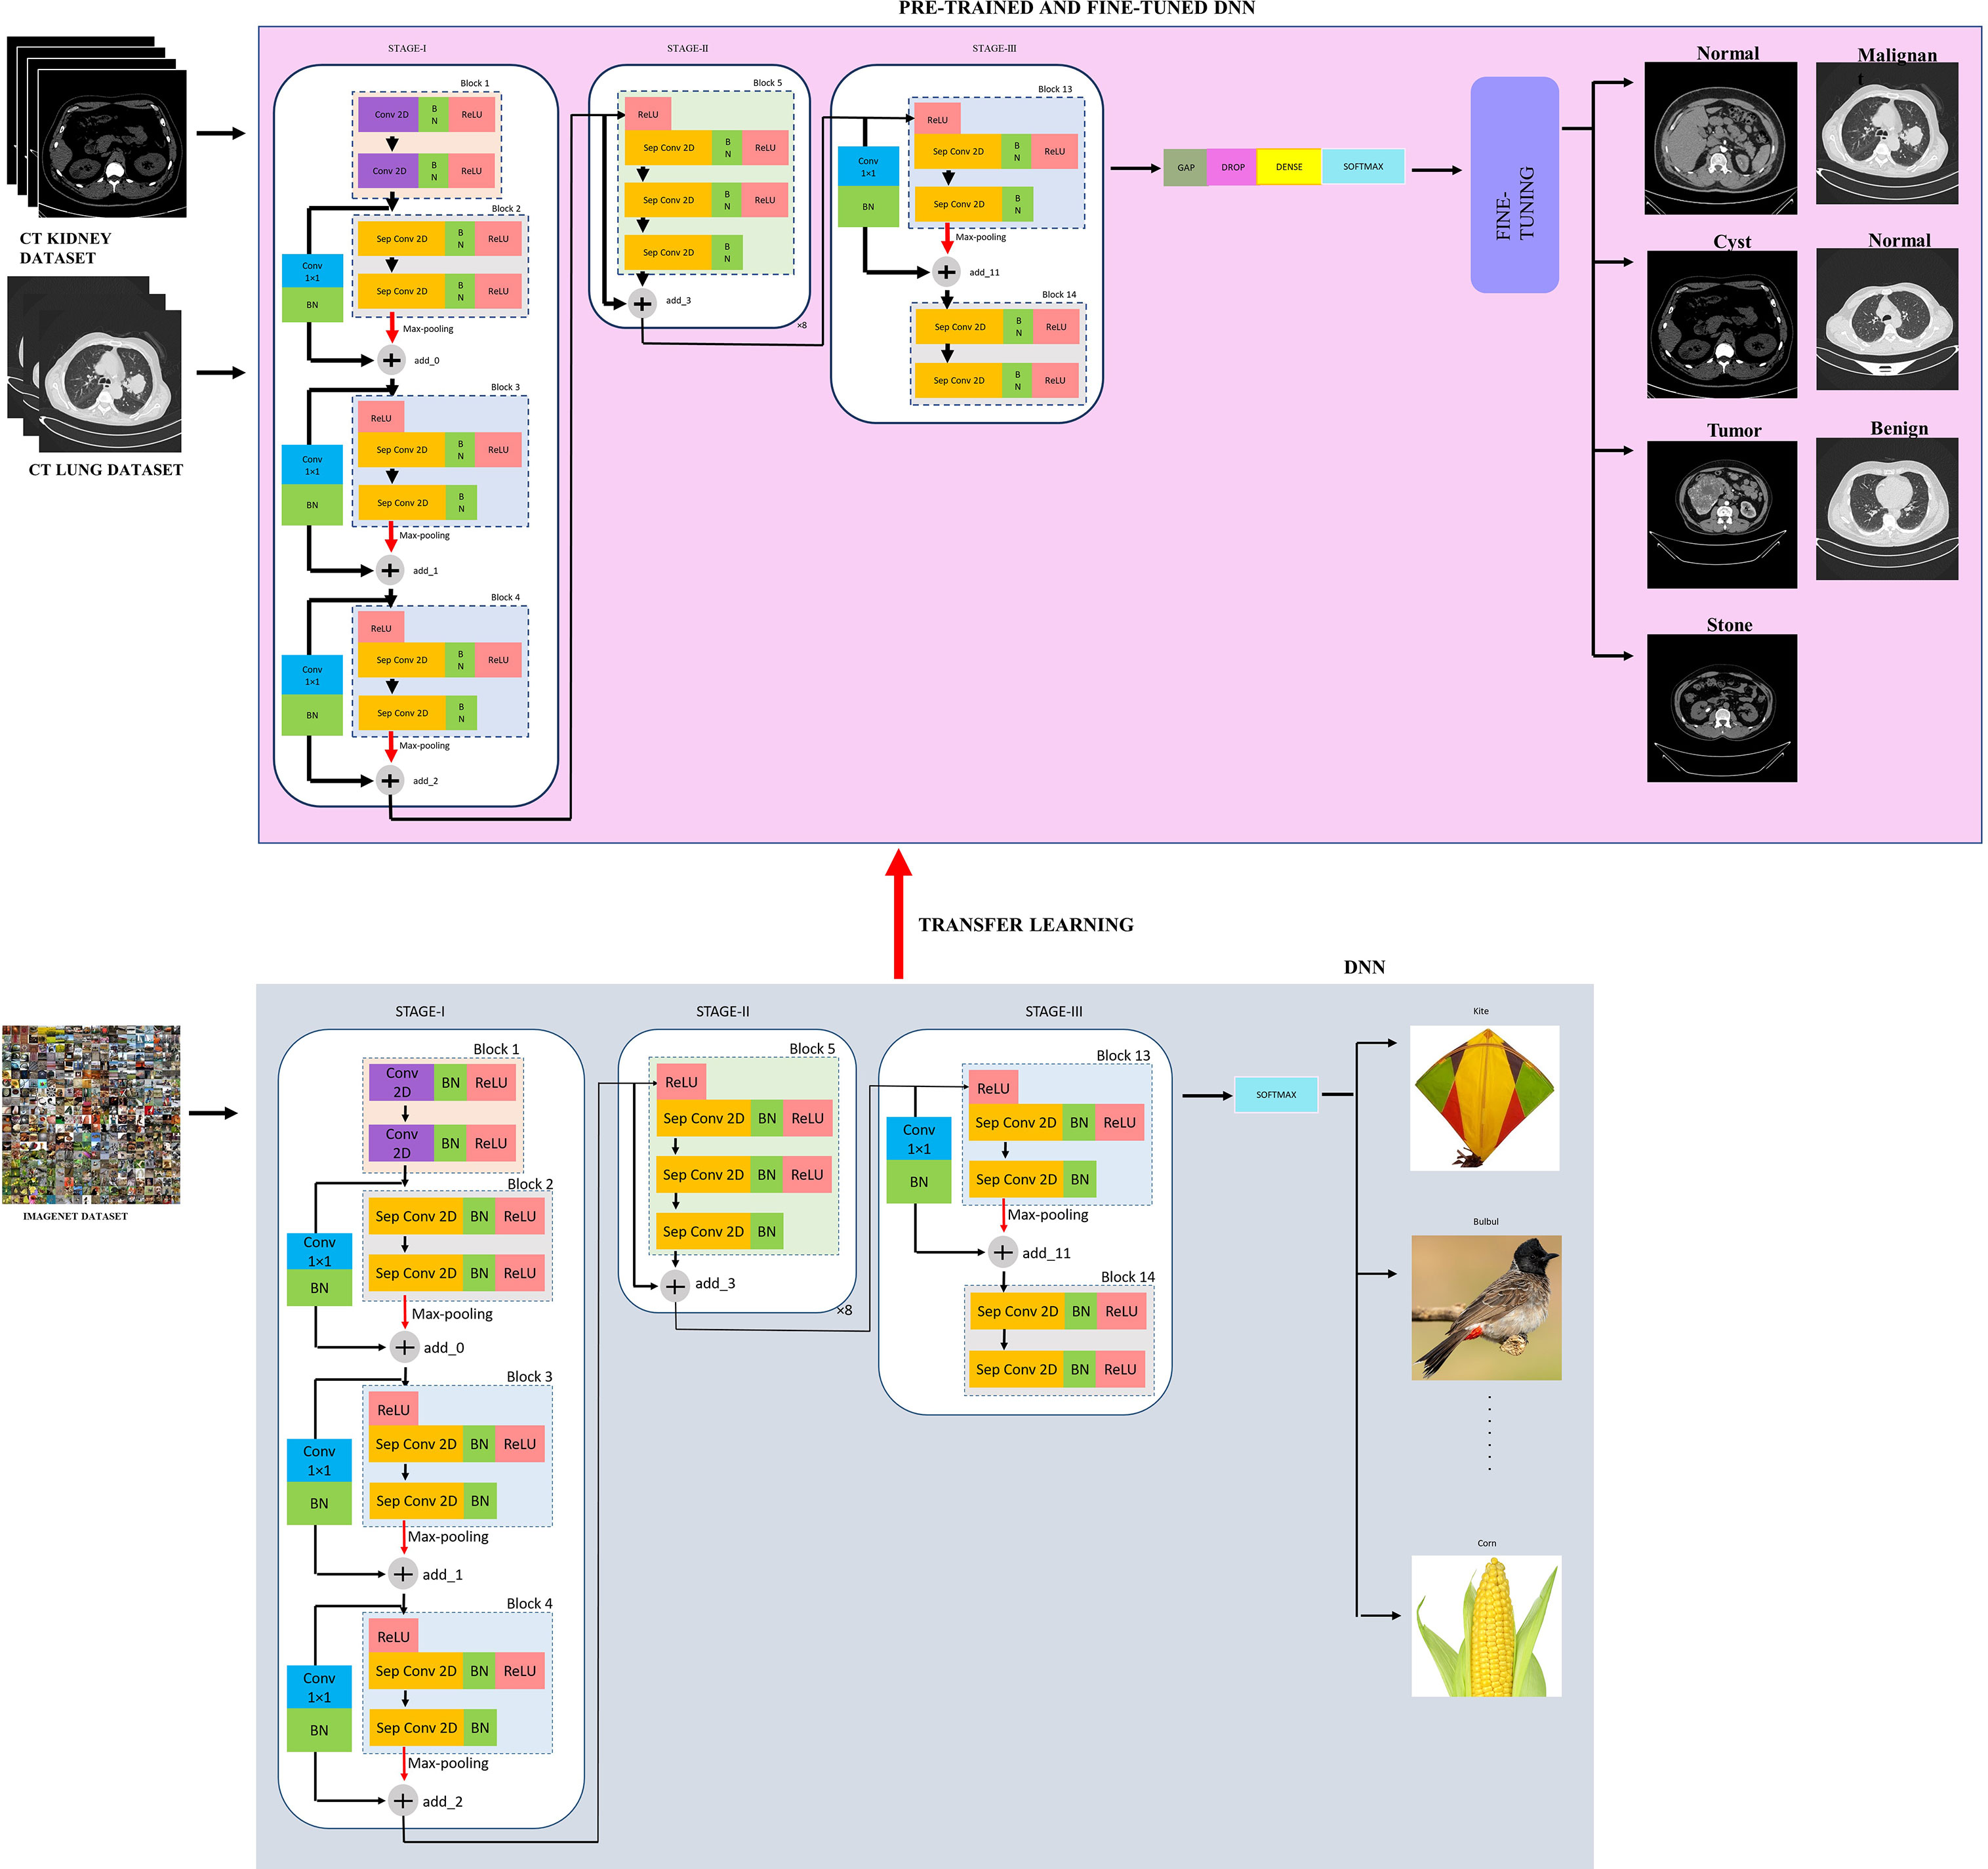
Figure 3 The proposed modified XceptionNet model.
Let the kernel “W” of size be convolved with the I/P image “j(x, y)” and the output “K(x, y)” is represented by Equation (1), which is then fed to a ReLU activation function “ “, given by Equation (2). Similarly, the next Conv 2D outputs “l(x, y),” given by Equation (3) and then fed to ReLU activation function, given by Equation (4).
Suppose the I/P dimension of the imagenet dataset be of size , where is the I/P image size and C is the number of channels. Let the number of filters/kernels be D of size .
For a regular conv, the output size will be . Let the number of multiplications per conv operation be n. Then the size of the filter will be . As D filters are present and every filter slides horizontally and vertically times, the overall number of multiplications is given by Equation (5).
As Sep Conv 2D is combination of both depth-wise convolutions (d) and point-wise convolutions (p), let the number of “d” multiplications be D and “p” multiplications be P. Thus, the overall multiplications for Sep Conv 2D be given by Equation (6).
The dimension of filters for depth wise operations will be of size . Considering C channels for the I/P data, the number of such filters needed are “C.” Therefore, the output will be of dimension . Considering all “C” channels, the total multiplications (D) is given by Equation (7).
In point-wise operation, “C” channels are subjected to convolution. Consequently, the filter dimension after this operation will be . For “D” such filters, the output dimension will be . For point-wise convolution, there will be multiplications. Equation (8) provides the total number of point-wise convolution multiplications.
Thus, the overall multiplications for Sep Conv 2D is given by Equation (9).
The relation between the complexity of regular conv and Sep Conv 2D is given by Equation (10).
Let Q(L) be the desired mapping and the original mapping be indicated by Q(L)+L, executed through shortcut connection followed by addition, as depicted in Figure 3.
Since in Block 2, I/P and output dimensions, namely, L and Q, are not equal, their dimensions are matched through a linear projection using a shortcut connection. This is shown in Equation (11).
where depicts the residual mapping and is the weight layer. Ignoring BN for simplicity, where indicates ReLU.
Similarly, the outputs of Block 3 and 4 are represented by Equations (12) and (13), respectively.
Now, the I/P and O/P dimensions from Block 5 to Block 12 are same. Hence, identity mapping is performed by shortcut connections, as shown in Equation (14). In this case, .
The output of Block 13 is given by Equation (15).
Now, the weights of the imagenet dataset trained on the original XceptionNet is transferred to the target network, which consists of customized top layers and fine-tuned blocks, thus assembling a transfer learning and fine-tuned based modified Xception model. As a result of transfer learning, the input CT kidney dataset and lung IQ-OTH/NCCD dataset fed through XceptionNet acts as feature extractors and the Block 14 is fed to our own customized top layers, which consists of Global Average Pooling (GAP) layers, Dropout (DROP) layer having dropout ratio of 0.05, 4, and 3 dense layers for NCTS and MNoB, respectively. Last, a softmax activation function is applied. Then, fine-tuning is performed by unfreezing the top 20 layers leaving BN layers frozen. If BN layers are set as trainable, the first epoch following unfreezing will result in a considerable reduction in accuracy. Thus, an efficient modified Xception approach is proposed that ensures higher performance in effective multi-class classification of NCTS and MNoB CT images. Table 1 explains the proposed architecture in detail.
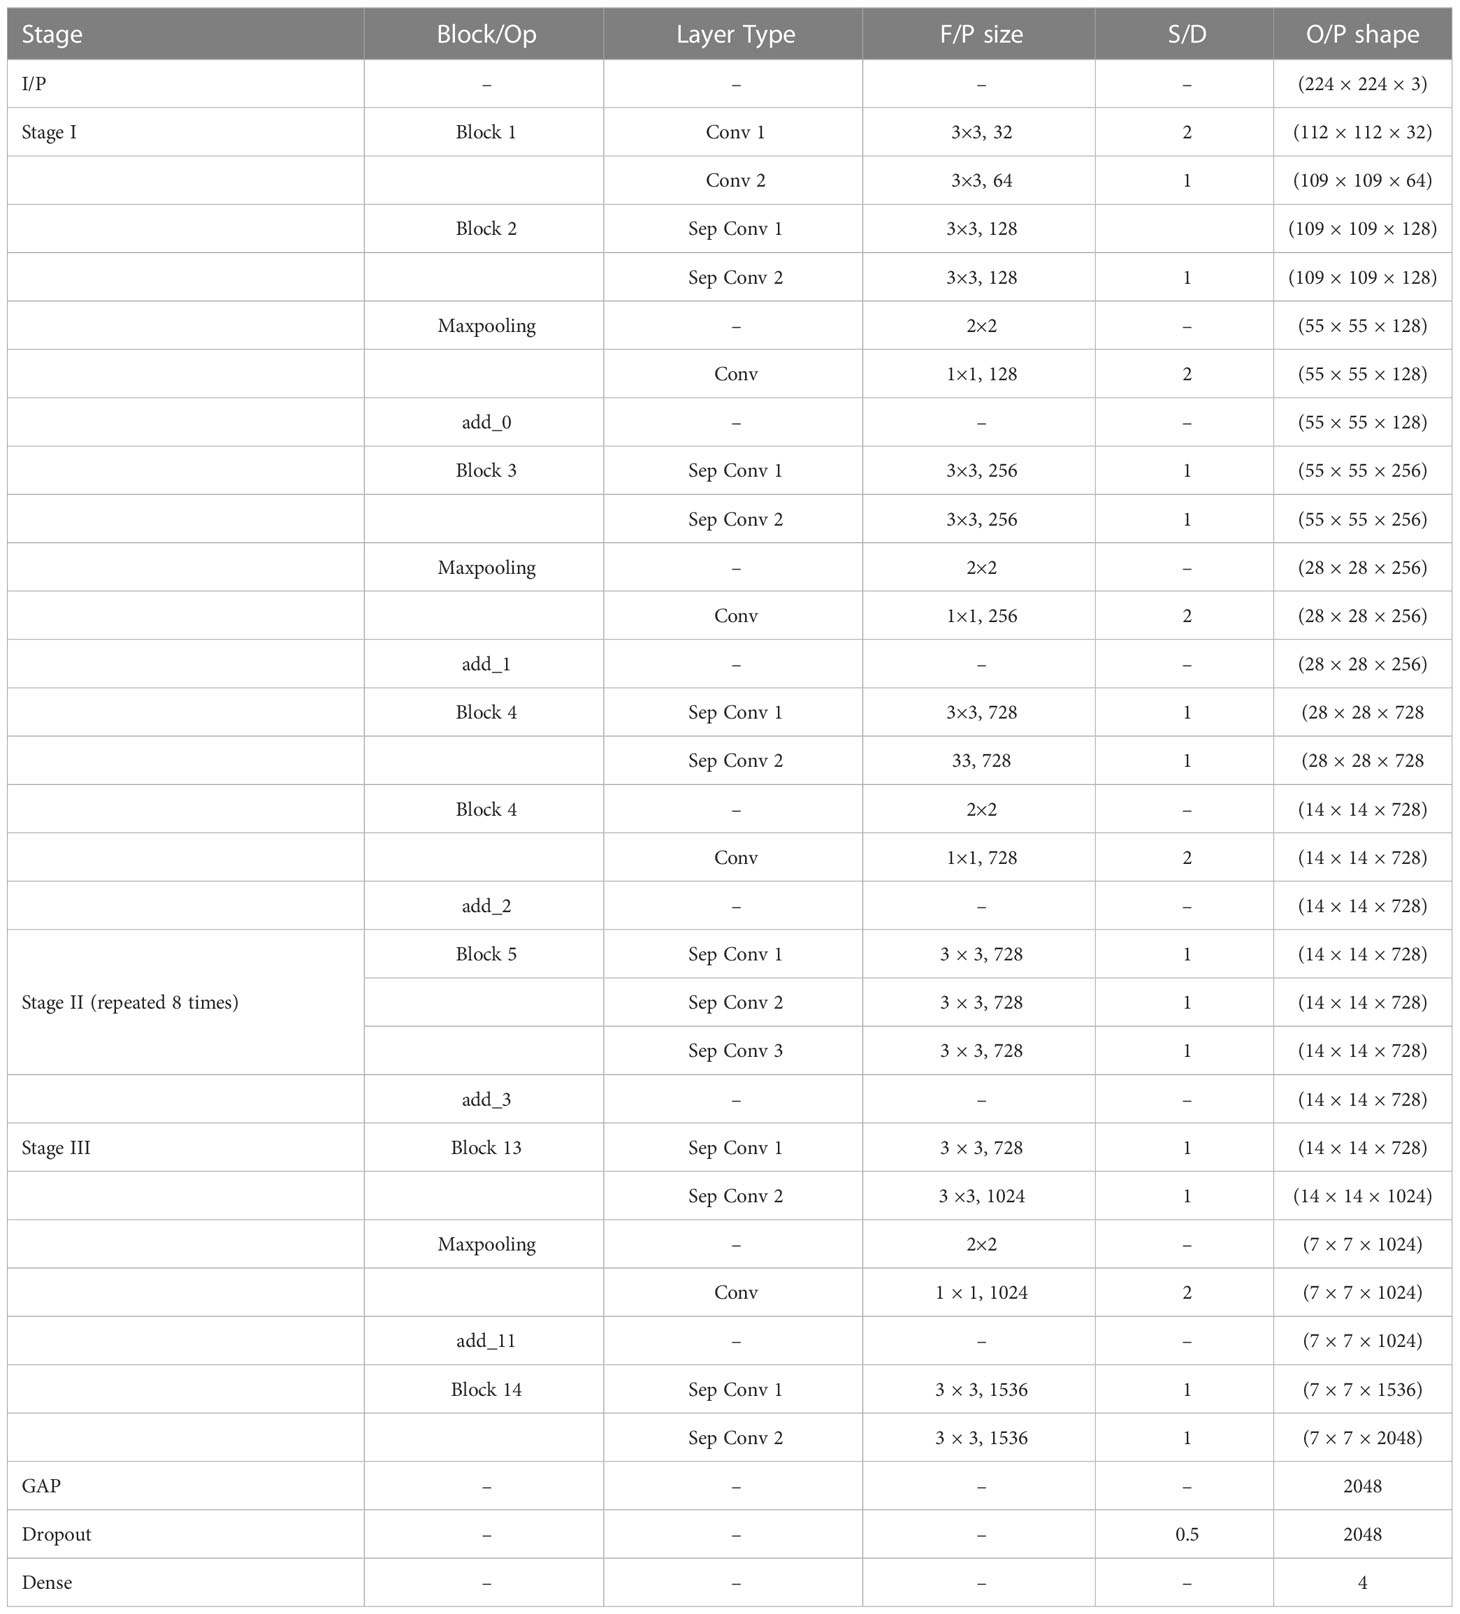
Table 1 Architecture detail of the proposed model.
3.3 Pseudocode
The NCTS and MNoB CT images are fed as input to the proposed model, which yields multi-class classified output. The input image shape is set as for both the cases. The batch size, learning rate (lr) and dense layers are set as 12, 0.00001 and 4, respectively. First, all the input image is appended from the NCTS and MNoB image directory. Subsequently, the labels for each of the case are also appended. Since there are four classes in NCTS and three in MNoB, the labels for NCTS () range from 0 to 3 and range from 0 to 2, respectively. Second, the train test split is maintained in the ratio of 80 to 20%. Third, the Xception model is loaded with “imagenet” weights, and the topmost layers are replaced with GAP, DROP, and four dense layers. Then, fine-tuning is accomplished by defrosting the upper 20 layers while freezing the BN layers. If BN layers are set to trainable, the first epoch after unfreezing will result in a significant accuracy decrease. Later, the modified Xception model is compiled using Adam optimizer, sparse categorical cross-entropy loss function and accuracy metric. This process leads to a multiclassified NCTS and MNoB output. The Algorithm 1 describes the pseudocode of the proposed model.
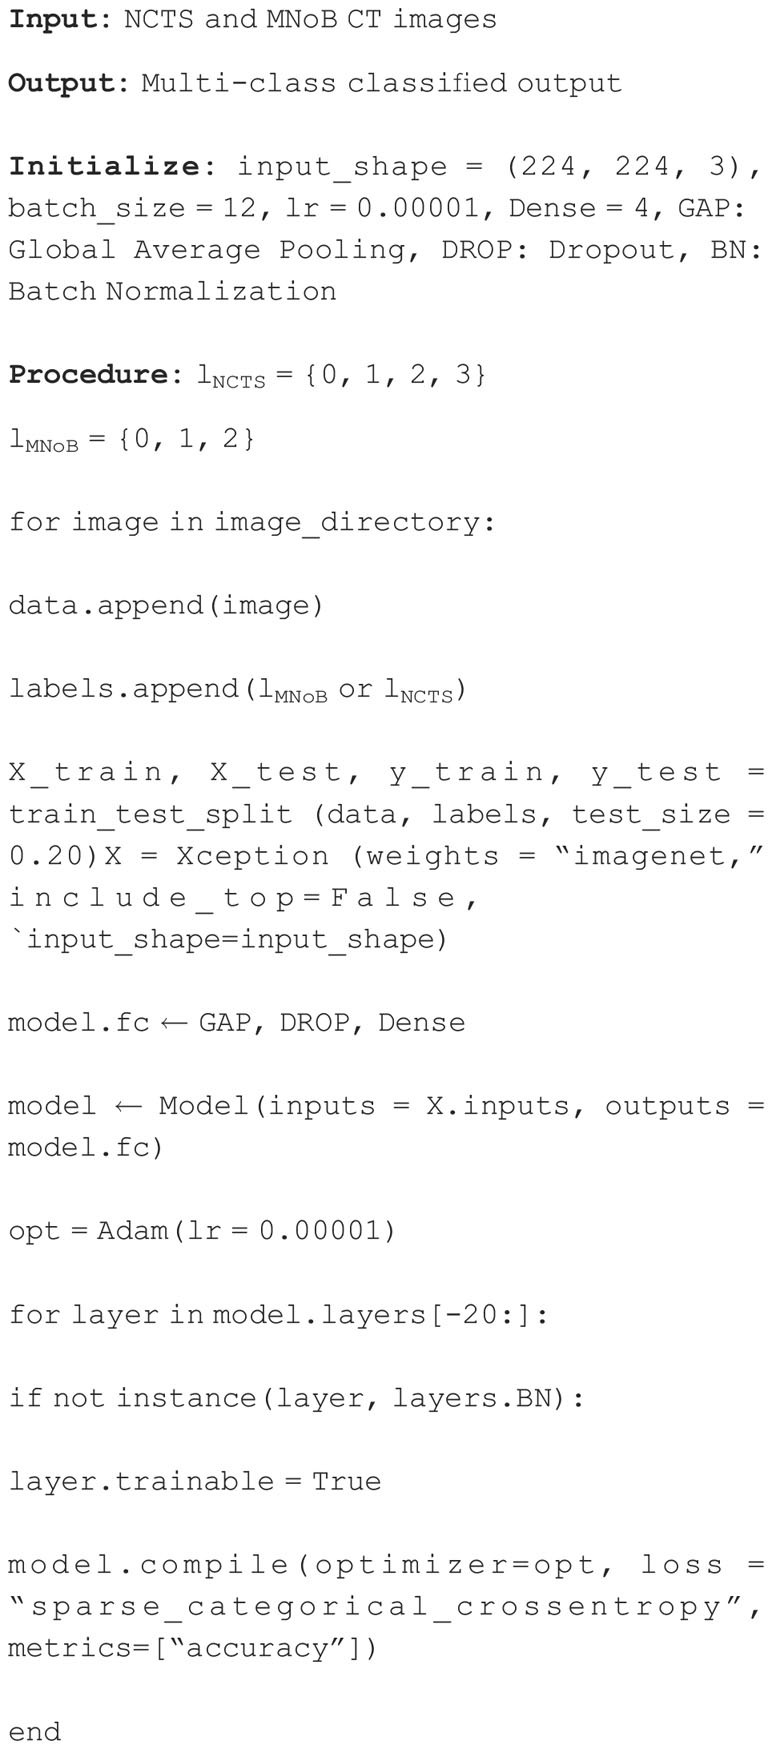
Algorithm 1 Pseudocode of the proposed model..
4 Results
This section comprises three subsections, namely, implementation detail, experimental setup, and experimental results.
4.1 Implementation detail
Google colab pro plus was used for executing the proposed model, whose specifications are listed below. The python, keras and tensorflow version used are 3.8.10, 2.9.0 and 2.9.2, respectively. The GPU “NVIDIA A100-SXM” of 11.6 CUDA version and 83.48 GB RAM are used.
4.2 Experimental setup
The I/P RGB images of shape were divided into 80% training and 20% testing data. An experiment consisting of four networks, namely, Inception ResNet V2, Inception V3, NASNet and the proposed network, was conducted to get the bestNCTS model. The proposed model was trained with a batch size of 12 and an “Adam” optimizer with a learning rate equal to 0.00001 was used. The training was terminated via an early ending callback if the validation loss does not improve after nine epochs. The topmost layers of these networks were replaced with customized layers. Except the proposed model, all other networks were replaced with top layers having 2,048, 1024, and 512 dense layers followed by the ReLU activation function and four dense layers followed by the softmax activation function. Whereas, the proposed modified Xception model was replaced with GAP, DROP of 50% and four dense layers followed by a softmax activation function.
Similarly, an experiment was conducted for MNoB multi-class classification among the proposed model, Inception ResNet V2, Inception V3 and MobileNet V3 Small. The batch size, optimizer, learning rate, early stopping callback criteria and top layers all are kept the same as the NCTS case except three dense layers are used for MNoB classification instead of four.
The performance metrics such as Accuracy (Train, Test, and Validation), Precision, Recall and F1 score were used for evaluating the proposed modified Xception model and other pre-trained networks. Accuracy (Acc) describes closeness between the positively anticipated value and the actual samples, represented by Equation (16). Precision (Pr) is the percentage of correctly anticipated positives. It is given by Equation (17). Recall (Re) determines the fraction of anticipated positives that are accurate, givenby Equation (18). F1-score is the weighted harmonic mean of Re and Pr, represented by Equation (19).
where TruPos, TruNeg, FalPos, and FalNeg represent True Positives, True Negatives, False Positives, and False Negatives, respectively, and Acc represents Accuracy.
4.3 Experimental result
Table 2 shows the Train Acc, Validation Acc, and Test Acc for different models, such as Inception ResNet V2, Inception V3, NASNet Large, and the proposed modified Xception model. Inception ResNet V2 achieved least training, validation and testing accuracy of 40.79, 40.81, and 40.81%, respectively. Whereas, the proposed Xception model attained the maximum Train, Validation and Test Acc of 99.79, 99.92, and 100%, respectively.
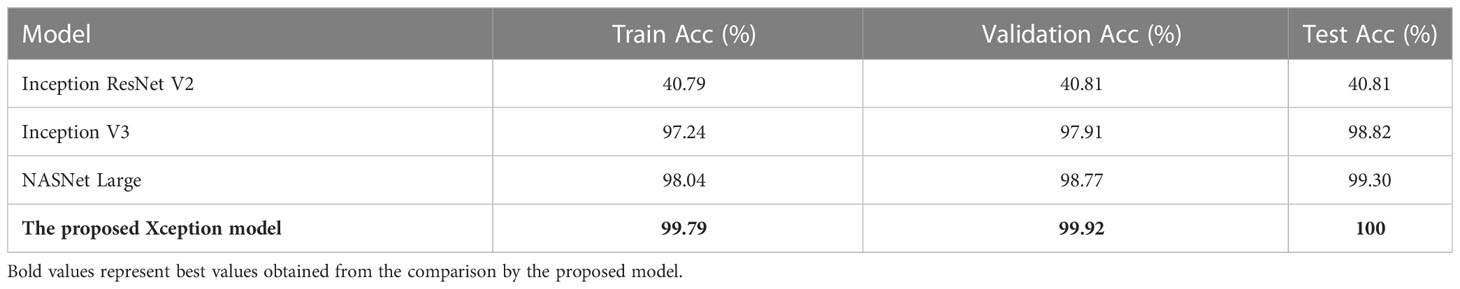
Table 2 Train, Validation, and Test Accuracy for different models of kidney NCTS dataset.
Table 3 shows the performance metrics of different models for NCTS classification. Inception ResNet V2 obtained 0% Pr, Re, and F1-score for normal, tumor, and stone classes whereas, it obtained 41% precision, 100% recall and 58% F1-score for kidney cyst class. Thus, it means that it is inefficient in distinguishing among normal, tumor, and stone classes. On the otherhand, NASNet Large and Inception V3 outperformed the Inception ResNet V2 model. However, the proposed modified Xception model obtained the best results by achieving 100% Pr, Re, and F1-score for each of the NCTS classes.
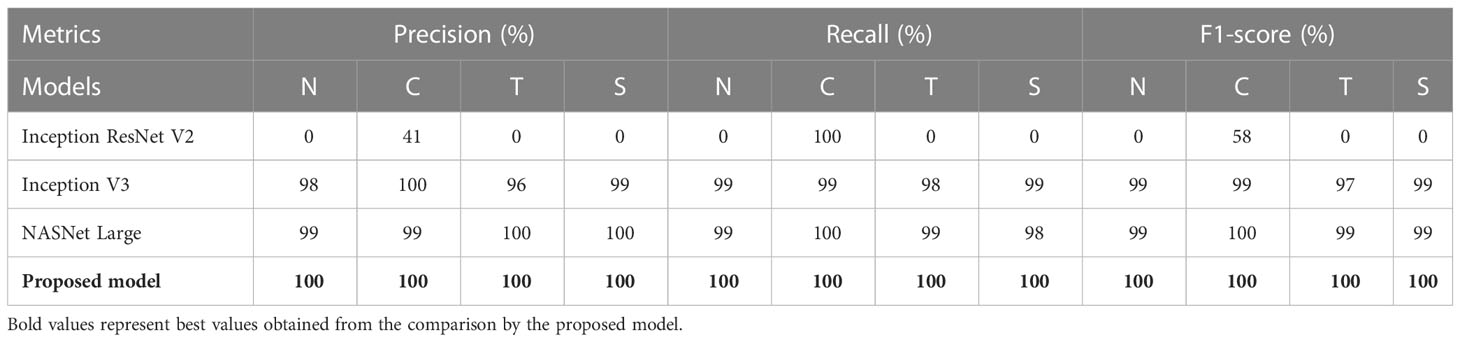
Table 3 Performance metrics of different models for NCTS classification.
Figure 4 depicts the accuracy and loss curves for all the four different models mentioned above. Inception ResNet V2 showed the poorest accuracy and loss curves, showing accuracy of approximately 40%. The Inception V3 and NASNet Large showed training and validation accuracy of less than 100% and training and validation loss above 0%. However, the proposed model achieved the Train and Validation Acc of 100% and loss of 0%. Also, the epochs for the various NCTS models are not constant because an early termination callback was triggered if the validation loss did not decrease after 9 iterations of training.
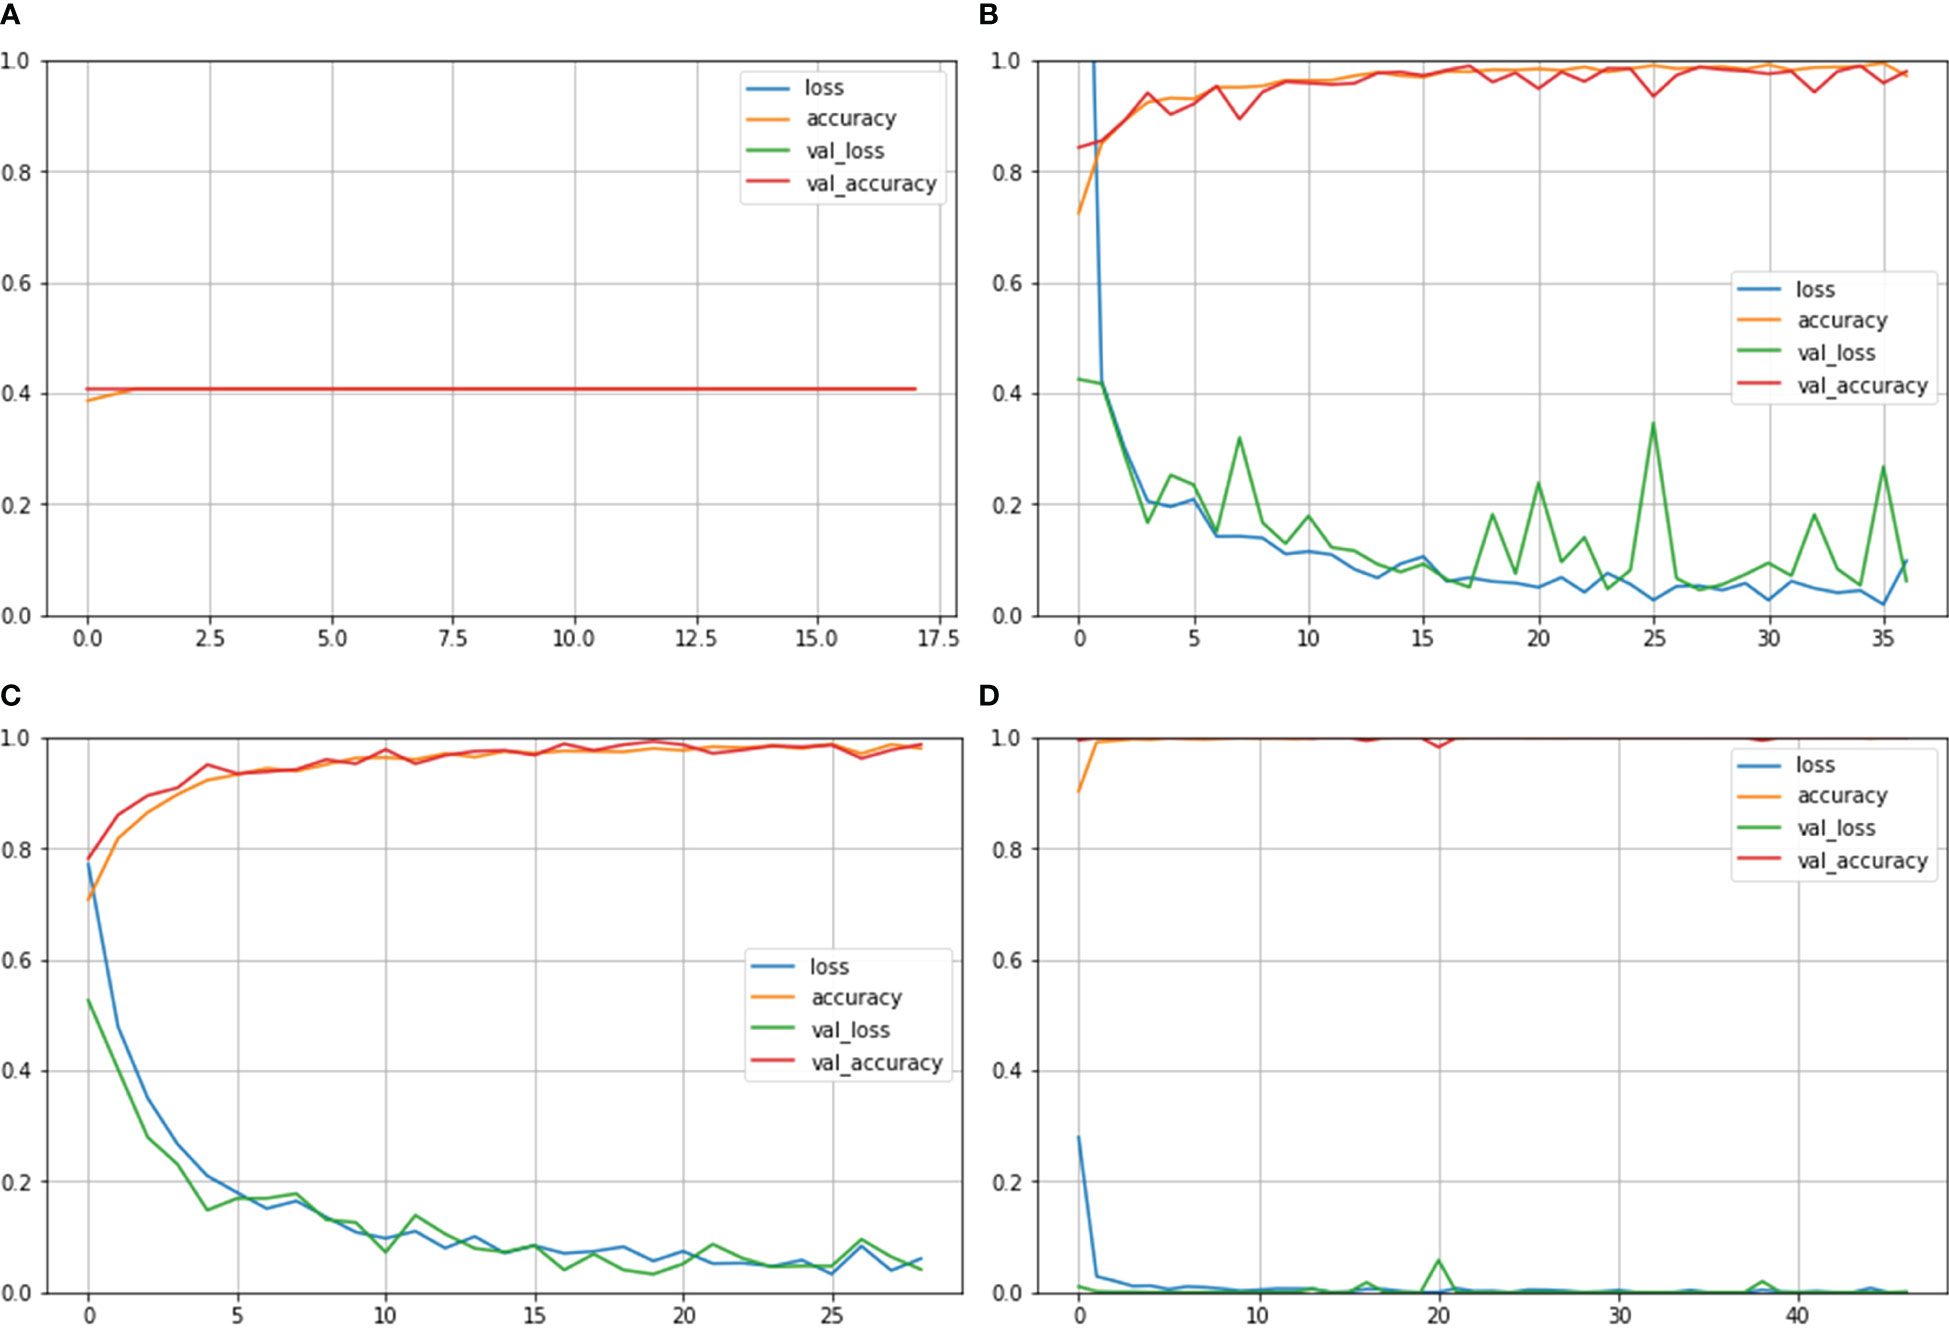
Figure 4 Train Acc, Validation Acc, Training loss, Validation loss curves of NCTS dataset (A) Inception ResNet V2 (B) Inception V3 (C) NASNet Large (D) Proposed model.
Figure 5 depicts confusion matrix for each model. Since the Inception ResNet V2 achieved the poorest results, thus, it is unable to detect any other class except kidney cyst. Moreover, it misclassified other classes and considered them to be part of cyst class, whereas NASNet Large showed less misclassification classes than Inception V3. However, the proposed model showed no misclassification results and perfectly classified NCTS classes. Therefore, the proposed model is superior to the existing models for multi-class classification of NCTS classes.
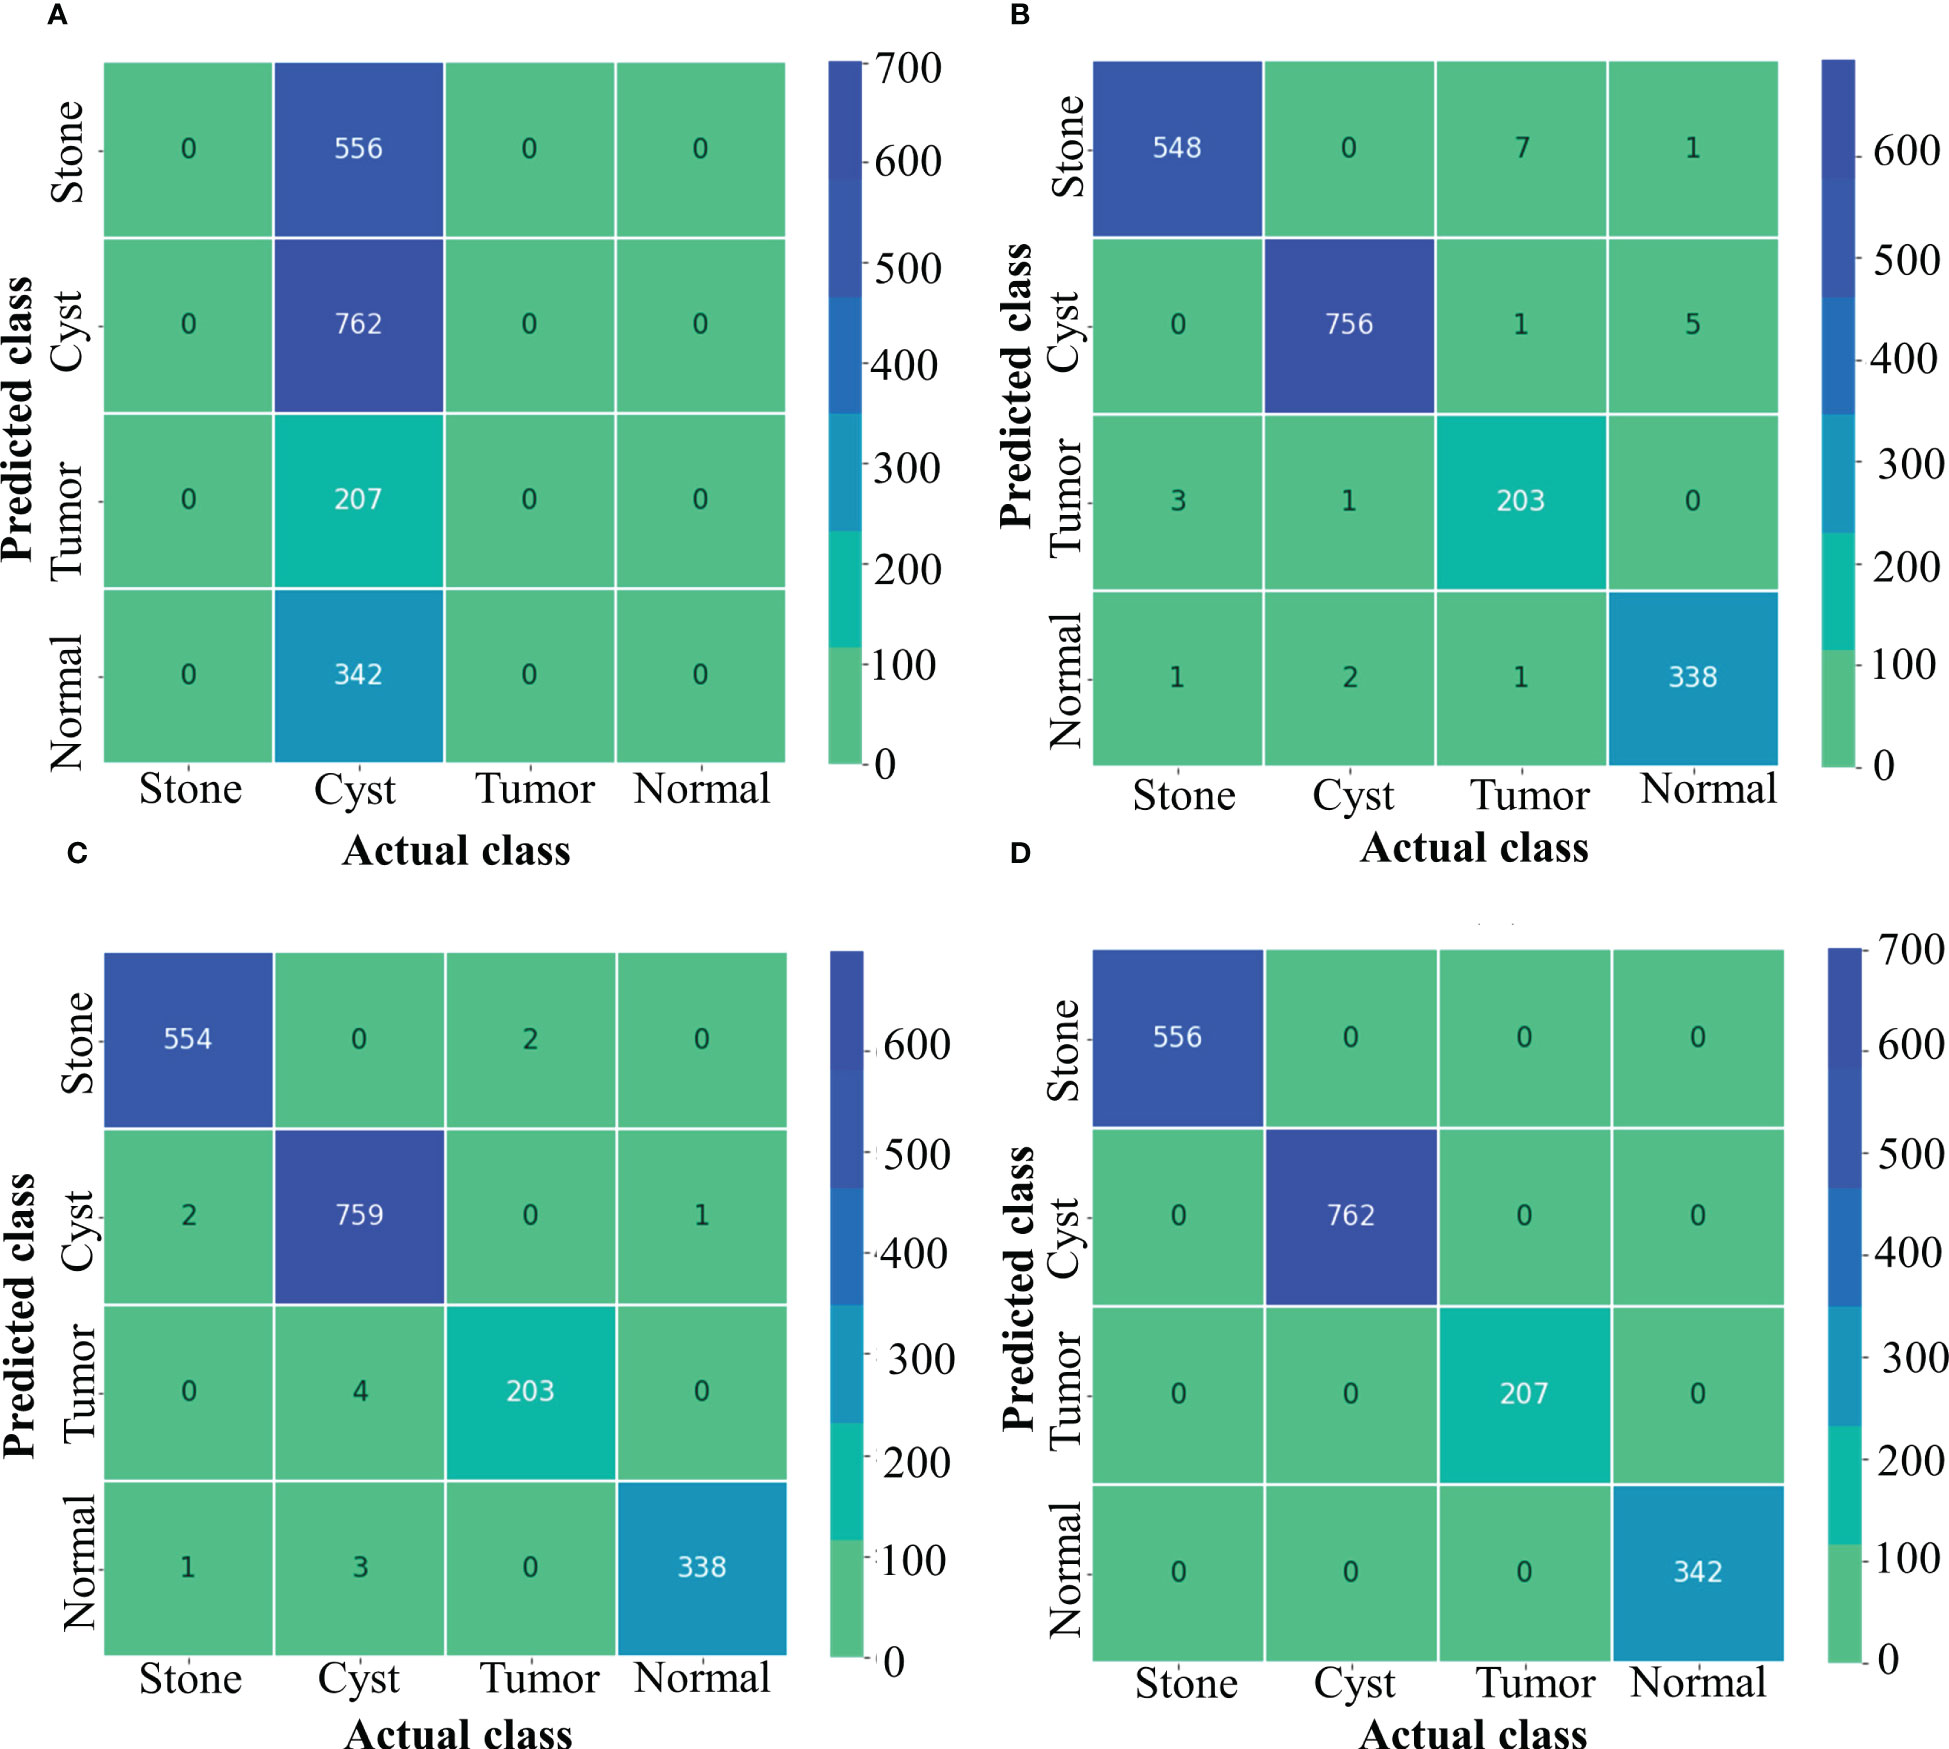
Figure 5 Confusion matrix of NCTS (A) Inception resnetv2 (B) Inception v3 (C) NASNet Large (D) Proposed model.
Table 4 depicts the Train, Validation, and Test Acc of different models such as Inception ResNet V2, Inception V3, MobileNet V3 Small, and the proposed model for MNoB classes. Inception ResNet V2 obtained the least Train, Validation and Test Acc of 51.18, 50.91, and 50.91%, respectively. Although Inception V3 and MobileNet V3 Small achieved almost same training and validation accuracy, their testing accuracies are different. MobileNet achieved approximately 2% lower test accuracy than Inception V3, whereas the proposed modified Xception model obtained the highest Train, Validation, and Test Acc of 100, 99.39, and 99.39%, respectively. Table 5 shows the evaluation metrics such as Pr, Re and F1 score of the above mentioned models for each MNoB class. Inception ResNet V2 obtained 51% Pr, 100% Re and 67% F1-score for normal class. It is unable to detect malignant and benign class, thus, proving it to be inefficient. Inception V3 and MobileNet V3 Small performed better than Inception ResNet V2, whereas the proposed model obtained the highest Pr, Re, and F1-score of 100, 100, 98, 94, 100, 100, 97, 100, and 99%, respectively for each MNoB class.
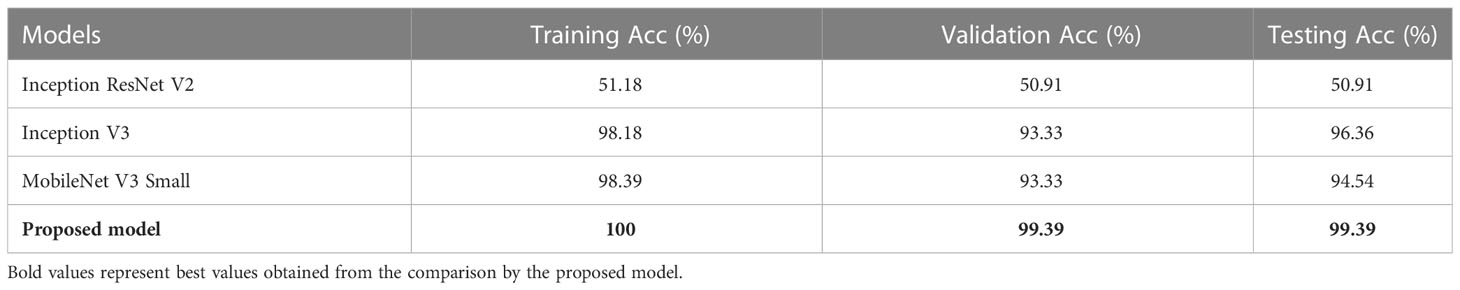
Table 4 Train, Validation and Test Accuracy for different models of lung cancer dataset.

Table 5 Performance metrics of different models for MNoB classification.
Figure 6 shows the Train Acc, Validation Acc, Train loss and Validation loss curves of the different models and the proposed model for MNoB classes. Inception ResNet V2 showed the poorest accuracy and loss curves, showing accuracy of approximately 50% and sparse categorical cross entropy loss of 0.9543. Inception V3 and MobileNet V3 fits the training data too closely but unable to generalize well on testing data, thus showing the sign of overfitting. However, the proposed Xception model obtained the highest Train Acc of 100% and sparse categorical cross entropy loss of 0.0015. Thus, the training loss curves obtained by NCTS model is better than the MNoB because of the reduced gap between the training and validation curves and, hence, it validates that there are no overfitting cases.
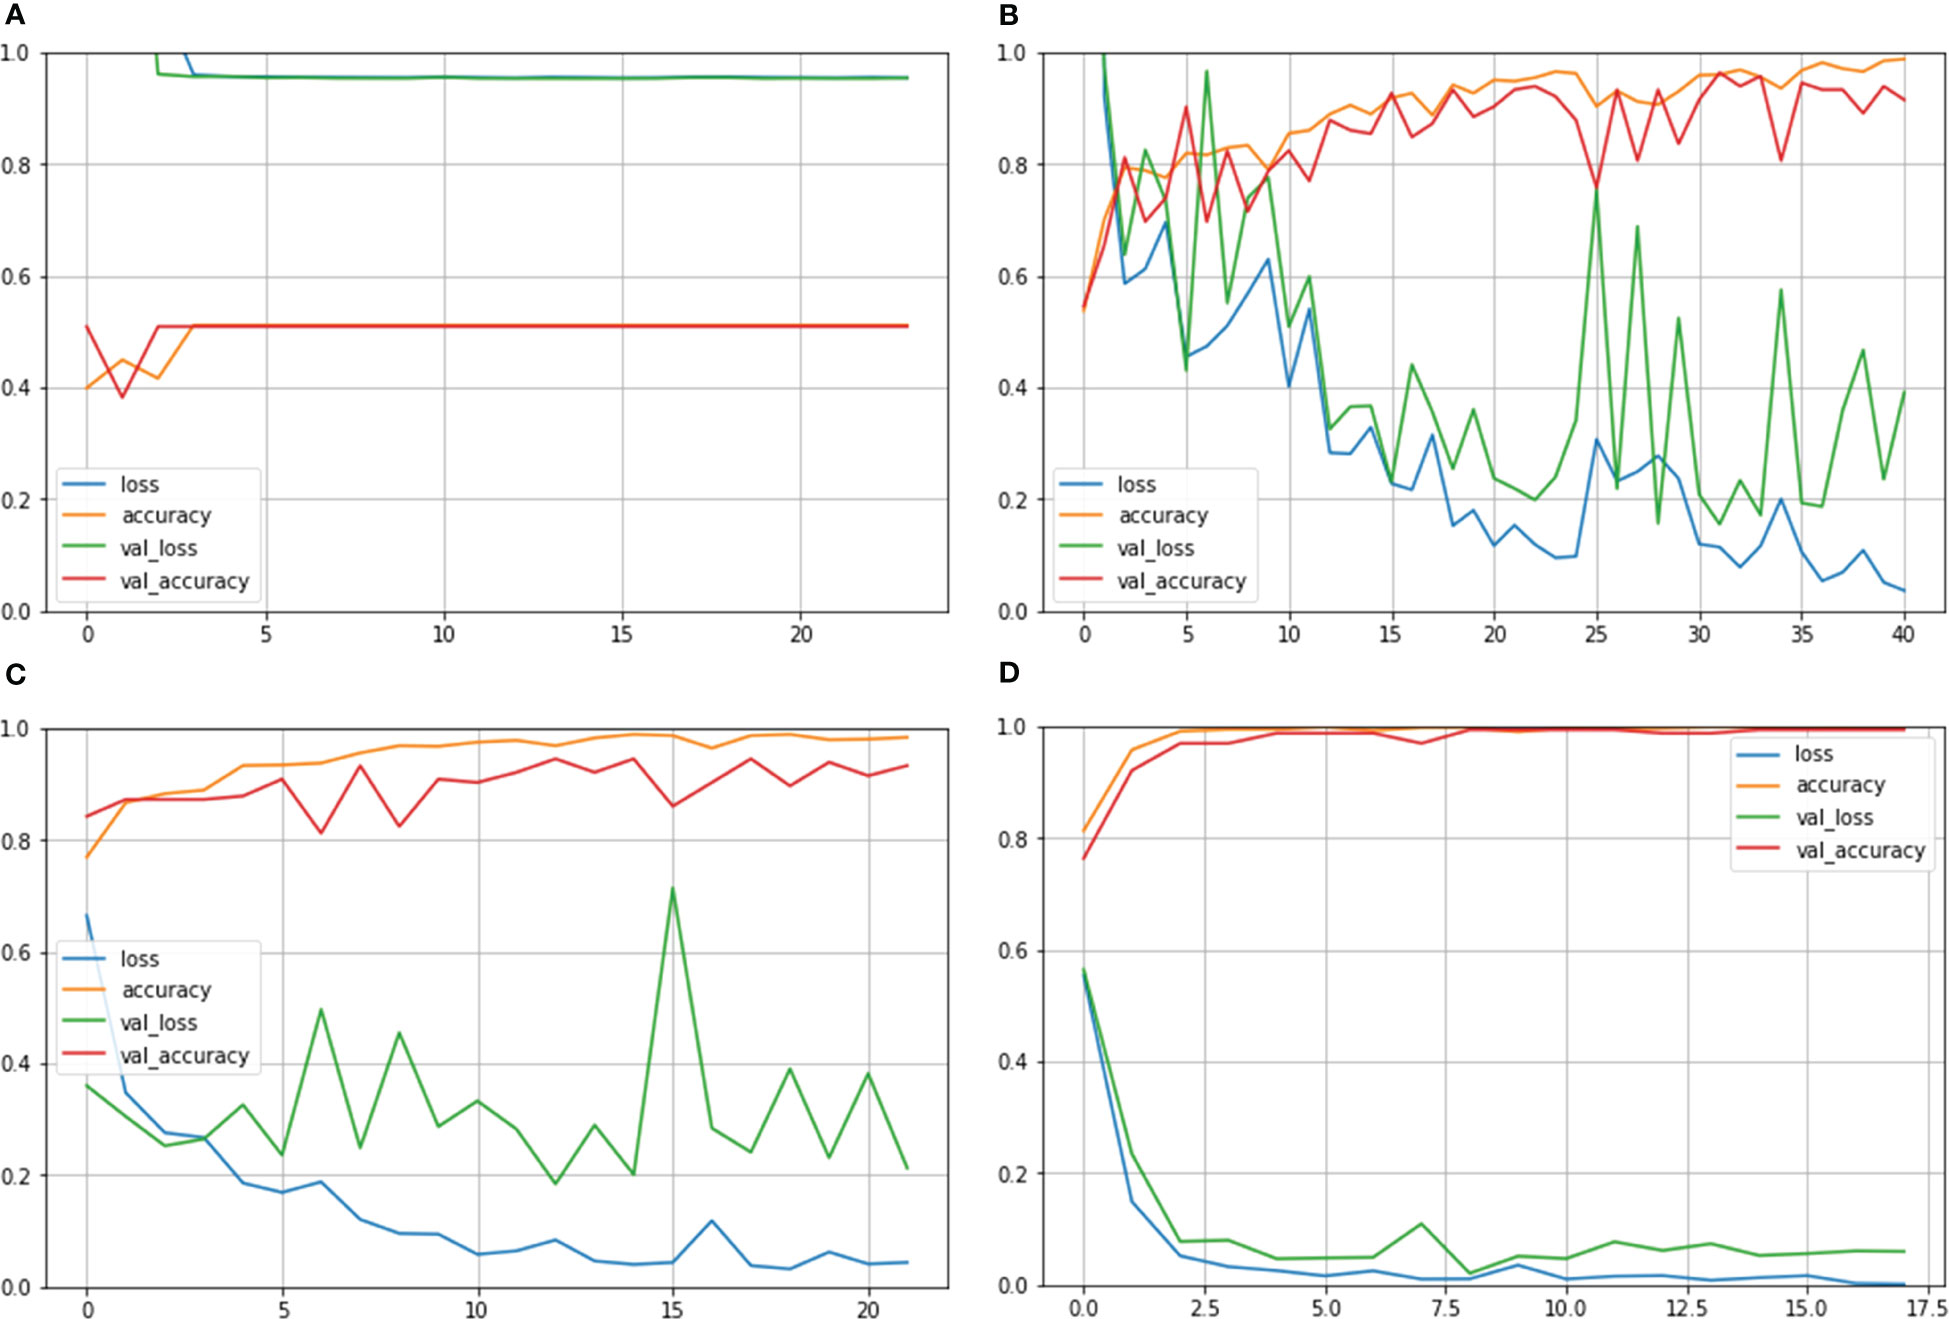
Figure 6 Train Acc, Validation Acc, Train loss, Validation loss curves of lung cancer MNoB dataset (A) Inception ResNet V2 (B) Inception V3 (C) MobileNet V3 Small (D) Proposed model.
Figure 7 depicts the confusion matrix for each of the MNoB models. Since the Inception ResNet V2 achieved the poorest results, thus, it is unable to detect any other class except normal. Moreover, it misclassified other classes and considered them to be part of normal class. Whereas Inception V3 showed less misclassification classes than MobileNet V3 small. However, the proposed model showed only one misclassification result by considering malignant class to be benign. Otherwise, it perfectly classified MNoB classes. Therefore, the proposed model is superior to existing models for multi-class classification of MNoB classes.
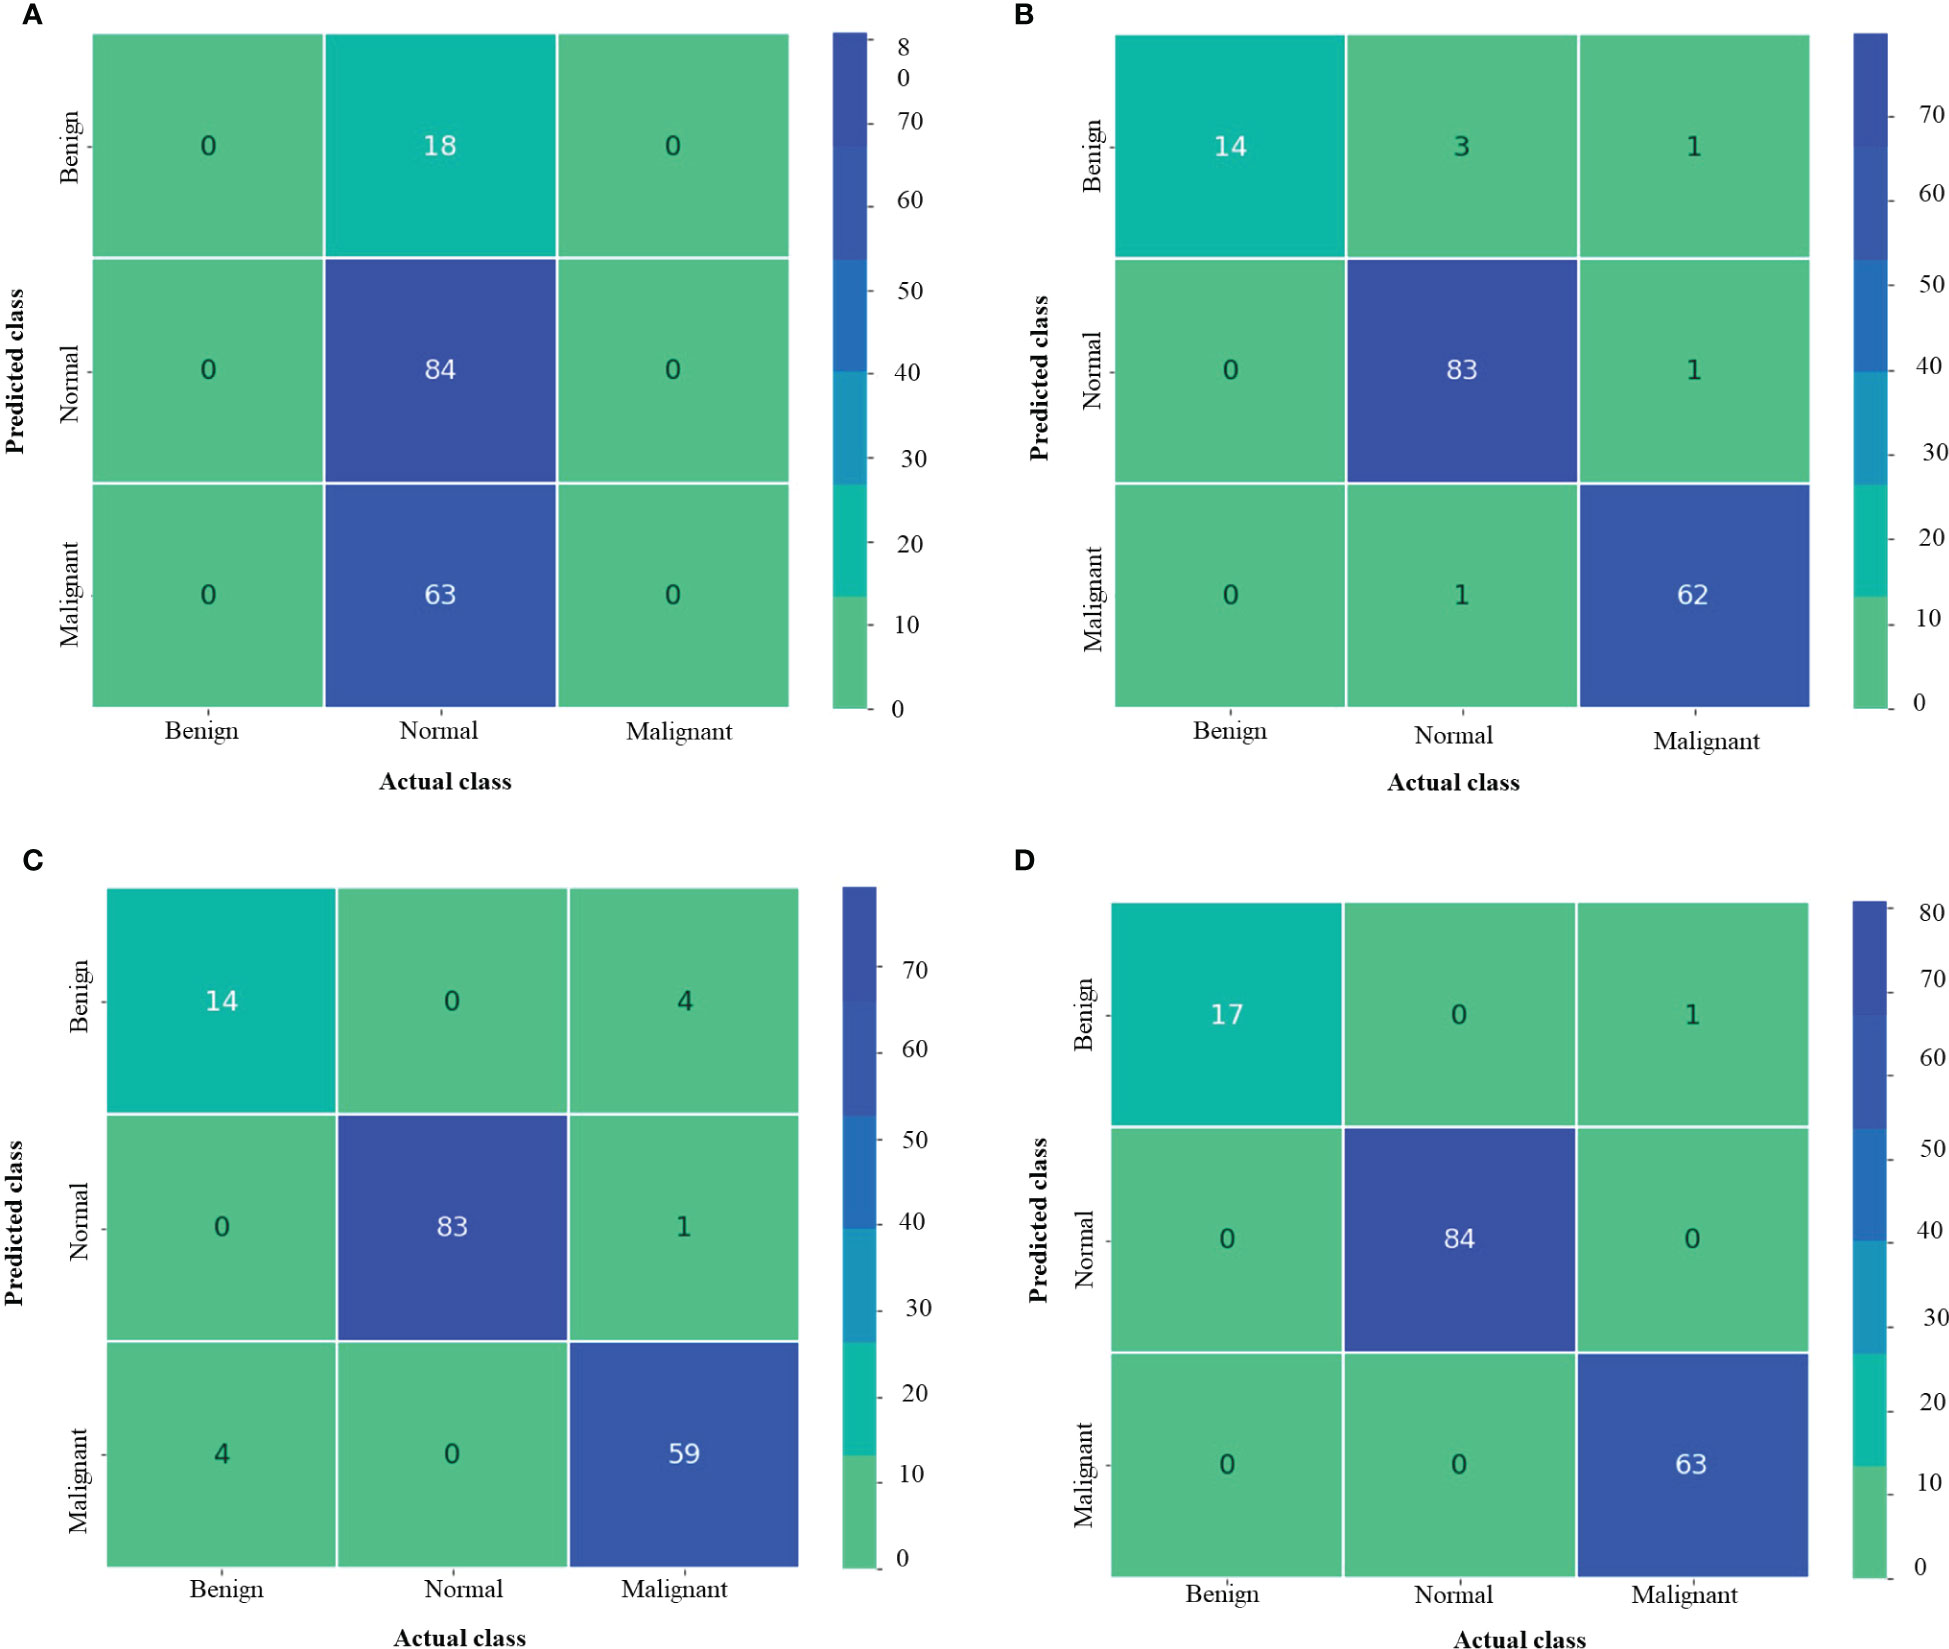
Figure 7 Confusion matrix of MNoB (A) Inception resnetv2 (B) Inception v3 (C) MobileNet V3 Small (D) Proposed model.
5 Discussion
A highly effectual renal and lung cancer disease multi-class classifier aid in its early detection and reduces the chances of kidney failure and mortality rate of the affected patients, respectively. However, detecting renal ailments at the precise location in the CT images is challenging due to scarcity of nephrologists availability worldwide, especially in low-income countries Osman et al. (61). Also, manually detecting lung cancer from the CT images is laborious and error prone. Over the years, researchers have conducted substantial study on automatic renal and lung cancer disease classification, but mostly on binary classes. The present study overcomes this research gap by focusing on multi-class classification of several kidney ailments and lung cancer, respectively. The robustness test of the proposed model is conducted by comparing the proposed model with the original Xception model in terms of evaluation metrics and the state-of-the-art techniques.
The following are the key findings of the proposed model:
1. The modified Xception model outperforms the original Xception model in terms of computational time and evaluation metrics such as Average (Avg) Pr, Avg Re, Avg F1 score and test accuracy. The average is found out by taking the mean of all the four NCTS classes.
2. The proposed architecture surpasses the other pre-trained networks, namely, Inception ResNet V2, NASNet Large and Inception V3 in case of NCTS classification. Similarly, it outperforms the Inception ResNet V2, Inception V3 and MobileNet V3 Small in case of MNoB classification.
3. Invoking fine-tuning into the transfer learning based Xception architecture promotes faster training and reduced computational complexity.
4. The proposed model not only performed well on larger NCTS dataset containing approx. 12,000 CT images, but it performed good even in the case of smaller MNoB dataset containing approximately 1,200 images. Thus, the proposed model is a robust model.
5. The proposed model provides edge over performance to the state-of-the-art techniques.
5.1 Comparison of computational time between the proposed model and the original Xception model
Figure 8 compares the proposed improved Xception model’s computing time to that of the original Xception model in minutes. It is observed that the original Xception network took 14 min to train itself. Whereas, the proposed model took 12 min to train itself. Hence, fine tuning helped the proposed model in faster training and hence, reduced its computational complexity.
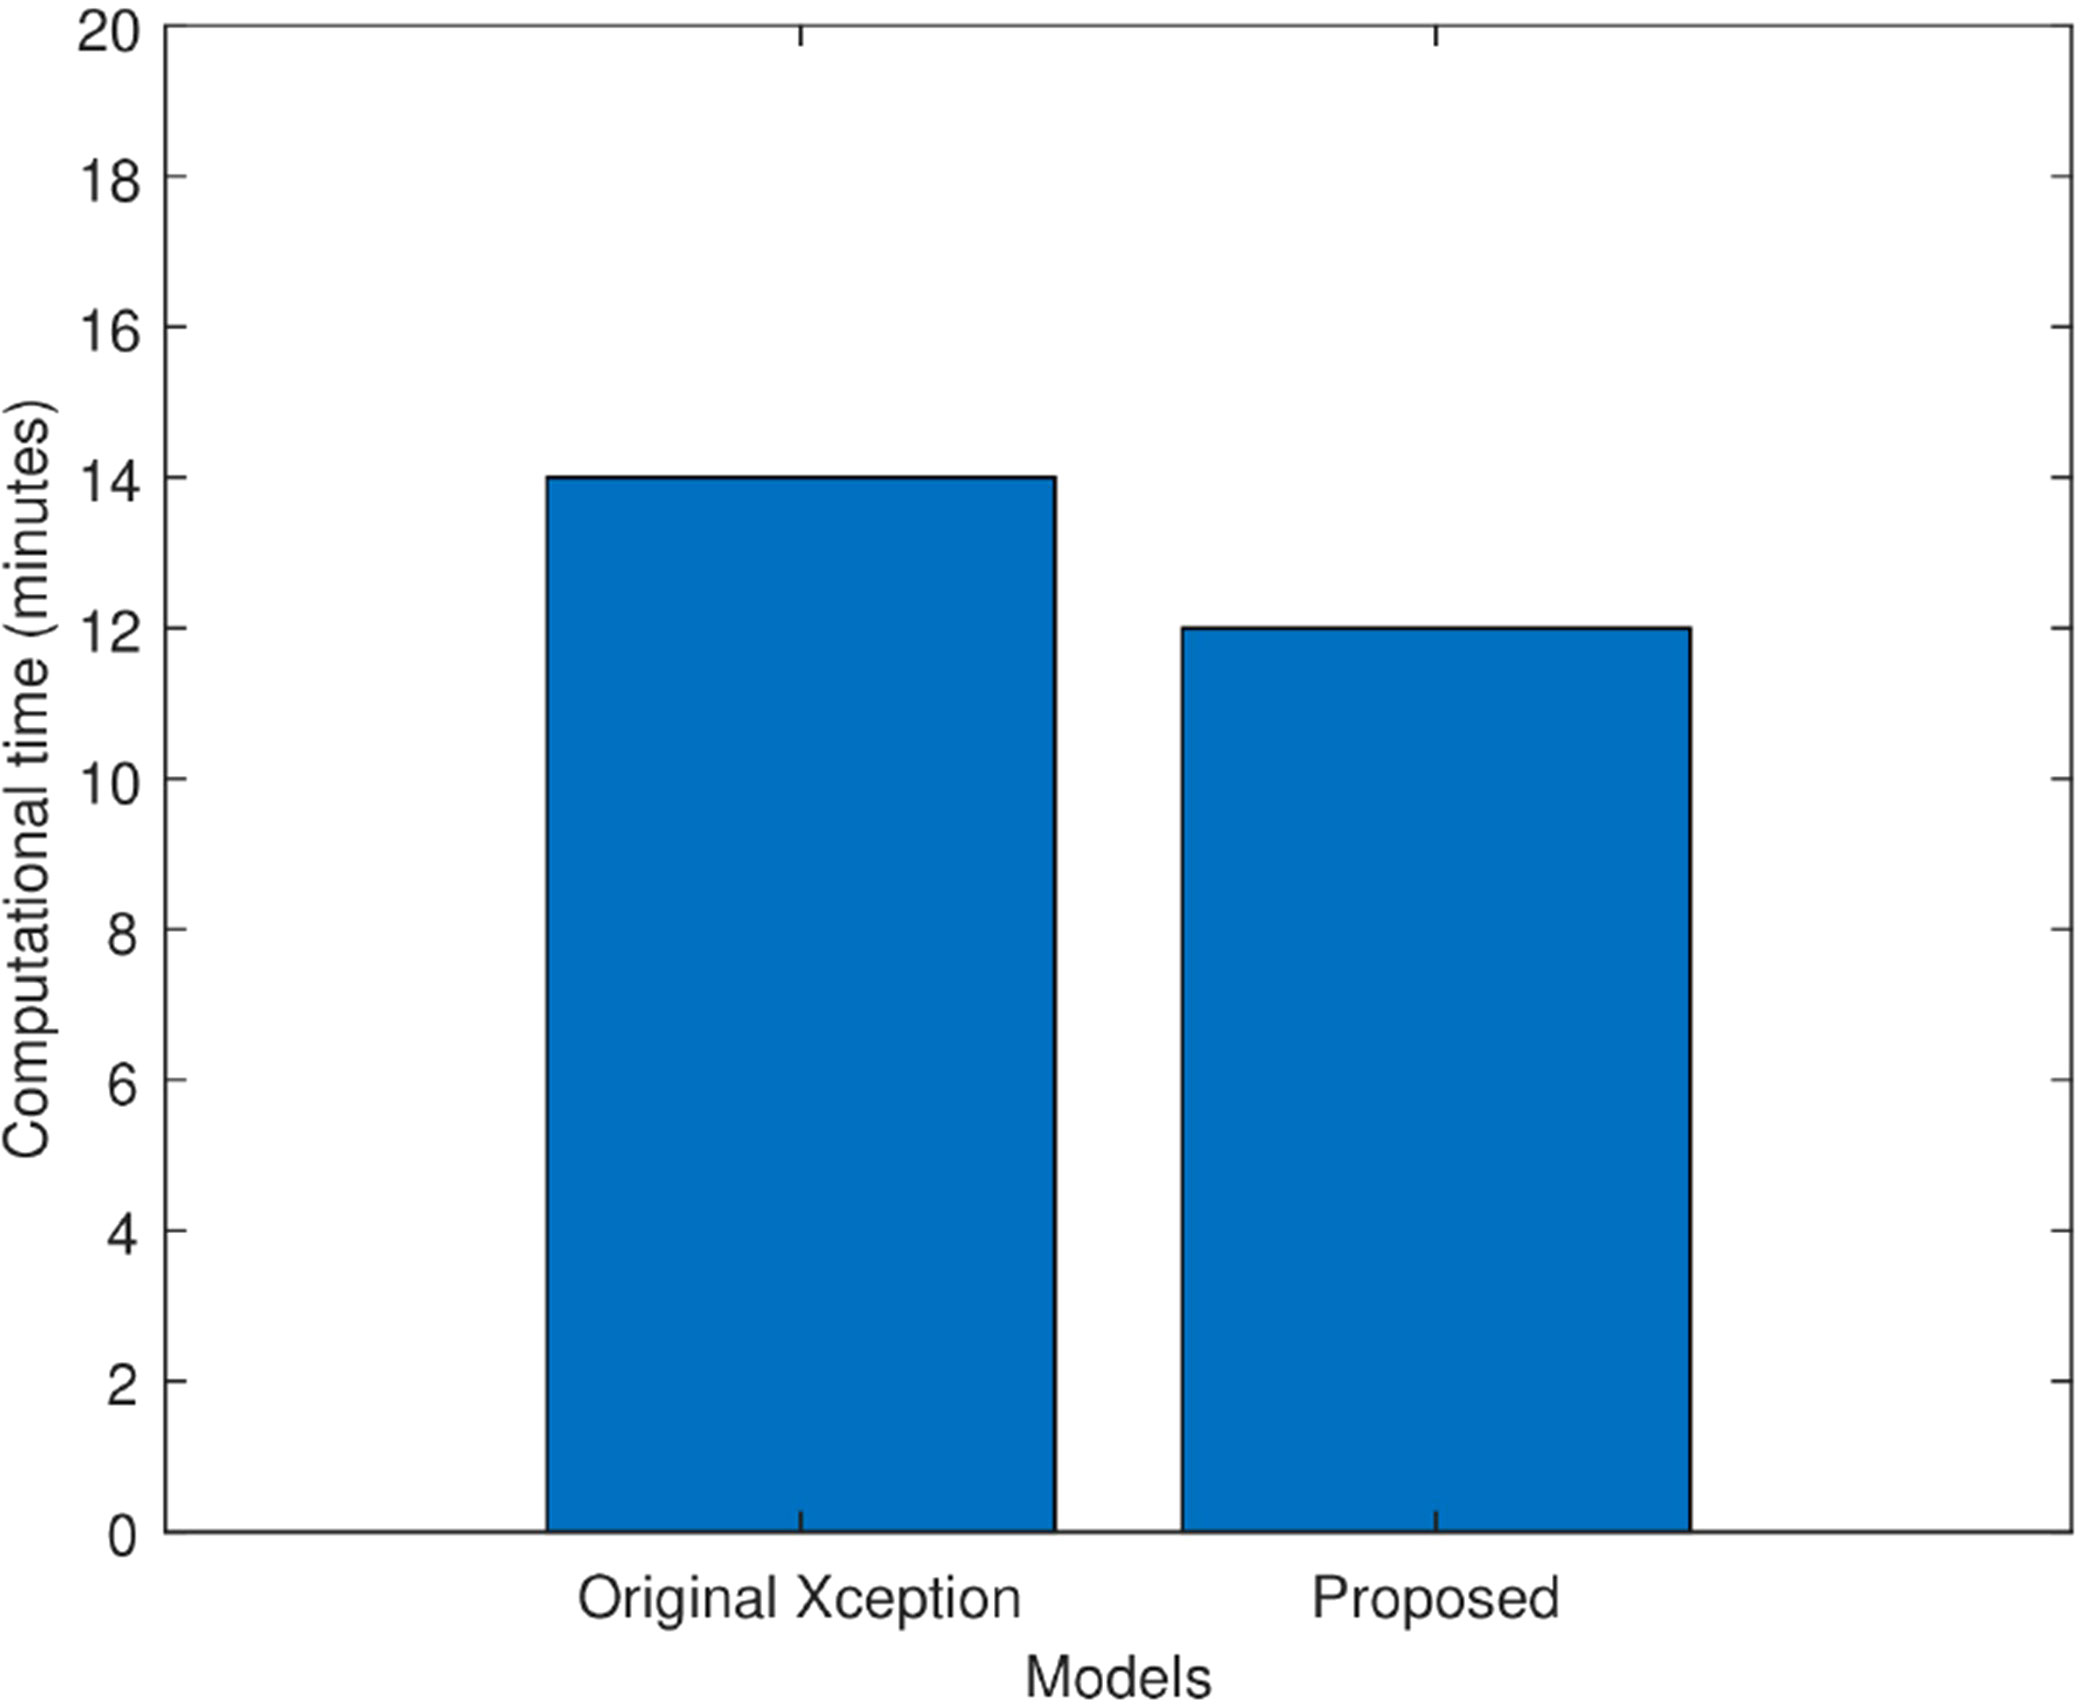
Figure 8 Computational time comparison of the original Xception model and the proposed Xception model in minutes.
5.2 Comparison of the proposed model with the original Xception model
Table 6 compares the proposed modified Xception model with the original Xception model in terms of performance metrics for both NCTS and MNoB cases. In NCTS case, the original model obtained 94.75% Average (Avg) precision, 97.5% Avg recall, 95.75% Avg F1 score and 97.07% test accuracy. On the other hand, the proposed model attained 100% of each of the performance metrics value. In MNoB case, the original Xception model obtained 58.33% Avg Pr, 65.33% Avg Re, 61.33% Avg F1 score and 87.27% Test Acc, whereas the proposed model obtained 99.33% Avg Pr, 98% Avg Re, 98.67% Avg F1 score and 99.39% Test Acc. Thus, it can be inferred that the original Xception model performed poorer for MNoB case compared with NCTS case, whereas, the proposed model performed equally good on both NCTS and MNoB cases. Hence, the proposed Xception model is appropriate for renal disease classification.
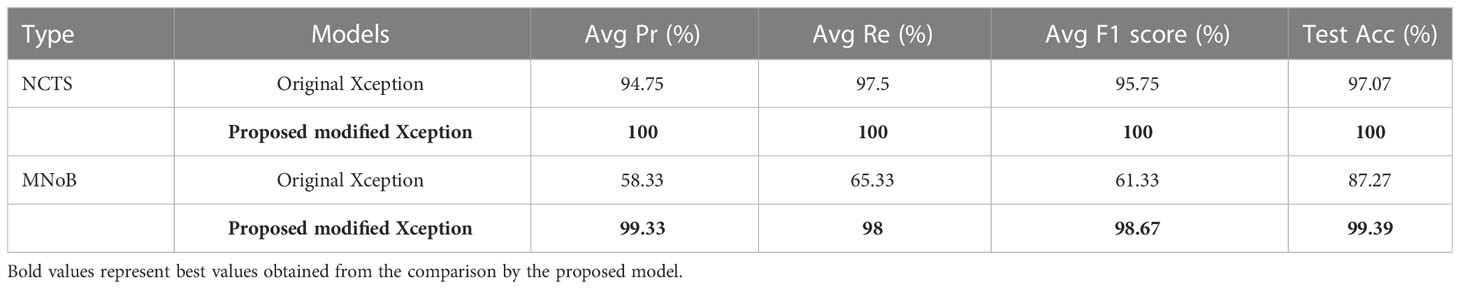
Table 6 Comparison of the proposed modified Xception model with the original Xception model.
5.3 Comparison of the proposed NCTS model with MNoB in terms of ROC curve
Figure 9 compares the ROC curve of both NCTS and MNoB models. Each class of NCTS and MNoB models obtained 100% AUC values. Thus, it is evident that both NCTS and MNoB models performed equally good in terms of ROC curve.
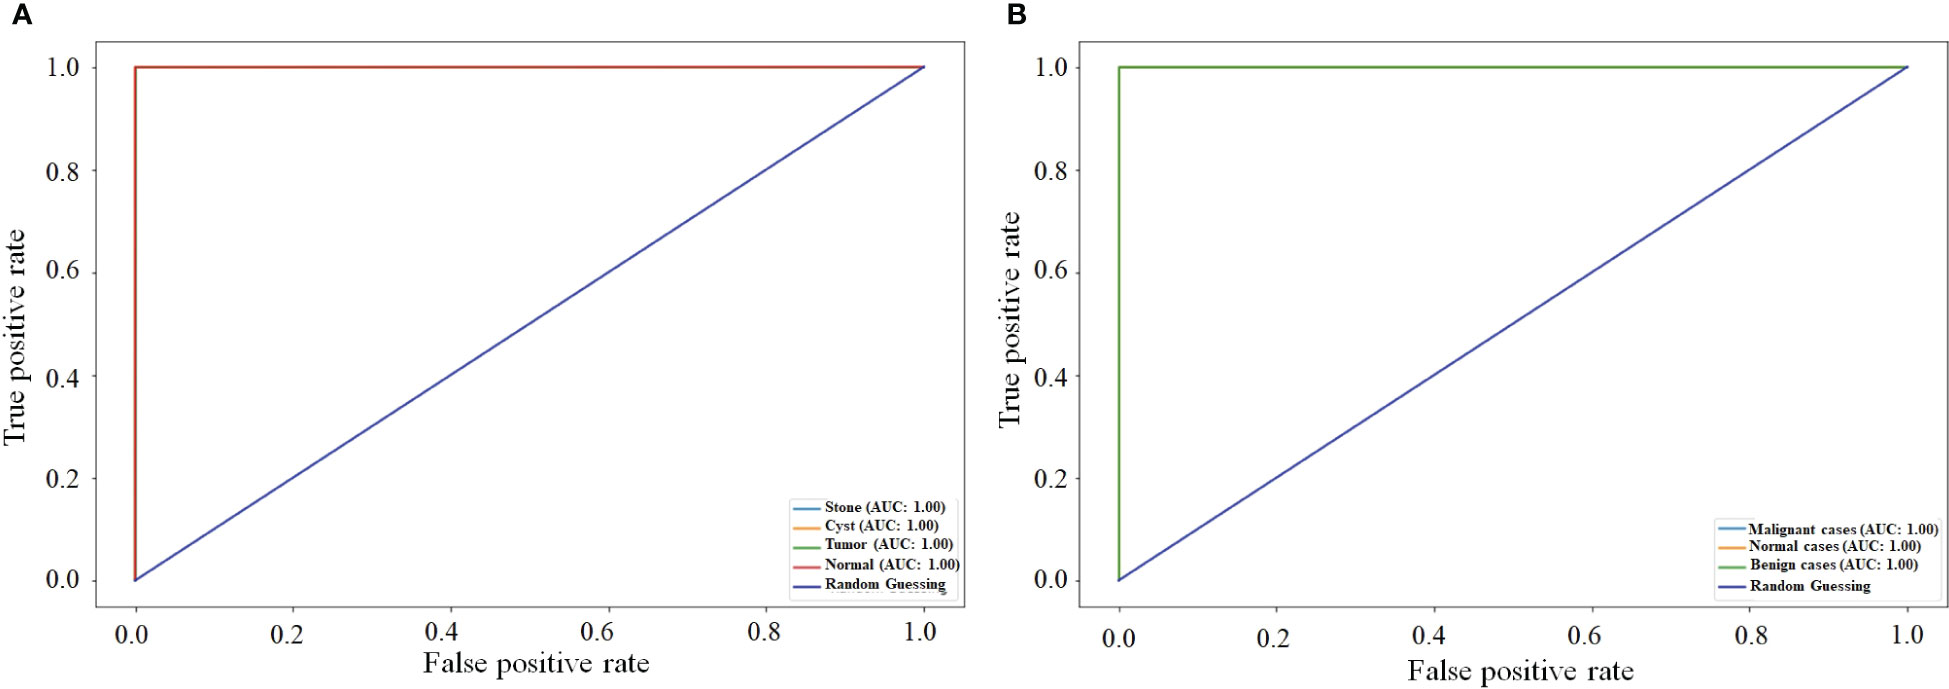
Figure 9 ROC curves (A) NCTS (B) MNoB.
5.4 Comparison of the proposed model with the state-of-the-art techniques
The proposed NCTS model is compared with External Attention Transformer (EANET) Islam et al. (56), Compact Convolutional Transformer (CCT) Islam et al. (56), Swin Transformer Islam et al. (56), VGG 16 Islam et al. (56), Inception V3 Islam et al. (56), ResNet 50 Islam et al. (56), DenseNet 201 Qadir and Abd (55), Ensemble DNN Sudharson and Kokil (52), VGG 19 Asif et al. (53) and CNN Narmada et al. (54), as shown in Table 7. The proposed model surpassed all the state-of-the-art techniques by achieving the highest Acc, Avg Pr, Avg Re and Avg F1-score of 100% each. Hence, the proposed model is felicitous for automatic CKD diagnosis.
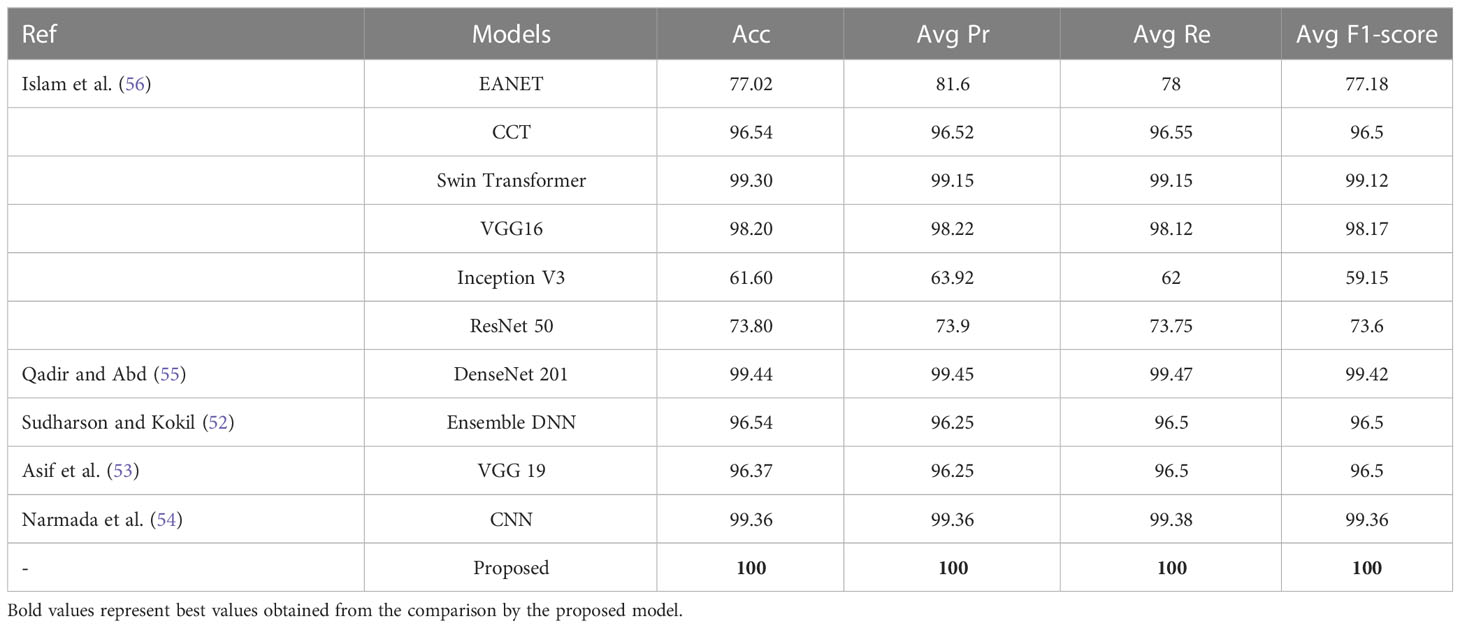
Table 7 The proposed NCTS model comparison with the state-of-the-art techniques.
Table 8 shows the comparison among the proposed MNoB model and the state-of-the-art models such as Advanced CNN Reddy et al. (37), Advanced CNN + Synthetic Minority Oversampling Technique SMOTE) Reddy et al. (37), Xception Reddy et al. (37) and ResNet 50 Reddy et al. (37), SVM Kareem et al. (38), DenseNet 121 Bhattacharjee et al. (39) and NASNet Large Bhattacharjee et al. (39). ResNet 50 Reddy et al. (37) performed the poorest followed by Xception Reddy et al. (37). However, the proposed modified MNoB Xception model outperformed all the state-of-the-art techniques by achieving the highest Acc, Avg Pr, Avg Re, and Avg F1-score of 99.39, 99.33, 98, and 98.67%, respectively.

Table 8 The proposed MNoB model comparison with the state-of-the-art techniques.
5.5 Limitation of the proposed model
Despite encouraging results, the proposed MNoB model could not outperform the NCTS model due to the lack of training data. This issue can be solved by implementing data augmentation techniques to expand the training data. Moreover, since the proposed MNoB and NCTS models are two-dimensional, it cannot extract context from adjacent slices. This problem can be solved by introducing a 3D classification model that can take advantage of inter-slice context and, hence, enhance model’s performance.
6 Conclusions
In this article, we have proposed a fine tuned and pre-trained transfer learning based modified Xception model for automatic lung cancer and CKD diagnosis. The proposed model can distinguish among benign, normal and malignant lung CT images. Also, it can classify normal, tumor, cyst, and stone multi-classes renal CT images effectively. The proposed methodology composes of mainly four parts, namely, pre-processing, feature extraction, fine tuning, and customized top layers. Pre-processing is performed by resizing the input image from to for reduced complexity. Feature is extracted using pre-trained “imagenet” weights through Xception based transfer learning technique. The top 20 layers are unfreezed, keeping BN layers frozen to fine-tune the transfer learning based network so that an improved model is obtained. Last, the top most layers are customized using GAP, DROP, DENSE, and softmax layers for improving the potential and generalizibility of the model. The proposed modified Xception MNoB and NCTS model outperformed the existing Xception model and the state-of-the-art techniques. The NCTS model achieved 100% Acc, Pr, Re and F1-score. Whereas, the MNoB model obtained 99.39% Acc, 99.33% Avg Pr, 98% Avg Re, and 98.67% average F1 score. Hence, the proposed model is felicitous for early lung cancer and CKD prediction. It can ensure efficient management of lung cancer and CKD patients by aiding radiologists and nephrologists in diagnosing lung cancer and kidney abnormalities from CT images, respectively. The future scope of this study is that more advanced algorithms such as Squeeze and Excitation, Transformer Block and Dense Block can be incorporated for improved performance. An ensemble of squeeze and excitation, dense block and vision transformer can be implemented for enhanced performance. Also, the training data scarcity in case of MNoB can be addressed through data augmentation techniques or by using generative adversarial network. Moreover, 3D model can be leveraged in future to take into account the inter-slice context.
Data availability statement
The original contributions presented in the study are included in the article/supplementary material. Further inquiries can be directed to the corresponding authors.
Author contributions
Conceptualization, AnB, AbB. Methodology, AnB, RM, AbB. Validation, AnB, SR, AbB. Formal analysis, RM, EE, HS. Writing—original draft preparation, AnB, RM, AbB. Writing—review and editing, AnB, AbB, RS, MSB, GS. Supervision, RM. All authors contributed to the article and approved the submitted version.
Funding
The authors extend their appreciation to the Deanship of Scientific Research, King Saud University for funding through the Vice Deanship of Scientific Research Chairs, Kayyali Chair for Pharmaceutical Industry, Department of Pharmaceutics, College of Pharmacy, for funding the publication of work through Grant Number MS-1-2023.
Acknowledgments
Authors would like to express their gratitude to AlMaarefa University, Riyadh, Saudi Arabia, for supporting this work.
Conflict of interest
The authors declare that the research was conducted in the absence of any commercial or financial relationships that could be construed as a potential conflict of interest.
Publisher’s note
All claims expressed in this article are solely those of the authors and do not necessarily represent those of their affiliated organizations, or those of the publisher, the editors and the reviewers. Any product that may be evaluated in this article, or claim that may be made by its manufacturer, is not guaranteed or endorsed by the publisher.
References
1. Siegel RL, Miller KD, Wagle NS, Jemal A. Cancer statistic. CA: Cancer J Clin (2023) 73:17–48. doi: 10.3322/caac.21763
2. Heuvelmans MA, van Ooijen PM, Ather S, Silva CF, Han D, Heussel CP, et al. Lung cancer prediction by deep learning to identify benign lung nodules. Lung Cancer (2021) 154:1–4. doi: 10.1016/j.lungcan.2021.01.027
3. Takamori S, Ishikawa S, Suzuki J, Oizumi H, Uchida T, Ueda S, et al. Differential diagnosis of lung cancer and benign lung lesion using salivary metabolites: a preliminary study. Thorac Cancer (2022) 13:460–5. doi: 10.1111/1759-7714.14282
4. Gu Y, Chi J, Liu J, Yang L, Zhang B, Yu D, et al. A survey of computer-aided diagnosis of lung nodules from ct scans using deep learning. Comput Biol Med (2021) 137:104806. doi: 10.1016/j.compbiomed.2021.104806
5. Kovesdy CP. Epidemiology of chronic kidney disease: an update 2022. Kidney Int Suppl (2022) 12:7–11. doi: 10.1016/j.kisu.2021.11.003
6. Hill NR, Fatoba ST, Oke JL, Hirst JA, O’Callaghan CA, Lasserson DS, et al. Global prevalence of chronic kidney disease–a systematic review and meta-analysis. PloS One (2016) 11:e0158765. doi: 10.1371/journal.pone.0158765
7. Foreman KJ, Marquez N, Dolgert A, Fukutaki K, Fullman N, McGaughey M, et al. Forecasting life expectancy, years of life lost, and all-cause and cause-specific mortality for 250 causes of death: reference and alternative scenarios for 2016–40 for 195 countries and territories. Lancet (2018) 392:2052–90. doi: 10.1016/S0140-6736(18)31694-5
8. Alelign T, Petros B. Kidney stone disease: an update on current concepts. Adv Urol (2018) 2018. doi: 10.1155/2018/3068365
9. Sanna E, Loukogeorgakis S, Prior T, Derwig I, Paramasivam G, Choudhry M, et al. Fetal abdominal cysts: antenatal course and postnatal outcomes. J Perinatal Med (2019) 47:418–21. doi: 10.1515/jpm-2018-0311
10. Hsieh JJ, Purdue MP, Signoretti S, Swanton C, Albiges L, Schmidinger M, et al. Renal cell carcinoma. Nat Rev Dis Primers (2017) 3:1–19. doi: 10.1038/nrdp.2017.9
11. Brisbane W, Bailey MR, Sorensen MD. An overview of kidney stone imaging techniques. Nat Rev Urol (2016) 13:654–62. doi: 10.1038/nrurol.2016.154
12. Bi Y, Shi X, Ren J, Yi M, Han X. Transarterial chemoembolization of unresectable renal cell carcinoma with doxorubicin-loaded callispheres drug-eluting beads. Sci Rep (2022) 12:1–8. doi: 10.1038/s41598-022-12334-x
13. Monkam P, Qi S, Ma H, Gao W, Yao Y, Qian W. Detection and classification of pulmonary nodules using convolutional neural networks: a survey. IEEE Access (2019) 7:78075–91. doi: 10.1109/ACCESS.2019.2920980
14. Chen G, Ding C, Li Y, Hu X, Li X, Ren L, et al. Prediction of chronic kidney disease using adaptive hybridized deep convolutional neural network on the internet of medical things platform. IEEE Access (2020) 8:100497–508. doi: 10.1109/ACCESS.2020.2995310
15. Singh V, Asari VK, Rajasekaran R. A deep neural network for early detection and prediction of chronic kidney disease. Diagnostics (2022) 12:116. doi: 10.3390/diagnostics12010116
16. Krishnamurthy S, Ks K, Dovgan E, Luštrek M, Gradišek Piletič B, Srinivasan K, et al. Machine learning prediction models for chronic kidney disease using national health insurance claim data in taiwan. Healthcare (MDPI) (2021) 9:546. doi: 10.3390/healthcare9050546
17. Bhattacharjee A, Murugan R, Goel T, Mirjalili S. Pulmonary nodule segmentation framework based on fine-tuned and pre-trained deep neural network using ct images(2023) (Accessed IEEE Transactions on Radiation and Plasma Medical Sciences).
18. Akter S, Habib A, Islam MA, Hossen MS, Fahim WA, Sarkar PR, et al. Comprehensive performance assessment of deep learning models in early prediction and risk identification of chronic kidney disease. IEEE Access (2021) 9:165184–206. doi: 10.1109/ACCESS.2021.3129491
19. Alsuhibany SA, Abdel-Khalek S, Algarni A, Fayomi A, Gupta D, Kumar V, et al. Ensemble of deep learning based clinical decision support system for chronic kidney disease diagnosis in medical internet of things environment. Comput Intell Neurosci (2021) 2021. doi: 10.1155/2021/4931450
20. Ardila D, Kiraly AP, Bharadwaj S, Choi B, Reicher JJ, Peng L, et al. End-to-end lung cancer screening with three-dimensional deep learning on low-dose chest computed tomography. Nat Med (2019) 25:954–61. doi: 10.1038/s41591-019-0447-x
21. Khan B, Naseem R, Muhammad F, Abbas G, Kim S. An empirical evaluation of machine learning techniques for chronic kidney disease prophecy. IEEE Access (2020) 8:55012–22. doi: 10.1109/ACCESS.2020.2981689
22. Bhaskar N, Manikandan S. A deep-learning-based system for automated sensing of chronic kidney disease. IEEE Sensors Lett (2019) 3:1–4. doi: 10.1109/LSENS.2019.2942145
23. Coudray N, Ocampo PS, Sakellaropoulos T, Narula N, Snuderl M, Fenyö D, et al. Classification and mutation prediction from non–small cell lung cancer histopathology images using deep learning. Nat Med (2018) 24:1559–67. doi: 10.1038/s41591-018-0177-5
24. Almeida G, Tavares JMR. Deep learning in radiation oncology treatment planning for prostate cancer: a systematic review. J Med Syst (2020) 44:1–15. doi: 10.1007/s10916-020-01641-3
25. Kalantar R, Lin G, Winfield JM, Messiou C, Lalondrelle S, Blackledge MD, et al. Automatic segmentation of pelvic cancers using deep learning: state-of-the-art approaches and challenges. Diagnostics (2021) 11:1964. doi: 10.3390/diagnostics11111964
26. Xie H, Zhang J-F, Li Q. Application of deep convolution network to automated image segmentation of chest ct for patients with tumor. Front Oncol (2021) 11, 3959. doi: 10.3389/fonc.2021.719398
27. Toğaçar M, Ergen B, Cömert Z. Detection of lung cancer on chest ct images using minimum redundancy maximum relevance feature selection method with convolutional neural networks. Biocybernet Biomed Eng (2020) 40:23–39. doi: 10.1016/j.bbe.2019.11.004
28. Lyu J, Bi X, Ling SH. Multi-level cross residual network for lung nodule classification. Sensors (2020) 20:2837. doi: 10.3390/s20102837
29. Rani KV, Jawhar SJ. Superpixel with nanoscale imaging and boosted deep convolutional neural network concept for lung tumor classification. Int J Imaging Syst Technol (2020) 30:899–915. doi: 10.1002/ima.22422
30. Chen C-L, Chen C-C, Yu W-H, Chen S-H, Chang Y-C, Hsu T-I, et al. An annotation-free whole-slide training approach to pathological classification of lung cancer types using deep learning. Nat Commun (2021) 12:1193. doi: 10.1038/s41467-021-21467-y
31. Gonçalves L, Novo J, Cunha A, Campilho A. Learning lung nodule malignancy likelihood from radiologist annotations or diagnosis data. J Med Biol Eng (2018) 38:424–42. doi: 10.1007/s40846-017-0317-2
32. Asuntha A, Srinivasan A. Deep learning for lung cancer detection and classification. Multimedia Tools Appl (2020) 79:7731–62. doi: 10.1007/s11042-019-08394-3
33. Zheng S, Guo J, Cui X, Veldhuis RN, Oudkerk M, Van Ooijen PM. Automatic pulmonary nodule detection in ct scans using convolutional neural networks based on maximum intensity projection. IEEE Trans Med Imaging (2019) 39:797–805. doi: 10.1109/TMI.2019.2935553
34. Chaunzwa TL, Hosny A, Xu Y, Shafer A, Diao N, Lanuti M, et al. Deep learning classification of lung cancer histology using ct images. Sci Rep (2021) 11:1–12. doi: 10.1038/s41598-021-84630-x
35. Zhang G, Yang Z, Gong L, Jiang S, Wang L. Classification of benign and malignant lung nodules from ct images based on hybrid features. Phys Med Biol (2019) 64:125011. doi: 10.1088/1361-6560/ab2544
36. Liu K, Kang G. Multiview convolutional neural networks for lung nodule classification. Int J Imaging Syst Technol (2017) 27:12–22. doi: 10.1002/ima.22206
37. Reddy S, Bhuvaneshwari V, Tikariha AK, Amballa YS, Raj BSS. Automatic pulmonary nodule detection in ct scans using xception, resnet50 and advanced convolutional neural networks models. Int Res J EngTechnol (2022) 9(4), 3226–3237.
38. Kareem HF, AL-Husieny MS, Mohsen FY, Khalil EA, Hassan ZS. Evaluation of svm performance in the detection of lung cancer in marked ct scan dataset. Indones J Electr Eng Comput Sci (2021) 21:1731. doi: 10.11591/ijeecs.v21.i3.pp1731-1738
39. Bhattacharjee A, Shankar K, Murugan R, Goel T. (2022). A powerful transfer learning technique for multiclass classification of lung cancer ct images, in: 2022 International Conference on Engineering and Emerging Technologies (ICEET), . pp. 1–6.
40. Yildirim K, Bozdag PG, Talo M, Yildirim O, Karabatak M, Acharya UR. Deep learning model for automated kidney stone detection using coronal ct images. Comput Biol Med (2021) 135:104569. doi: 10.1016/j.compbiomed.2021.104569
41. Blau N, Klang E, Kiryati N, Amitai M, Portnoy O, Mayer A. Fully automatic detection of renal cysts in abdominal ct scans. Int J Comput Assist Radiol Surg (2018) 13:957–66. doi: 10.1007/s11548-018-1726-6
42. Parakh A, Lee H, Lee JH, Eisner BH, Sahani DV, Do S. Urinary stone detection on ct images using deep convolutional neural networks: evaluation of model performance and generalization. Radiol: Artif Intell (2019) 1:e180066. doi: 10.1148/ryai.2019180066
43. Zhang H, Chen Y, Song Y, Xiong Z, Yang Y, Wu QJ. Automatic kidney lesion detection for ct images using morphological cascade convolutional neural networks. IEEE Access (2019) 7:83001–11. doi: 10.1109/ACCESS.2019.2924207
44. Alzu’bi D, Abdullah M, Hmeidi I, AlAzab R, Gharaibeh M, El-Heis M, et al. Kidney tumor detection and classification based on deep learning approaches: a new dataset in ct scans. J Healthcare Eng (2022) 2022. doi: 10.1155/2022/3861161
45. Fu X, Liu H, Bi X, Gong X. Deep-learning-based ct imaging in the quantitative evaluation of chronic kidney diseases. J Healthcare Eng (2021) 2021. doi: 10.1155/2021/3774423
46. Viswanath K, Gunasundari R. Design and analysis performance of kidney stone detection from ultrasound image by level set segmentation and ann classification(2014) (Accessed 2014 International Conference on Advances in Computing, Communications and Informatics (ICACCI)).
47. Caglayan A, Horsanali MO, Kocadurdu K, Ismailoglu E, Guneyli S. Deep learning model-assisted detection of kidney stones on computed tomography. Int Braz J Urol (2022) 48:830–9. doi: 10.1590/s1677-5538.ibju.2022.0132
48. Cui Y, Sun Z, Ma S, Liu W, Wang X, Zhang X, et al. Automatic detection and scoring of kidney stones on noncontrast ct images using stone nephrolithometry: combined deep learning and thresholding methods. Mol Imaging Biol (2021) 23:436–45. doi: 10.1007/s11307-020-01554-0
49. Kazemi Y, Mirroshandel SA. A novel method for predicting kidney stone type using ensemble learning. Artif Intell Med (2018) 84:117–26. doi: 10.1016/j.artmed.2017.12.001
50. Aksakalli I, Kaçdioğlu S, Hanay YS. Kidney x-ray images classification using machine learning and deep learning methods. Balkan J Electr Comput Eng (2021) 9:144–51. doi: 10.17694/bajece.878116
51. Zheng Q, Furth SL, Tasian GE, Fan Y. Computer-aided diagnosis of congenital abnormalities of the kidney and urinary tract in children based on ultrasound imaging data by integrating texture image features and deep transfer learning image features. J Pediatr Urol (2019) 15:75–e1. doi: 10.1016/j.jpurol.2018.10.020
52. Sudharson S, Kokil P. An ensemble of deep neural networks for kidney ultrasound image classification. Comput Methods Programs Biomed (2020) 197:105709. doi: 10.1016/j.cmpb.2020.105709
53. Asif S, Wenhui Y, Jinhai S, Ain QU, Yueyang Y, Jin H. Modeling a fine-tuned deep convolutional neural network for diagnosis of kidney diseases from ct images(2022). IEEE (Accessed 2022 IEEE International Conference on Bioinformatics and Biomedicine (BIBM)).
54. Narmada N, Shekhar V, Singh T. Classification of kidney ailments using cnn in ct images(2022) (Accessed 2022 13th International Conference on Computing Communication and Networking Technologies (ICCCNT)).
55. Qadir AM, Abd DF. Kidney diseases classification using hybrid transfer-learning densenet201-based and random forest classifier. Kurdistan J Appl Res (2023) 7(2), 131–44. doi: 10.24017/Science.2022.2.11
56. Islam MN, Hasan M, Hossain MK, Alam MGR, Uddin MZ, Soylu A. Vision transformer and explainable transfer learning models for auto detection of kidney cyst, stone and tumor from ct-radiography. Sci Rep (2022) 12:11440. doi: 10.1038/s41598-022-15634-4
59. Ioffe S, Szegedy C. Batch normalization: accelerating deep network training by reducing internal covariate shift(2015) (Accessed International conference on machine learning (pmlr)).
60. Chollet F. Xception: deep learning with depthwise separable convolutions(2017) (Accessed Proceedings of the IEEE conference on computer vision and pattern recognition).
Keywords: lung cancer, kidney diseases, computed tomography, modified Xception model, fine-tuning, transfer learning, artificial intelligence
Citation: Bhattacharjee A, Rabea S, Bhattacharjee A, Elkaeed EB, Murugan R, Selim HMRM, Sahu RK, Shazly GA and Salem Bekhit MM (2023) A multi-class deep learning model for early lung cancer and chronic kidney disease detection using computed tomography images. Front. Oncol. 13:1193746. doi: 10.3389/fonc.2023.1193746
Received: 27 March 2023; Accepted: 04 May 2023;
Published: 02 June 2023.
Edited by:
Subhadeep Roy, National Institute of Pharmaceutical Education and Research, Kolkata, IndiaReviewed by:
Pradeep Pal, Mahakal Institute of Pharmaceutical Studies, IndiaMogana Das Murtey, University of Science Malaysia (USM), Malaysia
Copyright © 2023 Bhattacharjee, Rabea, Bhattacharjee, Elkaeed, Murugan, Selim, Sahu, Shazly and Salem Bekhit. This is an open-access article distributed under the terms of the Creative Commons Attribution License (CC BY). The use, distribution or reproduction in other forums is permitted, provided the original author(s) and the copyright owner(s) are credited and that the original publication in this journal is cited, in accordance with accepted academic practice. No use, distribution or reproduction is permitted which does not comply with these terms.
*Correspondence: Sameh Rabea, c3JhYmVhQG1jc3QuZWR1LnNh; Abhishek Bhattacharjee, YWJoaXNoZWsuYmhhdHRhY2hhcmplZUBhdXMuYWMuaW4=; R. Murugan, bXVydWdhbi5ybW5AZWNlLm5pdHMuYWMuaW4=; Ram Kumar Sahu, cmFtc2FodTc5QGdtYWlsLmNvbQ==
†These authors have contributed equally to this work