 Ombretta Garbarino1†
 Giulia Elda Valenti1†
 Lorenzo Monteleone1
 Gabriella Pietra1,2
 Maria Cristina Mingari1,2
 Andrea Benzi3
 Santina Bruzzone2,3
 Silvia Ravera4Riccardo Leardi5Emanuele Farinini5
 Stefania Vernazza1Melania Grottoli1
 Barbara Marengo1†
 Cinzia Domenicotti1*†
- 1Department of Experimental Medicine, General Pathology Section, University of Genoa, Genoa, Italy
- 2IRCCS Ospedale Policlinico San Martino, Genova, Italy
- 3Department of Experimental Medicine, Biochemistry Section, University of Genoa, Genoa, Italy
- 4Department of Experimental Medicine, Human Anatomy Section, University of Genoa, Genoa, Italy
- 5Department of Pharmacy, University of Genoa, Genoa, Italy
Background: Malignant melanoma is the most lethal form of skin cancer which shows BRAF mutation in 50% of patients. In this context, the identification of BRAFV600E mutation led to the development of specific inhibitors like PLX4032. Nevertheless, although its initial success, its clinical efficacy is reduced after six-months of therapy leading to cancer relapse due to the onset of drug resistance. Therefore, investigating the mechanisms underlying PLX4032 resistance is fundamental to improve therapy efficacy. In this context, several models of PLX4032 resistance have been developed, but the discrepancy between in vitro and in vivo results often limits their clinical translation.
Methods: The herein reported model has been realized by treating with PLX4032, for six months, patient-derived BRAF-mutated melanoma cells in order to obtain a reliable model of acquired PLX4032 resistance that could be predictive of patient’s treatment responses. Metabolic analyses were performed by evaluating glucose consumption, ATP synthesis, oxygen consumption rate, P/O ratio, ATP/AMP ratio, lactate release, lactate dehydrogenase activity, NAD+/NADH ratio and pyruvate dehydrogenase activity in parental and drug resistant melanoma cells. The intracellular oxidative state was analyzed in terms of reactive oxygen species production, glutathione levels and NADPH/NADP+ ratio. In addition, a principal component analysis was conducted in order to identify the variables responsible for the acquisition of targeted therapy resistance.
Results: Collectively, our results demonstrate, for the first time in patient-derived melanoma cells, that the rewiring of oxidative phosphorylation and the maintenance of pyruvate dehydrogenase activity and of high glutathione levels contribute to trigger the onset of PLX4032 resistance.
Conclusion: Therefore, it is possible to hypothesize that inhibitors of glutathione biosynthesis and/or pyruvate dehydrogenase activity could be used in combination with PLX4032 to overcome drug resistance of BRAF-mutated melanoma patients. However, the identification of new adjuvant targets related to drug-induced metabolic reprogramming could be crucial to counteract the failure of targeted therapy in metastatic melanoma.
1 Introduction
Malignant melanoma accounts for approximately 2% of all cutaneous malignancies and is responsible for 75% of all skin cancer deaths. The melanoma incidence and death rate have progressively increased during the last 30 years (1), reaching a global incidence of 15-25 per 100,000 individuals with 48,000 deaths according to World Health Organization (2). Current treatment guidelines establish surgical resection as the standard of care for localized and locoregional melanoma (3) and chemotherapy, administered as a single agent or in combination with immunotherapy/biologic drugs, represents the first-line treatment for advanced melanoma. Unfortunately, the acquisition of drug resistance mainly due to the constitutive activation of oncogenes, hampers the effectiveness of therapy in terms of overall survival (4, 5). Indeed, mutations in BRAF (V-raf murine sarcoma viral oncogene homolog B1), a human proto-oncogene member of the RAF (Rapidly growing Fibrosarcoma) family of serine-threonine kinases, have been identified in 50% of malignant melanomas (6), and approximately 40-70% of the cases show a missense mutation, with a substitution of valine with glutamic acid at codon 600 (denoted as V600E) (7). This mutation determines a phosphomimetic conformational change in the activation domain of BRAF leading to a constitutively-activation of MAPK–ERK signalling and a massive increase in the basal kinase activity (8, 9). The identification of oncogenic driver mutations, such as KRAS and BRAF, has accelerated the development of small-molecule inhibitors along the RAS-RAF-MEK-MAPK signaling pathway (10). Currently, PLX4032 (commercially known as Vemurafenib) is approved for the treatment of patients with BRAFV600E-mutated metastatic melanomas (11, 12) and, although to a lesser extent, of those with V600K, V600R and V600D mutations (13).
Despite the encouraging results obtained with PLX4032, most BRAF-mutant metastatic melanoma patients become drug-resistant after 6/7 months of therapy, promoting cancer relapse (14).
Interestingly, it has been reported that chemoresistance is associated with an increase in oxidative phosphorylation (OXPHOS) and in mitochondrial biogenesis (10). However, although this metabolic adaptation is particularly observed in PLX4032-resistant BRAFV600E melanoma cells (15), the mechanisms underlying this response are still poorly understood. One of the reasons of this gap is the limited availability of in vitro models able to reproduce a reliable condition of therapy resistance occurring in vivo. In this regard, it is crucial to carefully evaluate i) the choice of cancer cell line, ii) the strategy of drug administration and iii) the criteria of selecting drug-resistant cancer cells (16).
In this study, we report a model of acquired PLX4032 resistance obtained by chronically treating patient-derived BRAF-mutated melanoma cells with PLX4032. Taking advantage of this model, the role played by the metabolic transition on the acquisition of chemoresistance has been investigated. To our knowledge, this is the first study carried out utilizing a model of drug resistance that is originated from patient-derived melanoma cells and that could be useful to identify new potential targets to hit in order to overcome targeted therapy (TT) resistance.
2 Materials and methods
2.1 Chemicals
Vemurafenib (PLX4032) was purchased from Selleck Chemicals LLC (Houston, TX, USA) and the stock solutions were prepared using dimethyl sulfoxide (DMSO, Sigma-Aldrich, St. Louis, MO, USA) as a solvent. N-Acetylcysteine (NAC) and dichloroacetate (DCA) were from Sigma-Aldrich and the stock solutions were prepared in sterile water.
2.2 Cell lines
All the experiments were performed on MeOV (BRAFV600E) and MeTA (BRAFV600D) metastatic melanoma cell lines isolated from the biopsies of TT-untreated patients (17). Melanoma cells were maintained in RPMI 1640 medium (Euroclone Spa, Pavia, Italy) supplemented with 10% Fetal Bovine Serum (FBS, Euroclone Spa, Pavia, Italy), 1% L-Glutamine (Euroclone Spa, Pavia, Italy) and 1% Penicillin/Streptomicin (Euroclone Spa, Pavia, Italy) and grown under standard conditions (37°C humidified incubator with 5% CO2).
2.3 Selection of cell populations resistant to PLX4032
PLX4032-resistant (PLX-R) and dimethyl sulfoxide-resistant (DMSO-R) MeOV and MeTA cells were selected by treating the whole population of parental cells with increasing concentrations of PLX4032 or DMSO. DMSO-R cells were sensitive to PLX4032 and were used as a comparative model to exclude a toxic effect of DMSO chronic treatment or its potential interference with the effects exerted by PLX4032. Briefly, to obtain drug-resistant cell populations, the cells were seeded twice a week at a density of 1.5 x 10⁶ and treated over six months with PLX4032 (250 nM- 1.5 µM) or with the corresponding volume of DMSO. The authenticity of the selected cells was checked by Short Tandem Repeat (STR) profile analysis performed by the Immunohematology and Transfusion operative unit, IRCCS Ospedale Policlinico San Martino, Genoa. Fifteen highly polymorphic STR loci plus amelogenin (Cell IDTM System, Promega, Milan), were used. Detection of amplified fragments was obtained by ABI PRISM 3100 Genetic Analyzer. Data analysis was performed by GeneMapper® Software version 4.0 (Thermo Fisher Scientific, Waltham, MA, USA).
2.4 Treatments
Both chronically-treated melanoma cells were treated for 72 h with increasing concentrations of either PLX4032 (0.1-20 µM) or the corresponding volume of DMSO (0.0025%-0.1% v/v) to verify the efficiency of our long-term-drug-induced resistance protocol. Then, PLX-R and DMSO-R melanoma cells were treated with 1.5 µM PLX4032 or 0.0075% v/v DMSO for 24, 48 or 72 h, according to the experiments. Cell cultures were carefully monitored before and during the experiments to ensure optimal cell density. Notably, samples were discarded if the cell confluence reached > 90%.
In another set of experiments, both DMSO-R cell populations were pre-treated for 2 h with NAC (2mM and 4 mM) or DCA (25 mM or 50 mM) and then exposed for additional 70 h to PLX4032 (1.5 µM and 5 µM).
2.5 Cell viability assay
To evaluate cell viability, the CellTiter 96® AQueous One Solution Cell Proliferation Assay (Promega, Madison, WI, USA) was used according to the manufacturer’s instructions. Briefly, cells (10 x 103 cells/well) were seeded into 96-well plates (Corning Incorporated, Corning, NY, USA) and then treated as above described. Finally, cells were incubated with 20 µL of CellTiter and the absorbance at 490 nm was recorded using a microplate reader (EL-808, BIO-TEK Instruments Inc., Winooski, VT, USA).
2.6 Cell cycle analysis
To perform cell cycle analysis DMSO-R and PLX-R cells were centrifuged as a mono-disperse cell suspension (about 5 x 10⁶ cells), the supernatant was removed and the cells were re-suspended in cold fixative solution (70% ETOH and 30% PBS) and stored at -20°C for at least 24 h. After one week, the fixative solution was removed by PBS washing and then cells were re-suspended in DNA staining solution (40 μg/ml PI and 0.1mg/ml RNase in PBS) and incubated at room temperature in the dark for 30 min. Finally, all samples were analyzed by the FACScalibur flow cytometer (BD Biosciences).
2.7 Glucose consumption
Glucose consumption was evaluated by measuring its concentration in the growth medium using a double beam spectrophotometer (UNICAM UV2, Analytical S.n.c., Langhirano, PR, Italy), by the hexokinase (HK) and glucose 6 phosphate dehydrogenase (G6PD) coupling system, following the reduction of NADP+ at 340 nm as previously reported (18).
2.8 Oxygen consumption rate (OCR)
OCR was measured by a thermostatically-controlled (37°C) oxygraph apparatus equipped with an amperometric electrode for oxygen (Unisense-Microrespiration, Unisense A/S, Denmark), as previously reported (18).
2.9 Evaluation of intracellular ATP and AMP levels
ATP and AMP levels were measured by the enzyme coupling method, following NADP reduction or NADH oxidation, respectively, at 340 nm as previously reported (18).
2.10 ATP synthesis
The ATP content was measured using the luciferin/luciferase ATP bioluminescence assay kit CLSII (Roche, Basel, Switzerland) on a Luminometer (Triathler, Bioscan, Washington, DC, USA) (18).
2.11 Lactate release and lactate dehydrogenase activity
The concentration of lactate released by melanoma cells in the culture medium was analyzed by spectrophotometric analysis as previously reported (18). Lactate dehydrogenase (LDH) activity was measured following the NADH oxidation at 340 nm. The assay medium contained 100 mM Tris-HCl pH 7.4, 5 mM pyruvate, 40 μM rotenone, and 0.2 mM NADH (19).
2.12 NAD(P)/NAD(P)(H)
PLX-R/DMSO-R MeOV and MeTA cells were plated in 24-well plates and treated with 1.5 µM PLX4032 for 24, 48 or 72 h. Cells were then harvested and lysed in 0.1 ml of 0.6 M perchloric acid (PCA; for NAD+ and NADP+) or of 0.1 M NaOH (for NADH and NADPH) at 4°C. Samples in PCA were neutralized by diluting the extracts in 100 mM sodium phosphate buffer (pH 8); samples in NaOH, were warmed at 72°C for 10 min and were neutralized in 10 mM Tris-HCl, pH 6. NAD(H) content was assessed with an enzyme cyclic assay using alcohol deydrogenase, as previously described (20). NADP(H) content was measured utilizing an alternative enzymatic reaction mixture using glucose-6-phosphate deydrogenase (21). Resazurin reduction to resorufin was monitored at 544 nm excitation, 590 nm emission, using a fluorescence plate reader (Fluostar Optima, BMG Labtechnologies GmbH, Offenburg, Germany). A standard curve was always run in parallel.
2.13 Pyruvate dehydrogenase activity
Enzymatic activity of pyruvate dehydrogenase (PDH) was performed using the “Pyruvate dehydrogenase (PDH) Combo (Activity + Profiling) Microplate Assay Kit” provided by Abcam (ab110671, Abcam) and following the manufacturer’s instructions. For each sample, 4 x 10⁶ cells were used (22).
2.14 Western blotting analysis
Immunoblots were carried out according to standard methods (23) using rabbit antibody anti-PDH (Cell Signaling Technology Inc., Danvers, MA, USA Upstate, Lake Placid, NY, USA) and anti-rabbit secondary antibodies coupled with horseradish peroxidase (Cell signaling Technologies).
2.15 Reactive oxygen species production
Detection of Reactive Oxygen Species (ROS) levels was evaluated by incubating cells with 5 µM 2'-7' dichlorofluoresceindiacetate (DCFH-DA; Sigma-Aldrich) as previously reported (18).
2.16 Total glutathione levels
Total glutathione (GSH) content was analyzed as previously reported (18).
2.17 Principal component analyses
Principal component analysis (PCA) was performed as previously described (24) by using the CAT software. (R. Leardi, C. Melzi, G. Polotti, CAT (Chemometric Agile Tool), freely downloadable from http://gruppochemiometria.it/index.php/software).
2.18 Statistical analysis
Results were expressed as mean ± SEM from at least four independent experiments. The statistical significance of parametric differences among the sets of experimental data was evaluated by one-way ANOVA and Dunnett’s test for multiple comparisons.
3 Results
3.1 Chronic exposure of BRAF-mutated melanoma cells to PLX4032 leads to the selection of PLX4032-resistant cell lines
Since BRAF-mutated patients treated with PLX4032 have been reported to develop resistance after 6 months, we decided to investigate the effects induced by PLX4032 chronic treatment of BRAFV600E MeOV and BRAFV600D MeTA that are human metastatic melanoma cell lines derived from two patients. Therefore, both melanoma cell lines were treated for 6 months with increasing concentrations of PLX4032 (1 nM-1.5 μM) and then maintained in culture with the same drug at the highest concentration. Notably, in all experiments, PLX4032 chronically-treated cells were compared to the DMSO chronically-treated ones.
The efficiency of the long-term-drug-induced resistance protocol above described was tested by analyzing the viability of MeOV and MeTA cells treated for 72 h with increasing (0.1-20 µM) PLX4032 or (0.0025%-0.1% v/v) DMSO concentrations. As shown in Figure 1, PLX4032 induced dose-dependent cytotoxic effects in DMSO chronically-treated cells selected from either MeOV (panel A, left) and MeTA (panel B, left). However, PLX4032 was more cytotoxic for MeOV cells, having an IC50 of 0.5 μM (Figure 1A, left panel, green line), while for MeTA cells the IC50 was 18.7 μM (Figure 1B, left panel, green line). Moreover, analyzing the effects of the same treatments on PLX4032 chronically-treated cells, 5 μM PLX4032 was found to reduce the viability of MeOV cells by 22%, while the highest dose (20 μM) of the drug induced 60% of cell death reaching an IC50 of 16.2 μM (Figure 1A, left panel). Instead, the viability of MeTA cells was reduced by 20% only after the treatment with 20 μM PLX4032 and the IC50 was 37.2 μM (Figure 1B, left panel).
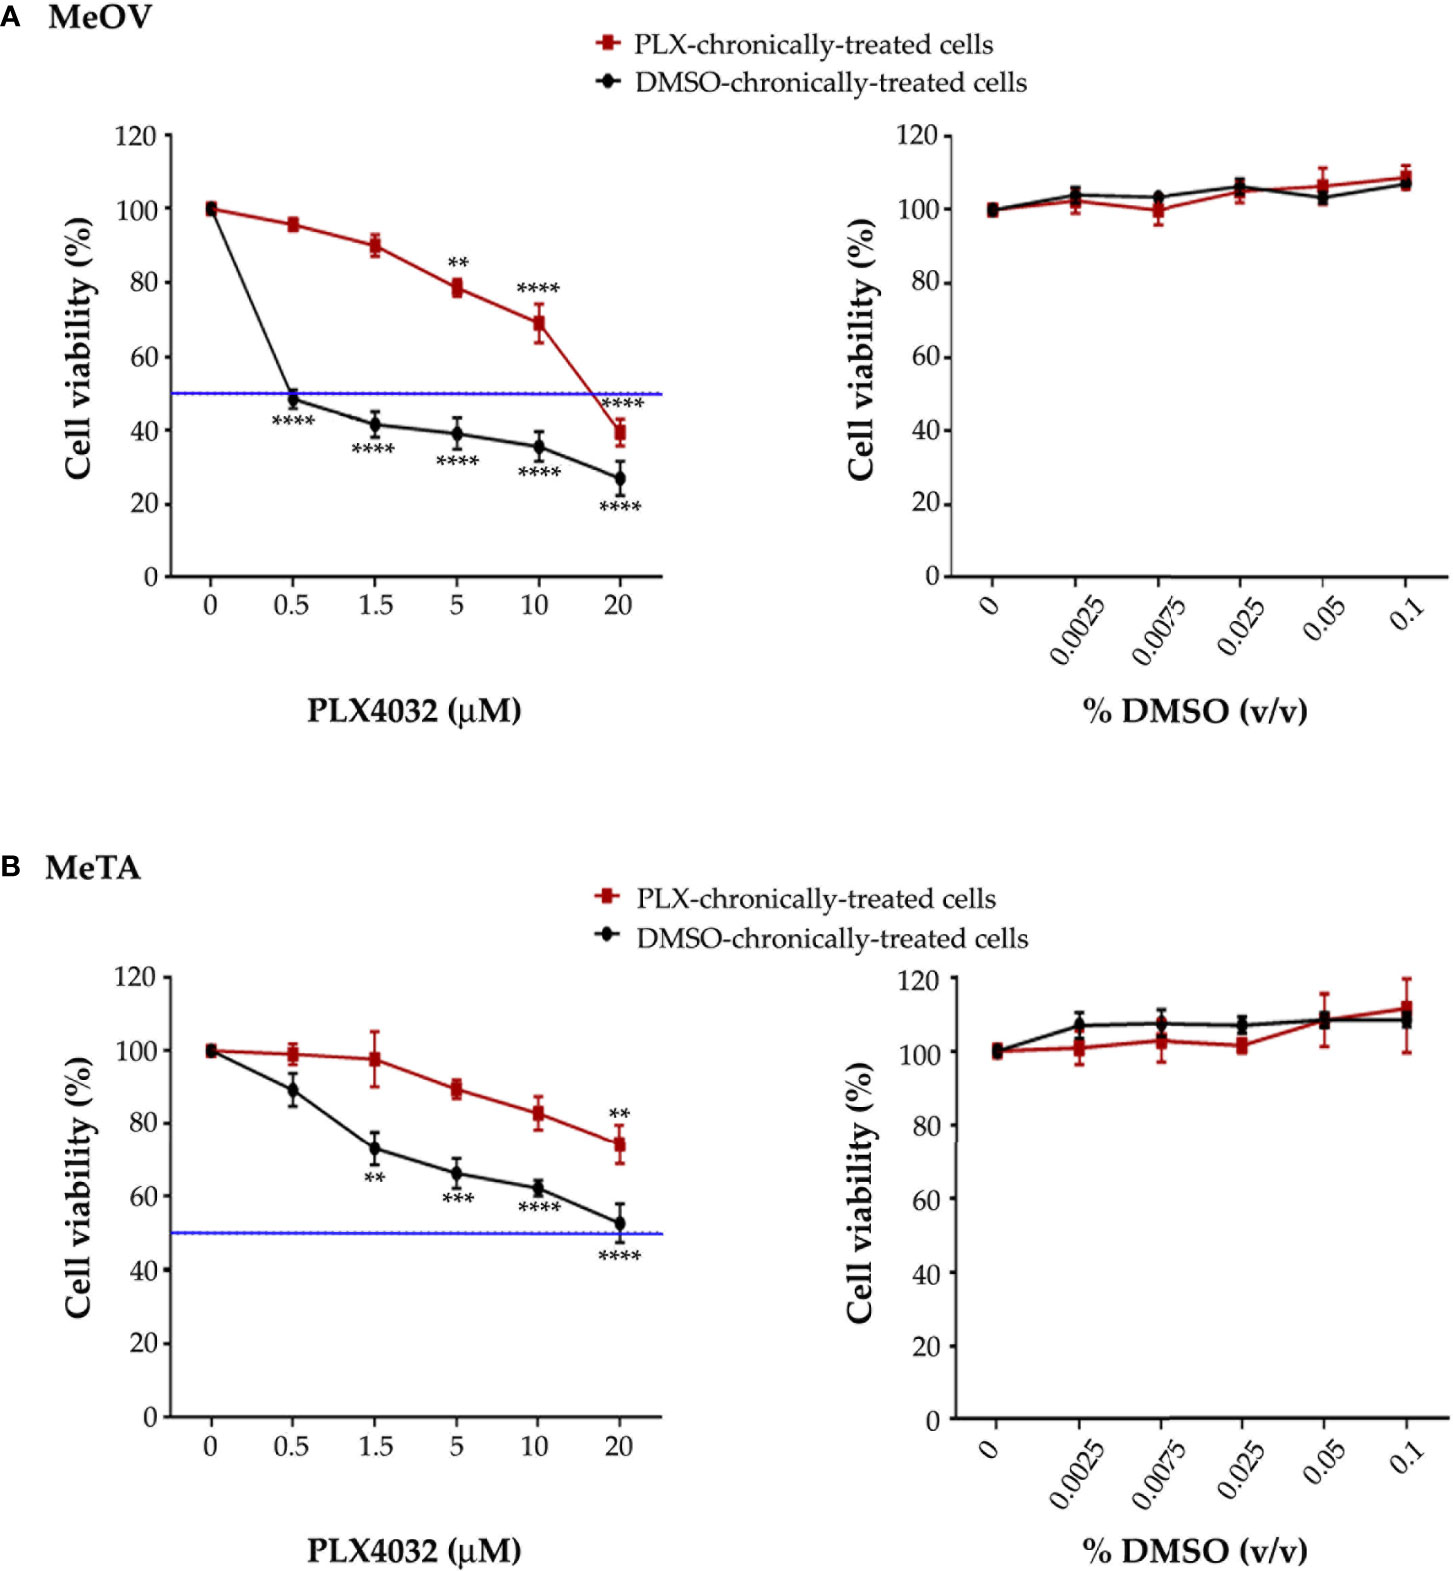
Figure 1 Chronic exposure of MeOV (A) and MeTA (B) melanoma cells to PLX4032 or DMSO is able to select a resistant phenotype. PLX4032 and DMSO chronically-treated MeOV and MeTA cells were exposed for 72 h to increasing concentrations (0.1-20 µM) of PLX4032 (left panels) or DMSO (0.0025-0.1% v/v) (right panels) and cell viability was analyzed by MTT assay. The blue line is drawn at 50% cell viability. Graphs summarize quantitative data of the means ± S.E.M. of four independent experiments. **p<0.01 vs. untreated cells; ***p<0.001 vs. untreated cells; ****p<0.0001 vs. untreated cells.
Notably, all concentrations of DMSO, corresponding to the volume of the solvent employed to dissolve PLX4032, did not affect per se the survival of all melanoma cells (Figures 1A, B, right panels).
Since the ratio of PLX4032 IC50 values in PLX4032 and DMSO chronically-treated cells was 32.4 (MeOV) and 2 (MeTA), both PLX4032-selected populations can be considered resistant to the drug (PLX-R).
The identity of melanoma cell lines was verified and certified, comparing parental cell line profile to the two profiles of resistant cell lines (PLX-R and DMSO-R). As shown in Table 1, the results demonstrated an identical profile of Short Tandem Repeat (STR) sequence loci in all melanoma cell lines, certifying the authenticity of the selected cells and demonstrating lack of contamination from other cell lines and microbes.
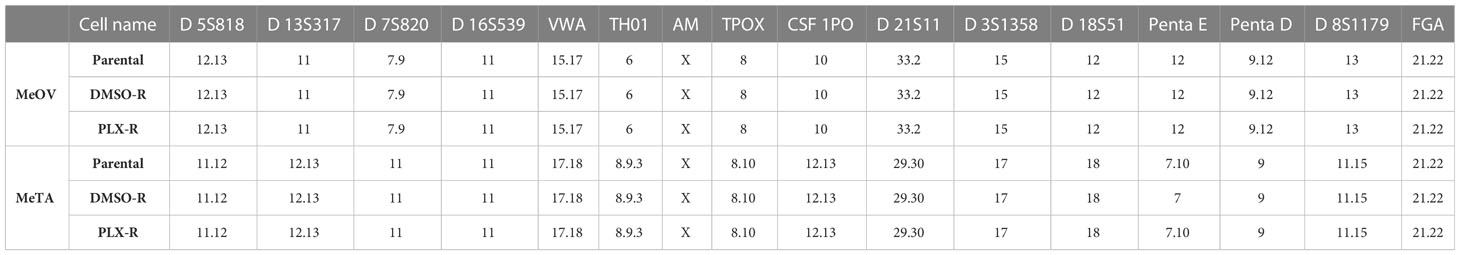
Table 1 Short Tandem Repeat sequence loci in parental, DMSO-R and PLX-R melanoma cells.
Furthermore, since acute PLX4032 exposure markedly decreased the viability of both DMSO-R cell populations, the effect of the drug on the cell cycle was investigated. As shown in Table 2, the percentage of MeOV-DMSO-R cells in G0/G1 phase increased by 30, 20 and 13% compared to untreated cells, after 24, 48 and 72 h of treatment with PLX4032, respectively. This effect was accompanied by a concomitant decrease in the percentage of cells in S and G2/M phase. A similar trend in cell cycle phases distribution was observed in MeTA-DMSO-R cells but with a reduced effect in respect to MeOV cells. Interestingly, in both PLX-R cell populations, acute drug exposure did not affect the distribution of cells in cell cycle phases that was comparable to that observed in untreated ones.
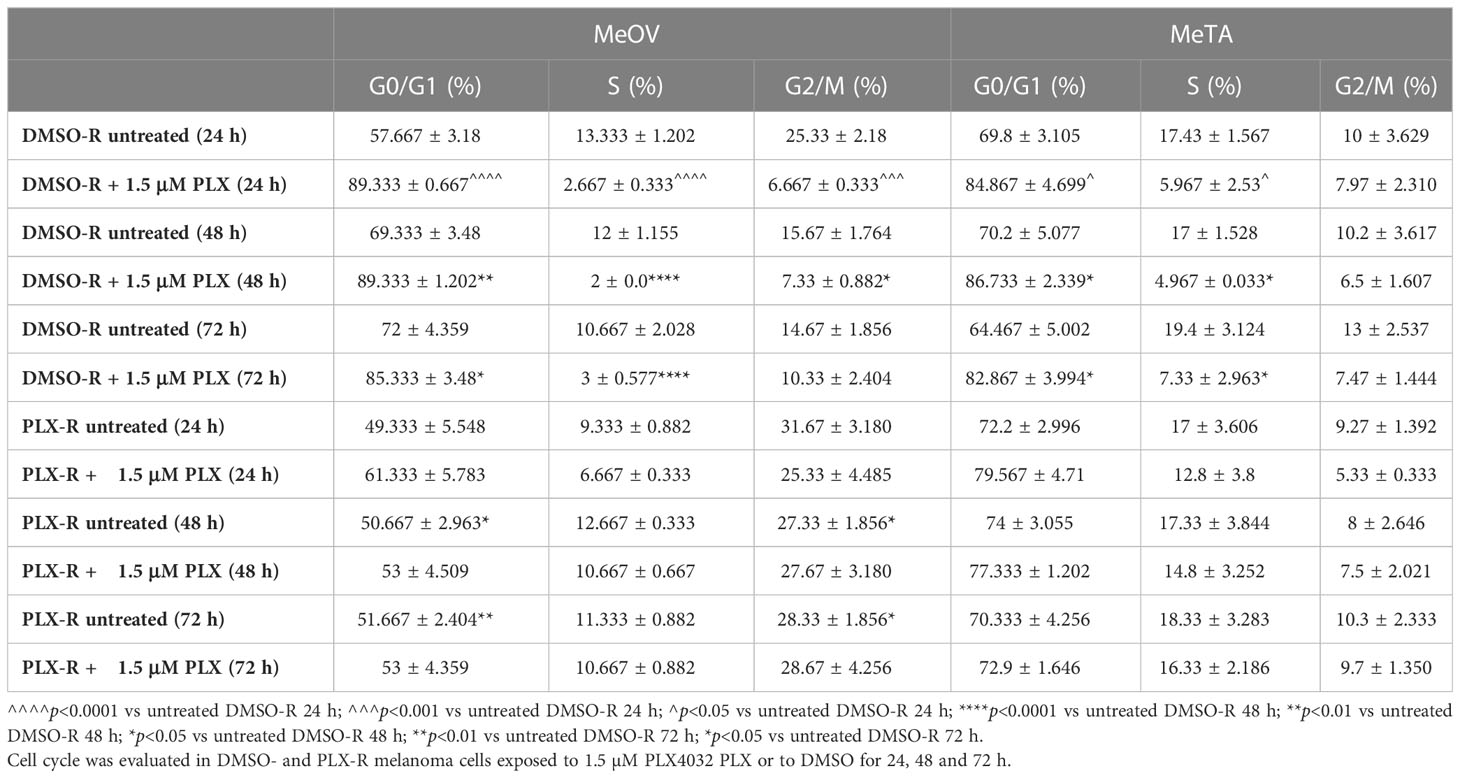
Table 2 Cell cycle analysis.
3.2 The acquisition of PLX4032 resistance is accompanied by the ability of melanoma cells to maintain an efficient OXPHOS metabolism
Since the metabolic plasticity of melanoma under drug-induced stress conditions has been demonstrated to confer a survival advantage (25), the metabolic profile of all melanoma cell lines has been investigated.
As shown in Figure 2 (A and B, left panels), 1.5 μM PLX4032 increased glucose consumption in both DMSO-R cell populations in a time-dependent manner. However, this effect was already evident at 24 h in DMSO-R MeOV (Figure 2A, left panel), while it was observed only at 48 h in DMSO-R MeTA (Figure 2B, left panel). Instead, PLX4032 treatment did not alter glucose consumption in both PLX-R cells (Figures 2A, B, right panels). Furthermore, DMSO did not induce changes in glucose consumption in all melanoma cell populations (Figures 2A, B).
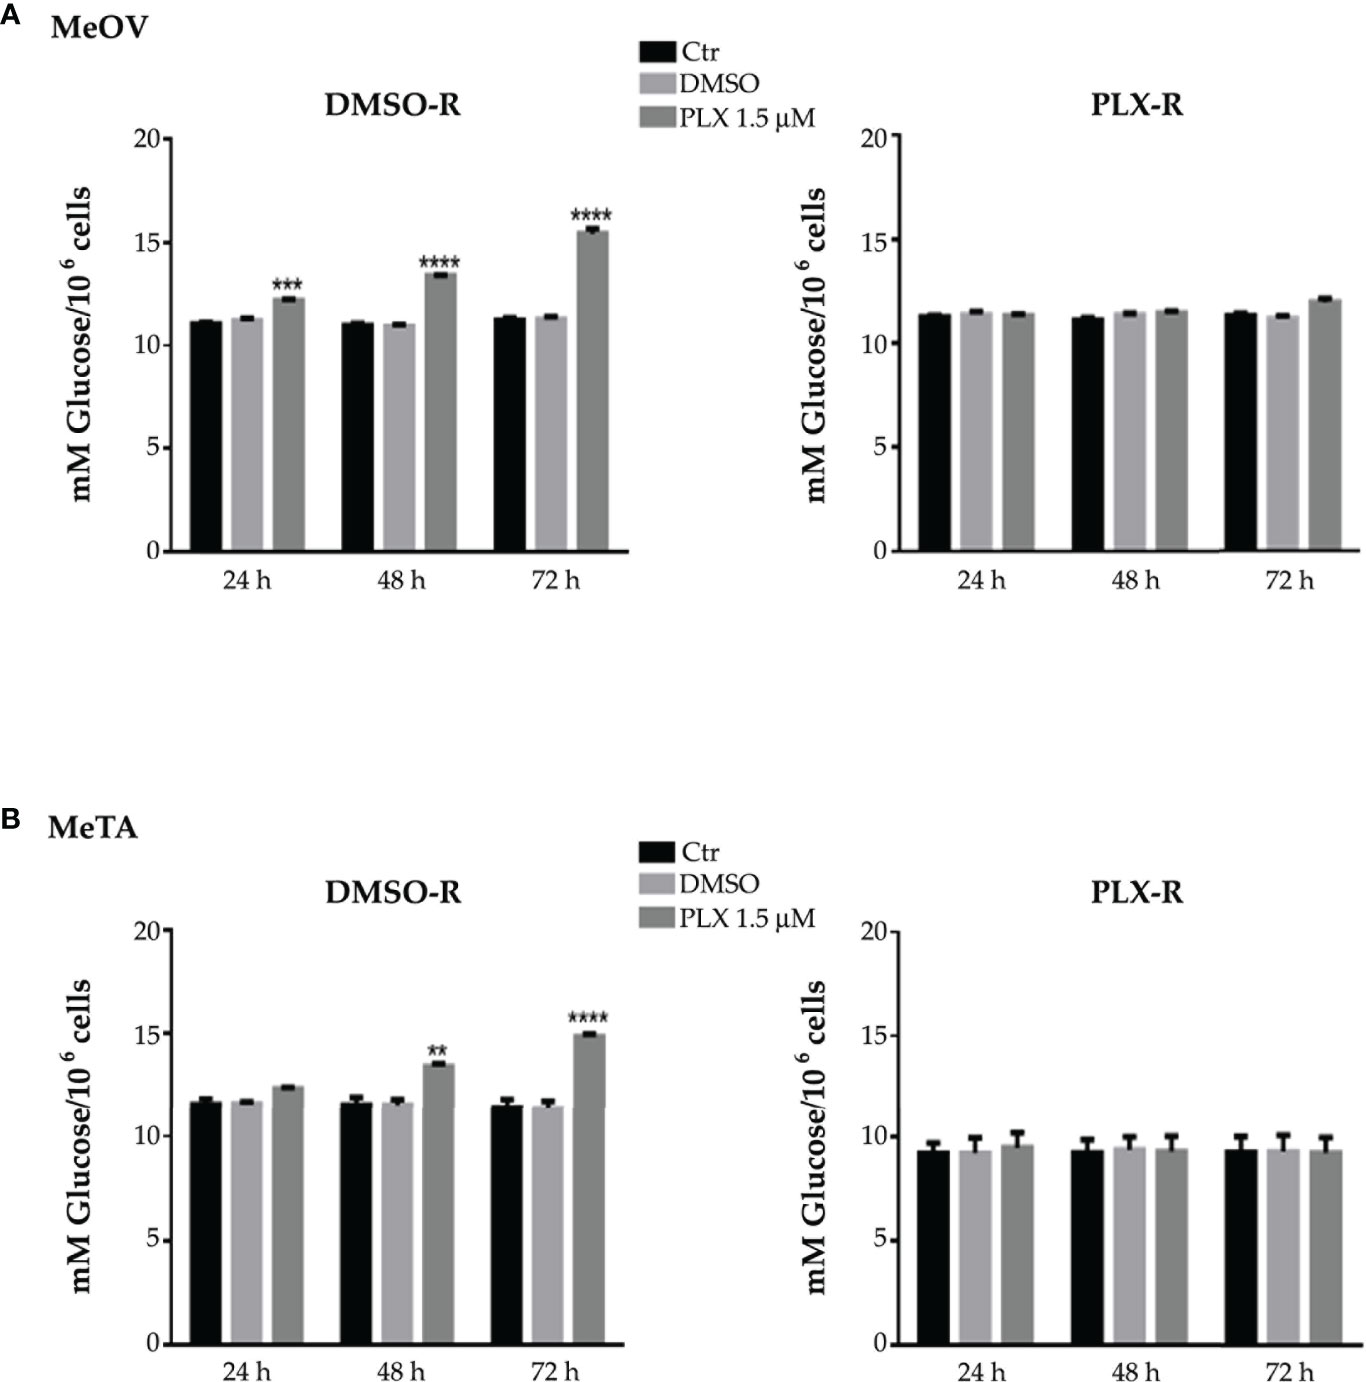
Figure 2 Analysis of glucose consumption in DMSO-R (left panels) and PLX-R (right panels) MeOV (A) and MeTA (B) cells exposed to 1.5 µM PLX4032 or to DMSO for 24, 48 and 72 h. Results were reported as mM glucose/106 cells. Histograms summarize quantitative data of the means ± S.E.M. of four independent experiments. **p<0.01 vs. untreated cells (Ctr); ***p<0.001 vs. untreated cells (Ctr); ****p<0.0001 vs. untreated cells (Ctr).
Since cancer cells consume high levels of glucose to satisfy their energetic need in terms of ATP production through OXPHOS or aerobic glycolysis, the two metabolic pathways were characterized. Initially, ATP synthesis and the oxygen consumption rate (OCR) were analyzed under all treatment conditions, using pyruvate plus malate (P/M) or succinate (succ) to stimulate the pathways led by Complex I or Complex II, respectively.
The values of ATP synthesis (Figure 3A, left panels) and the OCR (Figure 4A, left panels) of DMSO-R MeOV cells were 25% higher than those measured in PLX-R ones (Figures 3A, 4A, right panels) and were not influenced by DMSO treatment (Figures 3A, 4A). Instead, both parameters were comparable in DMSO-R and PLX-R MeTA cells (Figures 3B, 4B) and DMSO exposure did not modify the trend (Figures 3B, 4B).
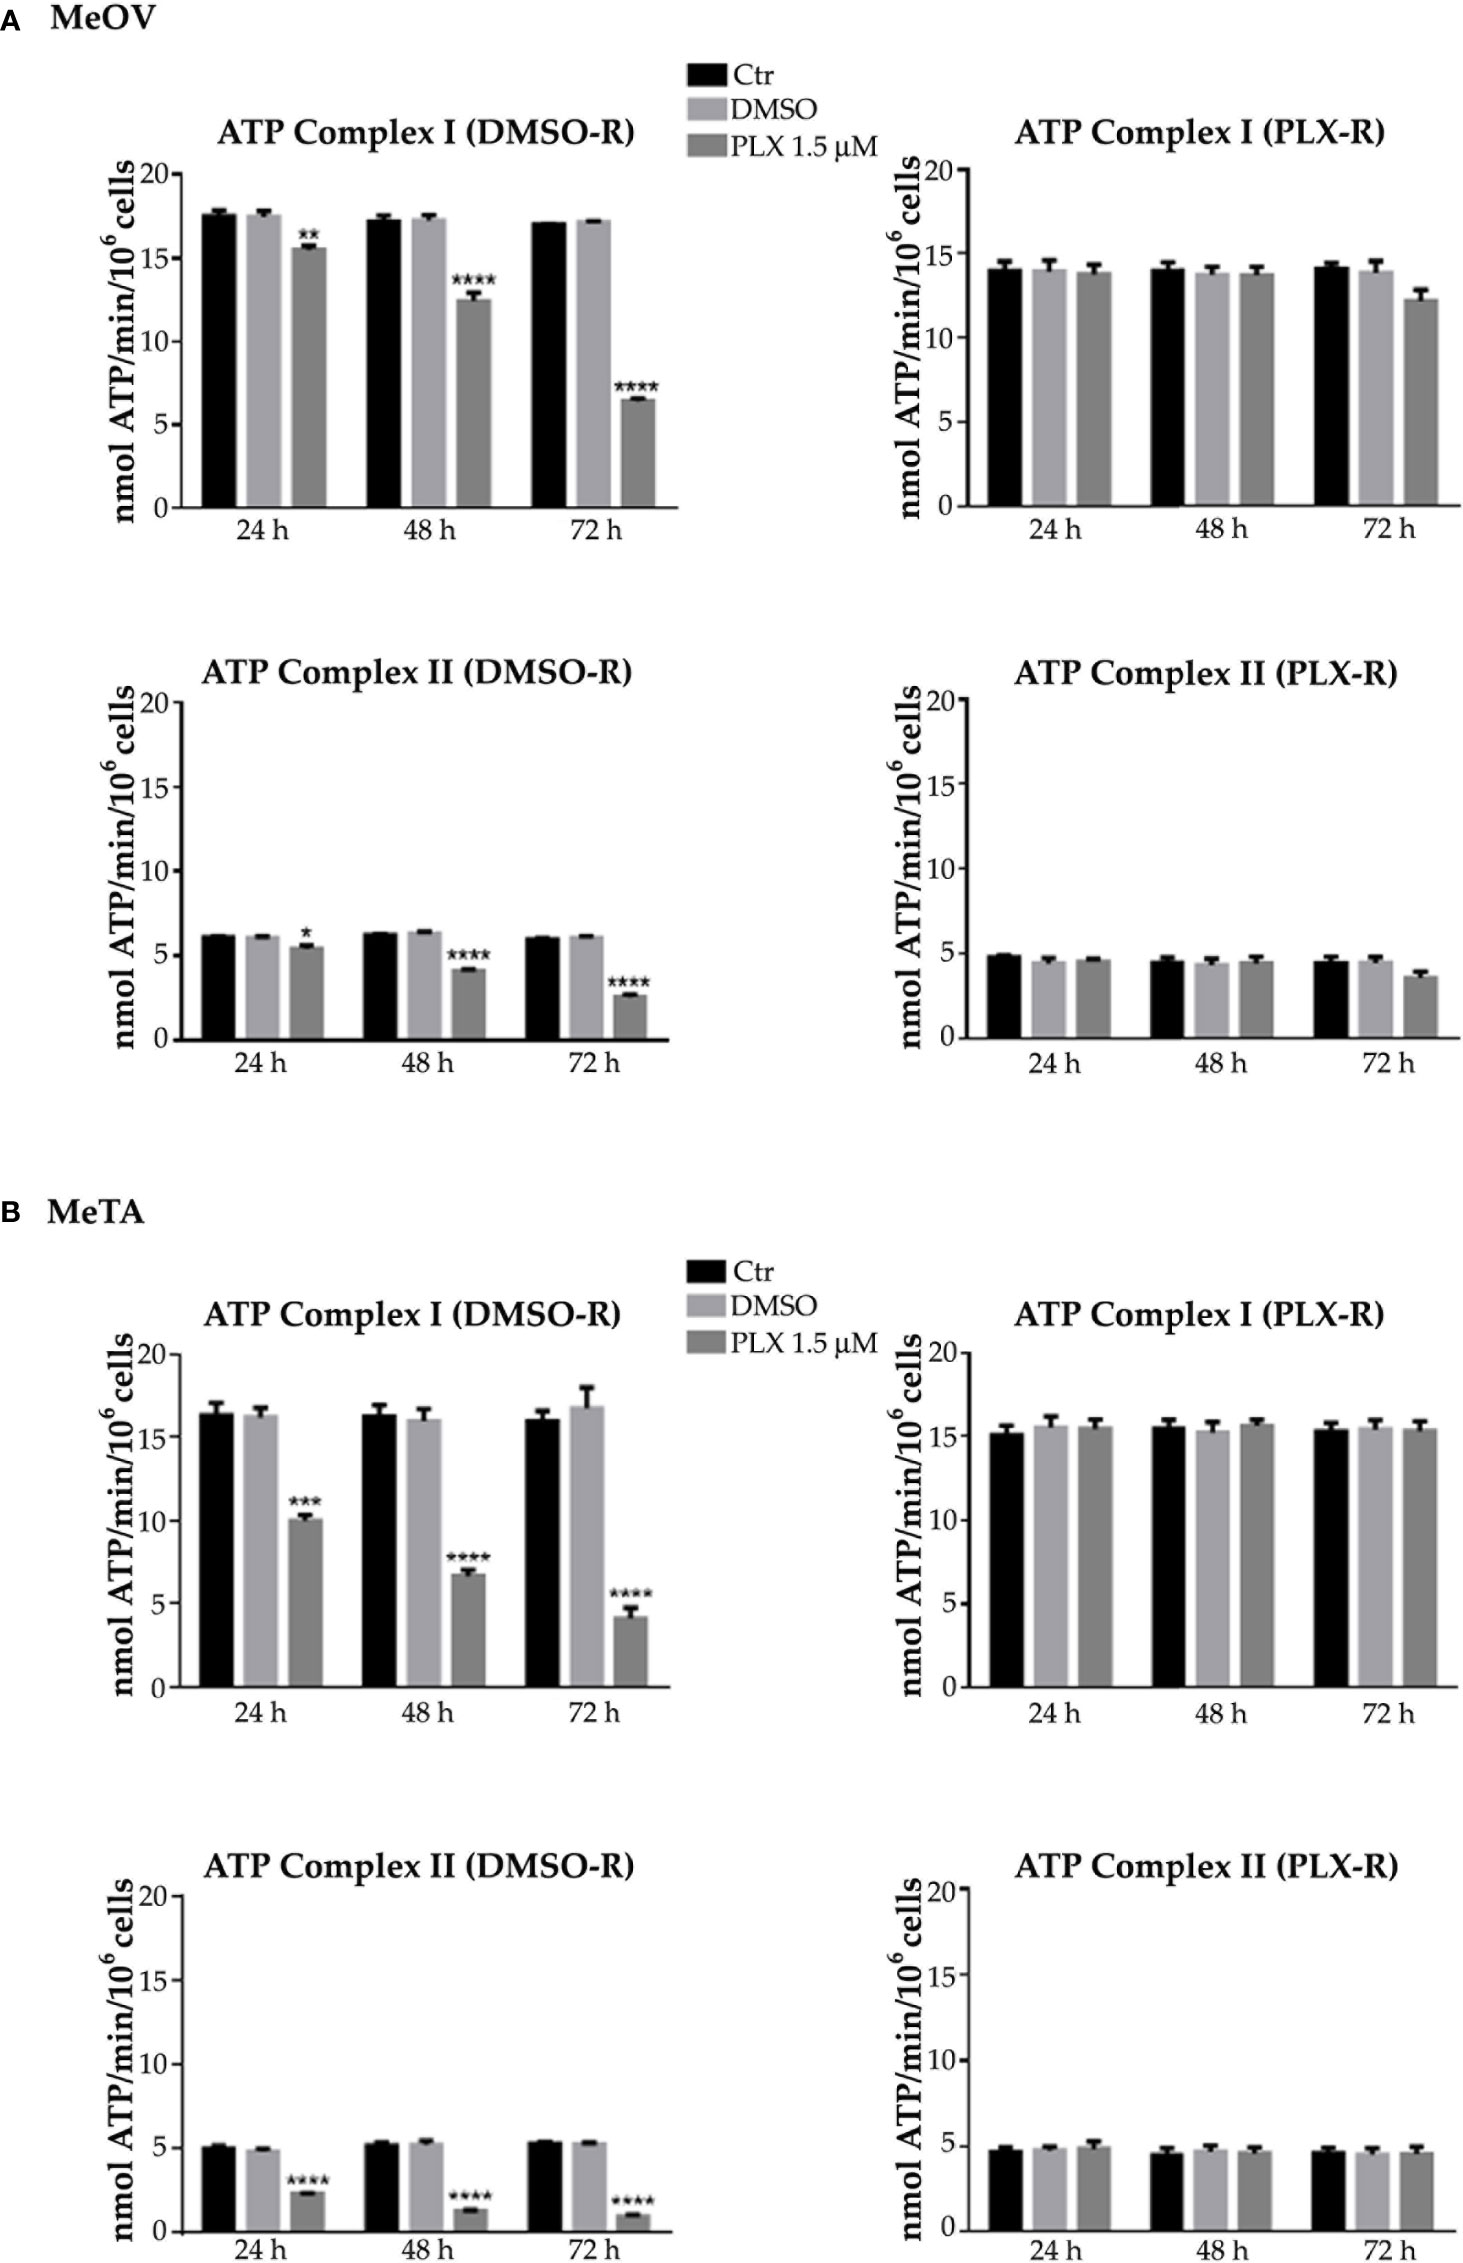
Figure 3 Analysis of ATP synthesis using pyruvate plus malate (P/M, Complex I, upper panels) or succinate (succ, Complex II, lower panels) in DMSO-R (left panels) and PLX-R (right panels) MeOV (A) and MeTA (B) cells exposed to 1.5 µM PLX4032 or to DMSO for 24, 48 and 72 h. Results were reported as nmol ATP/min/106 cells. Histograms summarize quantitative data of the means ± S.E.M. of four independent experiments. *p<0.1 vs. untreated cells (Ctr); **p<0.01 vs. untreated cells (Ctr); ***p<0.001 vs. untreated cells (Ctr); ****p<0.0001 vs. untreated cells (Ctr).
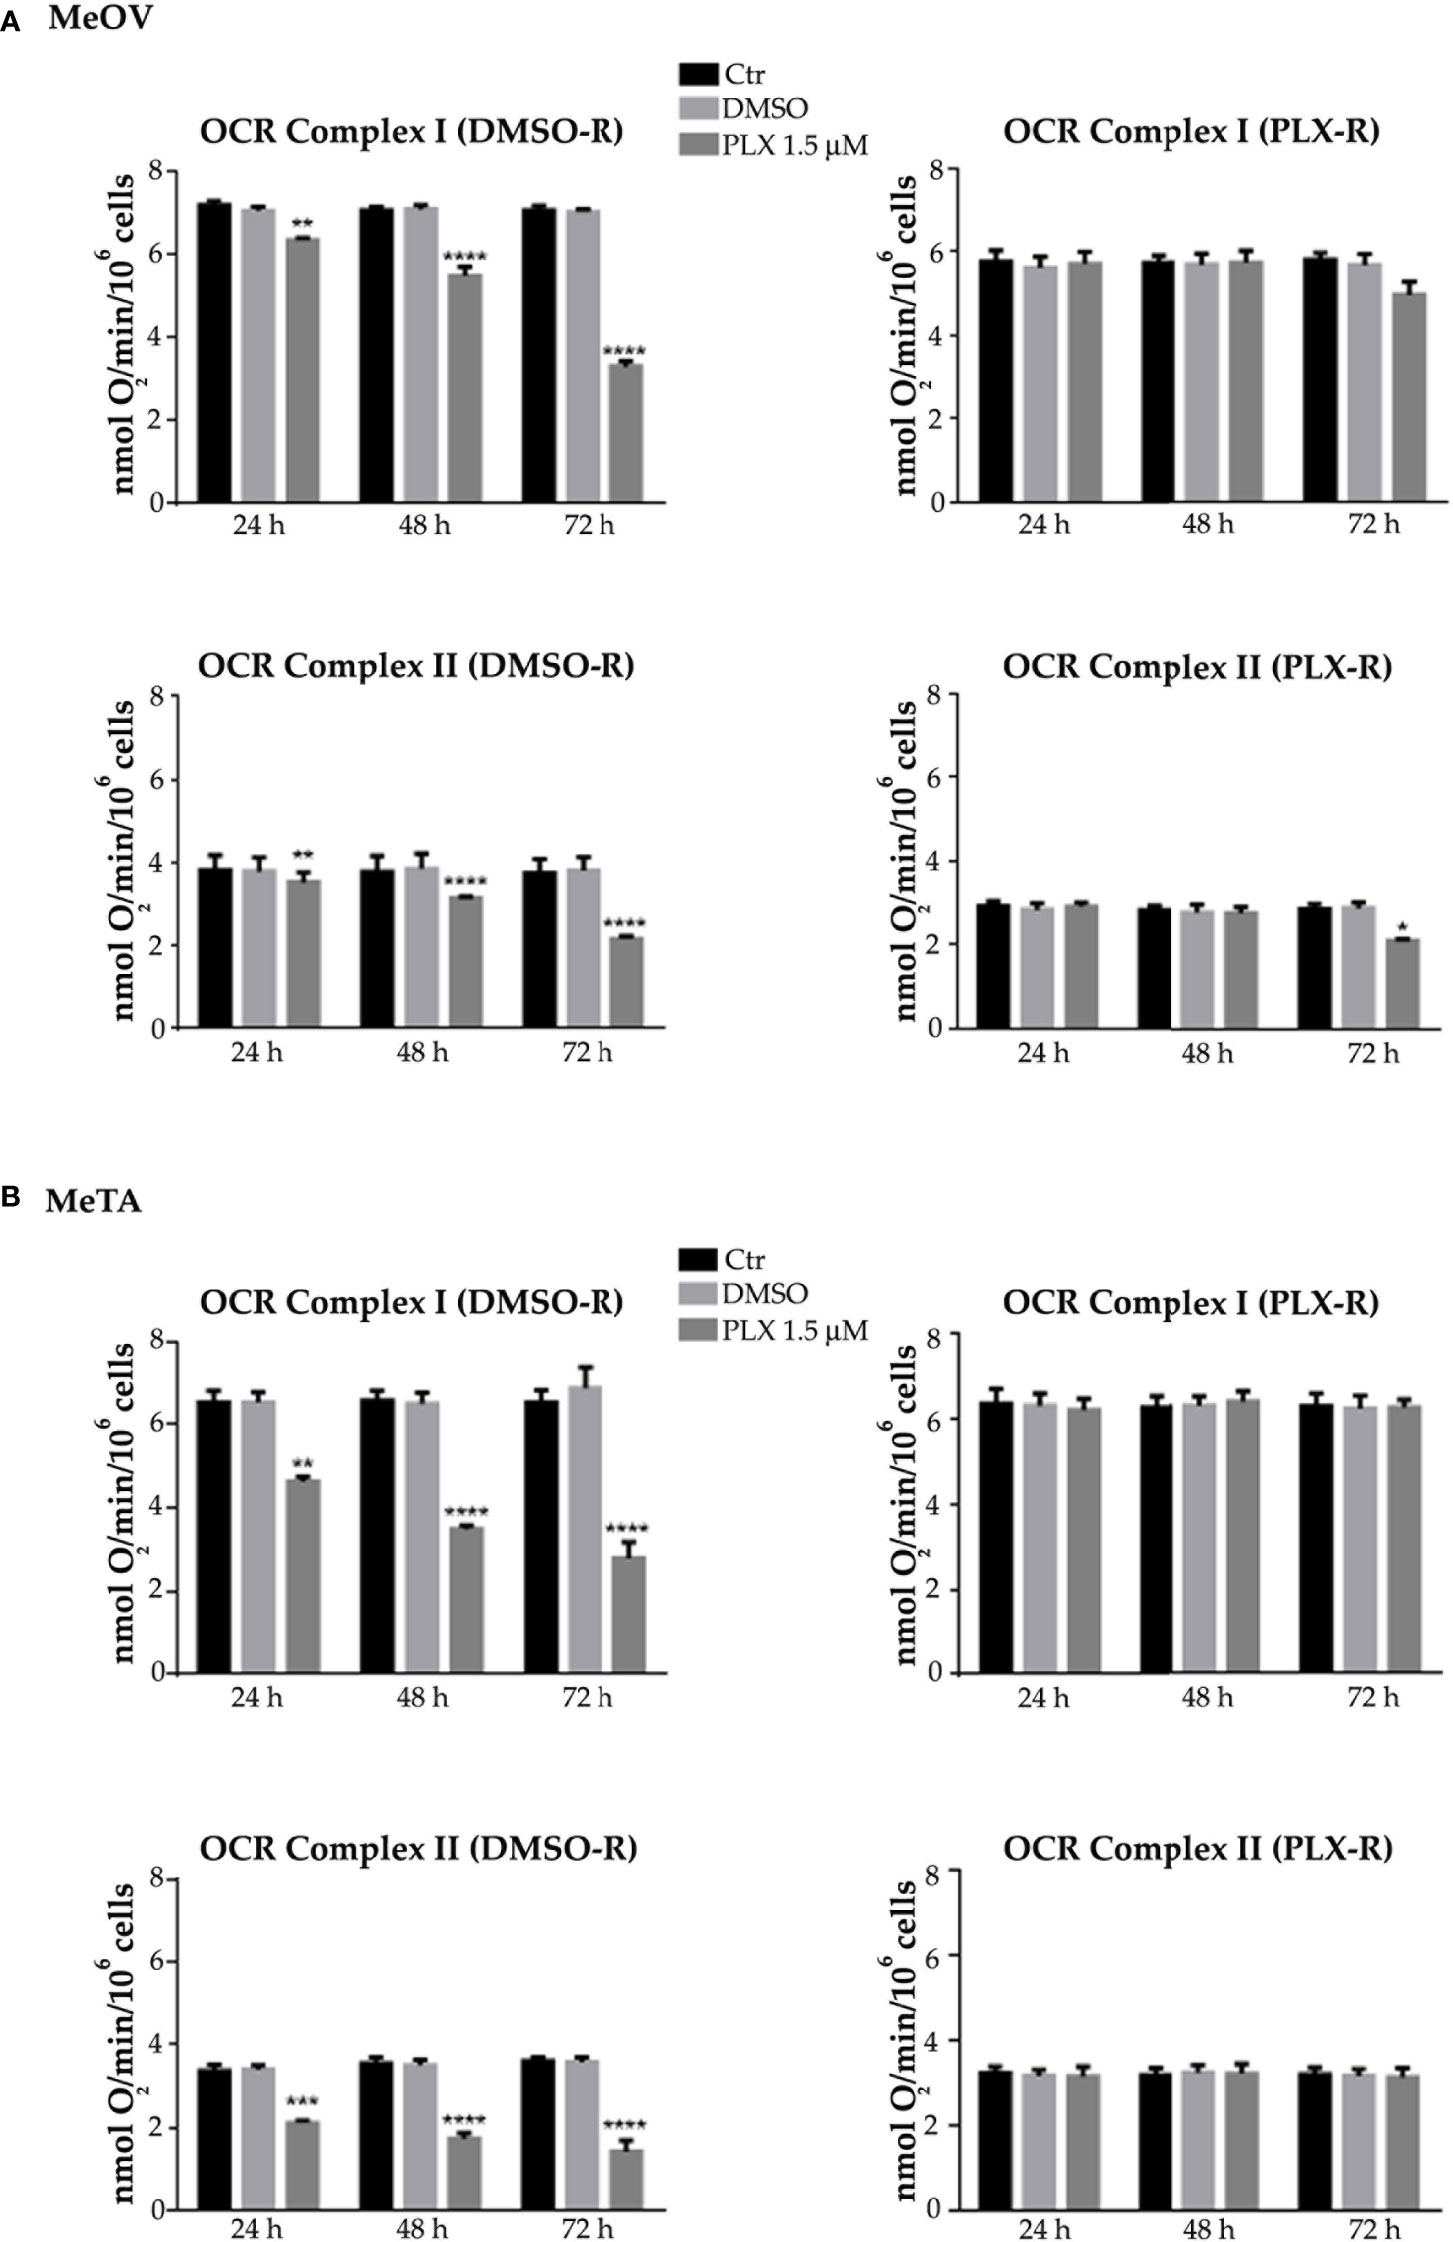
Figure 4 Analysis of oxygen consumption rate (OCR) using pyruvate plus malate (P/M, Complex I, upper panels) or succinate (succ, Complex II, lower panels) in DMSO-R (left panels) and PLX-R (right panels) MeOV (A) and MeTA (B) in cells exposed to 1.5 µM PLX4032 or to DMSO for 24, 48 and 72 h. Results were reported as nmol O2/min/106 cells. Histograms summarize quantitative data of the means ± S.E.M. of four independent experiments. **p<0.01 vs. untreated cells (Ctr); ***p<0.001 vs. untreated cells (Ctr); ****p<0.0001 vs. untreated cells (Ctr).
As shown in Figure 3 and 4 (left panels), 1.5 μM PLX reduced ATP synthesis and OCR by both DMSO-R cell populations, in a time-dependent manner and more markedly in MeTA cells. In detail, in DMSO-R MeOV cells, PLX at the longest time of treatment (72 h) reduced P/M-induced ATP synthesis by 47% and succ-induced ATP synthesis by 58% (Figure 3A, left panels) while OCR-linked to Complex I and Complex II pathways were decreased by 57% and 42%, respectively (Figure 4A, left panels). In DMSO-R MeTA cells, 72 h PLX exposure reduced P/M-induced ATP synthesis by 75% and succ-induced ATP synthesis by 82% (Figure 3B, left panels), while OCR-linked Complex I and Complex II pathways were decreased by 57% and 55%, respectively (Figure 4B, left panels).
Notably, no changes in ATP synthesis and OCR were recorded in both PLX-R melanoma cells under the same conditions of treatment (Figures 3, 4, right panels).
Moreover, the efficiency of the OXPHOS was evaluated by calculating the P/O ratio expressed as the ratio between the concentration of the synthesized ATP and the amount of consumed oxygen in the presence of respiring substrates and ADP. Under physiological conditions, when the oxygen consumption is completely devoted to the energy production, P/O ratio should be around 2.5 and 1.5 after pyruvate/malate or succinate addition, respectively (26). As shown in Table 3, in untreated (Ctr) and DMSO-treated DMSO-R melanoma cells, the P/O ratio was comparable to the physiological level (26) during all time-range analyzed (24, 48 and 72 h). However, in DMSO-R MeOV cells, 24 h PLX4032 exposure did not alter P/O ratio that reached a 18.7% reduction, associable with a partial OXPHOS uncoupling, after 72 h PLX4032 treatment. In DMSO-R MeTA cells, PLX4032 reduced P/O ratio by 23% and 40% after 48 and 72 h respectively, leading to OXPHOS uncoupling. Instead, in both PLX-R melanoma cells, PLX4032 or DMSO exposure did not induce changes in P/O ratio which was always maintained at the physiological level (Table 3).
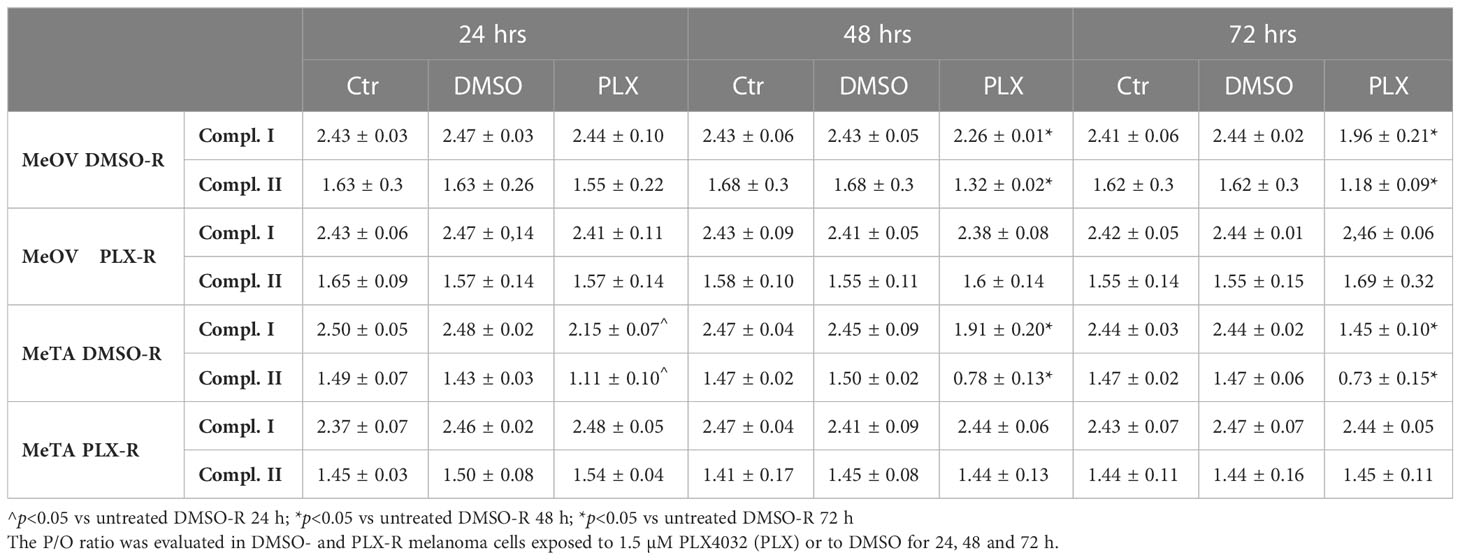
Table 3 P/O ratio.
In addition, as shown in Figure 5, untreated DMSO-R and PLX-R melanoma cells had comparable ATP/AMP ratio, at all three analyzed timepoints (24, 48 and 72 h). DMSO exposure did not influence the ATP/AMP ratio in DMSO-R and PLX-R cells. Following acute PLX4032 treatment DMSO-R (MeOV and MeTA) cells displayed a time-dependent decrease in intracellular ATP and an increase in AMP levels (Supplementary Table 1) leading to a 70% reduction of ATP/AMP ratio after 72 h in comparison to untreated cells (Figure 5, left panel). Instead, acute PLX4032 treatment of both PLX-R cells was able to keep constant the ATP/AMP ratio since it did not modify ATP and AMP levels (Figure 5, Supplementary Table 1). Only 72 h PLX4032 exposure reduced the ratio by 20% in PLX-R MeOV cells (Figure 5A, right panel).
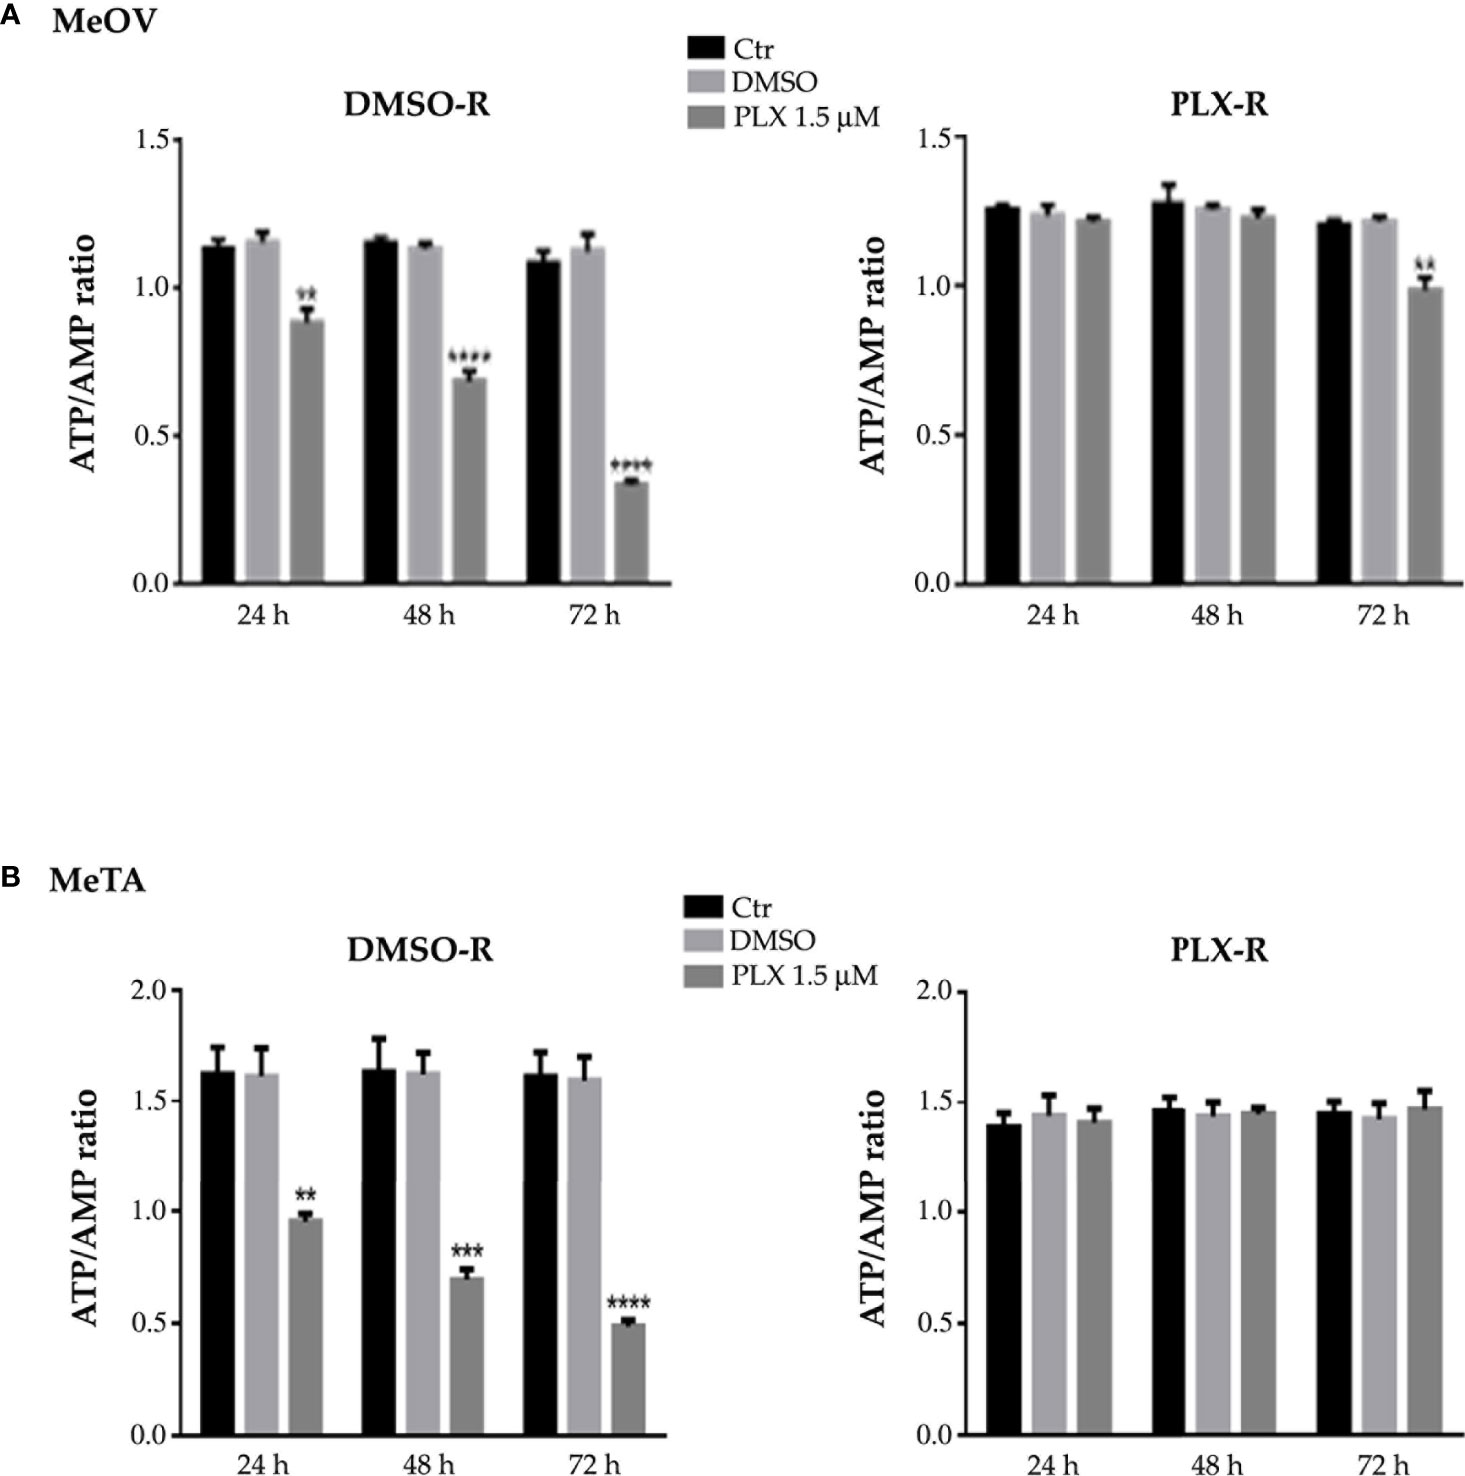
Figure 5 Analysis of ATP and AMP content in DMSO-R (left panels) and PLX-R (right panels) MeOV (A) and MeTA (B) melanoma cells, exposed to 1.5 µM PLX4032 or to DMSO for 24, 48 and 72 h. Histograms summarize quantitative data of the means ± S.E.M. of four independent experiments. **p<0.01 vs. untreated cells (Ctr); ***p<0.001 vs. untreated cells (Ctr); ****p<0.0001 vs. untreated cells (Ctr).
3.3 PLX4032 resistant melanoma cells are able to maintain an increased PDH activity and high levels of GSH
In order to better investigate the energetic metabolism, the lactate release and LDH activity were analyzed.
In PLX4032-treated DMSO-R melanoma cells the lactate release and LDH activity increased in a time-dependent manner (Figures 6A, B, left panels) instead, in PLX4032-treated PLX-R cells no statistical increase was observed (Figures 6A, B, right panels). Notably, DMSO did not induce changes in all cell populations (Figures 6A, B).
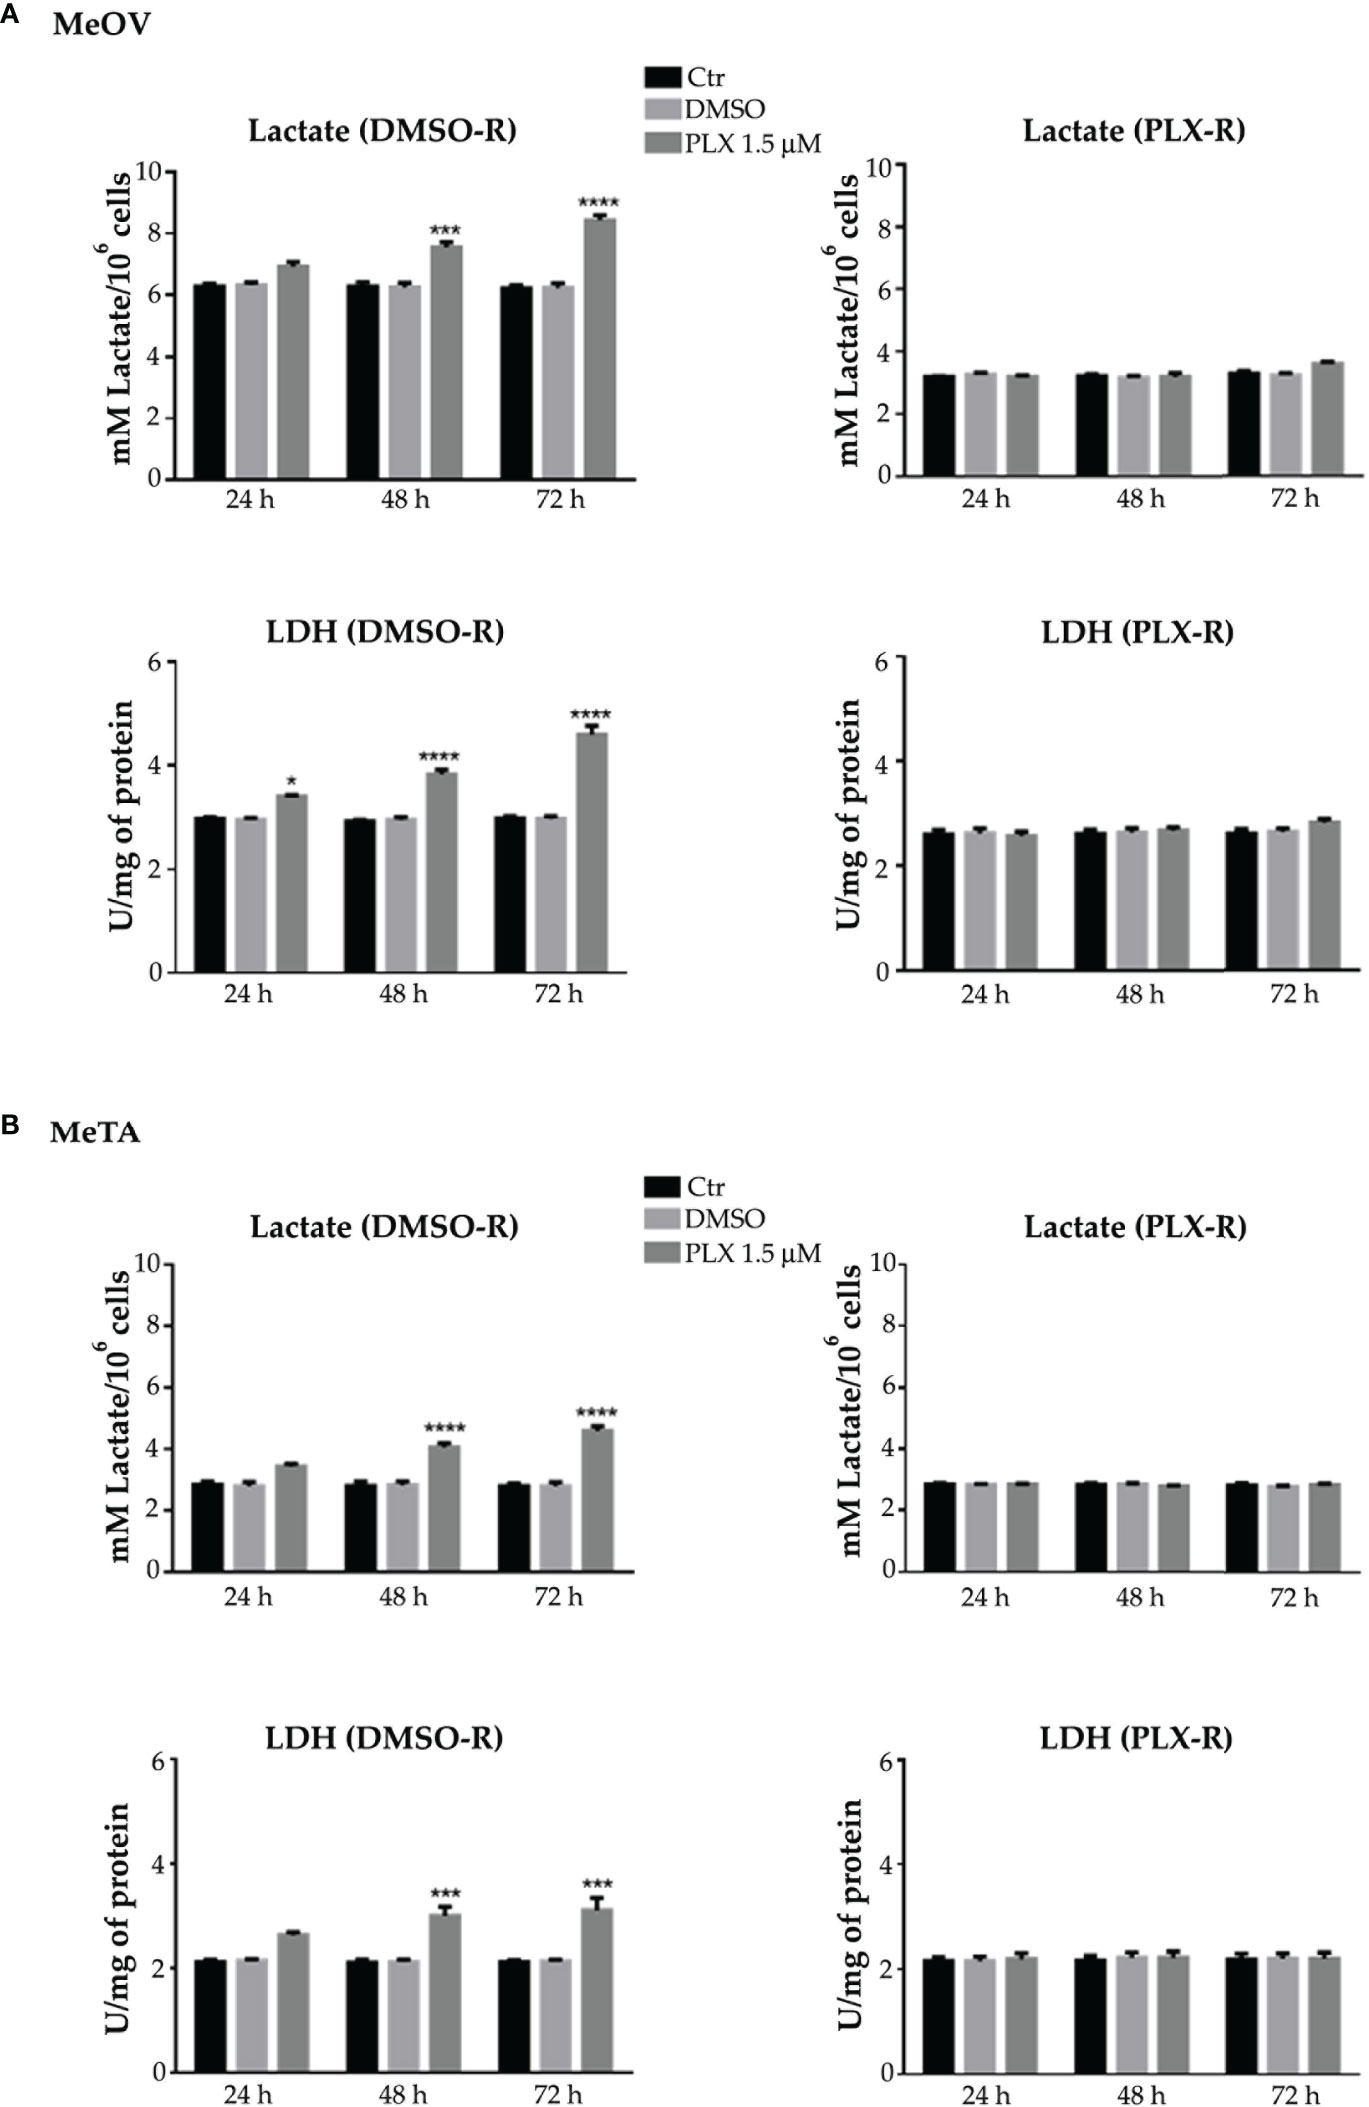
Figure 6 Analysis of extracellular lactate concentration and lactate dehydrogenase activity (LDH) in DMSO-R (left panels) and PLX4032-R (right panels) MeOV (A) and MeTA (B) exposed to 1.5 µM PLX4032 or DMSO for 24, 48 and 72 h. Results were reported as mM lactate/106 cells for lactate release and as U/mg (lactate μmol/min/mg of total protein) for LDH activity. Histogram summarizes quantitative data of the means ± S.E.M. of four independent experiments. *p<0.1 vs. untreated cells (Ctr); ***p<0.001 vs. untreated cells (Ctr); ****p<0.0001 vs. untreated cells (Ctr).
Moreover, NADH and NAD+ levels were analyzed and the NAD+/NADH ratio was calculated. As reported in Figure 7, 48 and 72 h PLX4032 treatment increased the ratio by approximately 185% and 230% in DMSO-R MeOV cells respectively (A, left panel) and by 30% and 65% in DMSO-R MeTA cells (B, left panel). Instead, in both PLX4032-treated PLX-R cells the NAD+/NADH ratio showed no significant changes (Figures 7A, B, right panels).
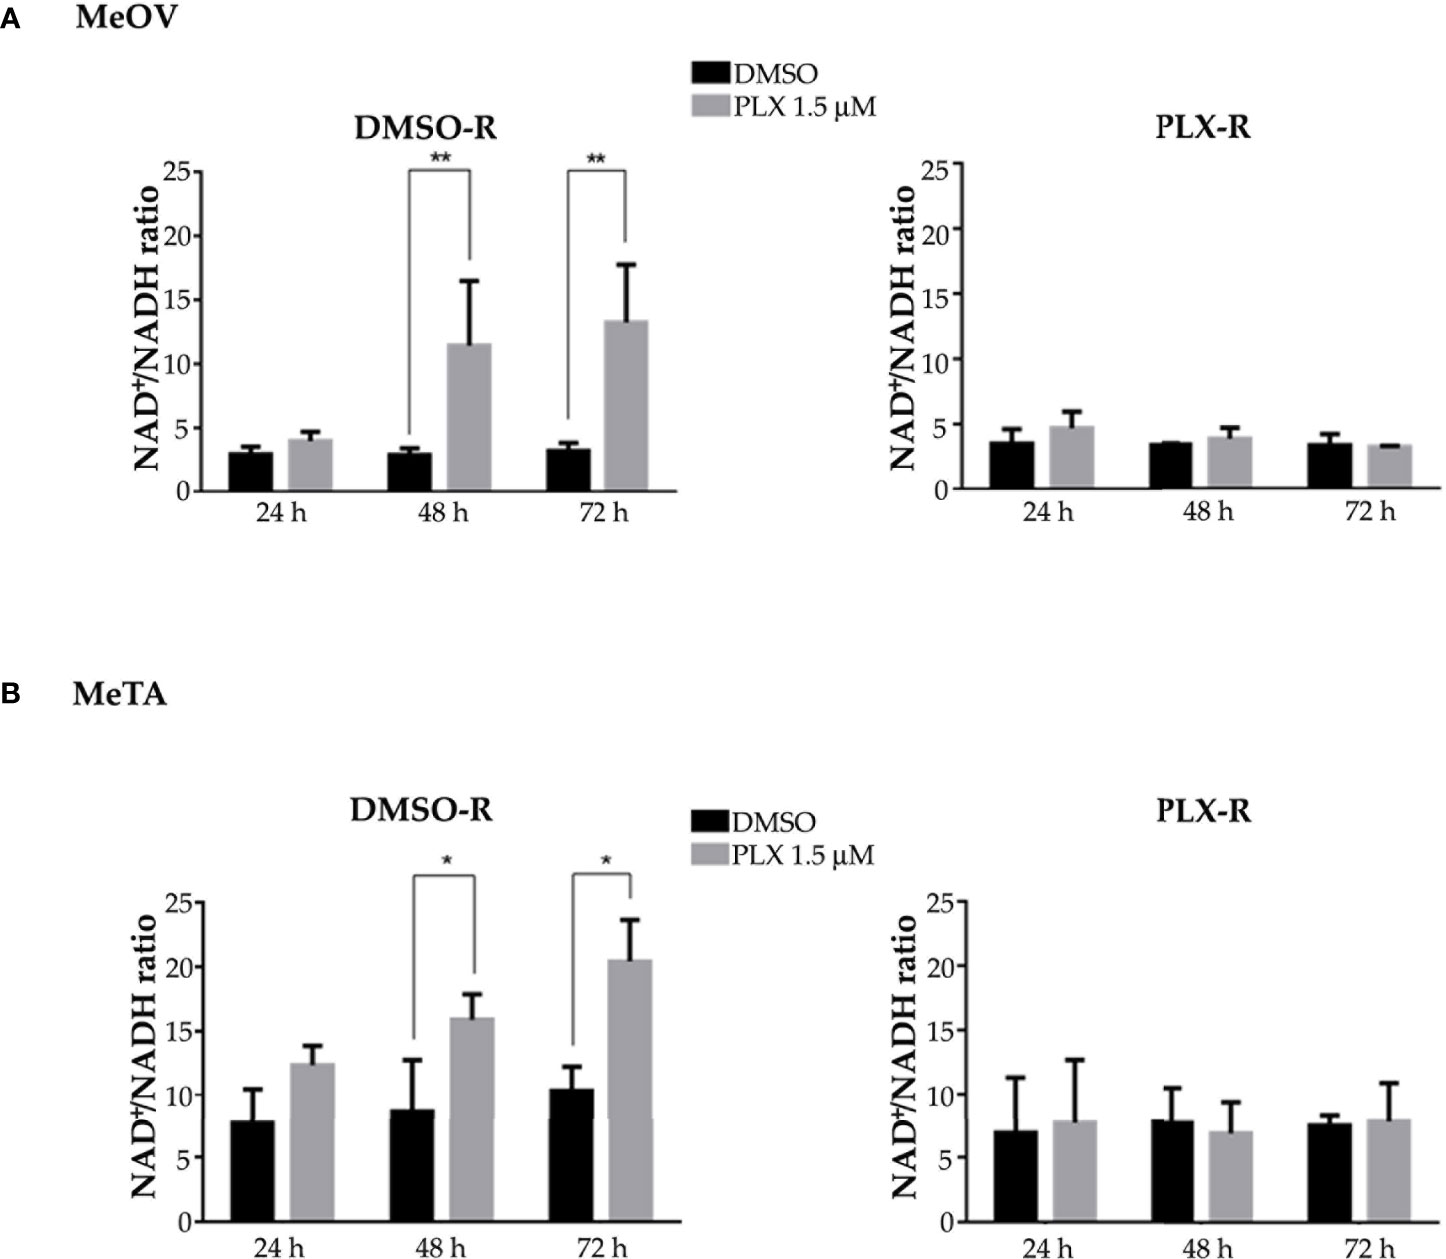
Figure 7 Evaluation of NAD+/NADH ratio in DMSO-R (left panels) and PLX-R (right panels) Me-OV (A) and MeTA (B) melanoma cells, exposed to 1.5 µM PLX4032 or to DMSO for 24, 48 and 72 h. Histograms summarize quantitative data of the means ± S.E.M. of four independent experiments. *p<0.1 vs. untreated cells (Ctr); **p<0.01 vs. untreated cells (Ctr).
Taking into consideration the different energetic metabolism of DMSO-R and PLX-R melanoma cells, the activity of PDH, the enzyme able to convert pyruvate to acetyl-CoA (27), was analyzed. Accordingly, to NAD+/NADH ratio, PDH activity was reduced by 50% in both DMSO-R cells after 72 h PLX4032 exposure while it was maintained constant in treated and untreated PLX-R cells (Figures 8A, B). Analysis of PDH protein expression shows that both PLX-R cell populations had higher levels of the enzyme compared to DMSO-R ones (Figures 8A, B). Moreover, to better investigate the role of PDH in PLX4032 resistance, both DMSO-R cells were pre-treated for 2 h with DCA, an inhibitor of pyruvate dehydrogenase kinase thus representing a PDH activator, and then exposed to PLX4032 for additional 70 h. Interestingly, the pre-treatment with 25 mM or 50 mM DCA increased the cell viability of both DMSO-R cells by 50% and 68%, respectively, in comparison with 1.5 μM PLX-treated ones (Figure 8C) and by 100% and 120% respectively, compared to 5 μM PLX-treated ones (Figure 8C).
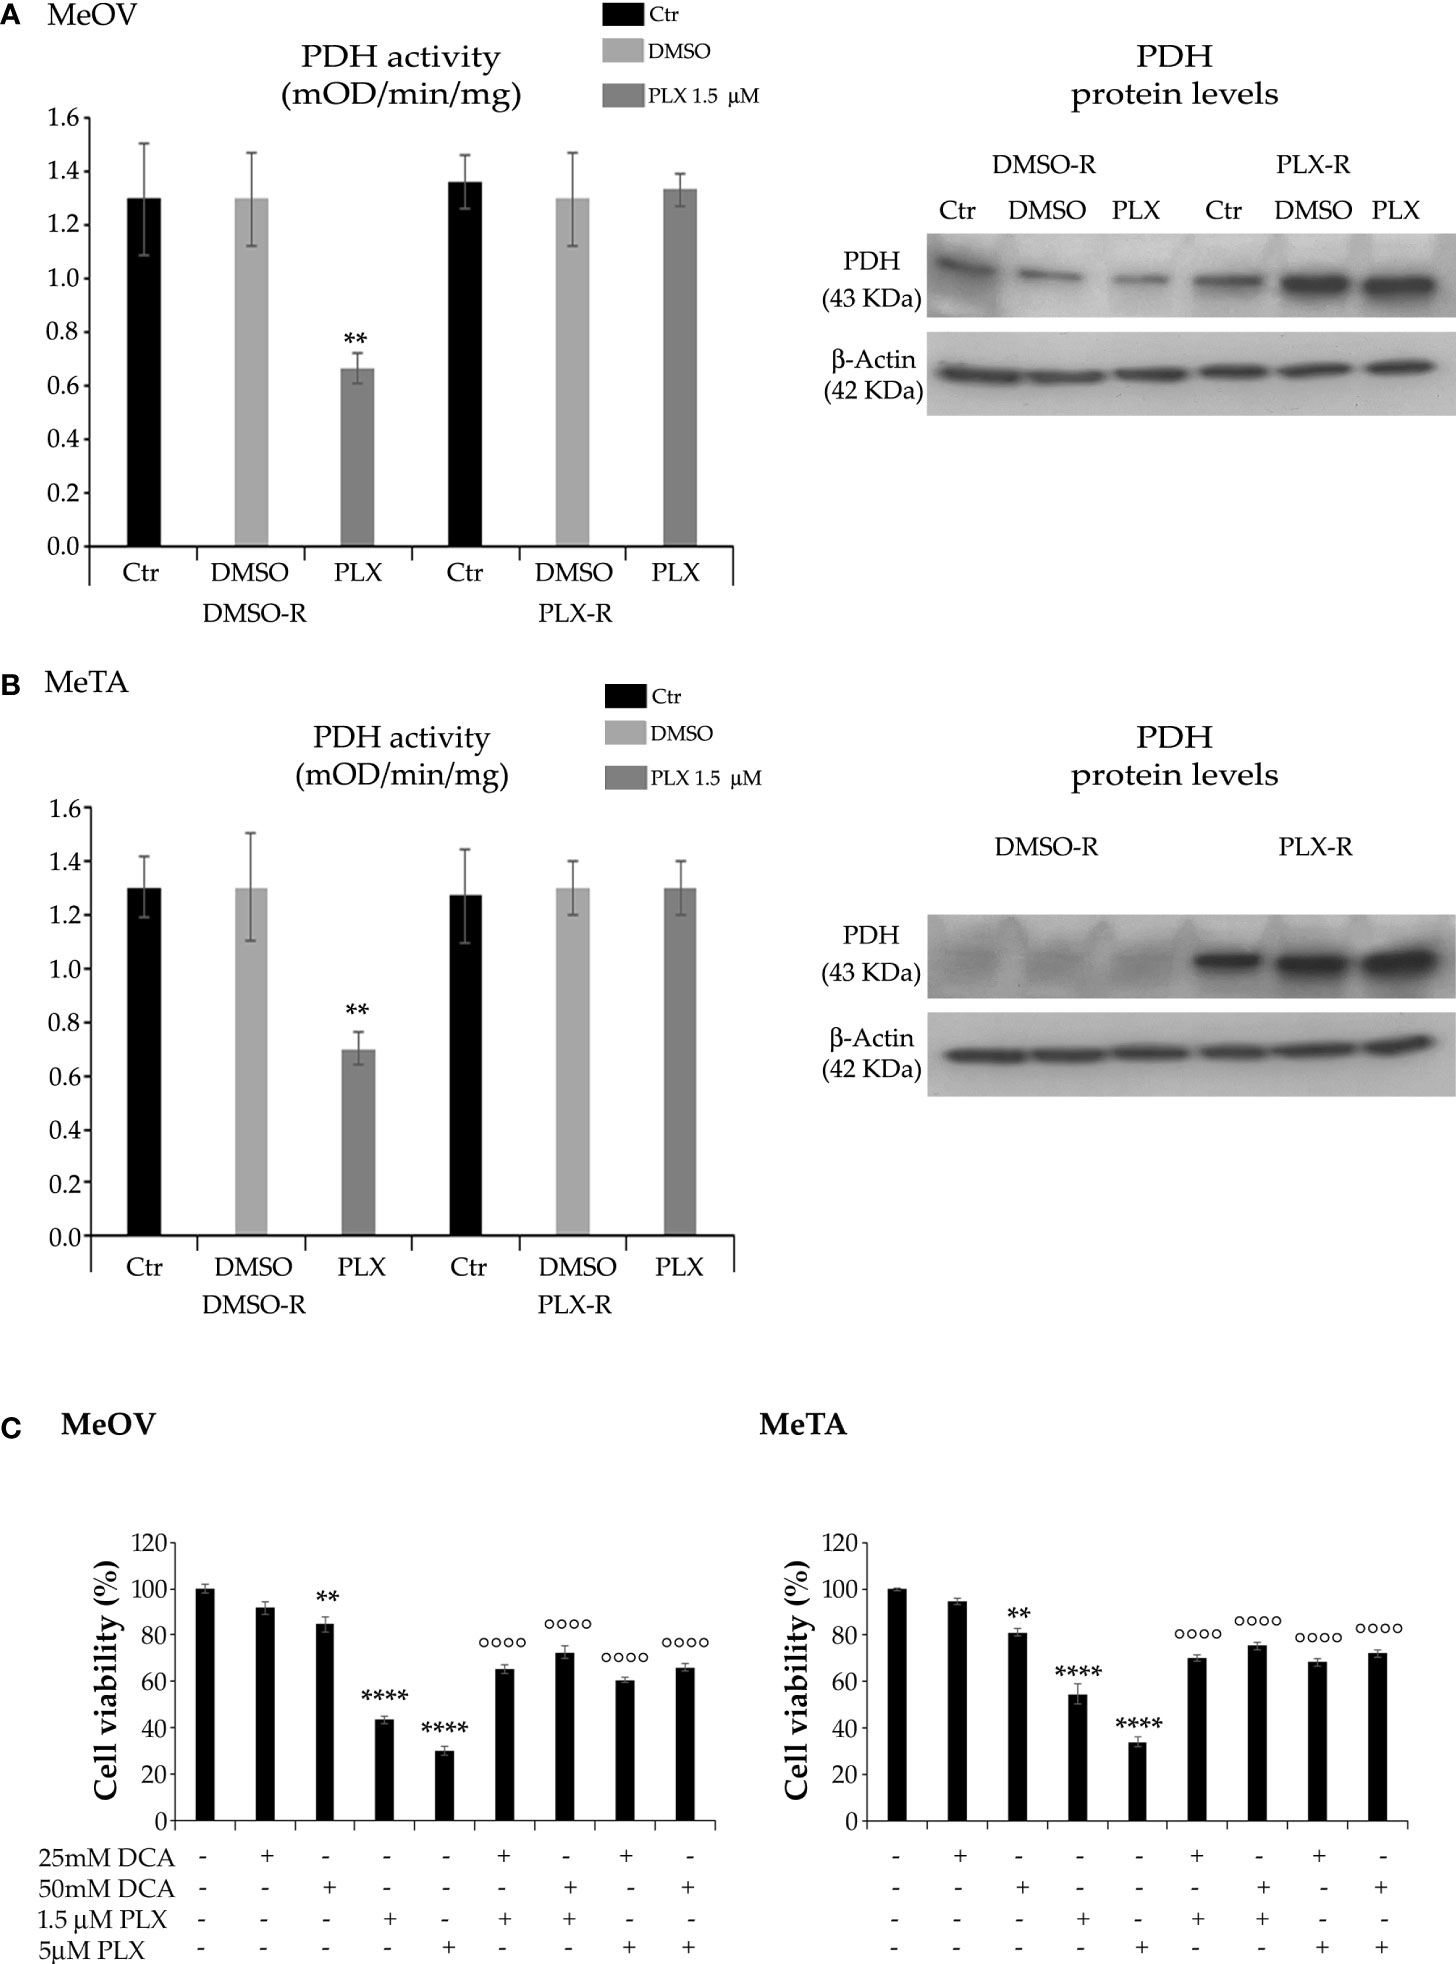
Figure 8 Analysis of PDH activity (left panels) and protein levels (right panels) in DMSO-R and PLX4032-R MeOV (A) and MeTA (B) melanoma cells treated with 1.5 µM PLX4032 or with DMSO for 72 h. Results were expressed as mOD/min/mg protein. Immunoblots shown are representative of three independent experiments. β-Actin is the internal loading control. (C) DCA pre-treatment of DMSO-R cells reduces the cytotoxic effect of PLX4032. Cell viability was determined by MTT assays in MeOV (left panel) and MeTA (right panel) cells pre-treated for 2 h with 25mM or 50 mM DCA and then exposed for additional 70 h to 1.5 μM or 5 μM PLX4032. Histograms summarize quantitative data of the means ± S.E.M. of four independent experiments. **p<0.01 vs. untreated cells (Ctr); ****p<0.0001 vs. untreated cells (Ctr); °°°° p<0.0001 vs. PLX-4032-treated cells.
Furthermore, to characterize the different metabolic profile, the redox state was investigated in terms of ROS production (28, 29) and GSH levels under all treatment conditions. As shown in Figure 9, PLX4032 treatment enhanced ROS levels in both DMSO-R cells (Figure 9B, left panel). Instead, no change in ROS production was observed in PLX-R cells under the same treatment conditions (Figures 9A, B, right panels).
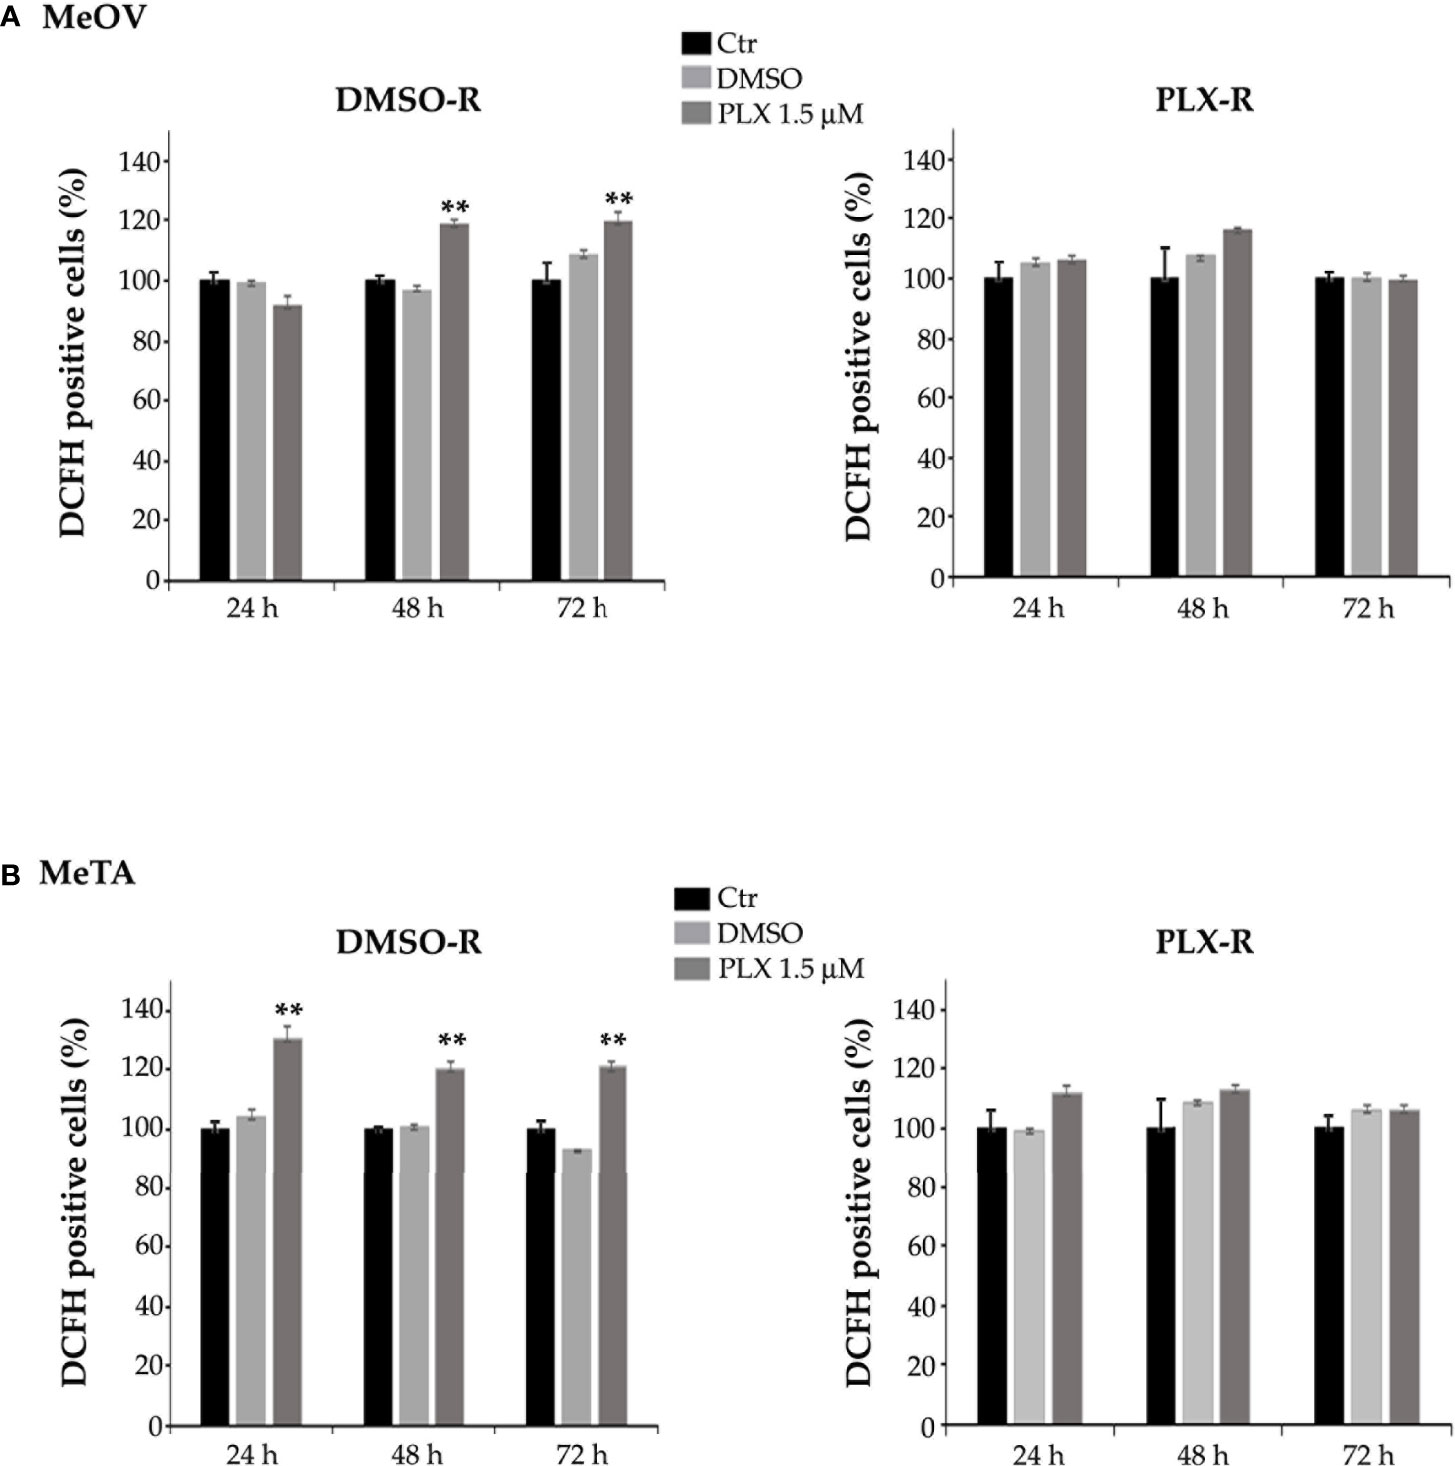
Figure 9 Analysis of ROS production in DMSO-R (left panels) and PLX4032-R (right panels) MeOV (A) and MeTA (B) melanoma cells, exposed to 1.5 µM PLX4032 or to DMSO for 24, 48 and 72 h. Histograms summarize quantitative data of the means ± S.E.M. of four independent experiments. **p<0.01 vs. untreated cells (Ctr).
With regard to GSH levels, as shown in Figure 10, both PLX-R cells displayed a markedly higher content of GSH in respect to DMSO-R cells (p<0.01). Interestingly, under the conditions characterized by the enhanced ROS production, a reduction of GSH levels was not observed. Instead, a significant increase of GSH levels was detected in DMSO-R Me-OVcells after 72 h PLX4032 exposure (Figure 10A). Moreover, to confirm the role of GSH in drug resistance, both DMSO-R cells were pre-treated for 2 h with 2 mM or 4 mM NAC, an aminothiol and synthetic precursor of intracellular cysteine, and then exposed to PLX4032 for additional 70 h. The pre-treatment with 2 μM or 4 μM NAC increased the cell viability of both DMSO-R cells by 63% and 79%, respectively, in respect to 1.5 μM PLX-treated ones (Figure 10C) and by 116% and 146% respectively, compared to 5 μM PLX-treated cells (Figure 10C).
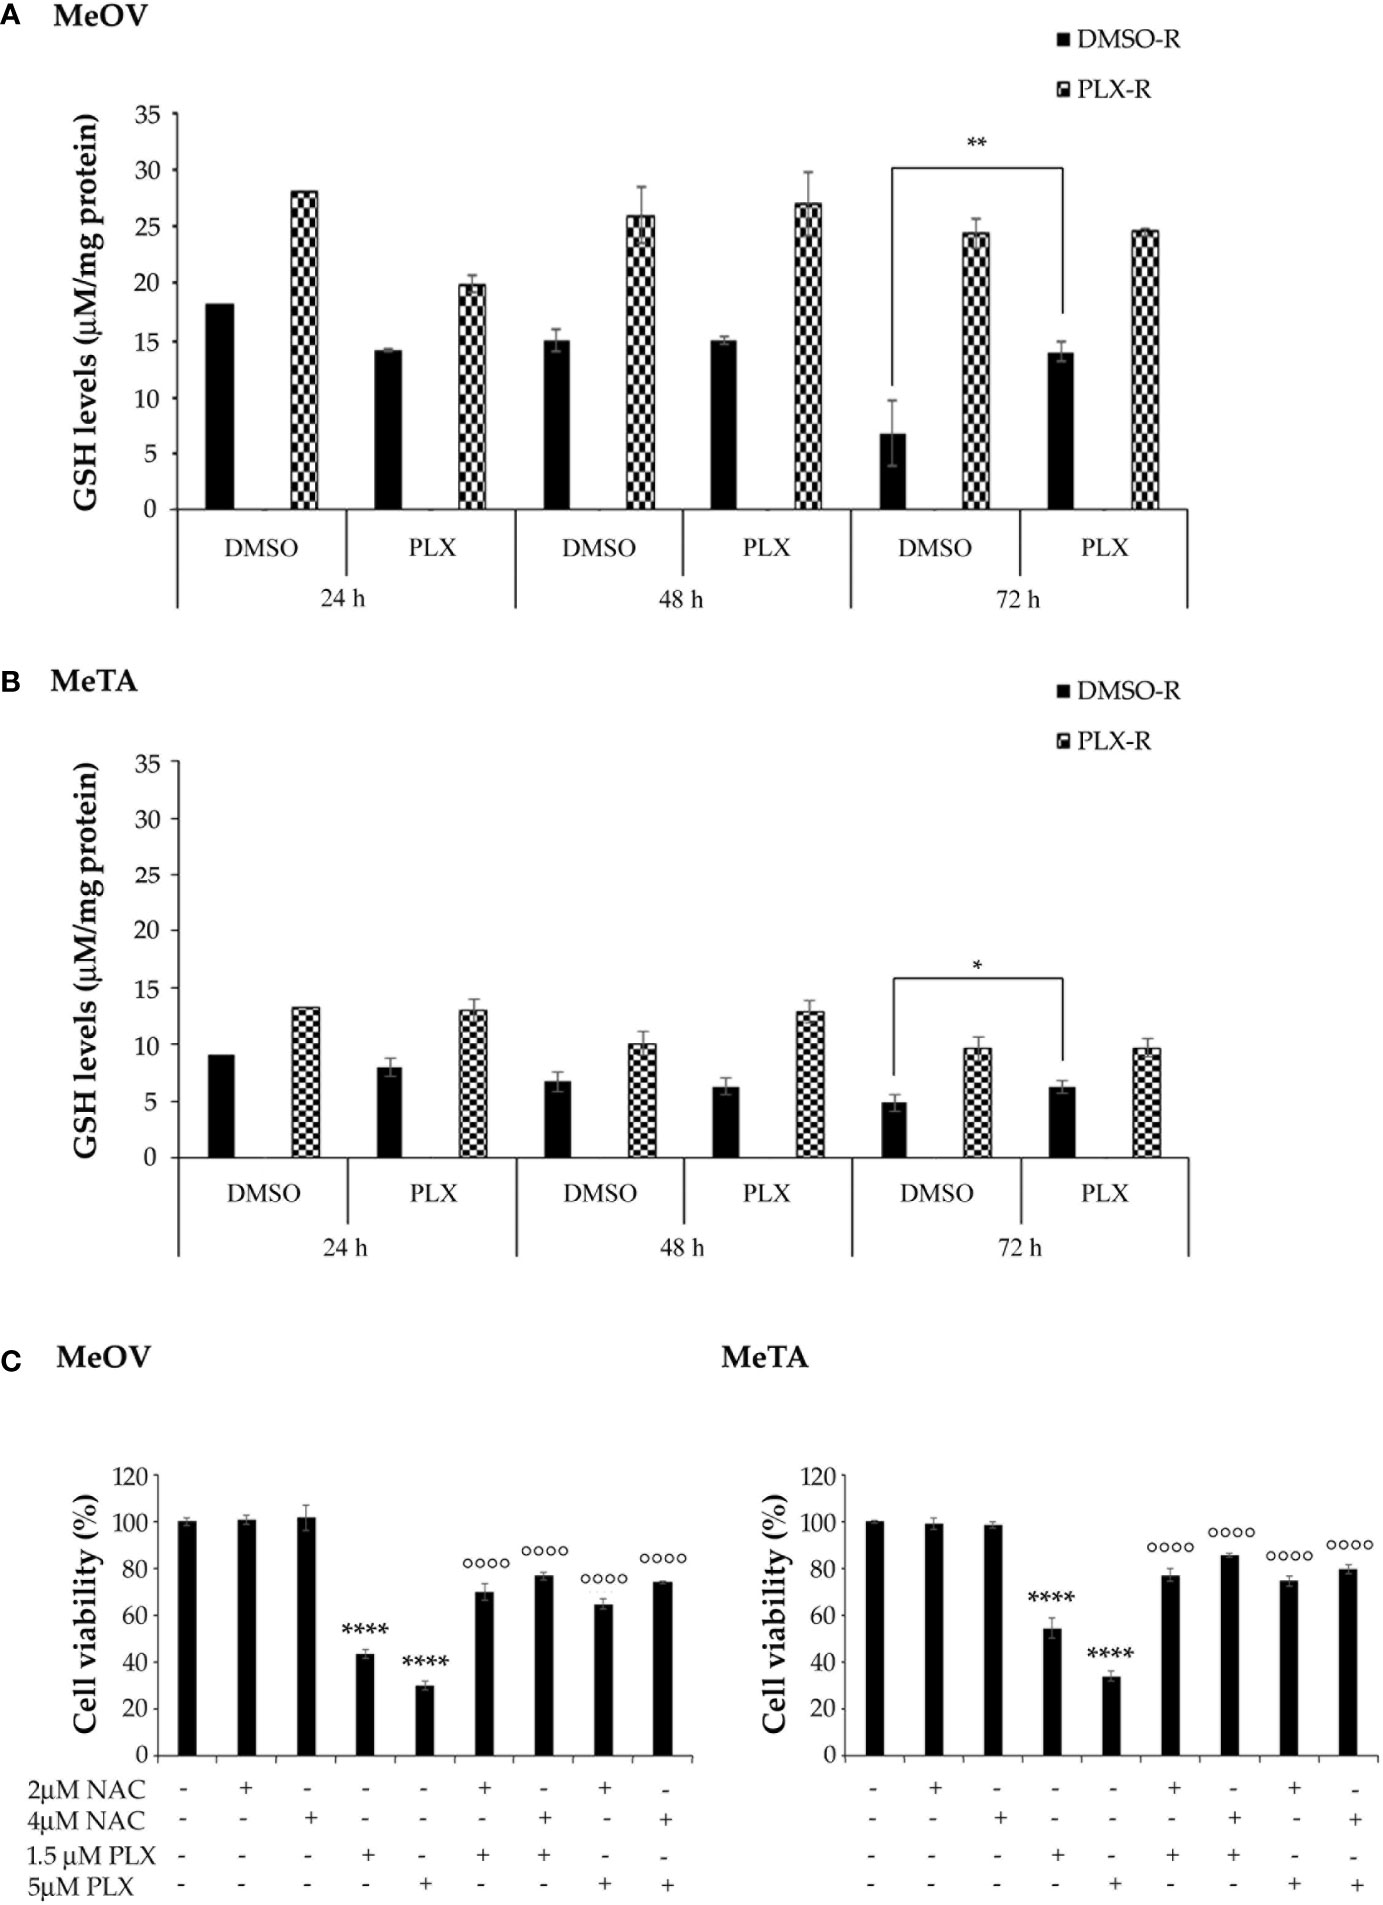
Figure 10 Analysis of total GSH levels in DMSO-R and PLX4032-R MeOV (A) and MeTA (B) melanoma cells exposed to 1.5 µM PLX4032 or DMSO for 24, 48 and 72 h. Results were reported as μM/μg protein. (C) NAC pre-treatment of DMSO-R cells reduces the cytotoxic effect of PLX4032. Cell viability was determined by MTT assays in MeOV (left panel) and MeTA (right panel) cells pre-treated for 2 h with 2 μM or 4 μM NAC and then exposed for additional 70 h to 1.5 μM or 5 μM PLX4032. Histograms summarize quantitative data of the means ± S.E.M. of four independent experiments. *p<0.01 vs. untreated cells (Ctr); **p<0.01 vs. untreated cells (Ctr); ****p<0.0001 vs. untreated cells (Ctr); °°°° p<0.0001 vs. PLX-4032-treated cells.
Since intracellular GSH amount depends on the presence of NADPH levels, the NADPH/NADP+ ratio was evaluated. As shown in Figure 11, the NADPH/NADP+ ratio was increased by 2 fold and 3 fold after 48 and 72 h PLX4032 exposure, respectively, in DMSO-R MeOV cells while the ratio did not change in DMSO-R MeTa cells and in both PLX-R cell populations (Figure 11A, left panel).
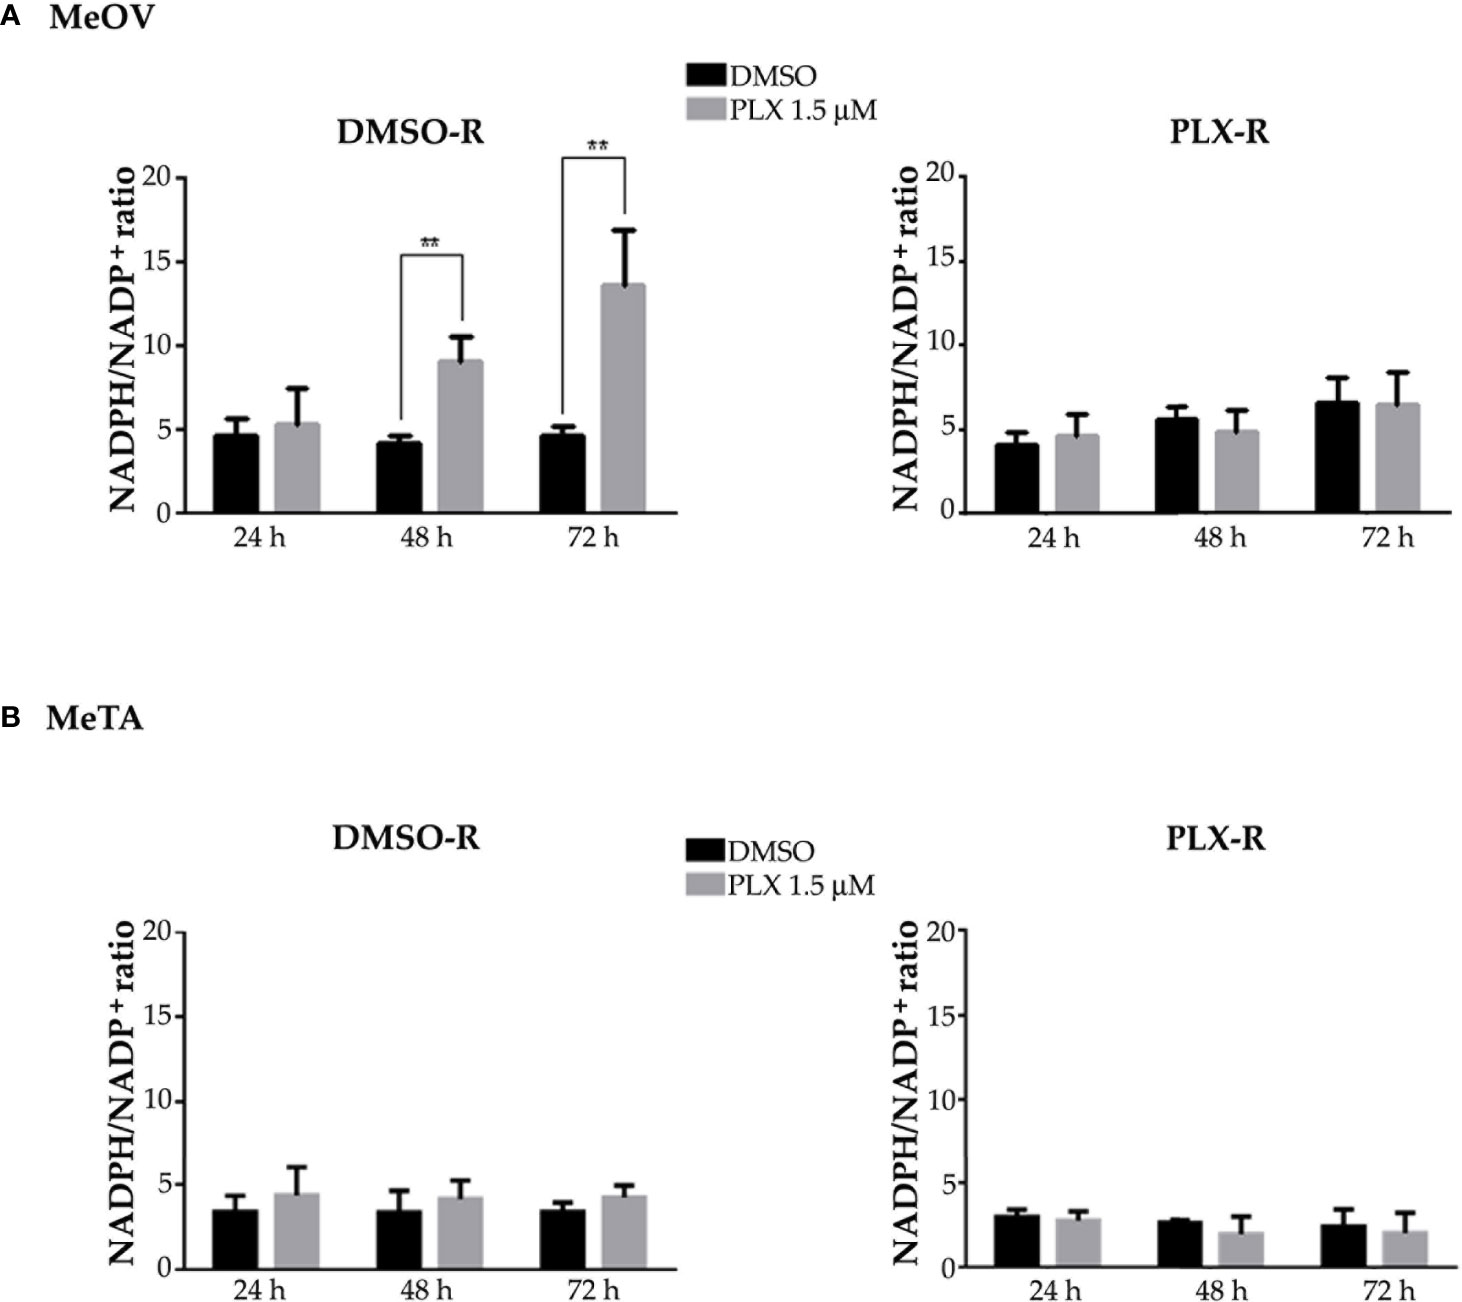
Figure 11 Evaluation of NADPH/NADP+ ratio in DMSO-R (left panels) and PLX-R (right panels) MeOV (A) and MeTA (B) melanoma cells, exposed to 1.5 µM PLX4032 or to DMSO for 24, 48 and 72 h. Histograms summarize quantitative data of the means ± S.E.M. of four independent experiments. **p<0.01 vs. untreated cells (Ctr).
3.4 PCA confirms that PLX-R cells are characterized by OXPHOS rewiring and maintenance of PDH activity and high levels of GSH
PCA was conducted on the dataset composed of 108 samples in order to interpret the results and identify the variables responsible for the acquisition of chemoresistance. The experimental plan was designed by considering all possible combinations between the factors, which include two cell lines (MeOV, MeTA), two types of drug resistance (DMSO-R, PLX-R), and three time points (24, 48, 72 h). Each combination was repeated in triplicate, resulting in a total of 108 samples. The viability variable was not included in the PCA but considered as an external response useful for the interpretation of the results.
The first two components explain 57.4% and 18.0% of the variance (75.4% in total).
The loading plot describes the correlation patterns of the variables (Figure 12A). The variables that can influence cell viability are located along Component 1 (PC1). All the parameters characterized by negative loadings (ATP/AMP, PDH activity, P/O, ATP synthesis, OCR, GSH) are associated to cell survival, while those with positive loadings (glucose consumption, LDH activity, lactate release, ROS, NAD+/NADH, NADPH/NADP+) are associated to cell death. This finding is confirmed by the strong correlation (r=-0.89; p<0.05) be-tween the scores on PC1 and cell viability (Supplementary Data). On the other hand, Component 2 (PC2) gives further information about the metabolic response of MeOV and Me-TA cells (Figure 12A). In this context, lactate release, NADPH/NADP+, LDH activity, GSH, ATP synthesis, OCR, and P/O have positive loadings, while ROS and NAD+/NADH have negative loadings.
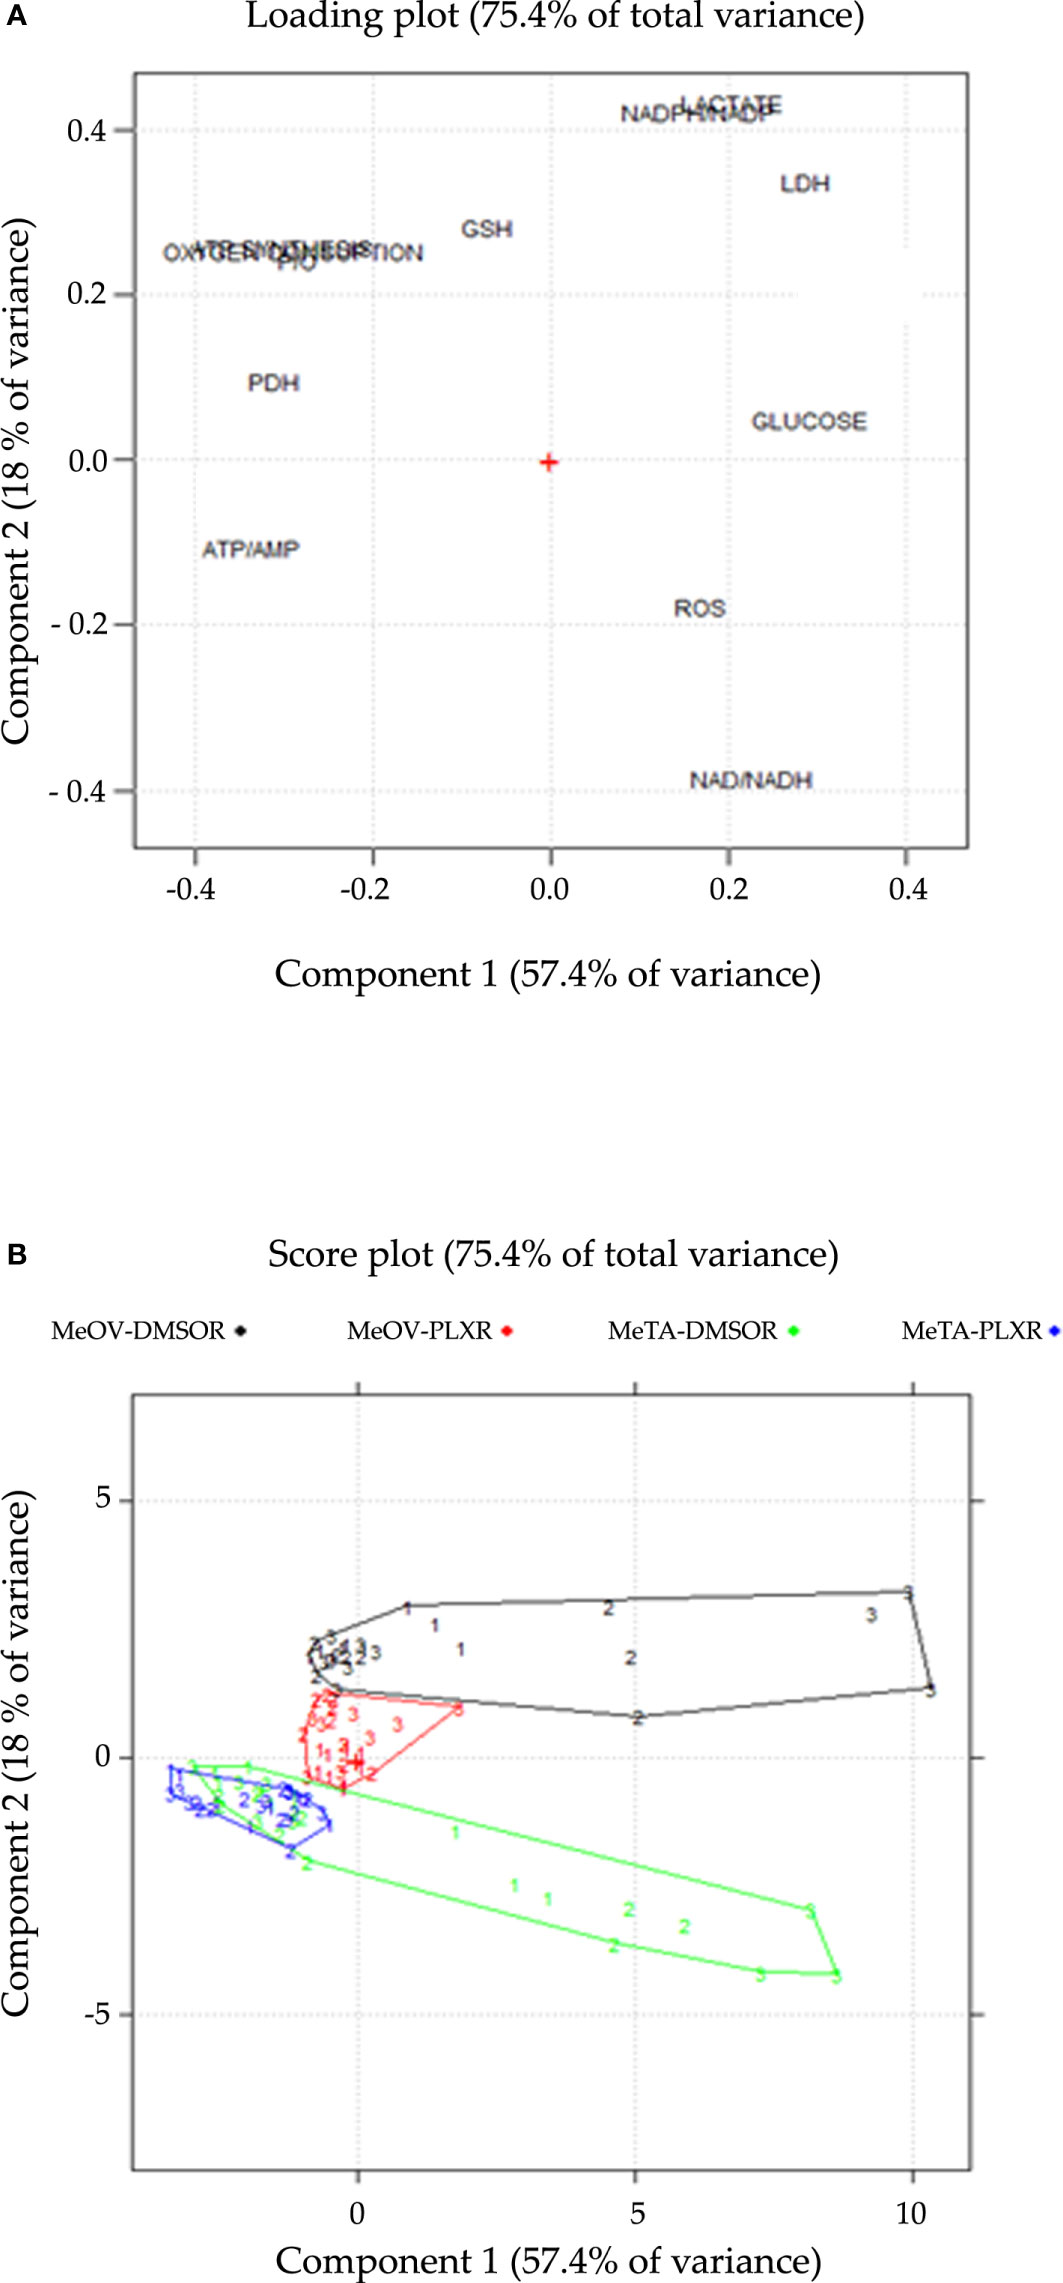
Figure 12 Loading (A) and score (B) plots are shown on the PC1-PC2 plane. (A) The loading plot describes the correlation pattern between the variables, where PC1 explains the cell viability and PC2 explains the cell-type dependent behavior in response to PLX treatment. (B) The score plot displays the objects in the component space, with each sample coded according to the treatment time point (1 = 24 h, 2 = 48 h, 3 = 72 h), colored and connected by a convex hull according to the cell line and the type of resistance (DMSO-R MeOV, PLX-R MeOV, DMSO-R MeTA, PLX-R MeTA).
The score plot (Figure 12B), reports all 108 samples in the significant components space, PC1-PC2 plane. The joint interpretation of loading and score plots shows that PLX-R cells acutely-treated with PLX, as well as untreated cells, have negative scores on PC1 for all time-points of treatment. In contrast, both PLX-treated DMSO-R cells exhibit a parallel and progressive increase on PC1 and more positive scores on PC2 than PLX-R cells. Moreover, as shown in the score plot (Figure 12B), the two MeOV populations (DMSO-R and PLX-R) are clearly separated while the MeTA populations overlap probably as a con-sequence of the specific effect of PLX4032 targeting BRAFV600E mutation which is present in MeOV and not in MeTA cells.
Therefore, PCA confirms that PLX-R melanoma cells are able to survive to drug treatment via a metabolic adaptation.
4 Discussion
Malignant melanoma is the most lethal form of skin cancer and although many therapeutic approaches have been developed to improve patient life expectancy, many efforts are still needed to counteract the most aggressive metastatic melanoma. In this regard, treatment guidelines establish surgical resection as the standard of care for localized and locoregional disease (3) and Vemurafenib, a BRAF inhibitor, is approved for treatment of BRAF-mutated metastatic melanoma patients (12) that has been found to induce a positive response in ~50% of patients (30). In fact, BRAF is an attractive therapeutic target for BRAFV600E melanoma because this mutation has been found in a high number of patients, respect to other variants like V600K, V600D and V600R (31, 32). These mutations result in the constitutive activation of MAPK-dependent pathway thus driving the progression of melanoma (33). Although PLX4032 is a specific inhibitor of BRAFV600E (34), it has been demonstrated to be active also for the V600K and V600D isoforms (35). Unfortunately, after 6-7 months of treatment with Vemurafenib, a high number of patients shows a melanoma relapse due to the acquisition of chemoresistance (13, 36). Therefore, investigating the molecular mechanisms underlying acquired PLX4032-resistance is fundamental to improve therapy efficacy and increase patients’ survival.
For this reason, several in vitro models of PLX4032-resistance have been proposed and studied (37), although the discrepancy between in vitro and in vivo results often limits their clinical translation. The main reason consists in the high degree of cell heterogeneity found in melanoma patients (38). In this context, the in vitro model realized by Delgado et al. (39) has been obtained by selecting a single-cell derived clone. Instead, the herein described cell model has been obtained by chronically treating the total cell population with the drug in order to allow the maintenance of cellular heterogeneity. The selection of PLX-resistant melanoma cells has been widely reported in the literature (40–43), but, to our knowledge, our study is the first that has been carried out by using patients’ derived metastatic melanoma cells. Therefore, in comparison with other models realized with the stabilized cancer cells (40–43), we believe that our model of acquired drug resistance is more representative of what occurs in vivo and, consequently, could be predictive of patient’s treatment responses.
Moreover, since in melanoma patients Vemurafenib quickly reaches a high plasma concentration and has a long half-life, the more appropriate and reliable in vitro strategy to mimic this condition, is represented by a continuous treatment of cancer cells with the drug (44). In this context, Fofaria et al. have used a different method to select Vemurafenib resistant cells via a pulsed treatment that does not reproduce the clinical administration of the drug (45).
Then, to better investigate the mechanisms of PLX4032 resistance, our study has been performed on two patient-derived metastatic melanoma cell lines: MeOV displaying BRAFV600E mutation and MeTA displaying BRAFV600D mutation.
Taking advantage of these models, here we provide strong evidence supporting the role played by the oxidative metabolism in the onset of melanoma PLX4032-resistance. Although it is already known in the literature that melanoma cells react to PLX4032-induced stress by reprogramming their energetic metabolism (10, 25, 39–41, 46–48), the mechanisms responsible for this adaptative response need to be further investigated to find new specific targets for improving the efficacy of the current therapy. In this context, glycolysis, TCA cycle and OXPHOS targeting are being tested in several clinical trials (49–52) and, based on in vitro and in vivo studies (39–41), it has been hypothesized that targeting OXPHOS with drugs, such as phenformin and metformin, could enhance the antitumor activity of BRAF inhibitors (53).
The herein results confirm that PLX4032-resistant cells are able to maintain an efficient OXPHOS metabolism. However, considering that this metabolic adaptation has been observed in both melanoma cells with different BRAF mutation and in etoposide resistant neuroblastoma cells (18), we believe that this response is neither cancer-type specific nor related to the specific drug-induced cytotoxic effect. Instead, both PLX4032-sensitive cells, differently from the resistant counterpart, exhibit i) a glycolytic profile characterized by the increase in LDH activity, in lactate release and in NAD+/NADH ratio and ii) OXPHOS uncoupling with enhanced intracellular AMP levels and a parallel decrease in ATP amount leading to a reduced ATP/AMP ratio. This result is in agreement with the evidence that PLX4032 exposure is able to inhibit OXPHOS and decrease ATP production (54, 55).
Moreover, the glycolytic pathway activated by acute PLX4032 treatment of drug sensitive cells is accompanied by a marked reduction in the activity of PDH, without significant changes in its protein levels. PDH is the enzyme catalyzing the decarboxylation of pyruvate into acetyl-CoA and interconnecting glycolysis and TCA cycle (56) and its decreased activity detected in sensitive cells might be responsible for shifting metabolism towards glycolysis. Conversely, in PLX-R cells PDH activity does not change whereas the protein levels increase: this data might suggest that the resistant cells become able to counteract the drug-induced inhibition of PDH activity (54) by increasing PDH expression and leading to a metabolic rewiring from glycolysis to OXPHOS that allows melanoma cells to produce sufficient ATP levels and to survive. In fact, the pre-treatment of PLX sensitive cells with DCA, a PDH activator, markedly increases the survival of PLX4032-treated cells suggesting that PDH inhibition may play a key role in sensitizing melanoma cells to PLX4032.
In parallel with mitochondrial respiration, ROS production is enhanced in resistant cells that respond with an antioxidant response by increasing GSH levels. In this regard, it has been demonstrated that slow-cycling melanoma cells intrinsically resistant to PLX4032, to many chemotherapeutic drugs and to radiotherapy, overexpressed KDM5B, the histone H3KA demethylase which contribute to maintain OXPHOS and to enhance GSH-related processes (57–60). Although the metabolic adaptations observed in our model are similar to those reported in KDM5B-overexpressing cells, the mechanism of resistance is different: the first case represents an adaptative response of the whole cell population exposed to PLX4032 for six months; the second one is an intrinsic resistance of a small sub-population. In addition, another discrepancy between these two models of resistance is that PLX-R cells do not show significant changes in cell cycle phases distribution, whereas KDM5B cells are slow-cycling. Therefore, although the metabolic adaptations observed in intrinsic and acquired resistance are similar, it is reasonable to hypothesize that the molecule players involved in the adaptative response may be different.
Our data agree with studies reporting that PDH activity is important to maintain redox homeostasis and to support GSH regeneration, via the consumption of NADPH which originates by the activation of the pentose phosphate pathway (PPP) (61–63). In this context, Khamari el al (64)., by using mice model and melanoma cells generated from mice tumors, have demonstrated that PPP is induced by activation of NRF2, the main transcription factor regulating antioxidant response and GSH biosynthesis.
GSH and redox homeostasis have been widely demonstrated to play a crucial role in therapy-resistance (18, 65–67) and it has been recently reported that compounds able to inhibit GSH peroxidase 4 (GPX4) induce ferroptosis in BRAFV600E mutant melanoma cells increasing the sensitivity to Vemurafenib (68). Interestingly, the pre-treatment with NAC, a GSH synthesis precursor, is able to reduce the cytotoxic effect of PLX4032 in both sensitive cell populations. This data confirms the crucial role of GSH in sensitizing melanoma cells to the drug in agreement to other studies carried out in several human cancers treated with traditional therapies (18, 69–71). In conclusion, based on the results obtained in this innovative model of acquired PLX4032 resistance, it is possible to believe that among the factors underlying resistance, a crucial role is played by the maintenance of PDH activity and by the increase in intracellular GSH levels. Therefore, although further studies are needed, it is possible to hypothesize that inhibitors of PDH activity and/or of GSH biosynthesis could be used in combination with PLX4032 to overcome drug resistance of BRAF-mutated melanoma patients.
Data availability statement
The original contributions presented in the study are included in the article/Supplementary Material. Further inquiries can be directed to the corresponding author.
Author contributions
BM and CD contributed to conception and design of the study. OG, GEV, LM, SR, SB, AB, EF, MG, SV, and BM performed experiments. OG, GEV, BM and CD contributed to acquisition, analyses and interpretation of data. BM, CD, GP, MCM and RL contributed to validation of data. OG, GEV, and BM wrote the first draft of the manuscript. All authors contributed to manuscript revision, read, and approved the submitted version.
Funding
This research was financed by the University of Genova (CD), by Italian Ministry of Health: RF-2016-02362288 (GP) and Ricerca Corrente 2022-2024, IRCCS Ospedale Policlinico San Martino (GP).
Acknowledgments
We would like to thank Giuseppe Catalano (DIMES-University of Genoa) for his technical assistance.
Conflict of interest
The authors declare that the research was conducted in the absence of any commercial or financial relationships that could be construed as a potential conflict of interest.
Publisher’s note
All claims expressed in this article are solely those of the authors and do not necessarily represent those of their affiliated organizations, or those of the publisher, the editors and the reviewers. Any product that may be evaluated in this article, or claim that may be made by its manufacturer, is not guaranteed or endorsed by the publisher.
Supplementary material
The Supplementary Material for this article can be found online at: https://www.frontiersin.org/articles/10.3389/fonc.2023.1210130/full#supplementary-material
References
1. Pisani P, Parkin DM, Bray F, Ferlay J. Estimates of the worldwide mortality from 25 cancers in 1990. Int J Cancer (1999) 83:18–29. doi: 10.1002/(sici)1097-0215(19990924)83:1<18::aid-ijc5>3.0.co;2-m
2. Schadendorf D, Fisher DE, Garbe C, Gershenwald JE, Grob JJ, Halpern A, et al. Melanoma. Nat Rev Dis Primers (2015) 1:15003. doi: 10.1038/nrdp.2015.3
3. Michielin O, van Akkooi ACJ, Ascierto PA, Dummer R, Keilholz U. ESMO guidelines committee. electronic address:Y2xpbmljYWxndWlkZWxpbmVzQGVzbW8ub3Jn. cutaneous melanoma: ESMO clinical practice guidelines for diagnosis, treatment and follow-up. Ann Oncol (2019) 30:1884–901. doi: 10.1093/annonc/mdz411
4. Erdei E, Torres SM. A new understanding in the epidemiology of melanoma. Expert Rev Anticancer Ther (2010) 10:1811–23. doi: 10.1586/era.10.170
5. Leary M, Heerboth S, Lapinska K, Sarkar S. Sensitization of drug resistant cancer cells: a matter of combination therapy. Cancers (2018) 10:483. doi: 10.3390/cancers10120483
6. Davies H, Bignell GR, Cox C, Stephens P, Edkins S, Clegg S, et al. Mutations of the BRAF gene in human cancer. Nature (2002) 417:949–54. doi: 10.1038/nature00766
7. Holderfield M, Deuker MM, McCormick F, McMahon M. Targeting RAF kinases for cancer therapy: BRAF-mutated melanoma and beyond. Nat Rev Cancer (2014) 14:455–67. doi: 10.1038/nrc3760
8. Hall A, Meyle KD, Lange MK, Klima M, Sanderhoff M, Dahl C, et al. Dysfunctional oxidative phosphorylation makes malignant melanoma cells addicted to glycolysis driven by the (V600E)BRAF oncogene. Oncotarget (2013) 4:584–99. doi: 10.18632/oncotarget.965
9. Cantwell-Dorris ER, O'Leary JJ, Sheils OM. BRAFV600E: implications for carcinogenesis and molecular therapy. Mol Cancer Ther (2011) 10:385–94. doi: 10.1158/1535-7163.MCT-10-0799
10. Haq R, Fisher DE, Widlund HR. Molecular pathways: BRAF induces bioenergetic adaptation by attenuating oxidative phosphorylation. Clin Cancer Res (2014) 20:2257–63. doi: 10.1158/1078-0432.CCR-13-0898
11. Bollag G, Hirth P, Tsai J, Zhang J, Ibrahim PN, Cho H, et al. Clinical efficacy of a RAF inhibitor needs broad target blockade in BRAF-mutant melanoma. Nature (2010) 467:596–9. doi: 10.1038/nature09454
12. Hallmeyer S, Gonzalez R, Lawson DH, Cranmer LD, Linette GP, Puzanov I, et al. Vemurafenib treatment for patients with locally advanced, unresectable stage IIIC or metastatic melanoma and activating exon 15 BRAF mutations other than V600E. Melanoma Res (2017) 27:585–90. doi: 10.1097/CMR.0000000000000398
13. Swaika A, Crozier JA, Joseph RW. Vemurafenib: an evidence-based review of its clinical utility in the treatment of met-astatic melanoma. Drug Des Devel Ther (2014) 8:775–87. doi: 10.2147/DDDT.S31143
14. Tanda ET, Vanni I, Boutros A, Andreotti V, Bruno W, Ghiorzo P, et al. Current state of target treatment in BRAF mutated melanoma. Front Mol Biosci (2020) 7:154. doi: 10.3389/fmolb.2020.00154
15. Corazao-Rozas P, Guerreschi P, André F, Gabert PE, Lancel S, Dekiouk S, et al. Mitochondrial oxidative phosphorylation controls cancer cell's life and death decisions upon exposure to MAPK inhibitors. Oncotarget (2016) 7:39473–85. doi: 10.18632/oncotarget.7790
16. McDermott M, Eustace AJ, Busschots S, Breen L, Crown J, Clynes M, et al. In vitro development of chemotherapy and targeted therapy drug-resistant cancer cell lines: a practical guide with case studies. Front Oncol (2014) 4:40. doi: 10.3389/fonc.2014.00040
17. Furfaro AL, Loi G, Ivaldo C, Passalacqua M, Pietra G, Mann GE, et al. HO-1 limits the efficacy of vemuraf-enib/PLX4032 in BRAFV600E mutated melanoma cells adapted to physiological normoxia or hypoxia. Antioxidants (2022) 11:1171. doi: 10.3390/antiox11061171
18. Colla R, Izzotti A, De Ciucis C, Fenoglio D, Ravera S, Speciale A, et al. Glutathione-mediated antioxidant response and aerobic metabolism: two crucial factors involved in determining the multi-drug resistance of high-risk neuroblastoma. Oncotarget (2016) 7:70715–37. doi: 10.18632/oncotarget.12209
19. Cappelli E, Cuccarolo P, Stroppiana G, Miano M, Bottega R, Cossu V, et al. Defects in mitochondrial energetic function compels fanconi anaemia cells to glycolytic metabolism. Biochim Biophys Acta Mol Basis Dis (2017) 1863:1214–21. doi: 10.1016/j.bbadis.2017.03.008
20. Bruzzone S, De Flora A, Usai C, Graeff R, Lee HC. Cyclic ADP-ribose is a second messenger in the lipopolysaccharide-stimulated proliferation of human peripheral blood mononuclear cells. Biochem J (2003) 375:395–403. doi: 10.1042/BJ20030556
21. Benzi A, Sturla L, Heine M, Fischer AW, Spinelli S, Magnone M, et al. CD38 downregulation modu-lates NAD+ and NADP(H) levels in thermogenic adipose tissues. Biochim Biophys Acta Mol Cell Biol Lipids (2021) 1866:158819. doi: 10.1016/j.bbalip.2020.158819
22. Becherini P, Caffa I, Piacente F, Damonte P, Vellone VG, Passalacqua M, et al. SIRT6 enhances oxidative phosphorylation in breast cancer and promotes mammary tumorigenesis in mice. Cancer Metab (2021) 9:6. doi: 10.1186/s40170-021-00240-1
23. Marengo B, De Ciucis C, Ricciarelli R, Passalacqua M, Nitti M, Zingg JM, et al. PKCδ sensitizes neuroblastoma cells to l-buthionine-sulfoximine and etoposide inducing reactive oxygen species overproduction and DNA damage. PloS One (2011) 6:e14661. doi: 10.1371/journal.pone.0014661
24. Monteleone L, Speciale A, Valenti GE, Traverso N, Ravera S, Garbarino O, et al. PKCα inhibition as a strategy to sensitize neuroblastoma stem cells to etoposide by stimulating ferroptosis. Antioxidants (2021) 10:691. doi: 10.3390/antiox10050691
25. Kumar PR, Moore JA, Bowles KM, Rushworth SA, Moncrieff MD. Mitochondrial oxidative phosphorylation in cuta-neous melanoma. Br J Cancer (2021) 124:115–23. doi: 10.1038/s41416-020-01159-y
26. Hinkle PC. P/O ratios of mitochondrial oxidative phosphorylation. Biochim Biophys Acta (2005) 1706:1–11. doi: 10.1016/j.bbabio.2004.09.004
27. Pettit FH, Pelley JW, Reed LJ. Regulation of pyruvate dehydrogenase kinase and phosphatase by acetyl-CoA/CoA and NADH/NAD ratios. Biochem Biophys Res Commun (1975) 65:575–82. doi: 10.1016/s0006-291x(75)80185-9
28. Woolbright BL, Rajendran G, Harris RA, Taylor JA 3rd. Metabolic flexibility in cancer: targeting the pyruvate dehy-drogenase Kinase:Pyruvate dehydrogenase axis. Mol Cancer Ther (2019) 18:1673–81. doi: 10.1158/1535-7163.MCT-19-0079
29. Perillo B, Di Donato M, Pezone A, Di Zazzo E, Giovannelli P, Galasso G, et al. ROS in cancer therapy: the bright side of the moon. Exp Mol Med (2020) 52:192–203. doi: 10.1038/s12276-020-0384-2
30. Flaherty KT, Puzanov I, Kim KB, Ribas A, McArthur GA, Sosman JA, et al. Inhibition of mutated, activated BRAF in metastatic melanoma. N Engl J Med (2010) 363:809–19. doi: 10.1056/NEJMoa1002011
31. Lovly CM, Dahlman KB, Fohn LE, Su Z, Dias-Santagata D, Hicks DJ, et al. Routine multiplex mutational profiling of melanomas enables enrollment in genotype-driven therapeutic trials. PloS One (2012) 7:35309. doi: 10.1371/journal.pone.0035309
32. Rubinstein JC, Sznol M, Pavlick AC, Ariyan S, Cheng E, Bacchiocchi A, et al. Incidence of the V600K mutation among melanoma patients with BRAF mutations, and potential therapeutic response to the specific BRAF inhibitor PLX4032. J Transl Med (2010) 8:67. doi: 10.1186/1479-5876-8-67
33. Pratilas CA, Solit DB. Targeting the mitogen-activated protein kinase pathway: physiological feedback and drug response. Clin Cancer Res (2010) 16:3329–34. doi: 10.1158/1078-0432.CCR-09-3064
34. Bollag G, Tsai J, Zhang J, Zhang C, Ibrahim P, Nolop K, et al. Vemurafenib: the first drug approved for BRAF-mutant cancer. Nat Rev Drug Discovery (2012) 11:873–86. doi: 10.1038/nrd3847
35. Poulikakos PI, Zhang C, Bollag G, Shokat KM, Rosen N. RAF Inhibitors transactivate RAF dimers and ERK signalling in cells with wild-type BRAF. Nature (2010) 464:427–30. doi: 10.1038/nature08902
36. Wagle N, Emery C, Berger MF, Davis MJ, Sawyer A, Pochanard P, et al. Dissecting therapeutic resistance to RAF inhibition in melanoma by tumor genomic profiling. J Clin Oncol (2011) 29:3085–96. doi: 10.1200/JCO.2010.33.2312
37. Little AS, Smith PD, Cook SJ. Mechanisms of acquired resistance to ERK1/2 pathway inhibitors. Oncogene (2013) 32:1207–15. doi: 10.1038/onc.2012.160
38. Tirosh I, Izar B, Prakadan SM, Wadsworth MH 2nd, Treacy D, Trombetta JJ, et al. Dissecting the multicellular ecosystem of metastatic melanoma by single-cell RNA-seq. Science (2016) 352:189–96. doi: 10.1126/science.aad0501
39. Delgado-Goñi T, Galobart TC, Wantuch S, Normantaite D, Leach MO, Whittaker SR, et al. Increased inflammatory lipid metabolism and anaplerotic mitochondrial activation follow acquired resistance to vemurafenib in BRAF-mutant melanoma cells. Br J Cancer (2020) 122:72–81. doi: 10.1038/s41416-019-0628-x
40. Carpenter EL, Chagani S, Nelson D, Cassidy PB, Laws M, Ganguli-Indra G, et al. Mitochondrial complex I in-hibitor deguelin induces metabolic reprogramming and sensitizes vemurafenib-resistant BRAFV600E mutation bearing meta-static melanoma cells. Mol Carcinog (2019) 58:1680–90. doi: 10.1002/mc.23068
41. Corazao-Rozas P, Guerreschi P, Jendoubi M, André F, Jonneaux A, Scalbert C, et al. Mitochondrial oxidative stress is the achille's heel of melanoma cells resistant to braf-mutant inhibitor. Oncotarget (2013) 4:1986–98. doi: 10.18632/oncotarget.1420
42. Han J, Jung Y, Jun Y, Park S, Lee S. Elucidating molecular mechanisms of acquired resistance to BRAF inhibitors in melanoma using a microfluidic device and deep sequencing. Genomics Inform (2021) 19:e2. doi: 10.5808/gi.20074
43. Lidsky M, Antoun G, Speicher P, Adams B, Turley R, Augustine C, et al. Mitogen-activated protein kinase (MAPK) hyperactivation and enhanced NRAS expression drive acquired vemurafenib resistance in V600E BRAF melanoma cells. J Biol Chem (2014) 289:27714–26. doi: 10.1074/jbc.M113.532432
44. Luebker SA, Koepsell SA. Diverse mechanisms of BRAF inhibitor resistance in melanoma identified in clinical and pre-clinical studies. Front Oncol (2019) 9:268. doi: 10.3389/fonc.2019.00268
45. Fofaria NM, Frederick DT, Sullivan RJ, Flaherty KT, Srivastava SK. Overexpression of mcl-1 confers resistance to BRAFV600E inhibitors alone and in combination with MEK1/2 inhibitors in melanoma. Oncotarget (2015) 6:40535–56. doi: 10.18632/oncotarget.5755
46. Brummer C, Faerber S, Bruss C, Blank C, Lacroix R, Haferkamp S, et al. Metabolic target-ing synergizes with MAPK inhibition and delays drug resistance in melanoma. Cancer Lett (2019) 442:453–63. doi: 10.1016/j.canlet.2018.11.018
47. Hanahan D, Weinberg RA. Hallmarks of cancer: the next generation. Cell (2011) 144:646–74. doi: 10.1016/j.cell.2011.02.013
48. Zaal EA, Berkers CR. The influence of metabolism on drug response in cancer. Front Oncol (2018) 8:500. doi: 10.3389/fonc.2018.00500
49. Tennant DA, Durán RV, Gottlieb E. Targeting metabolic transformation for cancer therapy. Nat Rev Cancer (2010) 10:267–77. doi: 10.1038/nrc2817
50. Vander Heiden MG. Targeting cancer metabolism: a therapeutic window opens. Nat Rev Drug Discovery (2011) 10:671–84. doi: 10.1038/nrd3504
51. Galluzzi L, Kepp O, Vander Heiden MG, Kroemer G. Metabolic targets for cancer therapy. Nat Rev Drug Discovery (2013) 12:829–46. doi: 10.1038/nrd4145
52. Martinez-Outschoorn UE, Peiris-Pagés M, Pestell RG, Sotgia F, Lisanti MP. Cancer metabolism: a therapeutic perspective. Nat Rev Clin Oncol (2017) 14:11–31. doi: 10.1038/nrclinonc.2016.60
53. Yuan P, Ito K, Perez-Lorenzo R, Del Guzzo C, Lee JH, Shen CH, et al. Phenformin enhances the therapeutic benefit of BRAF(V600E) inhibition in melanoma. Proc Natl Acad Sci U.S.A. (2013) 110:18226–31. doi: 10.1073/pnas.1317577110
54. Cesi G, Walbrecq G, Zimmer A, Kreis S, Haan C. ROS production induced by BRAF inhibitor treatment rewires metabolic processes affecting cell growth of melanoma cells. Mol Cancer (2017) 16:102. doi: 10.1186/s12943-017-0667-y
55. Avagliano A, Fiume G, Pelagalli A, Sanità G, Ruocco MR, Montagnani S, et al. Metabolic plasticity of melanoma cells and their crosstalk with tumor microenvironment. Front Oncol (2020) 10:722. doi: 10.3389/fonc.2020.00722
56. Lu J, Tan M, Cai Q. The warburg effect in tumor progression: mitochondrial oxidative metabolism as an anti-metastasis mechanism. Cancer Lett (2015) 356:156–64. doi: 10.1016/j.canlet.2014.04.001
57. Roesch A, Fukunaga-Kalabis M, Schmidt EC, Zabierowski SE, Brafford PA, Vultur A, et al. A temporarily distinct subpopulation of slow-cycling melanoma cells is required for continuous tumor growth. Cell (2010) 141:583–94. doi: 10.1016/j.cell.2010.04.020
58. Roesch A, Vultur A, Bogeski I, Wang H, Zimmermann KM, Speicher D, et al. Overcoming intrinsic multidrug resistance in melanoma by blocking the mitochondrial respiratory chain of slow-cycling JARID1B(high) cells. Cancer Cell (2013) 23:811–25. doi: 10.1016/j.ccr.2013.05.003
59. Vogel FCE, Bordag N, Zügner E, Trajkovic-Arsic M, Chauvistré H, Shannan B, et al. Targeting the H3K4 demethylase KDM5B reprograms the metabolome and phenotype of melanoma cells. J Invest Dermatol (2019) 139:2506–2516.e10. doi: 10.1016/j.jid.2019.06.124
60. Shannan B, Matschke J, Chauvistré H, Vogel F, Klein D, Meier F, et al. Sequence-dependent cross-resistance of combined radiotherapy plus BRAFV600E inhibition in melanoma. Eur J Cancer (2019) 109:137–53. doi: 10.1016/j.ejca.2018.12.024
61. Luengo A, Li Z, Gui DY, Sullivan LB, Zagorulya M, Do BT, et al. Increased demand for NAD+relative to ATP drives aerobic glycolysis. Mol Cell (2021) 81:691–707.e6. doi: 10.1016/j.molcel.2020.12.012
62. Jun S, Mahesula S, Mathews TP, Martin-Sandoval MS, Zhao Z, Piskounova E, et al. The requirement for pyruvate dehydrogenase in leukemogenesis depends on cell lineage. Cell Metab (2021) 33:1777–92.e8. doi: 10.1016/j.cmet.2021.07.016
63. Piskounova E, Agathocleous M, Murphy MM, Hu Z, Huddlestun SE, Zhao Z. Oxidative stress inhibits distant metastasis by human melanoma cells. Nature (2015) 527:186–91. doi: 10.1038/nature15726
64. Khamari R, Trinh A, Gabert PE, Corazao-Rozas P, Riveros-Cruz S, Balayssac S, et al. Glucose metabolism and NRF2 coordinate the antioxidant response in melanoma resistant to MAPK inhibitors. Cell Death Dis (2018) 9:325. doi: 10.1038/s41419-018-0340-4
65. Traverso N, Ricciarelli R, Nitti M, Marengo B, Furfaro AL, Pronzato MA, et al. Role of glutathione in cancer progression and chemoresistance. Oxid Med Cell Longev (2013) 2013:972913. doi: 10.1155/2013/972913
66. Marengo B, Nitti M, Furfaro AL, Colla R, Ciucis CD, Marinari UM, et al. Redox homeostasis and cellular antioxidant systems: crucial players in cancer growth and therapy. Oxid Med Cell Longev (2016) 2016:6235641. doi: 10.1155/2016/6235641
67. Pizzimenti S, Ribero S, Cucci MA, Grattarola M, Monge C, Dianzani C, et al. Oxidative stress-related mechanisms in melanoma and in the acquired resistance to targeted therapies. Antioxidants (2021) 10:1942. doi: 10.3390/antiox10121942
68. Chang MT, Tsai LC, Nakagawa-Goto K, Lee KH, Shyur LF. Phytosesquiterpene lactones DET and DETD-35 induce ferroptosis in vemurafenib sensitive and resistant melanoma via GPX4 inhibition and metabolic reprogramming. Pharmacol Res (2022) 178:106148. doi: 10.1016/j.phrs.2022.106148
69. Scarbrough PM, Mapuskar KA, Mattson DM, Gius D, Watson WH, Spitz DR. Simultaneous inhibition of glutathione- and thioredoxin-dependent metabolism is necessary to potentiate 17AAG-induced cancer cell killing via oxidative stress. Free Radic Biol Med (2012) 52:436–43. doi: 10.1016/j.freeradbiomed.2011.10.493
70. Fath MA, Ahmad IM, Smith CJ, Spence J, Spitz DR. Enhancement of carboplatin-mediated lung cancer cell killing by simultaneous disruption of glutathione and thioredoxin metabolism. Clin Cancer Res (2011) 17:6206–17. doi: 10.1158/1078-0432.CCR-11-0736
Keywords: melanoma, BRAF, PLX4032, targeted therapy resistance, pyruvate dehydrogenase, glutathione, oxidative metabolism
Citation: Garbarino O, Valenti GE, Monteleone L, Pietra G, Mingari MC, Benzi A, Bruzzone S, Ravera S, Leardi R, Farinini E, Vernazza S, Grottoli M, Marengo B and Domenicotti C (2023) PLX4032 resistance of patient-derived melanoma cells: crucial role of oxidative metabolism. Front. Oncol. 13:1210130. doi: 10.3389/fonc.2023.1210130
Received: 21 April 2023; Accepted: 03 July 2023;
Published: 18 July 2023.
Edited by:
Yong Teng, Emory University, United StatesReviewed by:
Johann Matschke, Essen University Hospital, GermanySimona D’Aguanno, Hospital Physiotherapy Institutes (IRCCS), Italy
Copyright © 2023 Garbarino, Valenti, Monteleone, Pietra, Mingari, Benzi, Bruzzone, Ravera, Leardi, Farinini, Vernazza, Grottoli, Marengo and Domenicotti. This is an open-access article distributed under the terms of the Creative Commons Attribution License (CC BY). The use, distribution or reproduction in other forums is permitted, provided the original author(s) and the copyright owner(s) are credited and that the original publication in this journal is cited, in accordance with accepted academic practice. No use, distribution or reproduction is permitted which does not comply with these terms.
*Correspondence: Cinzia Domenicotti, Y2luemlhLmRvbWVuaWNvdHRpQHVuaWdlLml0
†These authors contributed equally to this work