 Alejandro Avilés-Salas1
 Luis Cabrera-Miranda2Norma Hernández-Pedro3
 Diana Sofía Vargas-Lías1
 Suraj Samtani4
 Wendy Muñoz-Montaño2Daniel Motola-Kuba5
 Luis Corrales-Rodríguez6
 Claudio Martín7
 Andrés F. Cardona8,9,10Cittim B. Palomares-Palomares2
 Oscar Arrieta2*
- 1Pathology Department, Instituto Nacional de Cancerología (INCan), Mexico City, Mexico
- 2Thoracic Oncology Unit, Instituto Nacional de Cancerología (INCan), Mexico City, Mexico
- 3Personalized Medicine Laboratory, Instituto Nacional de Cancerología (INCan), Mexico City, Mexico
- 4Medical Oncology Department, Clínica Las Condes Santiago, Santiago, Chile
- 5Departments of Biomedical Research and Gastroenterology and Liver Unit and Hemodialysis Unit, Medica Sur Clinic and Foundation, Mexico City, Mexico
- 6Medical Oncology Department, San Juan de Dios Hospital, San José, Costa Rica
- 7Department of Medicine, Western University, London, ON, Canada
- 8Thoracic Oncology Unit and Direction of Research, Science and Education, Luis Carlos Sarmiento Angulo Cancer Treatment and Research Center (CTIC), Bogotá, Colombia
- 9Clinical and Translational Oncology Group, Clínica del Country, Bogotá, Colombia
- 10Molecular Oncology and Biology Systems Research Group (Fox-G), Universidad El Bosque, Bogotá, Colombia
Background: Programmed death ligand-1 (PD-L1) expression is a predictive biomarker in patients with lung cancer, but its role in malignant pleural mesothelioma (MPM) remains unclear. Evidence suggests that higher PD-L1 expression is correlated with worse survival. CALGB is the main scoring system used to predict the benefit of chemotherapy treatment. This study aimed to determine the prognostic value of PD-L1 expression and its addition to CALGB scoring system in patients with MPM.
Methods: In this retrospective analysis, we evaluated samples with confirmed locally advanced or metastatic MPM. PD-L1 Tumor Proportional Score (TPS) was determined by immunohistochemistry at diagnosis.
Results: 73 patients were included in this study. A cutoff value of 15 was set for a high or low PD-L1 TPS. In total, 71.2% (n=52) and 28.8% (n=21) of individuals harbored low or high PD-L1 expression, respectively. PD-L1High was associated with worse median progression-free Survival (mPFS) [4.9 vs. 10.8 months; HR 2.724, 95% CI (1.44-5.14); p = 0.002] and Overall Survival (OS) [6.0 vs. 20.9 months; HR 6.87, 95% CI (3.4-8.7); p<0.001] compared to patients with PD-L1Low. Multivariate analysis confirmed that PD-L1 expression was an independent factor for PFS and OS in patients with MPM and CALGB score of 5-6.
Conclusion: PD-L1 addition to CALGB scale improves its prognostic estimation of MPM survival and should be considered in future research.
1 Introduction
Malignant pleural mesothelioma (MPM) is an underreported neoplasm with unknown incidence in Mexico (1). This disease founds its onset on pleura cells, and it is characterized by epithelioid (85.4%), sarcomatoid (12.2%), or biphasic (2.4%) histologies (1). Asbestos (2) and erionite (3) exposure are the main risk factors for MPM development, with a latency of 40-50 years between exposure and disease. Most MPM cases are diagnosed at advanced stages, which results in unfavorable responses to surgery and platinum-based chemotherapy, and short survival outcomes, characterized by a median overall survival (mOS) rarely exceeding 18 months and a 15% five-year survival (4, 5). In this context, immunotherapy has emerged as a promising therapeutic alternative, as the Checkmate 743 clinical trial described relevant improvements in terms of mOS in MPM patients after first-line treatment with nivolumab plus ipilimumab compared with platinum-based chemotherapy (18.1 months vs 14.1 months respectively) (6). This effect is related to the high prevalence of Programmed cell death ligand 1 (PD-L1) expression in MPM (28-56%) (7), which increases tumor susceptibility to this therapeutic blockade. However, PD-L1 importance in mesothelioma extends beyond this role and represents an independent predictor of unfavorable survival in MPM (8). Current prognostic assessment in patients with MPM is based on Cancer and Leukemia Group B (CALGB) prognostic score, which predicts poor clinical outcomes in individuals with poor performance status, non-epithelioid histology, male sex, low hemoglobin level, high platelet count, high white blood cell count, and high lactate dehydrogenase (LDH) levels (9). Nonetheless, the predictive factor of CALGB as a predictor of response to treatment is inconsistent in several studies (10). Therefore, this study aimed to explore the prognostic significance of PD-L1 in individuals with MPM to evaluate its complementation to CALGB score to enhance the therapeutic personalization of patients with this disease.
2 Methods
2.1 Patients
This retrospective study was conducted at the National Cancer Institute of Mexico from January 10, 2009, to December 31, 2019. This study was approved by the Institutional Ethics Committee (010/056/ICI) and Scientific Committees (CEI/656/10). Chemo-naïve patients with histologically confirmed malignant pleural mesothelioma (MPM) diagnosis were included. Tumor stage was determined according to the International Union Against Cancer tumor-node-metastasis 8th classification (11). Clinicopathological variables were retrieved from institutional database, including complete medical history, age, sex, performance status (PS), asbestos exposure, tumor stage, histologic subtype, treatment, and survival. To determine the prognostic value of PD-L1 expression, a cut-off point of 15% was determined by analyzing survival data using receiver operating characteristic curve (ROC) (area under the curve (AUC) = 0.70; 95% confidence interval (CI) 0.58-0.82, p = 0.003), as this cut-off value exhibited the highest sensibility (44.7%) and specificity (91.4%) for survival outcomes in our cohort (Supplementary Figure 1).
2.2 Tissue management
Tumor samples from 73 patients with MPM were processed and stored at room temperature. MPM diagnosis was confirmed by a pathologist specialized in oncological diseases. PD-L1 expression was determined using the VENTANA PD-L1 (SP263) Assay (Ventana Medical Systems, Tucson, AZ, USA) and detected using the OptiView DAB IHC Detection kit on a BenchMark IHC/HIS instrument. SP263 antibody was used as this is the standardized protocol for assessing PD-L1, and it counts with approval from the Food and Drug Administration (FDA) (12). PD-L1 tumor proportion score (TPS) was calculated as a percentage of at least 100 tumor cells with complete or partial membrane staining. PD-L1 positive samples were defined using a threshold of TPS ≥1%.
2.3 Therapeutic approach
Patients with advanced unresectable disease were included in this study. Therapeutic modalities included platinum-based chemotherapy, palliative radiotherapy (RT), combined chemoradiotherapy (CHT-RT), or best supportive care (BSC). Multimodality treatment (MMT) was defined as the combination of surgery (pleurectomy/decortication (P/D) or extra-pleural pneumonectomy), chemotherapy, and radiotherapy. Patients who underwent immunotherapy or other targeted agents were excluded from the study.
2.4 Statistical analysis
All statistical analyses were performed using SPSS (Statistical Package for Social Sciences) version 26.0 (SPSS Inc., Chicago, IL). For descriptive purposes, continuous variables were summarized as arithmetic means, and standard deviations (SD), categorical and ordinal parameters such as sex (male vs. female), clinical stage (III vs. IV), histological subtype (epithelioid vs. non-epithelioid), and dichotomized PD-L1 expression (<15% vs. ≥15%) were analyzed using the χ2 test or Fisher’s exact test. For survival curve analysis, all variables were dichotomized. Overall survival (OS) and progression-free survival (PFS) were analyzed using the Kaplan-Meier method, and comparisons among subgroups were analyzed using the log-rank test. Finally, we performed a multivariate analysis with a Cox proportional model to estimate the hazard ratios (HRs) with 95% CI adjusting for those variables, which were statistically significantly associated with survival in the univariate analysis. Statistical significance was set at p <0.05 based on a two-sided test.
3 Results
3.1 Study population and clinical characteristics
As shown in Table 1, this study included 73 malignant pleural mesothelioma patients with MPM, among which 68.5% were older than 60 years (n = 50) and 68.5% were male (n = 50). In addition, 43.8% (n = 32) had asbestos exposure and 53.4% (n = 39) had a smoking history. At diagnosis, 42.5% (n = 31) and 57.5% (n = 42) of the cases were classified as stages III and IV, respectively. Moreover, 78.1% (n = 57) of patients had an Eastern Cooperative Oncology Group (ECOG) Performance Status (PS) of 0-1. Epithelioid was the most common histological subtype in 84.9% of the cohort (n = 62).
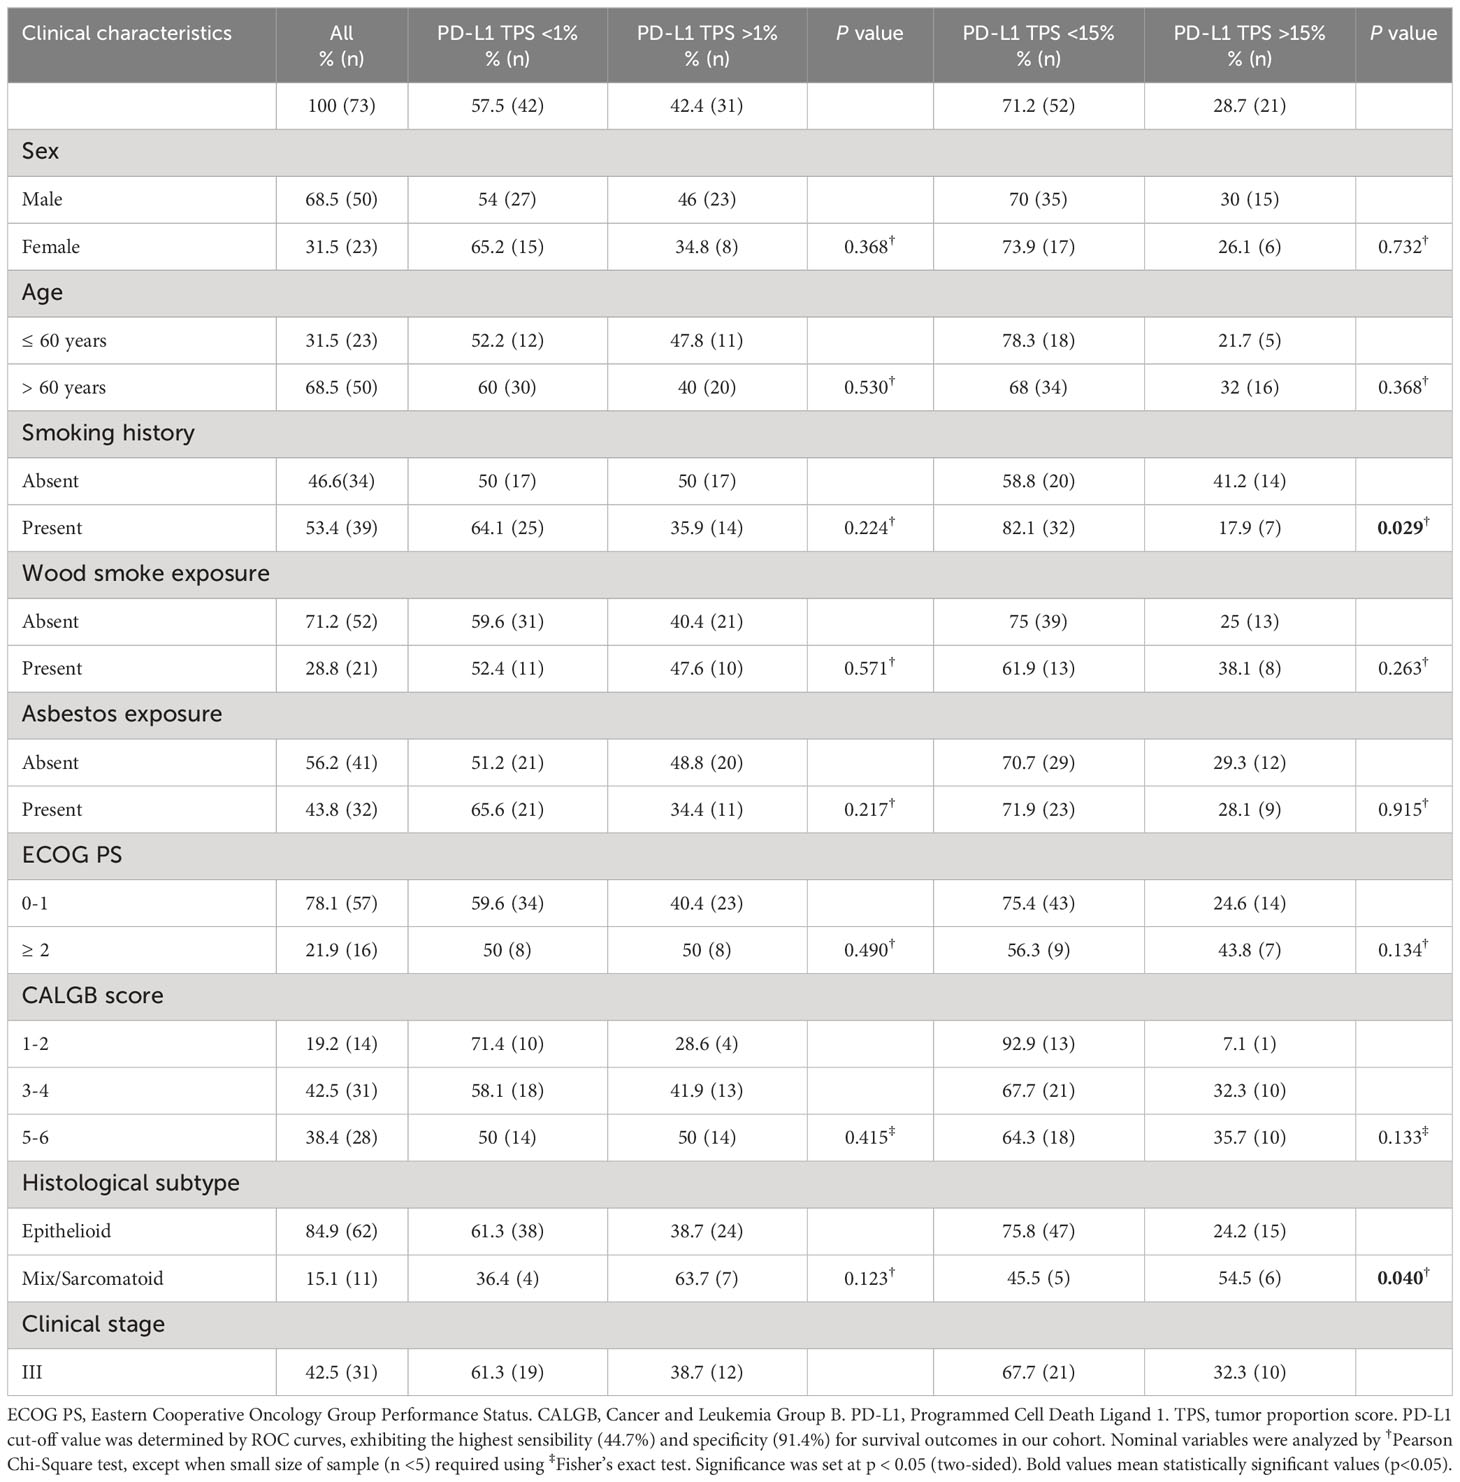
Table 1 General characteristics of population according to PD-L1 expression.
3.2 PD-L1 expression
According to immunohistochemistry staining, PD-L1 intensity of expression was negative in 42.5% (31) and positive in 57.5% (42) of cases. Among positives, 31.5% (23) showed a low, 17.8% (13) intermediate, and 8.2% (6) high intensities (Figure 1). Regarding tumor proportion score, positive PD-L1 expression (TPS >1%) was present in 42.4% (n = 31) of individuals and absent (TPS <1%) in 57.6% (n = 42). In addition, they were categorized as high or low PD-L1 expressors based on a TPS cut-off value of 15%. Accordingly, 28.7% (n = 21) and 71.2% (n = 52) of patients harbored high and low PD-L1 TPS, respectively. Regarding the association of this biomarker with clinical characteristics, PD-L1Low was associated with a smoking history (p=0.029) and epithelioid histology (p=0.04) (Table 1).
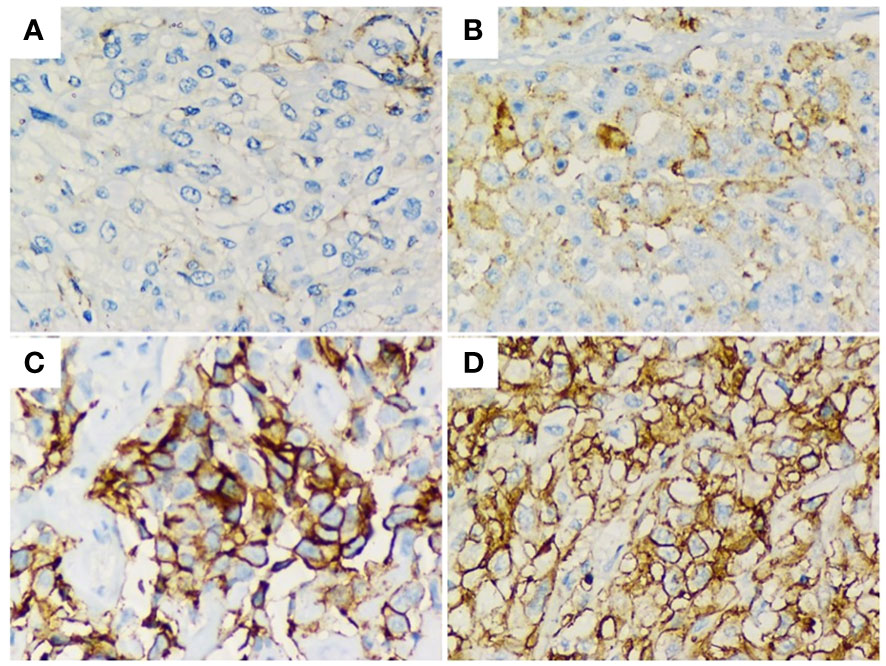
Figure 1 Immunohistochemical staining of PD-L1 (brown signal) from human MPM biopsies showing their median intensity; (A) 0/negative. (B) 1/weak. (C) 2/moderate. (D) 3/high. Magnification, x400. Staining index of PD-L1.
3.3 Progression-free survival
As displayed in Table 2 and Figure 2, mPFS in the whole cohort was 8.70 (4.23 - 13.17) months. Clinical characteristics independently associated with PFS were CALGB 5-6 score (HR 1.94; 1.24-3.05; p=0.004) and PD-L1Low (HR 0.43; 0.22 – 0.84; p = 0.014). Also, shorter mPFS was identified in individuals with CALGB 5-6 (5.88 vs. 8.18; HR 1.87; 95% CI 1.24-2.82, p=0.003), PD-L1 TPS >1% (4.9 vs. 10.8 months; HR 2.16; 95% CI 1.22-3.83, p=0.008) and PD-L1High (4.96 vs. 10.8 months; HR 2.724; 95%CI 1.44-5.14, p=0.002).
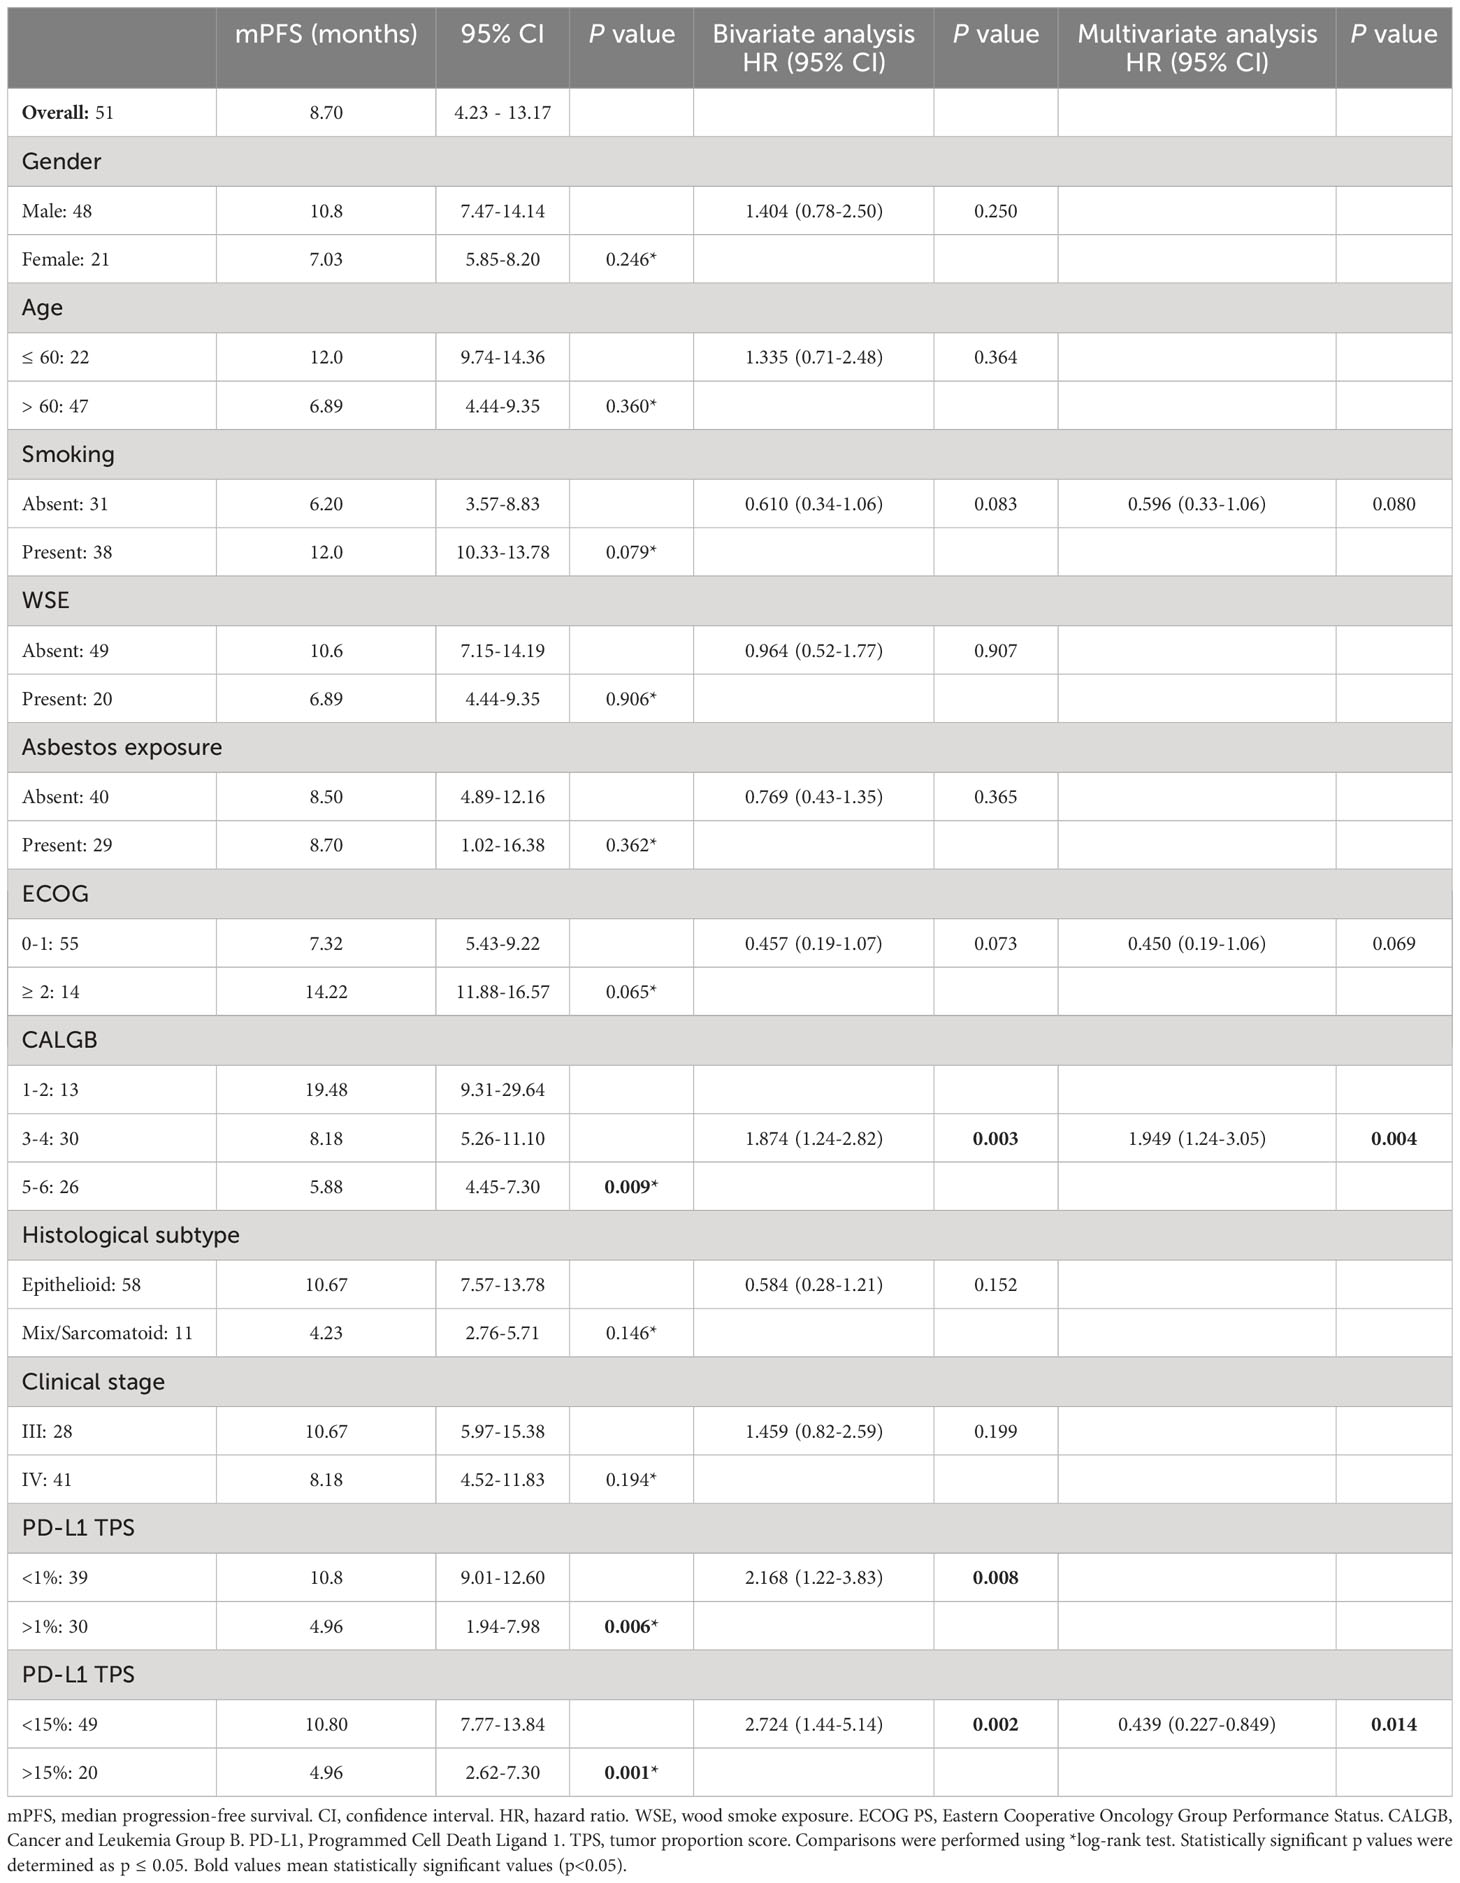
Table 2 Progression-free survival according to clinicopathologic characteristics.
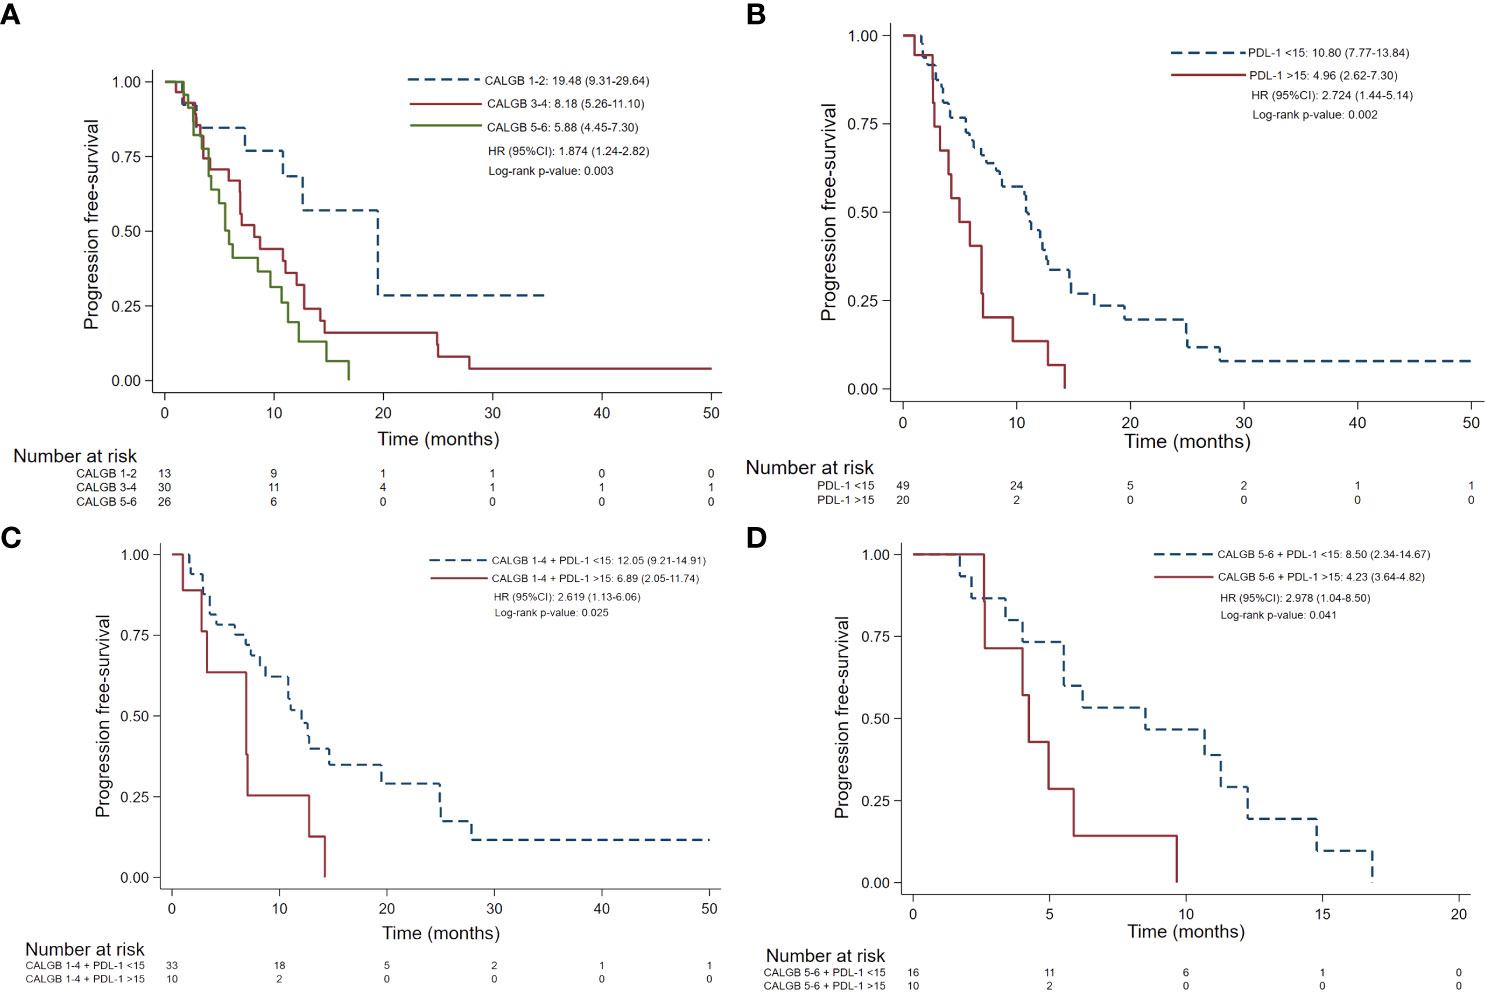
Figure 2 Progression-free survival according CALGB scales (A) PD-L1 TPS ≥15% (B) CALGB score 1-4 plus PD-L1 TPS >15% (C) CALGB 5-6 plus PD-L1 TPS >15% (D). CALGB, Cancer and Leukemia Group (B) PD-L1, Programmed Cell Death Ligand 1. TPS, tumor proportion score. mPFS, median progression-free survival. Comparisons were performed using *log-rank test. Statistically significant p values were determined as p ≤ 0.05.
3.4 Overall survival
As shown in Table 3, mOS of all patients was 15.37 (12.38 – 18.36) months. Characteristics independently related to overall survival were asbestos exposure (HR 2.11; 95% CI 1.15-3.86, p=0.016) and PD-L1Low (HR 0.13; 95% CI 0.06-0.28, p<0.001). Shorter mOS was identified in individuals harboring a PD-L1 TPS >1% (9.06 vs. 20.96 months; HR 2.72 95% CI 1.49-4.94, p=0.001), PD-L1High (6.05 vs. 20.9 months; HR 6.87; 95% CI 3.4-13.89, p<0.001) and sarcomatoid/mix histology (7.72 vs. 16.95 months; HR 0.455 95% CI 0.21-0.95; p=0.036).

Table 3 Overall survival according to clinicopathologic characteristics.
3.5 Prognostic value according to CALGB plus PD-L1 expression
As depicted in Figure 3 and Table 4, CALGB 1-4 plus PD-L1High demonstrates worse PFS (6.89 vs. 12.05 months, p=0.019) and OS (6.34 vs. 20.96 months, p<0.001) than CALGB 1-4 plus PD-L1Low. As well, CALGB 5-6 plus PD-L1High demonstrated worse PFS (4.23 vs. 8.50 months, p=0.032) and OS (6.50 vs 14.32 months, p=0.003) than CALGB 5-6 plus PD-L1Low.
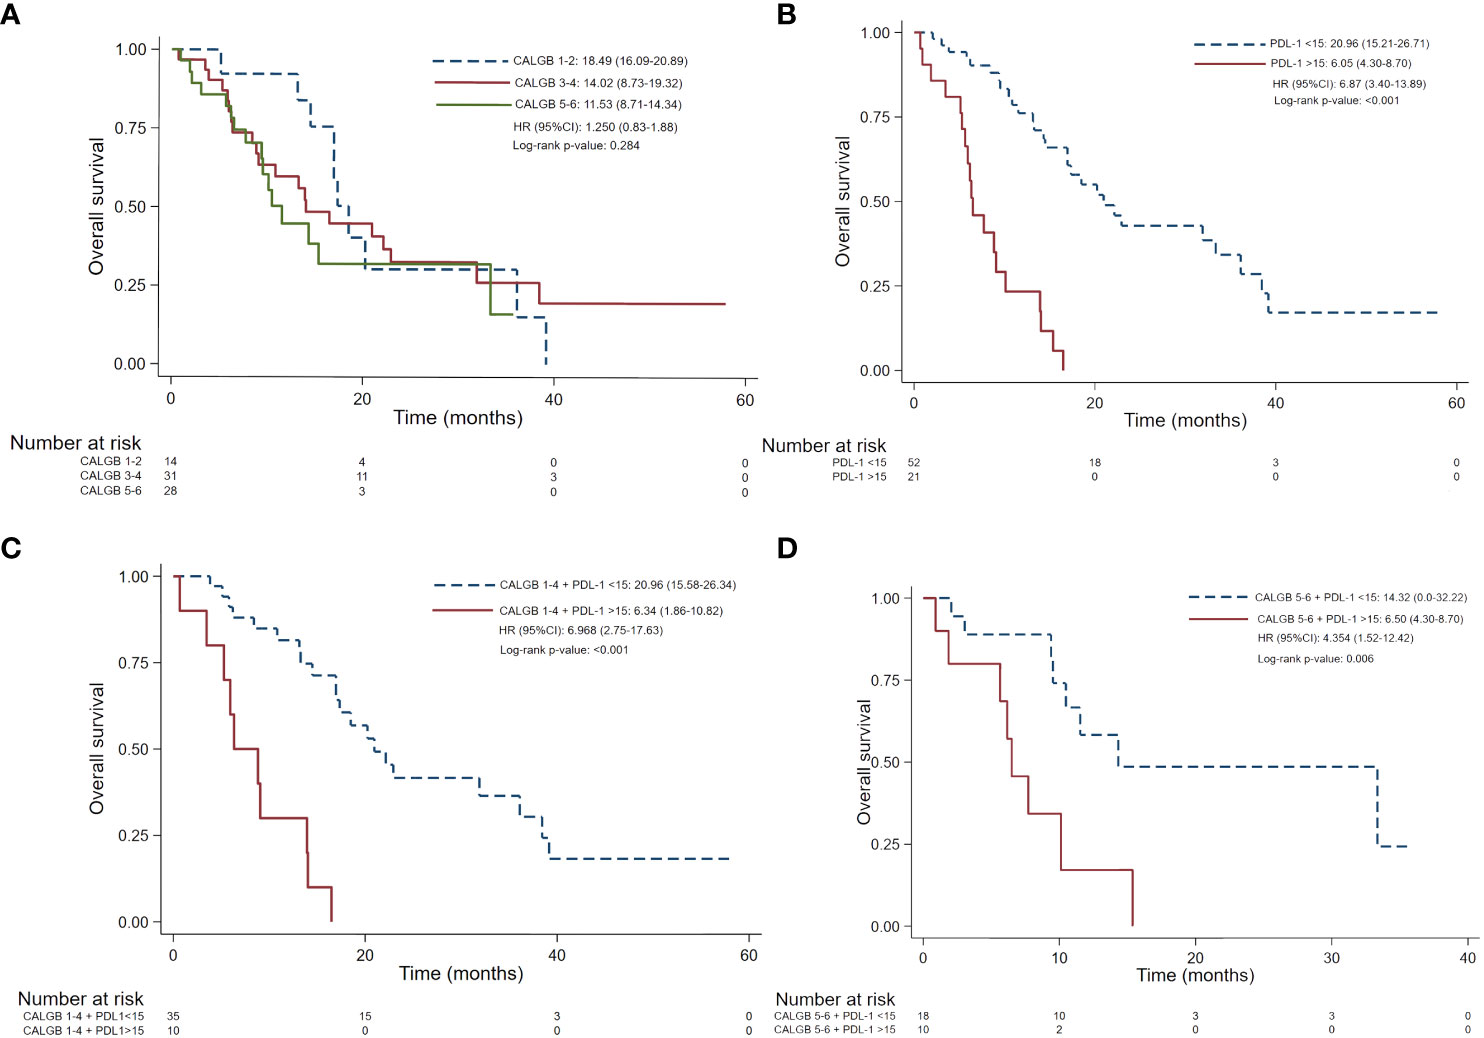
Figure 3 Overall survival according CALGB scales (A) PD-L1 TPS ≥15% (B) CALGB score 1-4 plus PD-L1 TPS >15% (C) CALGB 5-6 plus PD-L1 TPS >15% (D). CALGB, Cancer and Leukemia Group (B) PD-L1, Programmed Cell Death Ligand 1. TPS, tumor proportion score. mOS, median overall survival. Comparisons were performed using *log-rank test. Statistically significant p values were determined as p ≤ 0.05.
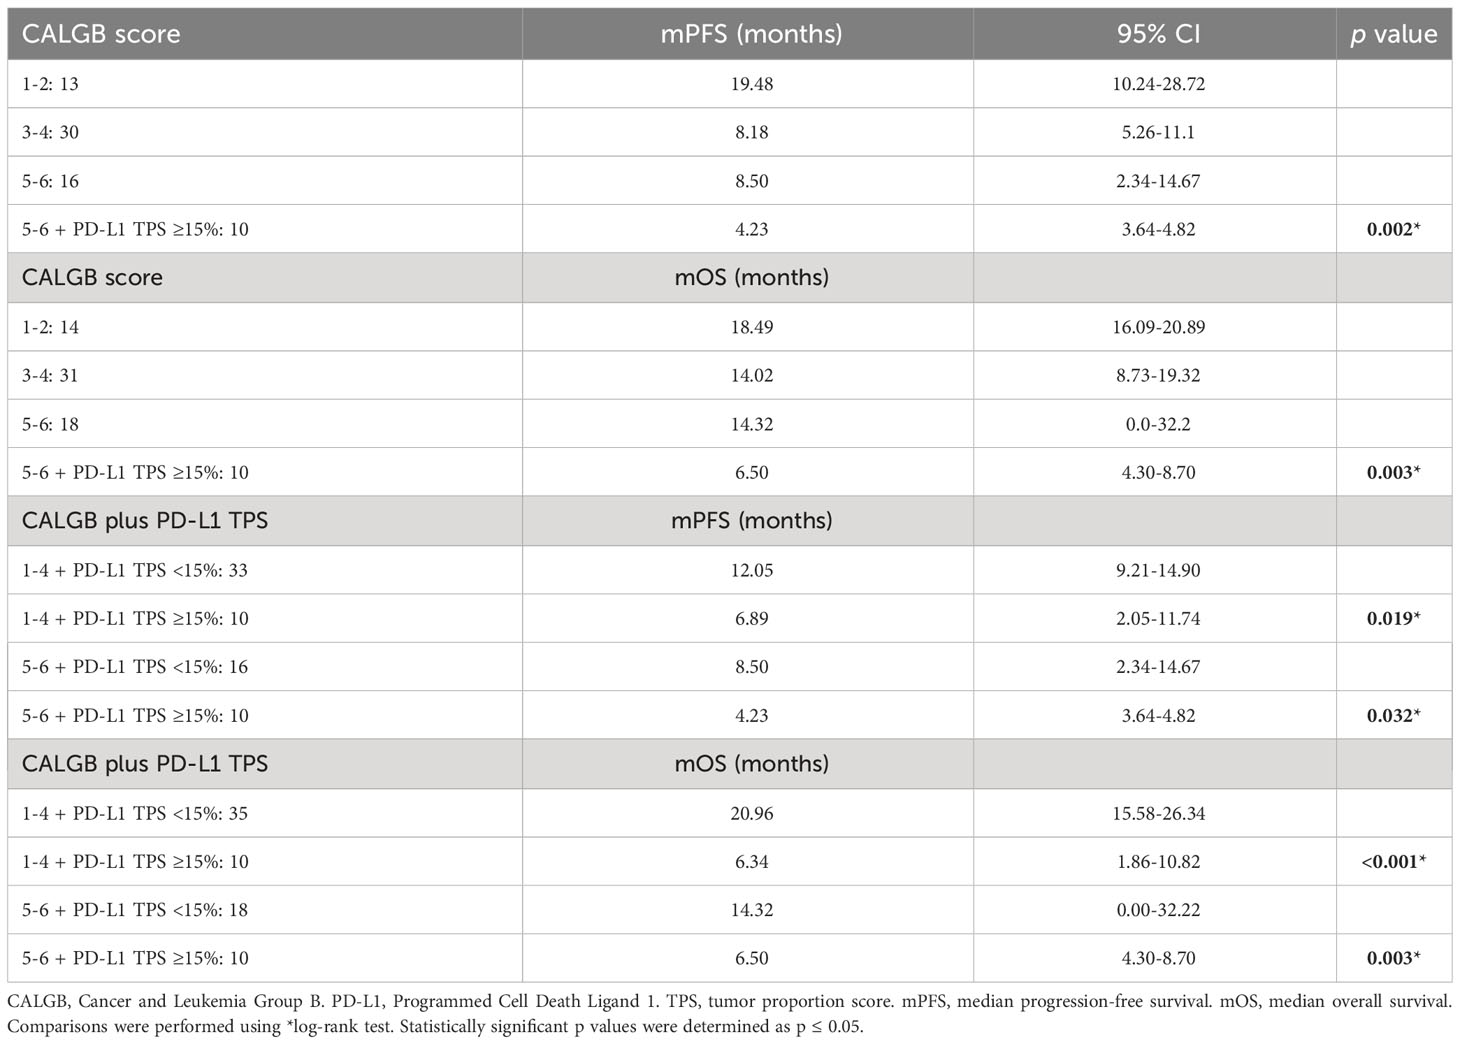
Table 4 Survival outcomes according to CALGB score and PD-L1 TPS.
3.6 Prognostic value of CALGB plus PD-L1 expression according to histologic type
As shown in Figure 4, a sub-analysis in epithelioid histology showed significant differences among individuals with different CALGB scores and PD-L1 expression (p=0.002). Subjects harboring a CALGB 5-6 score showed a worse mPFS (8.50 months; 95% CI 2.34-14.67) and mOS (19.51 months; 95% CI 13.44-25.58) than those having a CALGB 3-4 (mPFS 8.70 months; 95% CI 3.35-14.05 and mOS 26.18 months; 95% CI 18.66-33.70) or CALGB 1-2 scores (mPFS 19.48 months; 95% CI 9.31-29.64 and mOS 17.90 months; 95% CI 16.23-19.57). As well, CALGB 5-6 score plus PD-L1 TPS>15% predicted a worse mPFS (6.65 months; 95% CI 3.64-4.82) and mOS (15.37 months; 95% CI NR-NR) than those harboring CALGB 3-4 score plus PD-L1 TPS >15%, which displayed better mPFS (6.89 months; 95% CI 2.29-11.50) and mOS (14.02 months; 13.87-14.18).
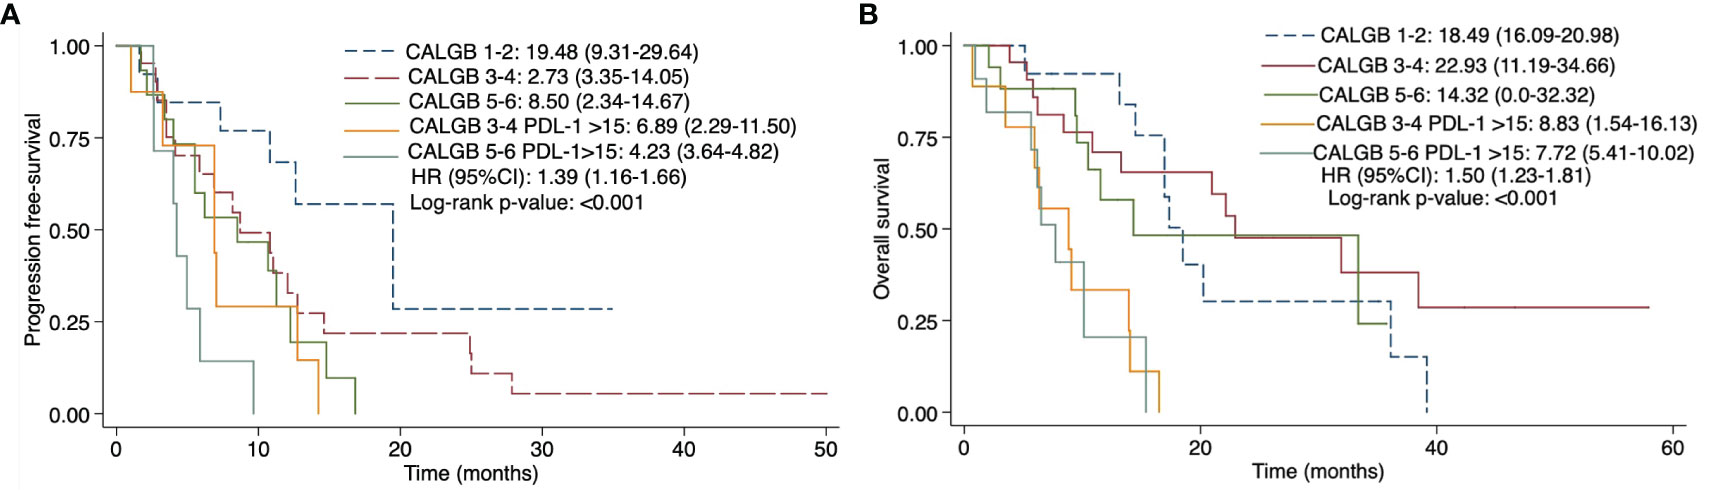
Figure 4 Progression-free survival (A) and overall survival (B) of CALGB 5-6 scale plus PD-L1 TPS ≥15% expression in epithelioid mesothelioma subtype. CALGB, Cancer and Leukemia Group (B) PD-L1, Programmed Cell Death Ligand 1. TPS, tumor proportion score. mOS, median overall survival. Comparisons were performed using *log-rank test. Statistically significant p values were determined as p ≤ 0.05.
4 Discussion
This study places PD-L1 as a promising parameter for complementing CALGB score, ultimately improving its predictive assessment of progressive disease and death in patients with MPM during precision oncology era. PD-L1 prevalence in our cohort (42.4%) is higher than that reported in European cohorts (13), likely derived from divergent exposures to risk factors; for instance, frequencies of smoking history and asbestos inhalation are similar among this cohort and previous Latin American reports (14). As well, PD-L1 expression harbor similar clinical characteristics in other cohorts than in ours, commonly associated with sarcomatous subtype, poorly differentiated histology, and poor prognosis (12, 13).
Regarding PD-L1 staining intensity, other populations have reported higher prevalence of negativity to PD-L1 expression (75-79%), but in a similar way to our study, PD-L1-positive individuals showed a higher proportion of patients with weak staining [(13, 15). Moreover, prognostic assessment based on PD-L1 expression is limited by a lack of consensus regarding its most optimal expression cut-off value affecting clinical outcomes; particularly, our results show a higher prevalence of PD-L1 TPS >1% than other populations (13, 15, 16), which also demonstrated consistent prognostic significance in terms of PFS (10.8 vs 4.96 months; p=0.006) and OS (20.96 vs 9.06 months; p=0.001) compared to other studies; for example, Desage et al. (13) correlated PD-L1 TPS >1% expression with shorter mOS in 77 MPM patients undergoing chemotherapy (4.79 vs 16.3 months). Similarly, a meta-analysis of 16 retrospective studies identified a worse OS in 1899 MPM individuals with PD-L1 expression over 1-5% cut-off value (17). Furthermore, similar cut-off values have been proposed in literature for determining high PD-L1 expression to those set in this study; for example, Brcic et al. (15), identified in a multicenter study worse OS outcome in 203 individuals with MPM (6.05 vs 20.9 months) exhibiting high PD-L1 expression (TPS >10%). Therefore, PD-L1 represents a poor prognostic factor in multiple studies.
These findings suggest a relevant biological transcendence of PD-L1, which focuses on its intrinsic immunosuppressive role, impairing cytotoxic cell responses and promoting tumor progression (18). This study did not evaluate tumoral immune infiltration, constituting an important limitation in this regard, but extensive research has revealed that PD-L1 may not be a feasible biomarker for predicting tumoral infiltration; Cedres and cols (13). did not find a significant relationship between Tumoral Infiltrating Lymphocytes (TILs) and PD-L1 expression in MPM patients, but those with positive (TPS >1%) PD-L1 expression showed higher presence of CD8+ or CD4+ lymphocytes (13). Complementary, other immune factors may also be involved in MPM progression are enriched infiltration of M2 macrophages, along with impaired T CD8+ CD163+ cell functionality, caused by macrophage-released arginase, IL-10, and TGF-β, and tumor-associated fibroblasts (10), which are known to create an immunosuppressive microenvironment (19). Other biomarkers are currently studied for their prognostic significance in mesothelioma, such as GLUT-1, COX-2, p27 (9),, CDKN2Adeletion (20), neutrophil-to-lymphocyte ratio (NLR), platelet-to-lymphocyte ratio (PLR), monocyte-to-lymphocyte ratio (MLR) (19), and low RRM1 and ERCC1 (21), but these have not been explored in large-sampled studies to completely generalize their usage in clinical practice. Furthermore, novel prognostic scales have been created in recent years considering the clinical and molecular aspects of MPM, showing worse survival outcomes in patients with certain oncogenic alterations (22), cellular adherence markers (23), and clinical stages (24).
Although PD-L1 has been widely demonstrated to affect survival outcomes in mesothelioma, it is not entirely predictive of response. PD-L1 (TPS>15%) predicts a poorer prognosis in addition to CALGB (any grade) than using CALGB alone; thus, PD-L1 may improve predictive accuracy of CALGB in MPM patients (8, 21). Addition of PD-L1 expression to CALGB score also demonstrated to predict poorer survival outcomes among individuals with epithelial histology, even after previous studies have not demonstrated significant differences in PD-L1 expression between epithelial and non-epithelial histologies of MPM; thus, these findings suggest that complementing CALGB score with PD-L1 expression may harbor an unveiled biological relationship among them which demands further study. Moreover, although CALGB is part of the current prognostic assessment of malignant pleural mesothelioma, its design adjusts to classical therapeutic approaches and results inaccurate for emergent immunotherapy-based regimens, which demands the inclusion of immunological biomarkers, such as PD-L1. Furthermore, survival outcomes predicted for different CALGB groups in this study were slightly different from those previously reported in different cohorts, which may be attributed to variations in their therapeutic management (25). In this regard, our cohort underwent standard treatment with cisplatin and pemetrexed, but better clinical outcomes have been described in previous evidence by combining chemotherapy with bevacizumab (19), pembrolizumab (26), gemcitabine as continuous infusion (27), liposomal doxorubicin (28), or substituting it with ipilimumab plus nivolumab (6). In contrast, lack of benefit has been identified in unresectable epithelioid MPM after monotherapy with CTLA-4 (29) as second-line of treatment or VEGF (30) blockers as first-line approach. CALGB has demonstrated inconsistent results for estimating prognosis during follow-up of MPM individuals undergoing second-lines of treatment; for instance, Dudek and cols (31). identified non-significant differences between MPM subjects previously treated with pemetrexed-carboplatin, who then underwent maintenance with pemetrexed.
This report has some limitations, among which the most representative are its retrospective nature and small sample size, which may affect generalizing its findings to populations with different characteristics. As well, derived from the immunosuppressive role of PD-L1 in tumoral biology, the lack of measurement of infiltrating immunologic cells in tumoral microenvironment represents an important limitation in the comprehension of the underlying mechanism behind our results. Then, these findings support the future performance of larger-sampled prospective studies exploring the immunologic microenvironmental implications of complementing CALGB with PD-L1 expression.
5 Conclusion
PD-L1 addition to CALGB scores represents an independent prognostic factor for shorter PFS and OS in advanced-stage MPM patients, thereby expanding the predictive accuracy of CALGB alone. The main contribution of this study is highlighting the need to design novel prognostic scales, including immune biomarkers, to promote better therapeutic personalization in Latin American individuals with this disease.
Data availability statement
The raw data supporting the conclusions of this article will be made available by the authors, without undue reservation.
Ethics statement
The studies involving humans were approved by Institutional Ethics Committee and Scientific Committees. The studies were conducted in accordance with the local legislation and institutional requirements. Written informed consent for participation was not required from the participants or the participants’ legal guardians/next of kin because Informed consent was waived because this was a retrospective study.
Author contributions
OA: Conceptualization, Writing – original draft, Writing – review & editing. AA-S: Formal Analysis, Methodology, Writing – review & editing. LC-M: Methodology, Writing – original draft, Writing – review & editing. NH-P: Formal Analysis, Methodology, Writing – original draft, Writing – review & editing. DV-L: Methodology, Writing – review & editing. WM-M: Conceptualization, Writing – original draft. DM-K: Writing – original draft, Writing – review & editing. LC-R: Supervision, Writing – original draft, Writing – review & editing. CM: Conceptualization, Supervision, Writing – original draft, Writing – review & editing. AC: Writing – original draft, Writing – review & editing. CP-P: Project administration, Writing – review & editing. SS: Conceptualization, Writing – original draft, Writing – review & editing.
Funding
The author(s) received no financial support for the research, authorship, and/or publication of this article.
Conflict of interest
The authors declare that the research was conducted in the absence of any commercial or financial relationships that could be construed as a potential conflict of interest.
Publisher’s note
All claims expressed in this article are solely those of the authors and do not necessarily represent those of their affiliated organizations, or those of the publisher, the editors and the reviewers. Any product that may be evaluated in this article, or claim that may be made by its manufacturer, is not guaranteed or endorsed by the publisher.
Supplementary material
The Supplementary Material for this article can be found online at: https://www.frontiersin.org/articles/10.3389/fonc.2023.1269029/full#supplementary-material
References
1. Arrieta O, López-Macías D, Mendoza-García VO, Bacon-Fonseca L, Muñoz-Montaño W, Macedo-Pérez EO, et al. A phase II trial of prolonged, continuous infusion of low-dose gemcitabine plus cisplatin in patients with advanced Malignant pleural mesothelioma. Cancer Chemother Pharmacol (2014) 73(5):975–82. doi: 10.1007/s00280-014-2429-5
2. Noonan CW. Environmental asbestos exposure and risk of mesothelioma. Ann Trans Med (2017) 5:1–11. doi: 10.21037/atm.2017.03.74
3. Saracci R. Erionite and cancer in a Mexican village. Occup Environ Med (2015) 72:163–4. doi: 10.1136/oemed-2014-102544
4. Yanagawa J, Rusch V. Surgical management of Malignant pleural mesothelioma. Thorac Surg Clin (2013) 23(1):73–87. doi: 10.1016/j.thorsurg.2012.10.002
5. Cantini L, Hassan R, Sterman DH, Aerts JGJV. Emerging treatments for Malignant pleural mesothelioma: where are we heading? Front Oncol (2020) 10. doi: 10.3389/fonc.2020.00343
6. Baas P, Scherpereel A, Nowak AK, Fujimoto N, Peters S, Tsao AS, et al. First-line nivolumab plus ipilimumab in unresectable Malignant pleural mesothelioma (CheckMate 743): a multicentre, randomised, open-label, phase 3 trial. Lancet (2021) 397(10272):375–86. doi: 10.1016/S0140-6736(20)32714-8
7. Watanabe T, Okuda K, Murase T, Moriyama S, Haneda H, Kawano O, et al. Four immunohistochemical assays to measure the PD-L1 expression in Malignant pleural mesothelioma. Oncotarget (2018) 9(29):20769–80. doi: 10.18632%2Foncotarget.25100
8. Nguyen BH, Montgomery R, Fadia M, Wang J, Ali S. PD-L1 expression associated with worse survival outcome in Malignant pleural mesothelioma. Asia Pac J Clin Oncol (2018) 14(1):69–73. doi: 10.1111/ajco.12788
9. Steele JPC, Klabatsa A, Fennell DA, Palläska A, Sheaff MT, Evans MT, et al. Prognostic factors in mesothelioma. Lung Cancer. (2005) 49(SUPPL. 1):49–52. doi: 10.1016/j.lungcan.2005.03.009
10. Chu GJ, van Zandwijk N, Rasko JEJ. The immune microenvironment in mesothelioma: mechanisms of resistance to immunotherapy. Front Oncol (2019) 9. doi: 10.3389/fonc.2019.01366
11. Berzenji L, Van Schil PE, Carp L. The eighth TNM classification for Malignant pleural mesothelioma. Transl Lung Cancer Res (2018) 7(5):543–9. doi: 10.21037/tlcr.2018.07.05
12. Avilés-Salas A, Flores-Estrada D, Lara-Mejía L, Catalán R, Cruz-Rico G, Orozco-Morales M, et al. Modifying factors of PD-L1 expression on tumor cells in advanced non-small-cell lung cancer. Thorac Cancer. (2022) 13(23):3362–73. doi: 10.1111/1759-7714.14695
13. Cedrés S, Ponce-Aix S, Zugazagoitia J, Sansano I, Enguita A, Navarro-Mendivil A, et al. Analysis of expression of programmed cell death 1 ligand 1 (PD-L1) in Malignant pleural mesothelioma (MPM). PloS One (2015) 10(3):1–12. doi: 10.1371/journal.pone.0121071
14. Rojas L, Cardona AF, Trejo-Rosales R, Zatarain-Barrón ZL, Ramírez-Tirado LA, Ruiz-Patiño A, et al. Characteristics and long-term outcomes of advanced pleural mesothelioma in Latin America (MeSO-CLICaP). Thorac Cancer. (2019) 10(3):508–18. doi: 10.1111/1759-7714.12967
15. Brcic L, Klikovits T, Megyesfalvi Z, Mosleh B, Sinn K, Hritcu R, et al. Prognostic impact of PD-1 and PD-L1 expression in Malignant pleural mesothelioma: An international multicenter study. Transl Lung Cancer Res (2021) 10(4):1594–607. doi: 10.21037/tlcr-20-1114
16. Remon J, Passiglia F, Ahn MJ, Barlesi F, Forde PM, Garon EB, et al. Immune checkpoint inhibitors in thoracic Malignancies: review of the existing evidence by an IASLC expert panel and recommendations. J Thorac Oncol (2020) 15(6):914–47. doi: 10.1016/j.jtho.2020.03.006
17. Jin L, Gu W, Li X, Xie L, Wang L, Chen Z. PD-L1 and prognosis in patients with Malignant pleural mesothelioma: a meta-analysis and bioinformatics study. Ther Adv Med Oncol (2020) 12:1–14. doi: 10.1177/1758835920962362
18. Han Y, Liu D, Li L. PD-1/PD-L1 pathway: current researches in cancer. Am J Cancer Res (2020) 10(3):727–42.
19. Désage AL, Karpathiou G, Peoc’h M, Froudarakis ME. The immune microenvironment of Malignant pleural mesothelioma: A literature review. Cancers (2021) 13:1–31. doi: 10.3390/cancers13133205
20. Pass H. Biomarkers and prognostic factors for mesothelioma. Ann Cardiothorac Surg (2012) 1(4):449–56. doi: 10.3978%2Fj.issn.2225-319X.2012.10.
21. Muñoz-Montaño W, Muñiz-Hernández S, Avilés-Salas A, Catalán R, Lara-Mejía L, Samtani-Bassarmal S, et al. RRM1 and ERCC1 as biomarkers in patients with locally advanced and metastatic Malignant pleural mesothelioma treated with continuous infusion of low-dose gemcitabine plus cisplatin. BMC Cancer. (2021) 21(1):1–11. doi: 10.1186/s12885-021-08287-5
22. De Reynies A, Jaurand MC, Renier A, Couchy G, Hysi I, Elarouci N, et al. Molecular classification of Malignant pleural mesothelioma: Identification of a poor prognosis subgroup linked to the epithelial-to-mesenchymal transition. Clin Cancer Res (2014) 20(5):1323–34. doi: 10.1158/1078-0432.CCR-13-2429
23. Yeap BY, De Rienzo A, Gill RR, Oster ME, Dao MN, Dao NT, et al. Mesothelioma risk score: A new prognostic pretreatment, clinical-molecular algorithm for Malignant pleural mesothelioma. J Thorac Oncol (2021) 16(11):1925–35. doi: 10.1016/j.jtho.2021.06.014
24. Nasser A, Barid A, Saint-Pierre MD, Laurie SA, Wheatley-Price P. Real-world prognostic model for Malignant pleural mesothelioma. In: 2021 ASCO annual meeting. American association of clinical oncology (2021). Virginia, United States of America: American Association of Clinical Oncology.
25. Edwards JG, Abrams KR, Leverment JN, Spyt TJ, Waller DA, O’byrne J. Prognostic factors for Malignant mesothelioma in 142 patients: validation of CALGB and EORTC prognostic scoring systems. Thorax (2000) 55(9):731–35. doi: 10.1136%2Fthorax.55.9.731
26. Chu QS, Piccirillo MC, Greillier L, Grosso F, Lo Russo G, Florescu M, et al. IND227 phase III (P3) study of cisplatin/pemetrexed (CP) with or without pembrolizumab (pembro) in patients (pts) with Malignant pleural mesothelioma (PM): A CCTG, NCIN, and IFCT trial. J Clin Oncol (2023) 41(17_suppl):LBA8505–LBA8505. doi: 10.1200/JCO.2023.41.17_suppl.LBA8505
27. Arrieta O, Muñoz-Montaño W, Muñiz-Hernández S, Campos S, Catalán R, Soto-Molina H, et al. Efficacy, safety, and cost-minimization analysis of continuous infusion of low-dose gemcitabine plus cisplatin in patients with unresectable Malignant pleural mesothelioma. Front Oncol (2021) 11. doi: 10.3389/fonc.2021.641975
28. Arrieta O, Medina LA, Estrada-Lobato E, Ramírez-Tirado LA, Mendoza-García VO, de la Garza-Salazar J. High liposomal doxorubicin tumour tissue distribution, as determined by radiopharmaceutical labelling with 99mTc-LD, is associated with the response and survival of patients with unresectable pleural mesothelioma treated with a combination of liposomal doxorubicin and cisplatin. Cancer Chemother Pharmacol (2014) 74(1):211–5. doi: 10.1007/s00280-014-2477-x
29. Maio M, Scherpereel A, Calabrò L, Aerts J, Perez SC, Bearz A, et al. Tremelimumab as second-line or third-line treatment in relapsed Malignant mesothelioma (DETERMINE): a multicentre, international, randomised, double-blind, placebo-controlled phase 2b trial. Lancet Oncol (2017) 18(9):1261–73. doi: 10.1016/S1470-2045(17)30446-1
30. Scagliotti GV, Gaafar R, Nowak AK, Nakano T, van Meerbeeck J, Popat S, et al. Nintedanib in combination with pemetrexed and cisplatin for chemotherapy-naive patients with advanced Malignant pleural mesothelioma (LUME-Meso): a double-blind, randomised, placebo-controlled phase 3 trial. Lancet Respir Med (2019) 7(7):569–80. doi: 10.1016/S2213-2600(19)30139-0
Keywords: PD-L1, CALGB, mesothelioma, prognostic factor, immunohistochemistry
Citation: Avilés-Salas A, Cabrera-Miranda L, Hernández-Pedro N, Vargas-Lías DS, Samtani S, Muñoz-Montaño W, Motola-Kuba D, Corrales-Rodríguez L, Martín C, Cardona AF, Palomares-Palomares CB and Arrieta O (2023) PD-L1 expression complements CALGB prognostic scoring system in malignant pleural mesothelioma. Front. Oncol. 13:1269029. doi: 10.3389/fonc.2023.1269029
Received: 28 July 2023; Accepted: 30 October 2023;
Published: 04 December 2023.
Edited by:
Giorgio Scagliotti, University of Torino, ItalyCopyright © 2023 Avilés-Salas, Cabrera-Miranda, Hernández-Pedro, Vargas-Lías, Samtani, Muñoz-Montaño, Motola-Kuba, Corrales-Rodríguez, Martín, Cardona, Palomares-Palomares and Arrieta. This is an open-access article distributed under the terms of the Creative Commons Attribution License (CC BY). The use, distribution or reproduction in other forums is permitted, provided the original author(s) and the copyright owner(s) are credited and that the original publication in this journal is cited, in accordance with accepted academic practice. No use, distribution or reproduction is permitted which does not comply with these terms.
*Correspondence: Oscar Arrieta, b2dhckB1bmFtLm14