 Zhen-Hao Li1†Ting Xu2†Ya-Juan Zhang2†Jing-Hang Jiang2Yu-Ze Mi3Jia-Xuan Li4Jing Shen2,5Yi-Rui Fu1Bo-Ying Qin3Fan Lin1Dong-Jing Fu4Mei-Jin Yue2,5Shu-Mei Ma6*
 Quan-Fu Li2*
- 1The Clinical class 6 of First Clinical Medical College, Wenzhou Medical University, Wenzhou, China
- 2Department of Medical Oncology, Ordos Central Hospital, Ordos, China
- 3School of Optometry & Ophthalmology, Wenzhou Medical University, Wenzhou, China
- 4Ordos Clinical College, Inner Mongolia Medical University, Ordos, China
- 5Ordos Clinical College, Baotou Medical College, Ordos, China
- 6School of Public Health and Management, Wenzhou Medical University, Wenzhou, China
Objectives: In this study, we compared the dynamic changes in body composition during XELOX/SOX chemotherapy in patients with gastric cancer. Furthermore, we investigated the potential impact of these changes on the occurrence of toxic side effects.
Methods: Patients with gastric cancer who received adjuvant or first-line XELOX/SOX chemotherapy between January 2020 and June 2023 were enrolled. The Brief Conghua Scale was used to assess energy intake, and nutritional management was carried out with reference to the Chinese Guidelines for Nutritional Therapy of Cancer 2020. The NRS 2002 Nutritional Risk Screening Scale, PG-SGA scale, bioelectrical impedance analysis, and dynamic changes in lumbar 3 vertebral skeletal muscle index were compared between baseline and post-chemotherapy in the study. The neutropenia was evaluated using the Common Terminology Criteria for Adverse Events V.5.0, developed by the National Institutes of Health.
Results: Dynamic follow-up was completed in 39 cases, with a mean follow-up time of 117.62 ± 43.38 days. The incidence of sarcopenia increased significantly after chemotherapy, escalating from 46.2% to 51.3%. After chemotherapy, the mean L3SMI decreased from 36.00 cm2/m2 to 34.99 cm2/m2. Furthermore, when compared to pre-chemotherapy values, the body composition indexes body mass index (BMI), SL3, fat mass free index (FFMI), lean body mass (LBM), and body surface area (BSA) were significantly reduced after chemotherapy. Regardless of baseline or post-chemotherapy status, the incidence of grade ≥ 3 neutropenia was significantly higher in the sarcopenia group than in the non-sarcopenia group. Furthermore, when the skeletal muscle index decreased during chemotherapy, the incidence of grade ≥ 3 neutropenia was significantly higher in both the sarcopenia and non-sarcopenia groups compared to baseline. When the incidence of grade ≥ 3 neutropenia in the post-chemotherapy sarcopenia group was compared to baseline status, the increase was significantly higher in the sarcopenia group than in the maintenance/increase group.
Conclusions: Skeletal muscle mass decreased progressively during XELOX/SOX chemotherapy in gastric cancer patients, followed by a higher incidence of grade ≥ 3 neutropenia.
1 Introduction
According to the Global Cancer Statistics 2020 (GLOBOCAN), gastric cancer has the fifth highest incidence rate and the fourth highest mortality rate among all cancers globally. There are significant geographical variations in its incidence and mortality rates. Gastric cancer ranks third in China in terms of both incidence and mortality rates (1). XELOX (capecitabine + oxaliplatin) or SOX (tegafur, gimeracil, and oteracil potassium + oxaliplatin) is the recommended chemotherapy regimen for postoperative adjuvant or advanced first-line treatment in patients with gastric cancer (2, 3). Chemotherapy is associated with a progressive loss of skeletal muscle mass, and the mechanisms involved include uncontrolled muscle protein catabolism, chemotherapy-induced mitochondrial damage, an increase in reactive oxygen species, an increase in tumor growth factor (TGF) β protein, and a reduction in muscle microvasculature, among others. Adverse events during chemotherapy such as fatigue, loss of appetite, nausea, vomiting, and diarrhea negatively affect food intake and physical activity and further lead to muscle quantity and quality decreasing dramatically (4).
Due to their specific physiological functions, malignant tumors of the digestive system have a significant impact on human nutritional status. Clinical investigations have confirmed that the L3 skeletal muscle index (L3SMI) decreases significantly in patients with gastric cancer during chemotherapy. Meta-analyses have also revealed that patients with gastric cancer with sarcopenia have increased chemotherapy-related toxicities and a poor prognosis (5, 6). Skeletal muscle mass is currently assessed using bioelectrical impedance analysis (BIA), dual-energy x-ray absorptiometry (DXA), computed tomography (CT) and magnetic resonance imaging (MRI). Among them, L3SMI has been shown to correlate well with whole-body muscle. Due to the prevalence of CT examinations in patients with tumors, it is widely recognized as the gold standard for measuring muscle mass, particularly in patients with tumors (7, 8).
Our research team has concentrated on the dynamic monitoring of sarcopenia. According to published reviews, skeletal muscle loss can occur during antitumor therapy. In the meanwhile, past research has shown that active nutritional interventions can help patients with gastrointestinal cancer with sarcopenia maintain anabolic muscle metabolism potential, prevent muscle loss and even gain muscle (9, 10). However, current data in this field, are primarily based on retrospective analyses of European and American populations or clinical investigations that include a variety of gastrointestinal tumors (9, 10).
Thus, a prospective, self-controlled clinical study was conducted in the context of real-world clinical nutritional management to analyze the dynamic changes in body composition during chemotherapy in gastric cancer patients receiving XELOX/SOX and assess the impact on toxic side effects.
2 Materials and methods
A prospective study was conducted to investigate the dynamic changes in L3SMI in patients with gastric cancer admitted to the Department of Medical Oncology of Ordos Central Hospital between January 2020 and June 2023. In a self-controlled study, the patients underwent adjuvant or first-line six-cycle XELOX/SOX chemotherapy. The study was approved by the Medical Ethics Committee of Ordos Central Hospital (2021-013). All participants provided written informed consent, and the study was registered with the China Clinical Trial Center (ChiCTR2200056758).
2.1 Enrollment criteria
2.1.1 Inclusion criteria
① Age ≥ 18 years old, pathologically confirmed gastric cancer to receive SOX or XELOX regimen chemotherapy, oxaliplatin dosage strength of 130 mg/m2, tegafur, gimeracil, and oteracil potassium of 40 mg/m2, or capecitabine of 1000 mg/m2; ② Expected survival time ≥ 6 months which was evaluated by clinical doctors based on imaging examination and laboratory testing results, besides these evaluation also considering ZPS Performance Status and PG-SGA scale; ③ No abnormalities in liver and kidney function, blood routine, electrocardiogram prior to chemotherapy, blood test must satisfy the following requirements: leukocytes > 3.5 × 10⁹/L, neutrophils > 1.5 × 10⁹/L, platelets > 85 × 109/L, alkaline phosphatase ≤ 2.5 times the upper limit of normal, serum alanine transferase (ALT) and aspartate aminotransferase (AST) ≤ 3 times the upper limit of normal, bilirubin ≤ 1.5 times the upper limit of normal, creatinine ≤ 1.5 times the upper limit of normal; ④ No other contraindications to chemotherapy; ⑤ CT scan and the initiation of chemotherapy without resorting to interventions such as surgery to alter body composition; ⑥ Individuals who can undergo regular follow-up assessments using BIA and CT; ⑦ Those who are capable of providing informed consent and signing the consent form.
2.1.2 Exclusion criteria
① patients with hypersensitivity to oxaliplatin, tegafur, gimeracil, and oteracil potassium, or capecitabine; ② patients receiving prophylactic application of long-acting drug for increasing white cells after chemotherapy; ③ Patients who were bedridden at the time of enrollment and could not cooperate with nutritional assessment; ④ those with other serious consumptive diseases, such as diabetes; ⑤ those with serious mental illnesses and poor compliance; ⑥ those who discontinued antitumor therapy on their own or did not have regular follow-up with body composition analysis or side effects; ⑦ those who were deemed unsuitable for enrollment in the study by the investigator.
2.2 Clinical nutritional management measures
The energy intake of enrolled patients with gastric cancer was evaluated using the Concise Conghua Scale which have been published on our team previously reported clinical nutrition research paper although the method is not validated in GI tumors patients (9), and clinical nutritional management was carried out during hospitalization or outpatient visits using methods recommended by the China Oncology Nutritional Guidelines of the Committee on Oncology Nutrition and Supportive Therapies of the China Anti-Cancer Association (11, 12). The daily intake of the patients (including dietary, enteral, and/or parenteral nutrition) must be at least 70% of the target value. The protein requirement was 1.0~2.0 g/kg/d, which was calculated using the optimum body weight of the individual. When the next step fails to meet 60% of the target requirement for more than 3~5 days, the nutritional treatment plan from the previous step is selected. The assessment results and the patient’s preferences were used to determine whether tube-fed enteral nutrition or parenteral nutrition support should be provided.
3 Data collection
3.1 Information collection
After the initial admission, general information such as name, age, pathological stage, tumor site, and adjuvant or first-line chemotherapy regimen was collected.
3.2 Height and weight measurements
After each admission, patients underwent height and weight measurements using standard methods. The following formulas were used to compute BMI and BSA: BMI = weight (kg)/height^2 (m2); BSA (m2) = [height (cm) + weight (kg) - 60]/100.
3.3 Body composition measurements
① NRS 2002 and PG-SGA assessment: Enrolled patients were evaluated on a scale by a full-time nutritional nurse specializing in oncology within 12 hours after hospital admission; NRS ≥ 3 was classified as being at nutritional risk. The PG-SGA assessment yielded the following results: A/≤ 1 (well-nourished); B/2-8 (suspected or moderate malnutrition); and C/≥ 9 (severe malnutrition);
② BIA test: Using a clinical nutritional testing analyzer (model: CNA-H1), all enrolled patients underwent body composition measurements, including body fat, skeletal muscle mass, and body fat percentage. When measuring body composition using the bioelectrical impedance method, it was necessary to maintain a suitable ambient temperature (20°C–25°C), measure on an empty stomach, empty the bowels before the measurement, and avoid measuring after exercise, showering, or during menstruation for females. Use the following formula to compute the Fat-Free Mass Index (FFMI): (1- percentage of body fat) × weight (kg) ÷ height (m2). The FFMI low standard is ≤ 17.4 kg/m2 for males and ≤ 15.0 kg/m2 for females (12).
③ Abdominal CT scanning: Abdominal CT lumbar 3 vertebrae consecutive level scanning without contrast was performed within 30 days of chemotherapy medication after patient enrollment, -70 to +150 HU units, with 5 mm as layer thickness, and two consecutive transverse level images of the same sequence of the lumbar 3 vertebrae were selected to analyze the muscle area, and radiation therapy TPS software (XIO) was used to calculate the skeletal muscles (including the psoas major muscle, erector spinae, quadratus lumborum, transversus abdominis muscles, external abdominal obliques, and internal abdominal obliques) by summing their cross-sectional areas. L3 skeletal muscle index (SMI) = L3 vertebral skeletal muscle area (cm²)/height² (cm²) (13). LBM (whole body lean body soft mass) = 0.3 * [L3 vertebral skeletal muscle area (cm2)] + 6.06 (13).
3.4 Laboratory tests and toxic side effects
The fasting venous blood of patients was drawn and sent for examination within 24 hours of drug administration, and the indexes, including liver function, renal function, and peripheral blood hemogram, were recorded. Hematologic and non-hematologic toxicity were dynamically monitored during the inter-chemotherapy period, and the toxic side effects of neutropenia were graded and recorded using CTCAE5.0 (14).
4 Statistical methods
RStudio 4.3.1 software and SPSS 26.0 statistical software were used to analyze the data. A baseline-corrected linear model was used to analyze the data from before and after changes to each index. Measurements conforming to the normal distribution are expressed as the mean ± standard deviation (`x ± s). If they did not conform to the normal distribution, they were analyzed using the Wilcoxon signed-rank sum test and the Mann-Whitney U test. Frequency-distributed count data are expressed as rates. The paired-sample t-test was used to analyze the data for each index before and after changes. The Pearson’s test and the chi-squared test were used to conduct correlation analysis, with P < 0.05 indicating a statistically significant difference.
5 Results
5.1 Clinical characteristics of the patients
The study comprised 65 patients; however, only 39 were able to complete the dynamic follow-up due to the influence of the COVID-19 pandemic. Table 1 shows the clinical characteristics of the patients with gastric malignancy who participated in the study. According to Table 1, the majority of the patients (84.6%) were male. The average age of the patients was 60.21 ± 11.17 years, and the duration of follow-up was 117.62 ± 43.38 days. According to the evaluation criteria for Asian patients with tumors with sarcopenia, male patients were classified as sarcopenic if their L3SMI was < 36 cm2/m2, while female patients were classified as sarcopenic if their L3SMI was < 29 cm2/m2 (15). Based on these parameters, all patients were divided into two groups: the sarcopenia group (group A) and the non-sarcopenia group (group B). In addition, the BMI grouping method used in this study was based on the criteria outlined in the Chinese Guidelines for Nutritional Therapy of Cancer 2020 (12). According to the guidelines, 1) a BMI less than 18.5 was considered indicative of underweight or malnutrition; 2) a BMI between 18.5 and 23.9 was considered normal; and 3) a BMI between 24 and 27.9 was considered overweight. The prevalence of sarcopenia in the study population was found to be 46.2% (18/39). Nutritional management was offered to patients in a clinical setting, with 89.7% of patients receiving nutritional education and parenteral nutritional support, while 10.3% received gastrointestinal nutritional tube support.
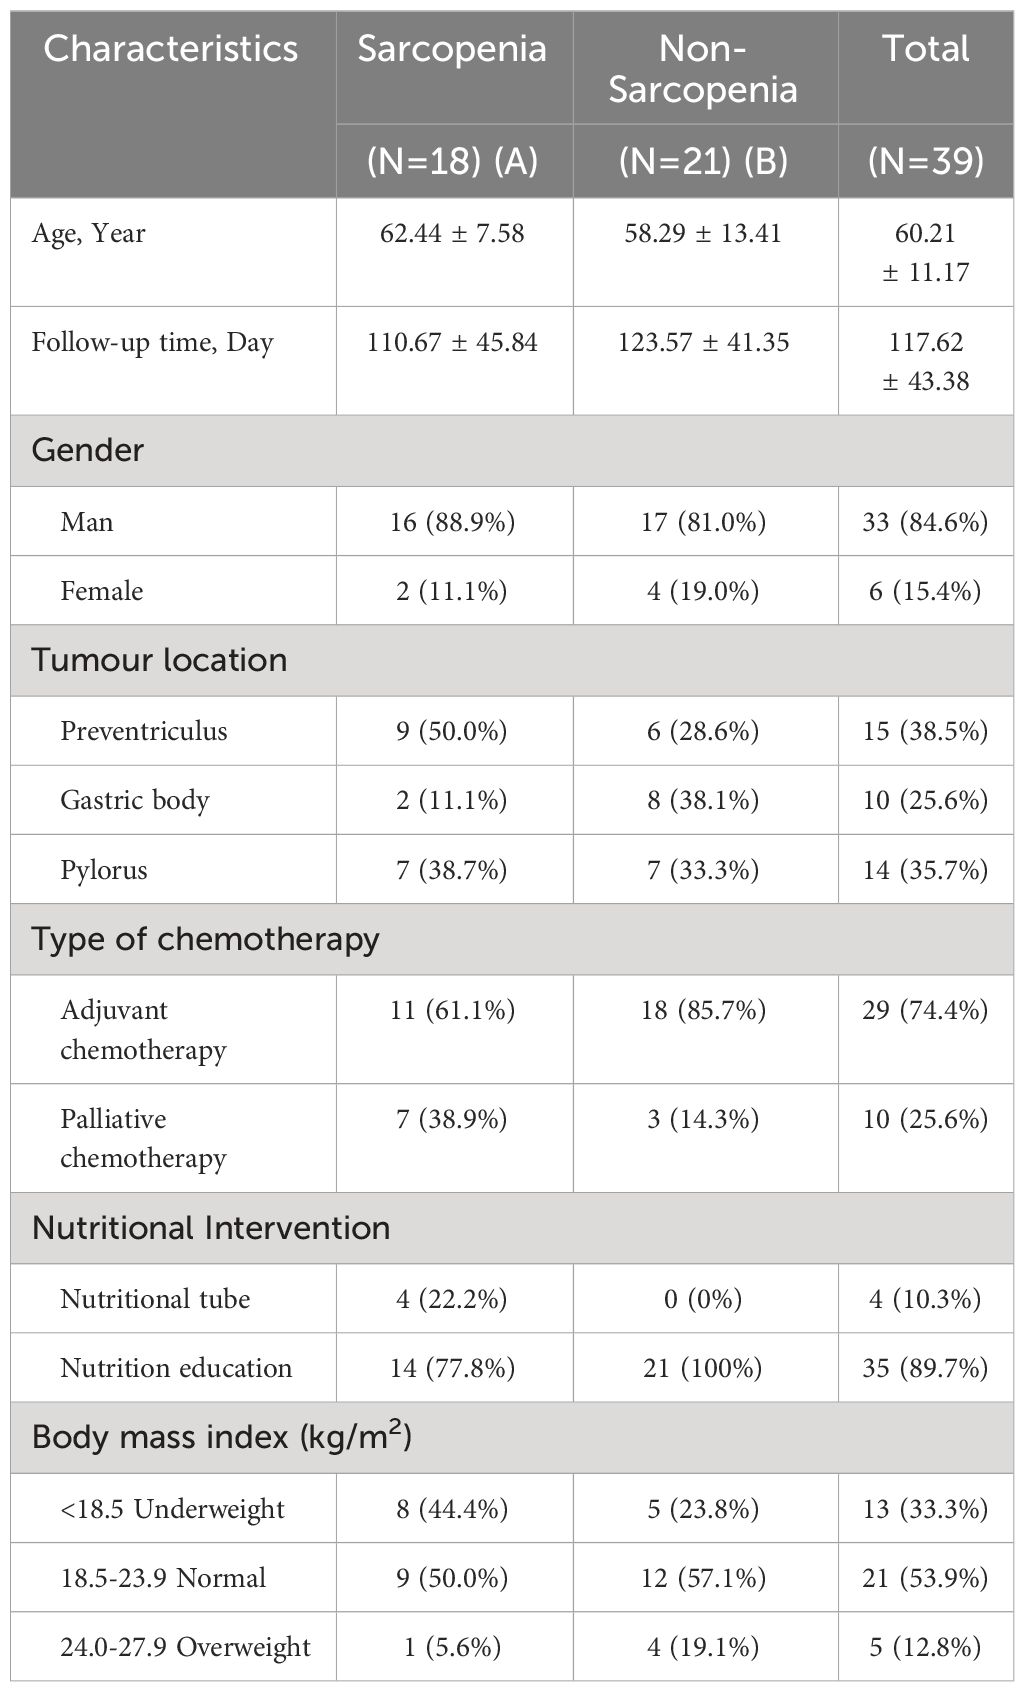
Table 1 Clinical characteristics of patients.
5.2 Alterations in body composition-related indicators before and after chemotherapy
The patients were divided into two groups: the baseline chemotherapy group (G1 group) and the end-of-chemotherapy group (G2 group). Table 2 summarizes the alterations observed in BMI, SL3, L3SMI, LBM, FFMI, weight, BSA, PG-SGA Scale, and NRS-2002 Scale, as well as grade ≥ 3 neutropenia in all patients before and after chemotherapy. Within the framework of clinical nutritional management in the real world, the PG-SGA Nutritional Assessment Scale and NRS-2002 Scale exhibited a significant decrease following chemotherapy as compared to the pre-chemotherapy values (P = 0.000, P = 0.000). However, the body composition indexes, including BMI, SL3, FFMI, LBM, and BSA, exhibited statistically significant decreases in their disparities following chemotherapy compared to pre-chemotherapy levels (P = 0.000, P = 0.0457, P = 0.01586, P = 0.0458, P = 0.0457). L3SMI also exhibited a decrease, but it was not statistically significant.
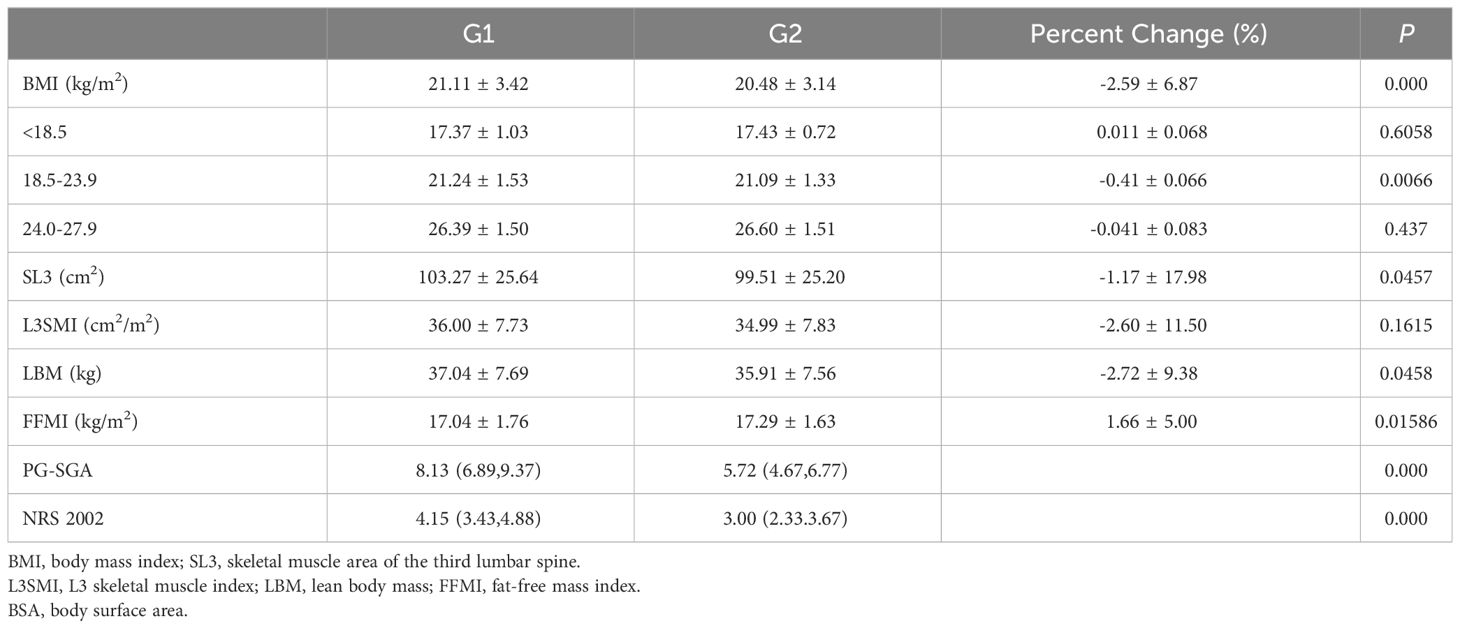
Table 2 Comparison of body composition related indicators between G1 and G2.
Individuals had significant variations in BMI and SMI, as depicted in Figure 1. Specifically, two male patients, C1 and C2, exhibited identical BMI values, yet their SMIs differed by 17.1%. Similarly, two male patients, D1 and D2, displayed the same SMI, but their BMIs differed by 25.1%.
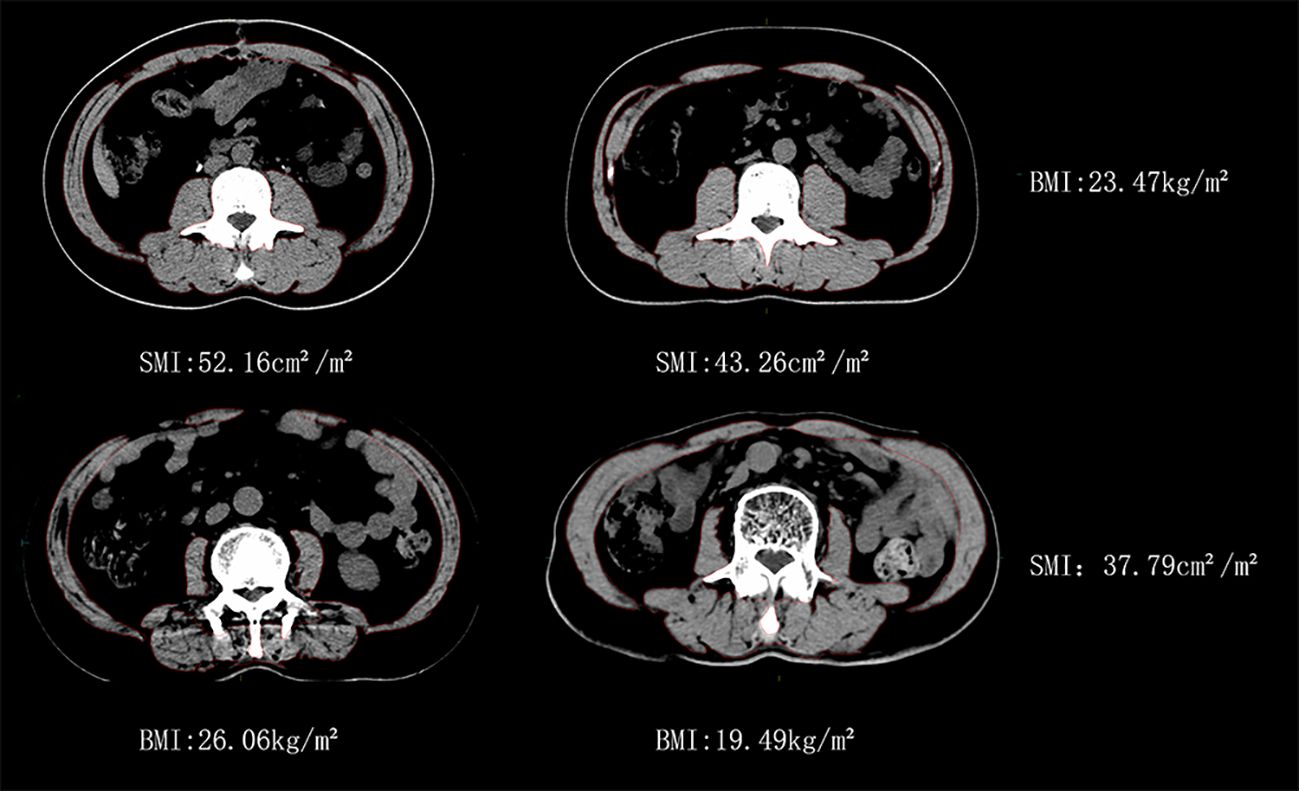
Figure 1 Similar BMI with different SMI vs similar SMI with different BMI for man patients.
5.3 Dynamic fluctuations in SMI before and after chemotherapy
Table 3 shows a comparative analysis of the dynamic changes in L3SMI before and after chemotherapy in 39 patients. The patients were divided into two groups: the baseline chemotherapy group (Group G1) and the end-of-chemotherapy group (Group G2). Patients experienced a reduction in L3SMI at the end of chemotherapy when compared to the baseline chemotherapy group, regardless of gender, adjuvant chemotherapy, or nutrient tube placement. The L3SMI increased by 0.1 ± 2.64 cm2/m2 after the end of palliative chemotherapy compared to baseline chemotherapy. Similarly, those who received nutritional education experienced an increase of 0.1 ± 2.90 cm2/m2 in L3SMI at the end of chemotherapy as compared to baseline chemotherapy.
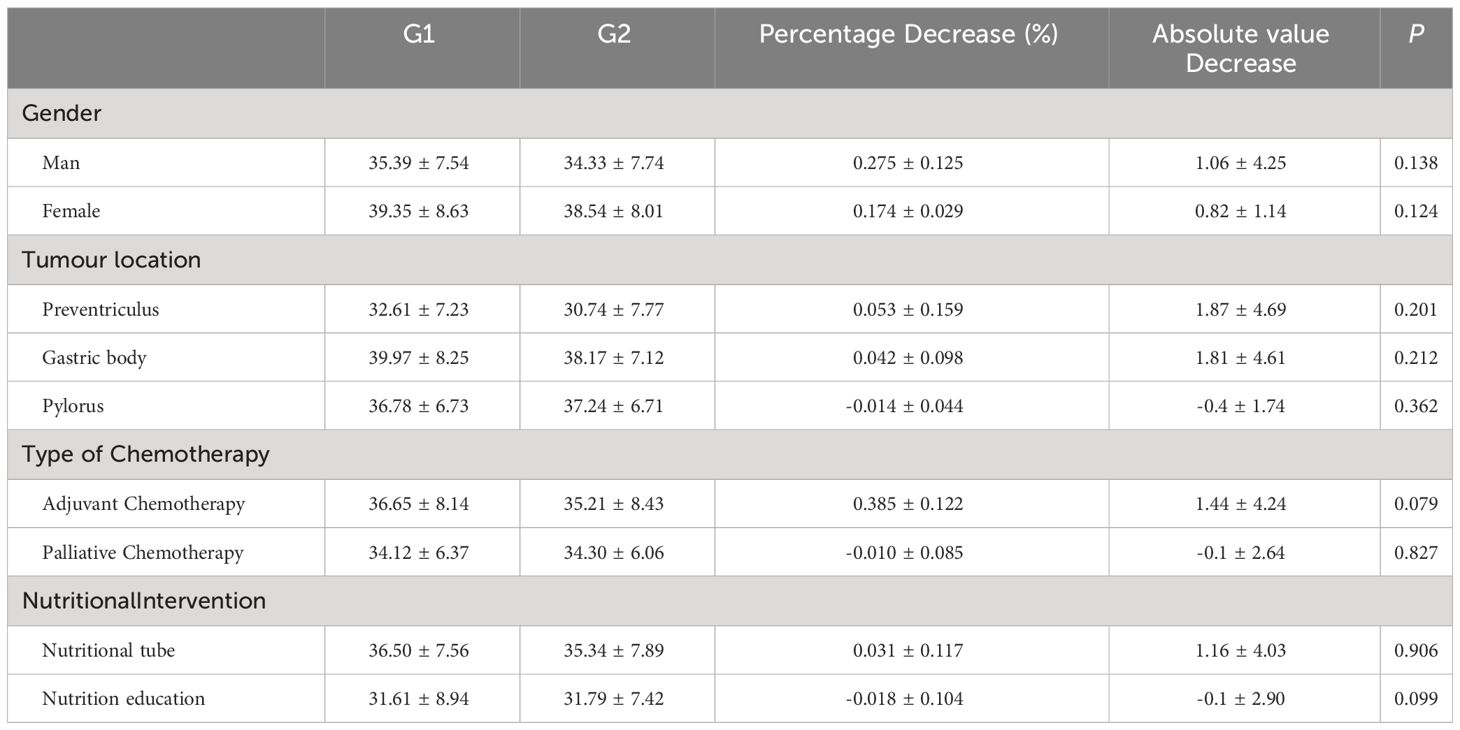
Table 3 Change in L3SMI according to different clinical characteristics (cm2/m2).
5.4 Alterations in skeletal muscle parameters
Based on the change in SMI before and after chemotherapy, patients were divided into three groups. The first group consisted of patients who had skeletal muscle loss, defined as a decrease in SMI of more than 2%. Patients in the second group had an increase in skeletal muscle, defined as an increase in SMI of more than 2%. The third group included patients whose SMI remained stable, with changes that fell within the range in the two previous groups (16). Based on the previously described sarcopenia thresholds (male: L3SMI < 36 cm2/m2, female: L3SMI < 29 cm2/m2), a total of 39 patients were classified into sarcopenia and non-sarcopenia groups based on their SMI values prior to the initiation of chemotherapy, as illustrated in Figure 2. The prevalence of sarcopenia increased significantly, escalating from 46.2% prior to chemotherapy to 51.3% subsequent to chemotherapy. The mean SMI of the entire cohort exhibited a decrease from 36.00 cm2/m2 prior to chemotherapy to 34.99 cm2/m2 post-chemotherapy. This reduction corresponded to an average decrease of 1.68 kg of LBM and a decrease of 1.17 cm2 in the skeletal muscle area of the lumbar 3 vertebral region. SMI remained stable or increased during the course of chemotherapy in 23 out of 39 (59.0%) of the patients who were enrolled in the research. The SMI increased by 1.49 cm2/m2 on average (95% CI: 0.72-2.25 cm2/m2, P = 0.001). SMI, on the other hand, decreased in 16 out of 39 (41.0%) of the patients. The mean decrease in SMI was 4.62 cm2/m2 (95% CI: 2.97–6.27 cm2/m2, P < 0.001). In the cohort of patients who did not exhibit sarcopenia before chemotherapy, 52.4% (11/21) demonstrated either stable or increased muscle mass. In contrast, 66.7% (12/18) of patients with sarcopenia exhibited the same trend (P = 0.062).
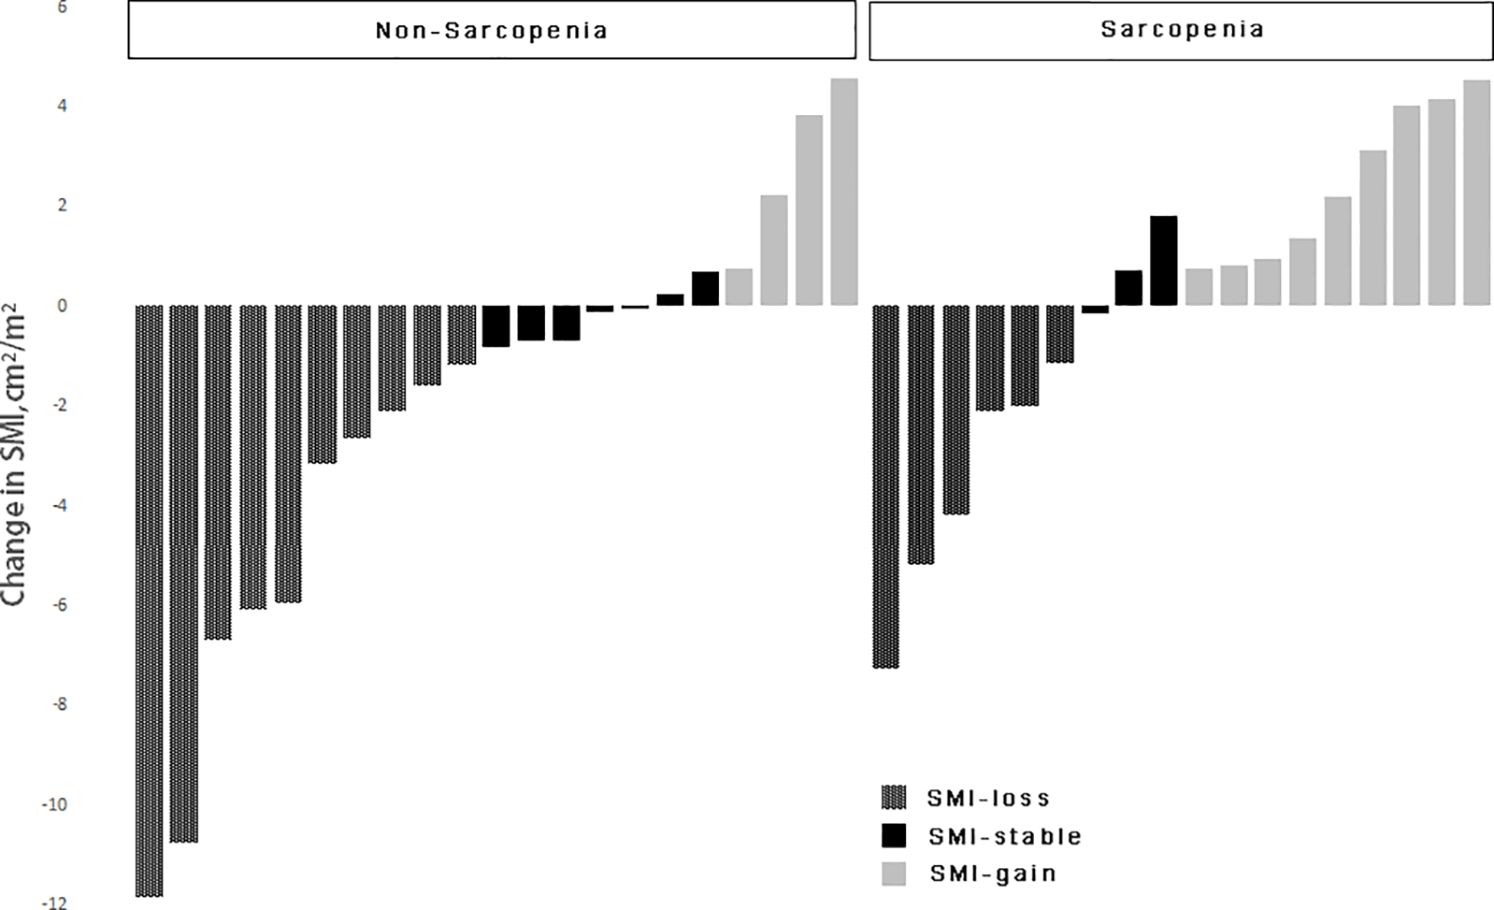
Figure 2 Change in skeletal muscle index in patients according to sarcopenia.
5.5 Sarcopenia during chemotherapy and its association with chemotherapy-related toxicities
Thirty-nine patients were divided into two groups based on the presence or absence of sarcopenia: the sarcopenia group and the non-sarcopenia group. Its relationship between the initial chemotherapy and the incidence of grade ≥ 3 toxic side effects during chemotherapy was examined and presented in Table 4. The incidence of grade ≥ 3 neutropenia in the baseline sarcopenia group was shown to be statistically significant when compared to the non-sarcopenia group (P = 0.0004). After chemotherapy, there was a statistically significant increase in the occurrence of grade ≥ 3 neutropenia in patients with sarcopenia compared to those without sarcopenia (P = 0.0024).
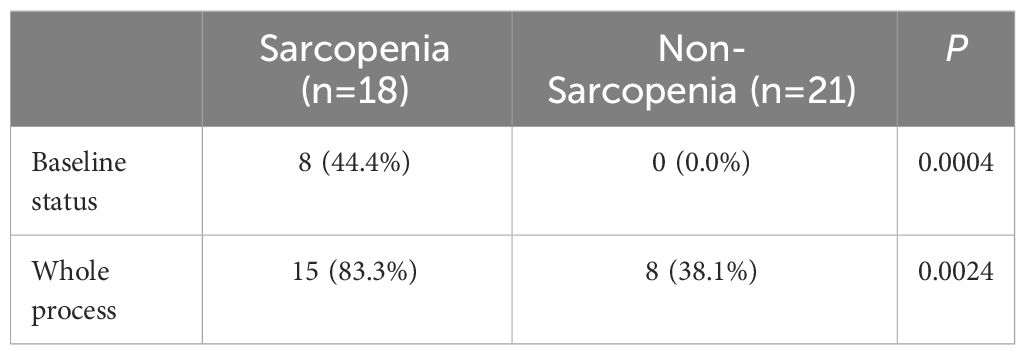
Table 4 Relevance between sarcopenia and toxicity reactions.
5.6 Changes in SMI during chemotherapy as well as chemotherapy-related toxic side effects
A total of 39 patients were divided into two groups based on their change in SMI, either maintained, increased or lost. Table 5 shows the results of an analysis of the relationship between their baseline status and the occurrence of grade ≥ 3 or higher neutropenia during chemotherapy follow-up.
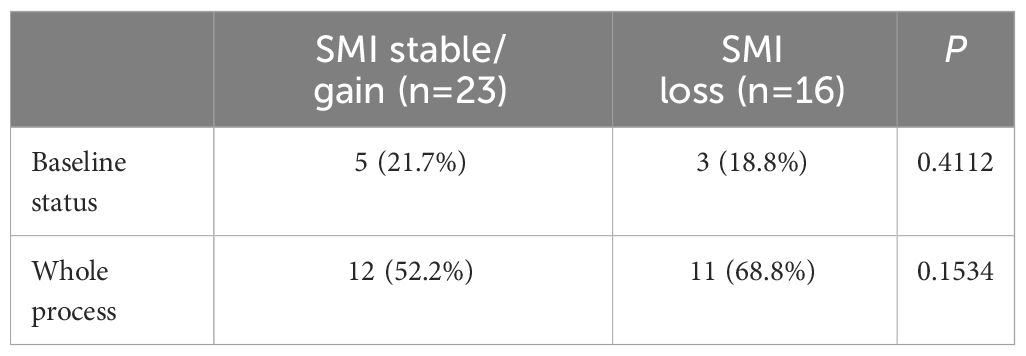
Table 5 Relevance between SMI change and toxicity reactions.
5.7 Categorization of treatment modalities and chemotherapy-related toxicities during chemotherapy
A total of 39 patients were divided into two groups based on their treatment modality: postoperative adjuvant chemotherapy and palliative chemotherapy. The relationship between initial chemotherapy and the occurrence of grade ≥ 3 or more toxic side effects during the course of chemotherapy was investigated. Table 6 displays the results of this investigation.
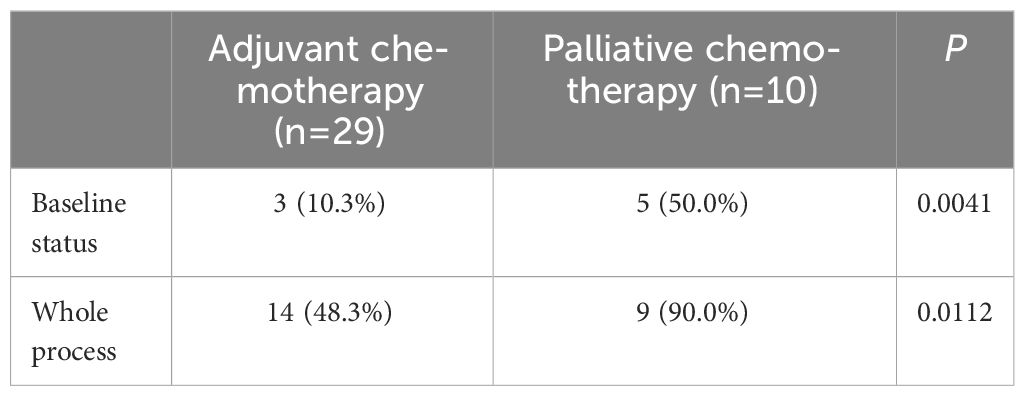
Table 6 Relevance between type of chemotherapy and toxicity reactions.
6 Discussion
On a global scale, gastric cancer continues to be a highly prevalent and fatal form of cancer, with a particular impact on elderly males. The cumulative risk of developing gastric cancer globally, from birth to 74 years of age, is reported to be 1.87% in men and 0.79% in women (17). The National Cancer Center of China published the most recent issue of national cancer statistics in February 2022. It elaborated on the burden of cancer in China in 2016. That year, there were 4,064,000 new cases of cancer, with 396,500 of them being new cases of gastric cancer, which ranked third among all types of cancer (18). Gastrointestinal malignancies have the most significant impact on human nutritional status due to their special physiological functions. Sarcopenia is a condition that causes skeletal muscle mass and function to decline. Recent studies have shown that perioperative sarcopenia in gastric cancer is not only an independent risk factor for postoperative surgical complications (hazard ratio (HR) = 2.330, 95% confidence interval (CI) = 1.132–4.796, P = 0.022), but it also has an impact on long-term oncologic outcomes (19–24). Sarcopenia was revealed to be an independent prognostic factor for both overall survival (OS) and cancer-specific survival (CSS) in patients with gastric cancer. [HR (95% CI) for OS: 1.82 (1.32–2.47), P < 0.001; HR (95% CI) for CCS: 1.73 (1.02–2.80), P = 0.043] (19–24). Huang et al. from Wenzhou Medical University in China examined the diagnostic value of CT measurements of L3SMI in predicting complications and long-term survival following radical gastrectomy for gastric cancer. The results of the study indicated that CT diagnosis of skeletal sarcopenia outperformed nutritional screening techniques in predicting postoperative complications and survival (25).
Our research team conducted dynamic monitoring of sarcopenia using CTL3SMI diagnosis. Previous research has confirmed that active nutritional interventions can help patients with gastrointestinal sarcopenia retain their anabolic muscle metabolism potential, prevent muscle loss, or even gain muscle. However, the patients in this research had a wide range of gastrointestinal tumors, including gastric, pancreatic, and colorectal cancers, and were treated with the same chemotherapy regimen (9, 10). As a result, this prospective clinical study modified the enrollment criteria and chemotherapy regimens. It included 39 gastric cancer patients who underwent adjuvant or first-line 6 cycles of XELOX/SOX chemotherapy and completed dynamic follow-up. The evaluation criteria for sarcopenia in Asian oncology patients were adopted. The following criteria were used in this study: for males, L3SMI < 36 cm2/m2; for females, L3SMI < 29 cm2/m2 (15). According to these parameters, the incidence of sarcopenia in the patients enrolled in the current research was 46.2% (18/39). The incidence of sarcopenia in patients receiving adjuvant chemotherapy at the time of radical surgery was significantly higher at 37.9% (11/29) compared to 18.98% (167/880) in a study of operable gastric cancer by Huang et al. Huang et al. used the significantly broader diagnostic criteria recommended by the European Working Group on Sarcopenia in Older People (EWGSOP), which were L3SMI < 40.8 cm2/m2 for standard males and L3SMI < 34.9 cm2/m2 for females (25). If the EWGSOP criteria were used to evaluate the patients enrolled in this study, the percentage of patients with sarcopenia would be 66.7% (26/39). Sarcopenia was diagnosed in 25 of the 33 male patients. It is worth noting that even though 25.6% (10/39) of the patients had advanced gastric cancer, the incidence of sarcopenia in patients who underwent adjuvant chemotherapy with radical surgery was as high as 65.5% (19/29). Although the small sample size may affect the results, it also suggests that when using L3SMI criteria to diagnose sarcopenia and conduct related clinical research, it is critical to consider not only the racial differences but also the potential impact of different cancer types and disease stages on the diagnostic criteria for sarcopenia. This indirectly implies that Ordos, a region in western China, has a higher frequency of sarcopenia in patients diagnosed with gastric cancer.
Previous research on the diagnosis of sarcopenia using L3SMI criteria has primarily focused on the correlation between baseline status, toxic side effects of treatment, and prognosis (6). However, there has been an increased emphasis on examining the relationship between changes in skeletal muscle dynamics before and after treatment and their impact on side effects, efficacy, and prognosis since 2015. In fact, after 2018, 60% of the studies examining changes in skeletal muscle dynamics during treatment were published (9). In the current study, we compared the dynamic changes in L3SMI in patients with gastric cancer undergoing XELOX/SOX chemotherapy with their baseline status. It has been observed in real-world clinical practice that there are statistically significant reductions in the NRS 2002 Nutritional Risk Screening Scale and PG-SGA Nutritional Assessment Scale before and after chemotherapy, which can be attributed to nutritional education and other modalities (P = 0.000, P = 0.000). The risk of developing malnutrition decreased significantly. However, as indicated in Table 2, lumbar 3 vertebral muscle area (SL3), lean body soft mass (LBM), and fat free mass index (FFMI) all decreased statistically significantly during chemotherapy,. Although the mean L3SMI, the main observational index of the entire cohort, decreased from 36.00 cm2/m2 before chemotherapy to 34.99 cm2/m2 after chemotherapy (P = 0.1615), resulting in an average decrease of 1.68 kg in whole-body lean body mass, this decrease did not reach statistical significance. This lack of significance may be attributed to the fact that the 65 enrolled patients were affected by the COVID-19 epidemic, with only 39 completing dynamic follow-up (26). According to the error criteria of 2% for L3SMI measurement using CT, the decrease in L3SMI in this group of patients was -2.60 ± 11.50%. Therefore, the change in skeletal muscle mass values before and after chemotherapy was evaluated as a decrease in this group of patients (16). This is consistent with the findings of Park et al. in a study of 111 patients receiving first-line palliative chemotherapy for advanced gastric cancer. As chemotherapy was administered, the median SMI values decreased by -4.0 cm2/m2, -4.5 cm2/m2, and -3.8 cm2/m2, respectively, in patients with objective remission, stable disease, or progressive disease (5). Similarly, Florian Huemer et al. (2023) reported a statistically significant decrease in body composition parameters during perioperative FLOT chemotherapy for gastric cancer (51.3 vs. 48.8 cm2/m2, P = 0.02) (27). The aforementioned studies investigated the correlation between changes in L3SMI over time and survival rates. In all of these investigations, baseline sarcopenia (P = 0.021) and a decrease in SMI during chemotherapy (P = 0.032) were significant negative predictors for survival (5, 27). In this investigation, the decrease in L3SMI before and after chemotherapy in patients with gastric cancer (-2.60 ± 11.50%) was similar to the decrease observed during chemotherapy for gastrointestinal tumors in our previous research (-2.05 ± 9.21%) (10). However, it was significantly lower than the decrease in L3SMI observed in advanced gastric cancer patients undergoing palliative chemotherapy by Park et al. in 2020 (-11.30 ± 13.00%) and the decrease in L3SMI observed in advanced gastric cancer patients undergoing palliative chemotherapy reported by Yusuke Yamaoka et al. (2015) in Japan (6.20 ± 6.80%) (27, 28). Different disease stages among enrolled patients, variations in sample sizes, and disparities in baseline thresholds for sarcopenia between populations can all contribute to differences in the extent of L3SMI decline before and after chemotherapy across studies. The implementation of clinical nutritional interventions also played a role in the lower magnitude of L3SMI decline observed in this investigation.
The effect of changes in L3SMI dynamics on chemotherapy-induced neutropenia in patients with gastric cancer following XELOX/SOX chemotherapy was also investigated in this study. Previous research has reported a clear relationship between sarcopenia and chemotherapy toxicities (29). Our study, which was published in 2022, confirmed that patients with sarcopenia who underwent albumin-paclitaxel chemotherapy experienced a significant increase in the incidence of grade ≥ 3 neurotoxicity and neutropenia (30, 31). Data from the current study focused on the relationship between dynamic changes in skeletal muscle index and neutropenia. The results of the study showed that, regardless of baseline status or chemotherapy follow-up, the incidence of grade ≥ 3 neutropenia was significantly higher in the sarcopenia group compared to the non-sarcopenia group (44.4% vs. 0.00%; 83.3% vs. 38.1%). Furthermore, the skeletal muscle index declined significantly with six cycles of chemotherapy in both the sarcopenia and non-sarcopenia groups. In addition, compared to baseline, the prevalence of grade ≥ 3 neutropenia was significantly higher in both groups (83.3% vs. 44.4%; 38.1% vs. 0.00%). The findings are consistent with those reported in the above investigation and in a prospective multicenter study of 51 patients with advanced colorectal cancer conducted by Barrat et al., in which sarcopenia was the sole factor associated with grade 3–4 toxicity (30–32). The prevalence of sarcopenia among the enrolled patients increased from 46.2% before chemotherapy to 51.3% after chemotherapy. Figure 2 shows that in patients with pre-chemotherapy sarcopenia, the rate of muscle mass stabilization or increase was 66.7% (12/18), which was higher than the rate of 52.4% (11/21) in non-sarcopenic patients. When the incidence of grade ≥ 3 neutropenia after chemotherapy follow-up was compared to baseline status in the muscle loss group, the increase of 50.0% in the muscle loss group was greater than the increase of 30.5% in the maintenance/increase group. The specific values were 68.8% vs. 18.8 and 52.2% vs. 21.7%, respectively. This is consistent with the findings of our prior study on gastrointestinal tumors. It indicates that implementing adequate nutritional interventions may enhance skeletal muscle levels and reduce the occurrence of grade ≥ 3 neutropenia in patients with sarcopenia (10). The incidence of grade ≥ 3 neutropenia was evaluated in patients who underwent adjuvant chemotherapy versus advanced palliative chemotherapy in this study. Both at baseline and after six cycles of chemotherapy, the incidence of grade ≥ 3 neutropenia was significantly lower in patients who received adjuvant chemotherapy (10.3% vs. 50.0%; 48.3% vs. 90.0%). Furthermore, the baseline incidence of sarcopenia was 41.38% (12/29), which was lower than the incidence of 60.0% (6/10) in patients who received advanced palliative chemotherapy. Furthermore, patients who received adjuvant chemotherapy had a higher incidence of non-sarcopenia (58.62%, or 17/29) compared to 40.0% (4/10) in patients who received advanced palliative chemotherapy. The findings also support the association between patients with sarcopenia and higher chemotherapy-related toxicities.
Obviously, this investigation had some limitations. First, the sample size for inclusion and completion of dynamic follow-up was modest. Despite the use of real-world nutritional management, patients with gastric cancer treated with XELOX/SOX chemotherapy are commonly treated with ambulatory chemotherapy modalities. This makes it difficult for them to receive adequate nutritional attention during the outpatient follow-up and results in ineffective outpatient nutritional management. In addition, patient exercise is also very important. In the pre-study, the research team did not focus on patient exercise education, which was one of the limitations of this study.
7 Conclusion
In conclusion, the results of this prospective clinical study confirm that patients with gastric cancer treated with XELOX/SOX chemotherapy experience a progressive reduction in skeletal muscle mass with each cycle of treatment. This reduction was accompanied by a higher occurrence of grade ≥ 3 neutropenia. In the future, it is recommended to incorporate patient-initiated reporting of clinical outcomes to enhance the effectiveness of interventions intended at reducing skeletal muscle quantity and mass during chemotherapy and mitigating the toxic side effects of chemotherapy. Furthermore, it should be organically combined with the body composition index in clinical practice to further optimize and individualize the traditional model of administering strength based on BSA.
Data availability statement
The original contributions presented in the study are included in the article/supplementary material. Further inquiries can be directed to the corresponding authors.
Ethics statement
The study was approved by Ethics Committee of the Ordos Central Hospital (No.2023-21). The studies were conducted in accordance with the local legislation and institutional requirements. The participants provided their written informed consent to participate in this study.
Author contributions
Z-HL: Funding acquisition, Investigation, Project administration, Visualization, Writing – review & editing. TX: Data curation, Methodology, Validation, Visualization, Writing – review & editing. Y-JZ: Conceptualization, Data curation, Formal analysis, Investigation, Resources, Writing – review & editing. J-HJ: Data curation, Investigation, Methodology, Project administration, Writing – review & editing. Y-ZM: Data curation, Investigation, Methodology, Project administration, Validation, Writing – review & editing. J-XL: Conceptualization, Formal analysis, Methodology, Project administration, Writing – review & editing. JS: Writing – review & editing, Data curation, Formal analysis, Investigation, Project administration, Software, Visualization. Y-RF: Data curation, Investigation, Project administration, Validation, Writing – review & editing. B-YQ: Data curation, Investigation, Methodology, Resources, Writing – review & editing. FL: Data curation, Formal analysis, Investigation, Project administration, Writing – review & editing. D-JF: Data curation, Formal analysis, Investigation, Methodology, Project administration, Software, Writing – review & editing. M-JY: Data curation, Methodology, Software, Writing – review & editing. S-MM: Data curation, Formal analysis, Funding acquisition, Methodology, Resources, Validation, Writing – original draft, Writing – review & editing. Q-FL: Data curation, Funding acquisition, Methodology, Project administration, Supervision, Validation, Writing – original draft, Writing – review & editing.
Funding
The author(s) declare financial support was received for the research, authorship, and/or publication of this article. This work was jointly supported by Zhejiang Provincial University Student Sci&Tech Innovation Activity Plan and New Seedling Talent Plan (No. 2022R413A013). This work was jointly supported by National Innovation and Entrepreneurship Training Program for College Students (No. 202210343012). This study was supported by Ordos Health Commission Key discipline Project;National Clinical Key Specialty Construction Project2023305.
Acknowledgments
We are particularly grateful to all the people who have given us help on our article.
Conflict of interest
The authors declare that the research was conducted in the absence of any commercial or financial relationships that could be construed as a potential conflict of interest.
Publisher’s note
All claims expressed in this article are solely those of the authors and do not necessarily represent those of their affiliated organizations, or those of the publisher, the editors and the reviewers. Any product that may be evaluated in this article, or claim that may be made by its manufacturer, is not guaranteed or endorsed by the publisher.
References
1. Sung H, Ferlay J, Siegel RL, Laversanne M, Soerjomataram I, Jemal A, et al. Global cancer statistics 2020: GLOBOCAN estimates of incidence and mortality worldwide for 36 cancers in 185 countries. CA Cancer J Clin. (2021) 71:209–49. doi: 10.3322/caac.21660
2. Ajani JA, D'Amico TA, Bentrem DJ, Chao J, Cooke D, Corvera C, et al. Gastric Cancer NCCN Clinical practice guidelines in oncology.Version 2.2022. J Natl Compr Canc Netw. (2022) 20:167–92. doi: 10.6004/jnccn.2022.0008
3. Wang FH, Zhang XT, Li YF, Tang L, Qu XJ, Ying JE, et al. The Chinese Society of Clinical Oncology (CSCO): Clinical guidelines for the diagnosis and treatment of gastric cancer, 2021. Cancer Commun (Lond). (2021) 41:747–95. doi: 10.1002/cac2.12193
4. Fearon K, Strasser F, Anker SD, Bosaeus I, Bruera E, Fainsinger RL, et al. Definition and classification of cancer cachexia: an international consensus. Lancet Oncol. (2011) 12:489–95. doi: 10.1016/S1470-2045(10)70218-7
5. Park SE, Choi JH, Park JY, Kim BJ, Kim JG, Kim JW, et al. Loss of skeletal muscle mass during palliative chemotherapy is a poor prognostic factor in patients with advanced gastric cancer. Sci Rep. (2020) 10:17683. doi: 10.1038/s41598-020-74765-8
6. Hopkins JJ, Sawyer MB. A review of body composition and pharmacokinetics in oncology. Expert Rev Clin Pharmacol. (2017) 10:947–56. doi: 10.1080/17512433.2017.1347503
7. Srikanthan P, Karlamangla AS. Muscle mass index as a predictor of longevity in older adults. Am J Med. (2014) 127:547–53.
8. Roeland EJ, Bohlke K, Baracos VE, Bruera E, Del Fabbro E, Dixon S, et al. Management of cancer cachexia: ASCO guideline. J Clin Oncol. (2020) 38:2438–53. doi: 10.1200/JCO.20.00611
9. Xu T, Li Z, Liu T, Jiang CH, Zhang YJ, Li H, et al. Progress in research on antitumor drugs and dynamic changes in skeletal muscles. Front Pharmacol. (2022) 13:893333. doi: 10.3389/fphar.2022.893333
10. Xu T, Li Z, Li H, Hou J, Li J, Jin G, et al. Dynamic changes in the body composition during chemotherapy for gastrointestinal tumors in the context of active nutrition intervention. Front Oncol. (2022) 12:965848.
11. Jin S, Cong M, Zhang L, Wang Y, Qin D, Lu Q, et al. Validation of a simple diet self-assessment tool (SDSAT) in head and neck cancer patients undergoing radiotherapy. Eur J Oncol Nurs. (2020) 44:101702. doi: 10.1016/j.ejon.2019.101702
12. Shi H, Li T, Zhuang Z, Li W, Yu S, Jiang H, et al. Cancer nutrition committee of Chinese anti-cancer association, parenteral and enteral nutrition branch of Chinese medical association. In: China cancer nutrition therapy guideline 2020, vol. 10. People's Health Publishing House, Beijing (2020).
13. Rinninella E, Cintoni M, Raoul P, Pozzo C, Strippoli A, Bria E, et al. Muscle mass, assessed at diagnosis by L3-CT scan as a prognostic marker of clinical outcomes in patients with gastric cancer: A systematic review and meta-analysis. Clin Nutr. (2020) 39:2045–2054. doi: 10.1016/j.clnu.2019.10.021
14. Freites-Martinez A, Santana N, Arias-Santiago S, Viera A. Usingthe Common Terminology Criteria for Adverse Events (CTCAE - Version 5.0) to Evaluate the Severity of Adverse Events of Anticancer Therapies. Actas Dermosifiliogr (Engl Ed). (2021) 112(1):90–2. doi: 10.1016/j.ad.2019.05.009
15. Iritani S, Imai K, Takai K, Hanai T, Ideta T, Miyazaki T, et al. Skeletal muscle depletion is an independent prognostic factor for hepatocellular carcinoma. J Gastroenterol. (2015) 50:323–32. doi: 10.1007/s00535-014-0964-9
16. Stene GB, Helbostad JL, Amundsen T, Sørhaug S, Hjelde H, Kaasa S, et al. Changes in skeletal muscle mass during palliative chemotherapy in patients with advanced lung cancer. Acta Oncol. (2015) 54:340–8. doi: 10.3109/0284186X.2014.953259
17. Bray F, Ferlay J, Soerjomataram I, Siegel RL, Torre LA, Jemal A. Global cancer statistics 2018: GLOBOCAN estimates of incidence and mortality worldwide for 36 cancers in 185 countries. CA Cancer J Clin. (2018) 68:394–424. doi: 10.3322/caac.21492
18. Available online at: http://www.Chinancpcn.org.cn.
19. Ma BW, Chen XY, Fan SD, Zhang FM, Huang DD, Li B, et al. Impact of sarcopenia on clinical outcomes after radical gastrectomy for patients without nutritional risk. Nutrition. (2019) 61:61–6. doi: 10.1016/j.nut.2018.10.025
20. Chen FF, Zhang FY, Zhou XY, Shen X, Yu Z, Zhuang CL. Role of frailty and nutritional status in predicting complications following total gastrectomy with D2 lymphadenectomy in patients with gastric cancer: a prospective study. Langenbecks Arch Surg. (2016) 401:813–22. doi: 10.1007/s00423-016-1490-4
21. Wang SL, Zhuang CL, Huang DD, Pang WY, Lou N, Chen FF, et al. Sarcopenia adversely impacts postoperative clinical outcomes following gastrectomy in patients with gastric cancer: A prospective study. Ann Surg Oncol. (2016) 23:556–64. doi: 10.1245/s10434-015-4887-3
22. Kawamura T, Makuuchi R, Tokunaga M, Tanizawa Y, Bando E, Yasui H, et al. Long-term outcomes of gastric cancer patients with preoperative sarcopenia. Ann Surg Oncol. (2018) 25:1625–32. doi: 10.1245/s10434-018-6452-3
23. Waki Y, Irino T, Makuuchi R, Notsu A, Kamiya S, Tanizawa Y, et al. Impact of preoperative skeletal muscle quality measurement on long-term survival after curative gastrectomy for locally advanced gastric cancer. World J Surg. (2019) 43:3083–93. doi: 10.1007/s00268-019-05145-1
24. Hu CL, Jin XH, Yuan ZD, Xiong SW, Zhang L, Hou JN, et al. Prognostic significance of preoperative skeletal muscle status in patients with gastric cancer after radical gastrectomy. Asia Pac J Clin Nutr. (2019) 28:442–9. doi: 10.6133/apjcn.201909_28(3).0003
25. Huang DD, Cai HY, Chen XY, Dong WX, Wangchuk D, Yan JY, et al. Value of Sarcopenia defined by the new EWGSOP2 consensus for the prediction of Postoperative Complications and Long-term Survival after Radical Gastrectomy for Gastric Cancer: A comparison with four common nutritional screening tools. J Cancer. (2020) 11:5852–60. doi: 10.7150/jca.49815
26. Yu S, Wang G, Cai XP, Deng J-W, Zheng L, Zhu H-H, et al. An overview of COVID-19. J Zhejiang Univ Sci B. (2020) 21:343–60. doi: 10.1631/jzus.B2000083
27. Huemer F, Hecht D, Scharinger B. Body composition dynamics and impact on clinical outcome in gastric and gastro-esophageal junction cancer patients undergoing perioperative chemotherapy with the FLOT protocol. J Cancer Res Clin Oncol. (2023) 149:3051–64. doi: 10.1007/s00432-022-04096-w
28. Yamaoka Y, Fujitani K, Tsujinaka T, Yamamoto K, Hirao M, Sekimoto M, et al. Skeletal muscle loss after total gastrectomy, exacerbated by adjuvant chemotherapy. Gastric Cancer. (2015) 18:382–9. doi: 10.1007/s10120-014-0365-z
29. Prado CM, Lieffers JR, McCargar LJ, Reiman T, Sawyer MB, Martin L, et al. Prevalence and clinical implications of sarcopenic obesity in patients with solid tumours of the respiratory and gastrointestinal tracts: a population-based study. Lancet Oncol. (2008) 9:629–35.
30. Guo J, Zhao J, Gu M, Hou J, Xu T, Jiang Y, et al. Association between body composition and peripheral neurotoxicity in cancer patients from North China taking nab-paclitaxel. Nutr Cancer. (2022) 75(3):805–14. doi: 10.1080/01635581.2022.2156552
31. Shi Y, Guo J, Jiang Y. Myelosuppression caused by nanoparticle albumin-bound paclitaxel in the Northern Chinese population and the role of body composition. J Clin Pharmacol. (2023) 63(9):1009–16. doi: 10.1002/jcph.2259
Keywords: dynamic changes, gastric cancer, skeletal muscle, XELOX/SOX, neutropenia
Citation: Li Z-H, Xu T, Zhang Y-J, Jiang J-H, Mi Y-Z, Li J-X, Shen J, Fu Y-R, Qin B-Y, Lin F, Fu D-J, Yue M-J, Ma S-M and Li Q-F (2024) Dynamic changes in body composition during XELOX/SOX chemotherapy in patients with gastric cancer. Front. Oncol. 14:1309681. doi: 10.3389/fonc.2024.1309681
Received: 08 October 2023; Accepted: 09 April 2024;
Published: 30 April 2024.
Edited by:
Antonio Macciò, Ospedale Oncologico Armando Businco, ItalyReviewed by:
Shuluan Li, Chinese Academy of Medical Sciences and Peking Union Medical College, ChinaDenis Fedorinov, Russian Medical Academy of Postgraduate Education, Russia
Copyright © 2024 Li, Xu, Zhang, Jiang, Mi, Li, Shen, Fu, Qin, Lin, Fu, Yue, Ma and Li. This is an open-access article distributed under the terms of the Creative Commons Attribution License (CC BY). The use, distribution or reproduction in other forums is permitted, provided the original author(s) and the copyright owner(s) are credited and that the original publication in this journal is cited, in accordance with accepted academic practice. No use, distribution or reproduction is permitted which does not comply with these terms.
*Correspondence: Quan-Fu Li, bGlfcWZlZHVAMTYzLmNvbQ==; Shu-Mei Ma, bWFzaHVtZWltc21AMTExLmNvbQ==
†These authors have contributed equally to this work