 Matteo Droghetti1*†
 Lorenzo Bianchi1,2†
 Massimiliano Presutti1Luigia Vetrone3Andrea Farolfi4
 Riccardo Mei4
 Francesca Giunchi5Alessio Degiovanni5
 Angelo Mottaran1
 Pietro Piazza1
 Danilo Cangemi1
 Paolo Castellucci4
 Antonietta D’Errico5
 Riccardo Schiavina1,2
 Eugenio Brunocilla1,2Stefano Fanti2,4
- 1Division of Urology, IRCCS Azienda Ospedaliero-Universitaria di Bologna, Bologna, Italy
- 2Università degli Studi di Bologna, Bologna, Italy
- 3Nuclear Medicine, Alma Mater Studiorum-University of Bologna, Bologna, Italy
- 4Nuclear Medicine, IRCCS Azienda Ospedaliero-Universitaria di Bologna, Bologna, Italy
- 5Pathology, IRCCS Azienda Ospedaliero-Universitaria di Bologna, Bologna, Italy
Introduction: Prostate-specific membrane antigen (PSMA) is a transmembrane protein expressed by normal prostatic tissue. Therefore, molecular imaging targeting PSMA (PSMA-PET) has gained particular interest and diffusion for PCa staging and restaging. Several factors may affect PSMA-PET results, and many tools have been proposed to improve patient selection. Furthermore, PSMA expression is not homogeneous among different tissues and within the prostate itself. The aims of this study were to evaluate immunohistochemistry (IHC) features of prostate biopsy samples and to assess their correlation with whole-mount specimens and PSMA-PET parameters.
Methods: We included consecutive high-risk PCa patients who underwent PSMA-PET for staging proposal at our institution from January 2022 to December 2022. The PET parameters selected were SUVmax, total volume (TV), and total lesion activity (TL). Each patient underwent multiparametric MRI (mpMRI) and fusion-targeted prostate biopsy prior to surgery. IHC analyses were performed on the index lesion cores. IHC visual score (VS) (1, 2, 3) and visual pattern (VP) (membranous, cytoplasmic, and combined) and the percentage of PSMA-negative tumor areas (PSMA%neg) within biopsy cores were evaluated.
Results: Forty-three patients who underwent robotic radical prostatectomy after PSMA-PET were available for analyses. Concordance between VS and VP at biopsy and final pathology showed a Cohen’s kappa coefficient of 0.39 and 0.38, respectively. Patients with PSMA%neg <20% had a higher concordance in VS and VP (Cohen’s kappa 0.49 and 0.4, respectively). No difference emerged in terms of median PSMA-TV (p = 0.3) and PSMA-TL (p = 0.9) according to VS at biopsy, while median SUVmax was higher in patients with VS 3 (p = 0.04). Higher SUVmax was associated with membranous and combined VP expression (p = 0.008). No difference emerged between patients with PSMA%neg <20% or PSMA%neg >20% on biopsy cores in terms of SUVmax, PSMA-TL, and PSMA-TV (p = 0.5, p = 0.5, and p = 0.9 respectively).
Conclusions: We found a correlation between IHC VS and VP on targeted biopsy cores and SUVmax at PSMA-PET. However, the correlation between the IHC parameters of biopsy cores and final pathology was not as high as expected. Nevertheless, the presence of PSMA%neg <20% seems to have a better concordance in terms of visual score.
Introduction
Prostate-specific membrane antigen (PSMA) is a transmembrane protein expressed by normal prostatic tissue. However, PSMA may be overexpressed by prostate cancer (PCa) cells. As a consequence, molecular imaging methods targeting PSMA, namely, PSMA-positron emission tomography (PET), have gained particular interest and diffusion for PCa staging and restaging, especially in high-risk patients (1, 2). PSMA-PET has led to a change in the management of PCa patients, due to significantly higher sensitivity and specificity compared with conventional imaging and other molecular imaging techniques (3–5). Indeed, the proPSMA trial showed a major change in clinical management in approximately 28% of patients with high-risk PCa in comparison to conventional imaging (1). However, the advantages of higher diagnostic accuracy, with potential “stage migration” toward oligometastatic or metastatic disease at first presentation, have yet to demonstrate a real benefit in clinical practice, particularly regarding oncological and survival outcomes. Current EAU guidelines lack outcome data of treatment changes when PSMA-PET is used to increase the sensitivity of conventional imaging (6). Several factors may affect PSMA-PET results, and many tools have been proposed to improve patient selection in this regard to maximize the benefits of this imaging modality (7–9). In fact, PSMA expression is not homogeneous among different tissues (10), and it can vary from primary PCa to distant metastases; an intratumoral heterogeneity has been in fact demonstrated, with different gradients of PSMA expression both in intra- and interpatients (11). Given these premises, growing interest arose regarding the evaluation of PSMA immunohistochemistry (IHC) features of PCa and its potential impact on PSMA-PET results. Recent studies showed the relationship between PSMA IHC expression and PSMA-PET parameters, suggesting a more accurate selection of patients with potentially higher benefit from PSMA imaging due to higher PSMA expression on pathology (10, 12, 13). However, such studies have considered IHC on the final pathological specimen after radical prostatectomy. To date, the correlation between IHC features of PSMA expression on biopsy cores and pathological specimens, with given implications on PSMA-PET results, has not been addressed yet. Therefore, we aimed to compare the PSMA expression on both prostate biopsy cores and pathological specimens with PSMA-PET findings in staging high-risk PCa patients eligible for radical prostatectomy (RP).
Materials and methods
Study population
In this single tertiary center retrospective study, we included 66 consecutive high-risk PCa patients who underwent prostate biopsy and 68Ga-PSMA-11 PET/CT (PSMA-PET) for staging proposal at our institution from January 2022 to December 2022. Overall, 15 (22.7%) patients, scheduled for external beam radiotherapy, were excluded from the analyses. Eight patients (12.1%) were excluded due to de-novo metastatic disease at PSMA-PET. Overall, 43 (65.2%) patients underwent robotic radical prostatectomy (RARP) with extended lymph node dissection at our institution and were included in the analysis. This study protocol was approved by the local ethics committee (244/2016/O/Oss), and each patient gave informed written consent for the use of their data.
Prostate biopsy
Biopsies were performed in an outpatient setting with a transrectal ultrasound-guided approach, as previously described, with systematic biopsies (SBs) plus MRI-targeted biopsy (TB) (14–17). Multiparametric magnetic resonance imaging (mpMRI) was performed before biopsy in all cases. mpMRI scoring was assessed by experienced radiologists using PI-RADS v2.1 score (18). Targeted plus systematic biopsy was performed in each patient, as previously described (14, 15). SBs consisted of a typical 12-core double-sextant template from lateral to medial of the base, mid, and apex. TBs were performed for PI-RADS ≥3 lesions that were sampled with three targeted biopsy cores, using a rigid fusion platform (Aplio 500TM, Toshiba, Japan) (14, 15). All patients received oral antibiotic prophylaxis before the procedure. Periprostatic nerve blockade with lidocaine 2% was performed immediately prior to biopsy for each patient. Experienced urologists performed all the procedures.
PET/CT imaging and analysis
Patients underwent clinical routine PET/CT after a single injection of 68Ga-PSMA-11 (mean dose 2 MBq/kg), according to the EANM procedure guidelines (19). Each scan was reviewed by an expert nuclear medicine physician blinded to any clinical information. The image analysis was based on the visual identification of areas with significant PSMA uptake, defined as a clear uptake above the pelvic background applying standardized criteria (20).
PSMA-PET features, i.e., PSMA total volume (PSMA-TV) expressed in cubic centimeters, and total lesion activity (PSMA-PSMA-TL), as the product of PSMA-TV and mean standardized uptake value (SUVmean) of the primary tumor, were semiautomatically extracted and collected as semiquantitative parameters, used to provide quantitative imaging biomarkers to assess the tumor burden.
SUVmean was calculated as the average of all counts in the region of interest supposed to be representative of the analyzed site. It was semiautomatically derived after drawing a spherical volume of interest (VOI) on the lesion’s area, defined as the site which 68Ga-PSMA uptake was significantly higher above the background.
The maximum standardized uptake value (SUVmax), PSMA-TV, and PSMA-TL were collected with an SUVmax threshold of 40% within the lesion. An SUVmax <5 was considered a negative PET (13).
Pathology and immunohistochemistry
Prostate biopsies and RARP specimens were fixed in formalin and embedded in paraffin. From paraffin blocks, 3-μm-thick sections were cut and the slides were then stained with hematoxylin and eosin (H&E). Only the TB-positive cores and the dominant tumor lesion of the RP specimen were further analyzed with immunohistochemistry (IHC) tests. PSMA IHC was conducted with an automatic immunohistochemistry stainer instrument, as previously described (12) (Benchmark Ultra; Ventana/Roche Group 1910 Innovation Park Dr. Tucson, AZ 85755, USA). The antigen retrieval used was cell conditioning 1 for 16 min at 99°C and the primary antibody PSMA (clone EP192, prediluted, Roche) was incubated for 16 min at 36°C. The revelation system used was OptiView DAB (12 min linker and 12 min HRP multimer) (Ventana/Roche).
Histologic evaluation and PCa staging and grading were performed by a single dedicated genitourinary pathologist in accordance with the criteria established by the World Health Organization (WHO Classification of Tumours of the Urinary System and Male Genital Organs 2022) (21).
The PSMA IHC expression was evaluated both for the intensity and the site of expression, whereas this could have been granular/cytoplasmic or membranous expression or both.
Variable definitions and outcomes
The available data consisted of the following:
• Preoperative data: age at surgery, PSA, mpMRI results, biopsy ISUP grade group, PSMA-PET results
• Pathological data: ISUP grade group, pathological T and N stage, and surgical margin status
• PSMA-PET primary tumor features: SUVmean, SUVmax, PSMA-TV, and PSMA-TL
For both biopsies and the final specimen after RP, PSMA immunohistochemistry features were defined as follows:
• Visual score: The intensity of the stain for PSMA expression was visually quantified through a four-tiered system, according to the intensity of the stain compared with normal prostatic tissue, as follows: 0 = negative, 1+ = weak, 2+ = moderate, and 3+ = strong (Figure 1).
• Visual pattern: Immunohistochemical PSMA staining patterns, namely, membranous or cytoplasmic or combined membranous and cytoplasmic according to the site of PSMA expression.

Figure 1 PSMA immunohistochemistry. Visual score for (A) membranous positivity and (B) cytoplasmic immunoreaction. Visual score for PSMA positivity: (C) score 0, (D) score 1+, (E) score 2+, and (F) score 3+ (both cytoplasmic and membranous positivity).
The presence of PSMA-negative tumor areas (PSMA%neg) within the biopsy cores was further evaluated and then correlated to other IHC features and PSMA-PET features. As suggested by Rüschoff et al. (13), we utilized a cutoff value of 20%.
The primary aim of this study was to assess the concordance between the IHC features of the index lesion target biopsy cores and the primary tumor at the whole-mount final pathological examination.
The secondary aim of the study was to evaluate the correlation between IHC features of index lesion target biopsy cores and PSMA-PET parameters.
Statistical analysis
Continuous variables were summarized using medians and interquartile range (IQR). Categorical variables were described with frequencies and proportion. Cohen’s kappa coefficient was used to assess the correlation and the concordance between the IHC features of biopsy and final pathology (visual score and visual pattern). Cohen’s kappa interpretation was reported by McHugh et al. (22) The Mann–Whitney U-test was used to assess the correlation between median values of PSMA-PET parameters (SUVmax, PSMA-TV, PSMA-TL) and IHC features (visual score and pattern) of prostate biopsy. Data were analyzed using SPSS Statistics (IBM, Armonk, NY, USA, v.26). An alpha value of 5% was set to be the threshold to determine statistical significance.
Results
Study population
Table 1 shows the preoperative patients’ characteristics. Median age at surgery was 66 (62–72) years and the median iPSA was 9.4 ng/ml (5.9–13). At mpMRI, 69.8% of the patients had a non-organ confined (cT3) disease. Thirteen (30.2%) patients had positive pelvic lymph nodes (miN+) at PSMA-PET. At biopsy and final pathology, 37.2% and 32.6% of the patients had ISUP 5 PCa, respectively. Overall, 74.4% of the patients had locally advanced disease (pT3–4), while 30% had pN1 disease at final pathology (Table 2).
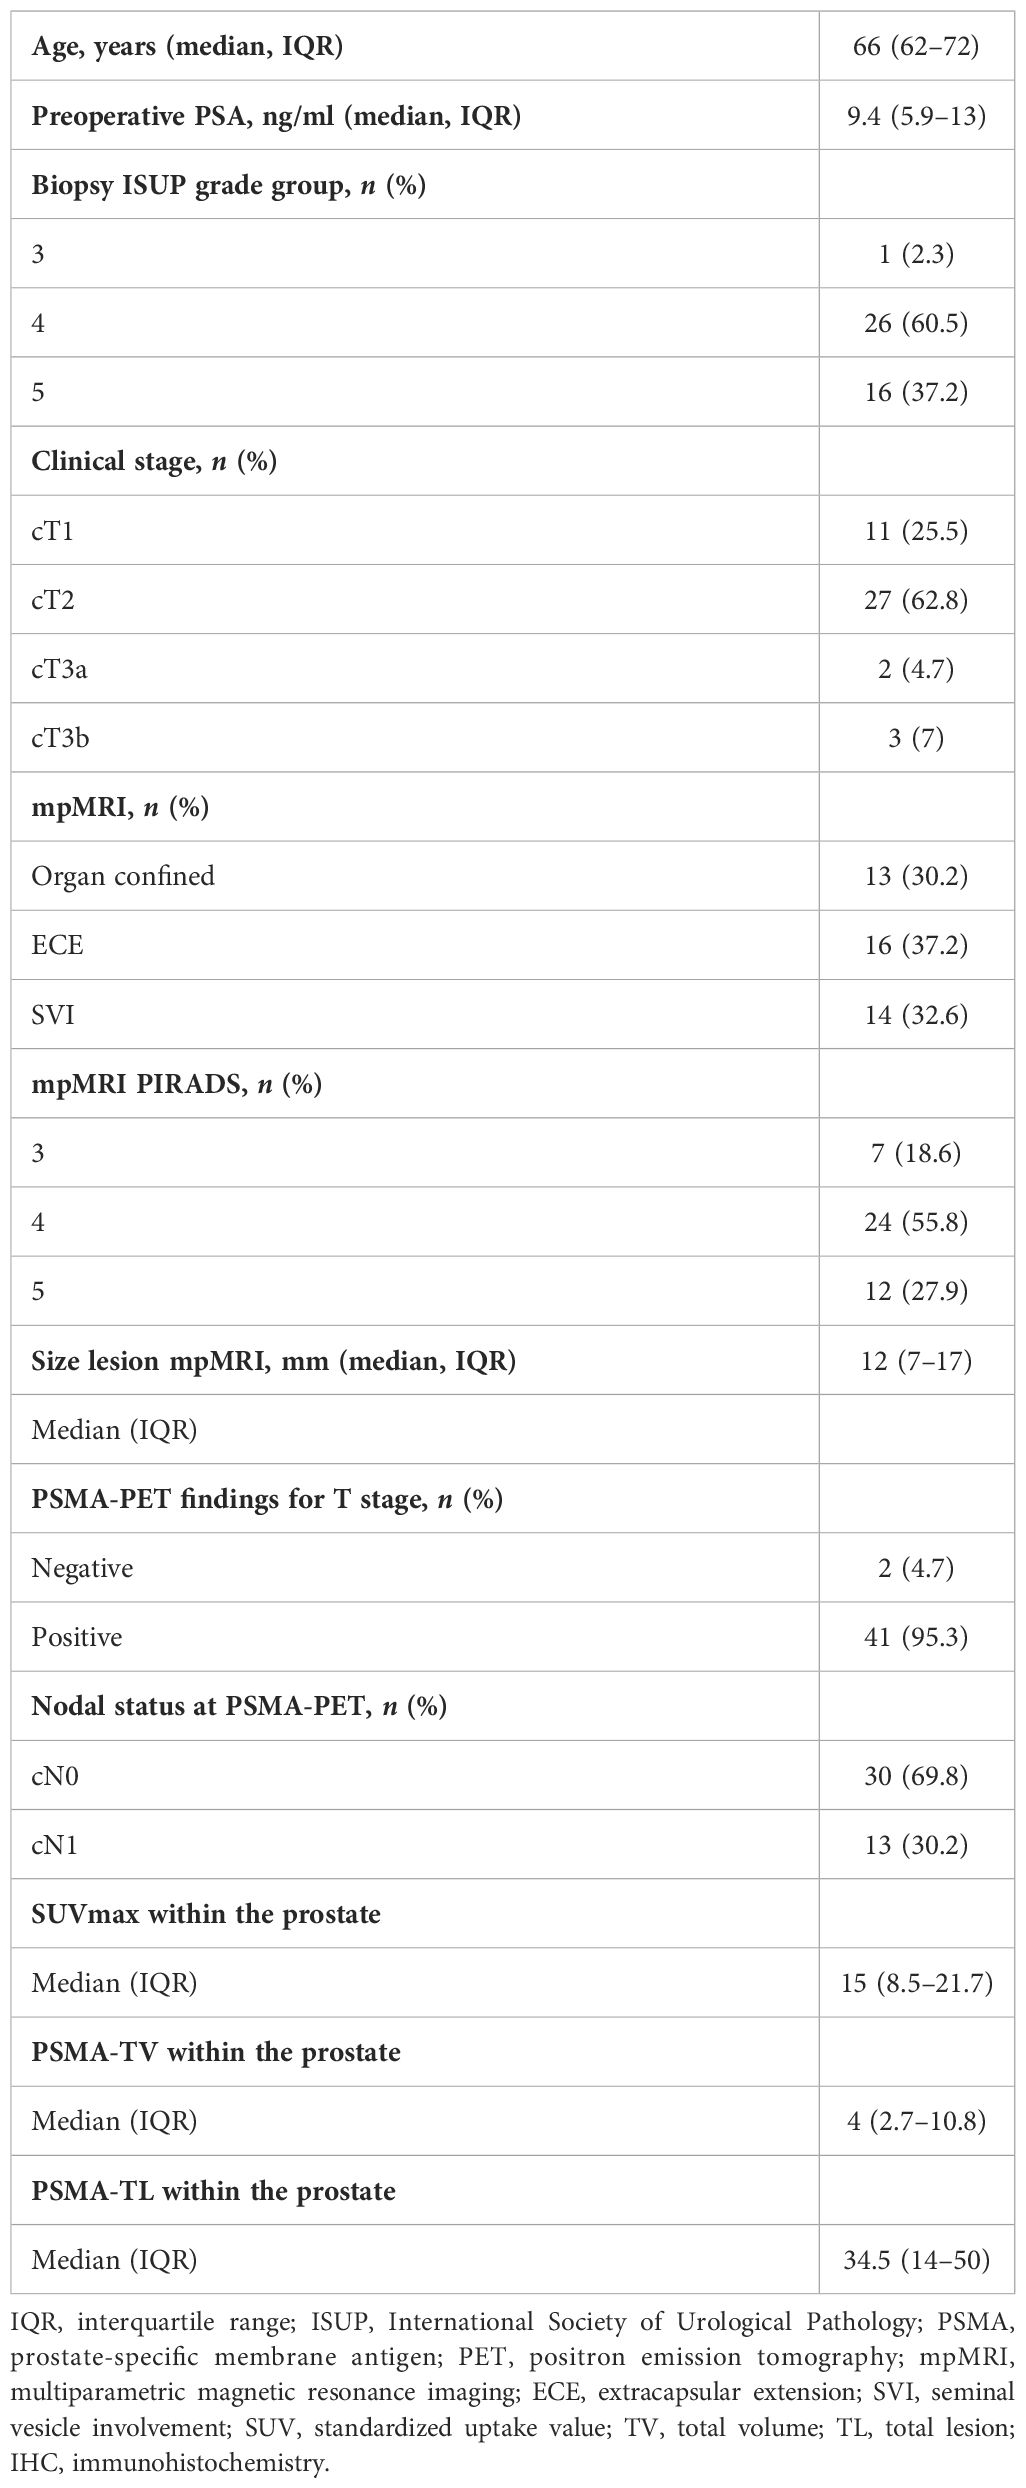
Table 1 Descriptive statistics in the overall population (n = 43).
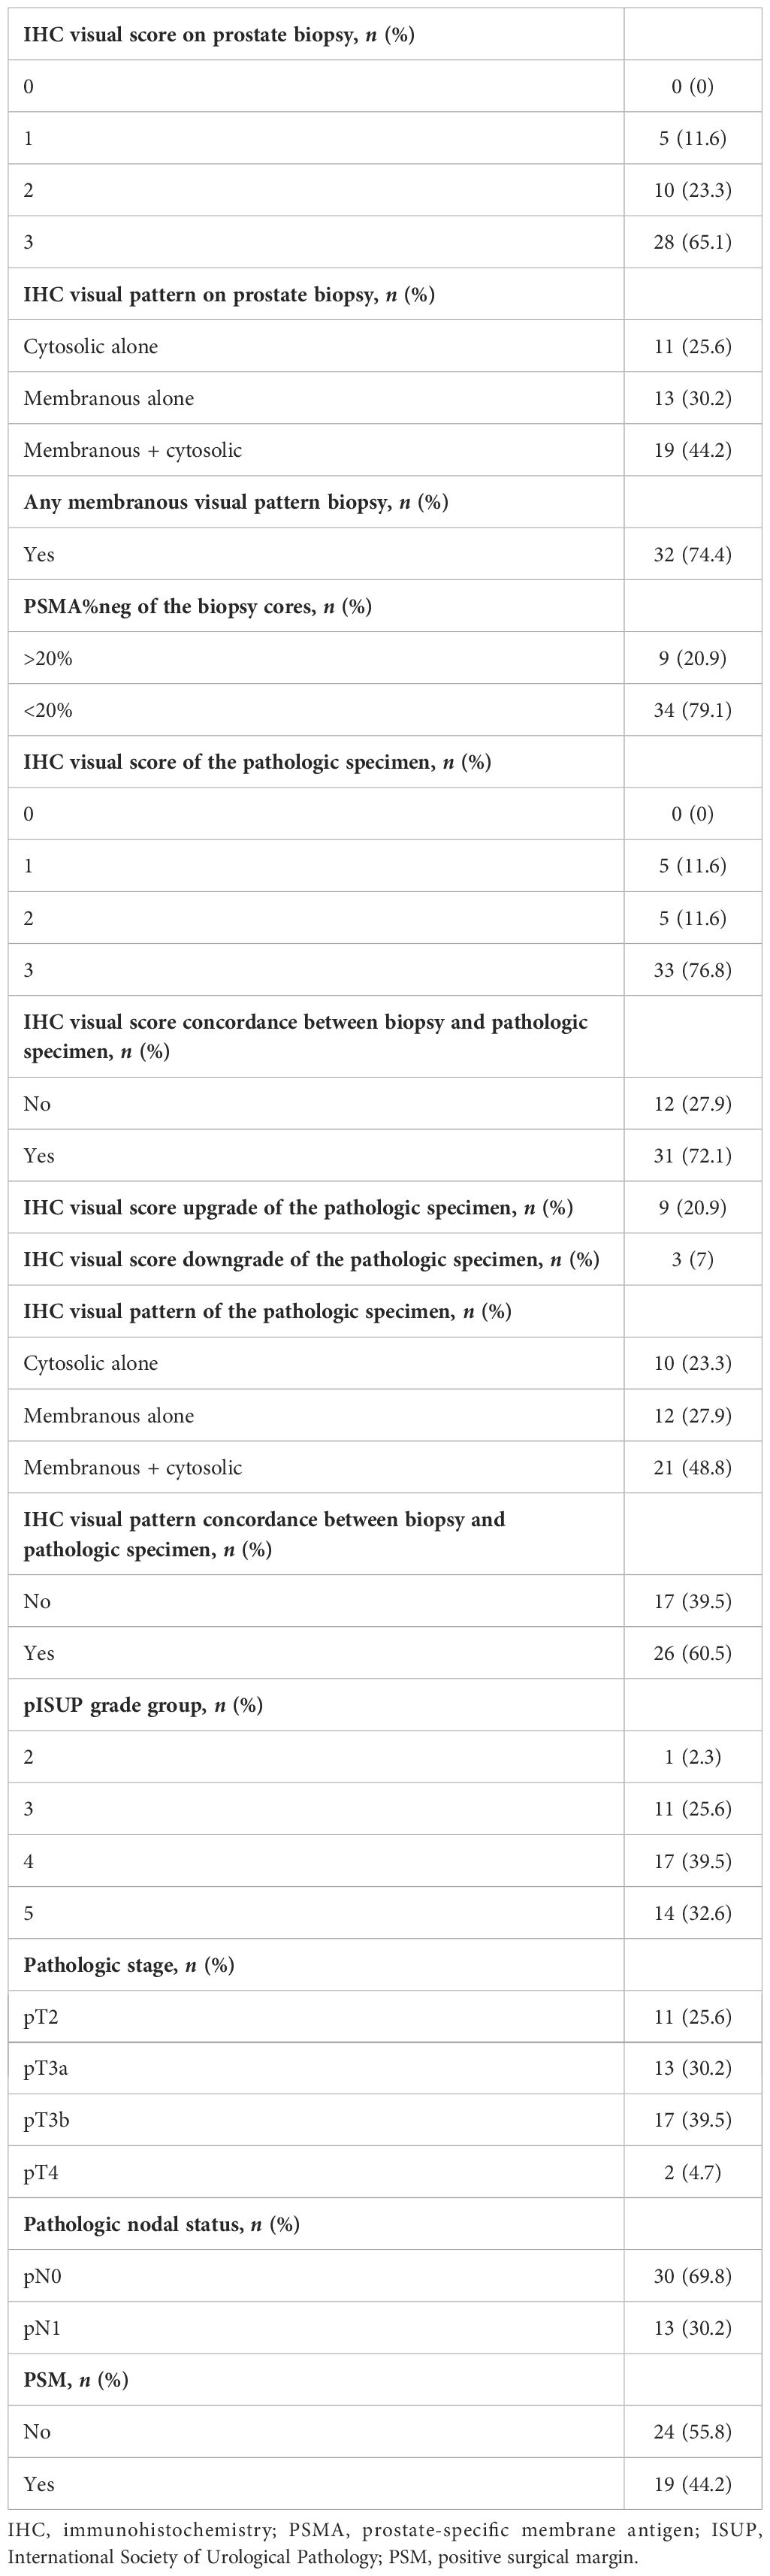
Table 2 Histologic findings and immunohistochemistry characteristics of biopsy cores and final pathologic specimens.
Immunohistochemistry analysis
The results of visual scores and patterns of both biopsy and final pathologic specimens are shown in Table 2. In biopsy cores, 5 (11.6%), 10 (23.3%), and 28 (65.1%) had visual scores of 1, 2, and 3, respectively; in the final pathology, 5 (11.6%), 5 (11.6%), and 33 (76.8%) had visual scores of 1, 2, and 3, respectively. The concordance analysis between visual score at biopsy and final pathology showed a Cohen’s kappa coefficient of 0.393 (Table 3A).
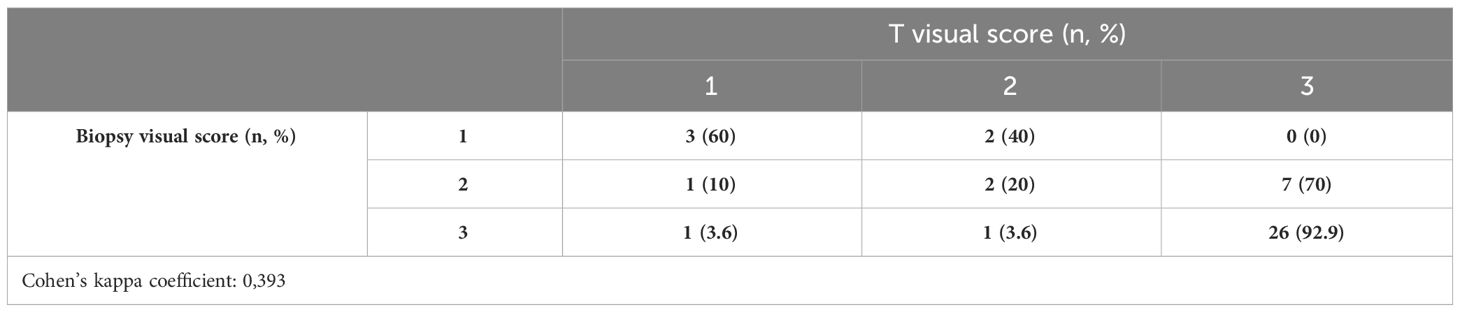
Table 3A Visual score of PSMA expression at IHC analysis in biopsy cores and pathologic specimens.
Between biopsy and final pathology specimens, 31 (72.1%) patients had the same IHC visual score, while nine (20.9%) cases showed an IHC visual score upgrade and 3 (7%) had an IHC visual score downgrade. In biopsy cores, 11 (25.6%), 13 (30.2%), and 19 (44.2%) had cytoplasmic, membranous, and combined IHC visual patterns of PSMA expression, respectively; at the final pathology, 10 (23.3%), 12 (27.9%), and 21 (48.8%) had cytoplasmic, membranous, and combined IHC visual patterns of PSMA expression, respectively. The concordance analysis between the visual pattern at biopsy and final pathology showed minimal agreement with Cohen’s kappa (k = 0.383) (Table 3B).
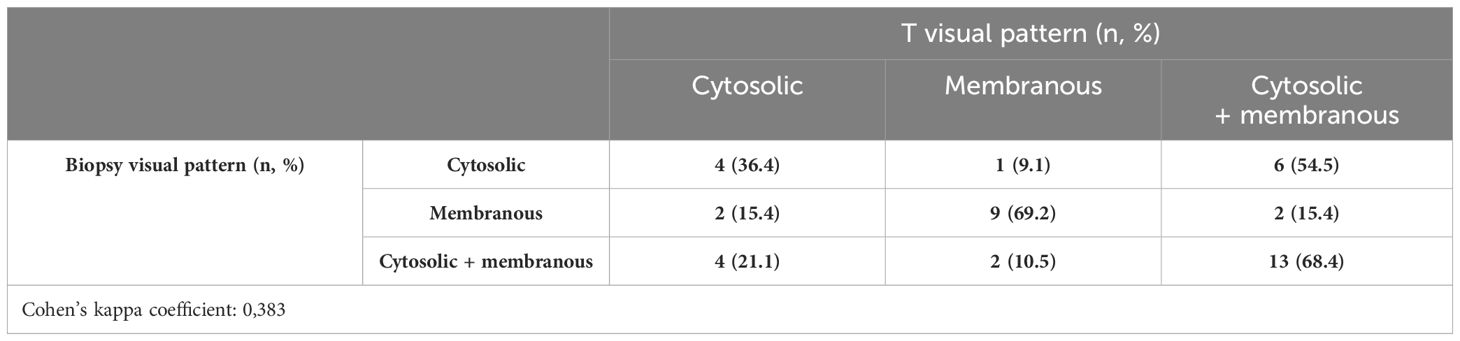
Table 3B Visual score of PSMA expression at IHC analysis in biopsy cores and pathologic specimens.
Overall, 34 (79.1%) patients had PSMA%neg <20%, while 9 (20.9%) had PSMA%neg >20% in biopsy cores. In patients with PSMA%neg <20%, the correlation between biopsy and final pathology visual score showed a Cohen’s kappa coefficient of 0.49. The concordance for visual pattern in biopsy and pathological specimens was low in patients with PSMA%neg >20% (k = 0.12) and higher in patients with PSMA%neg <20% (k = 0.41) Tables 4A, B, 5A, B.
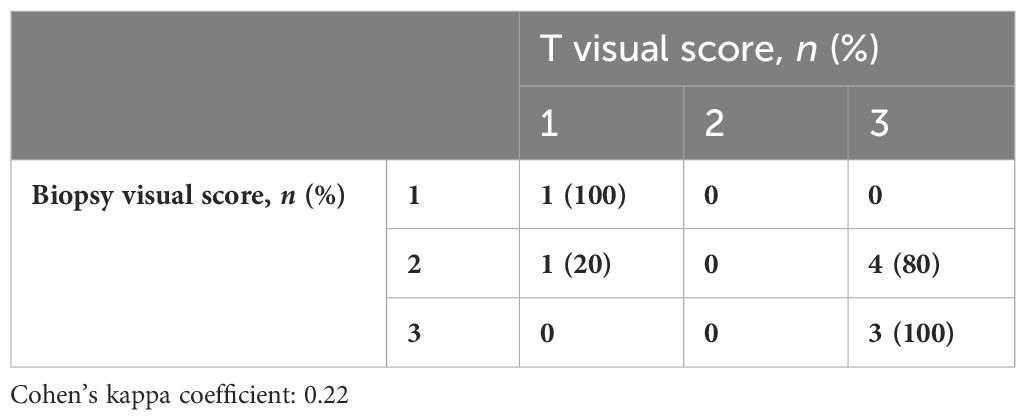
Table 4A Visual score correlation between biopsy cores and the final specimen in patients with PSMA%neg >20%.

Table 4B Visual score correlation between biopsy cores and the final specimen in patients with PSMA%neg <20%.
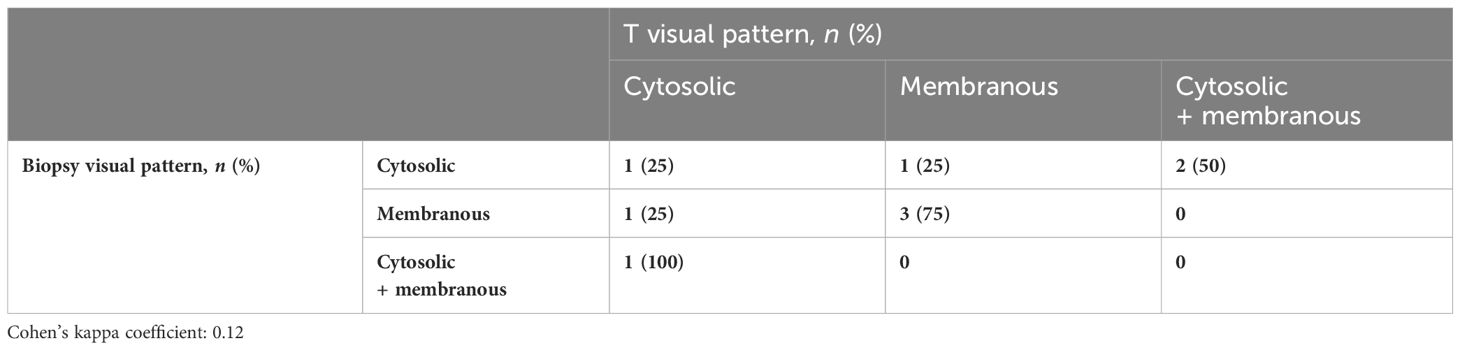
Table 5A Visual pattern correlation between biopsy cores and the final specimen in patients with PSMA%neg >20%.
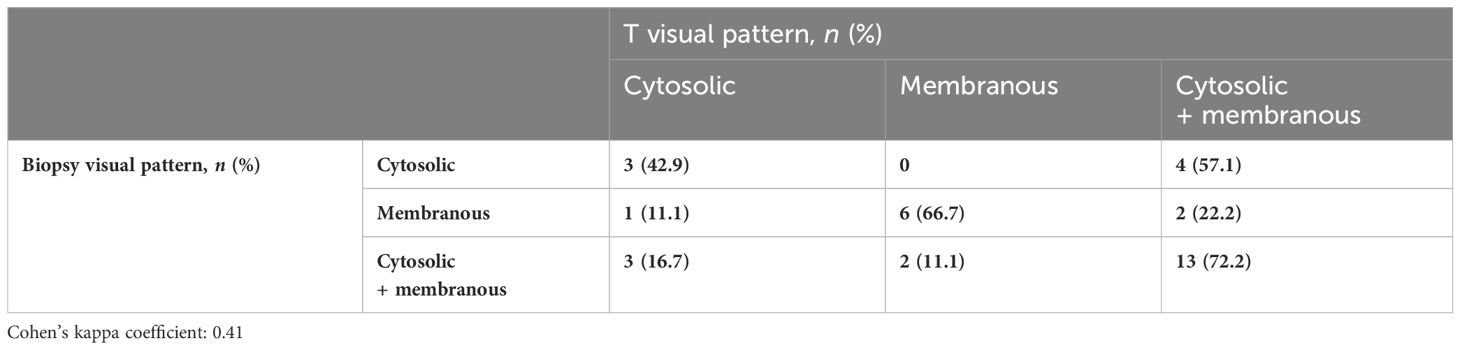
Table 5B Visual pattern correlation between biopsy cores and the final specimen in patients with PSMA%neg <20%.
Correlation of immunohistochemistry with PET parameters
Two patients (4.7%) had a negative PSMA-PET scan, with pathological ISUP 4 and 5 and PSMA visual scores of 1 and 3, respectively. The median SUVmax in the prostate was 15 (IQR 8.5–21.7), the median PSMA-TV was 4 (IQR 2.7–10.8), and the median PSMA-TL was 34.5 (IQR 14–50).
No difference emerged in terms of PSMA-TV (p = 0.3) (Figure 2) and PSMA-TL (p = 0.9) (Figure 3) according to IHC visual score at prostatic biopsy, while SUVmax was concordant with the visual score at biopsy (p = 0.04) (Figure 4). In this regard, the pairwise comparison showed a statistically significant difference in median SUVmax between patients with a visual score of 1 and a visual score of 3 at biopsy (8.5 vs. 19.4; p = 0.026), while those with a visual score of 2 and 3 were found to have similar values (12.5 vs. 19.4; p = 0.4) as well as VS 1 and VS 2 (8.5 vs. 12.5; p = 1.0).
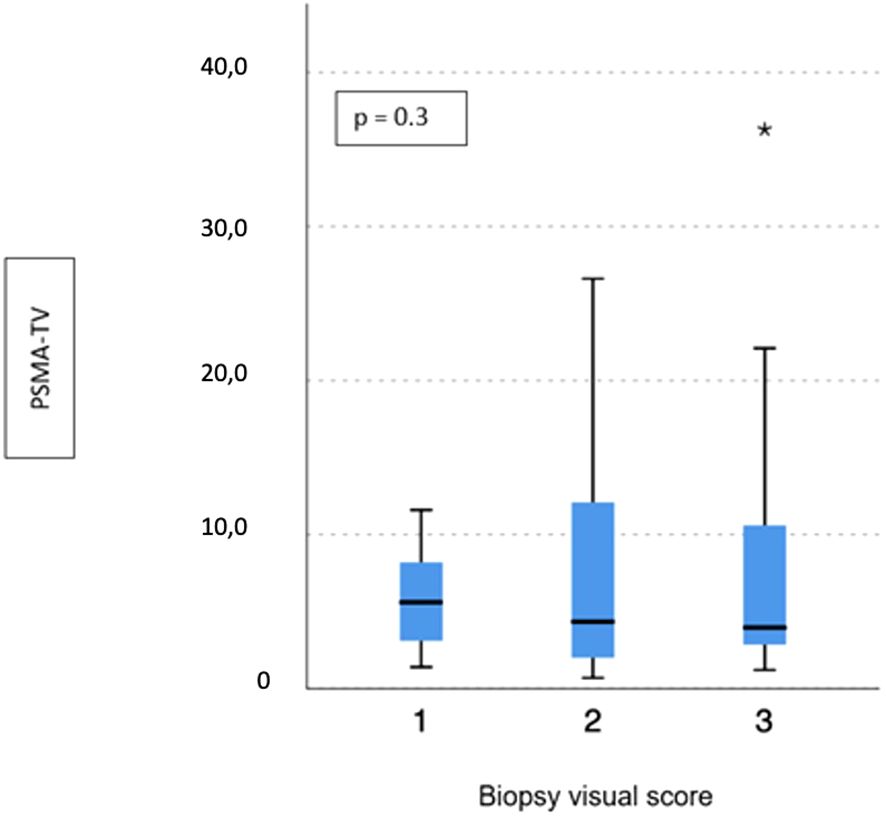
Figure 2 Correlation between biopsy visual score and median PSMA-TV. * means extreme values reported by sass graphics.
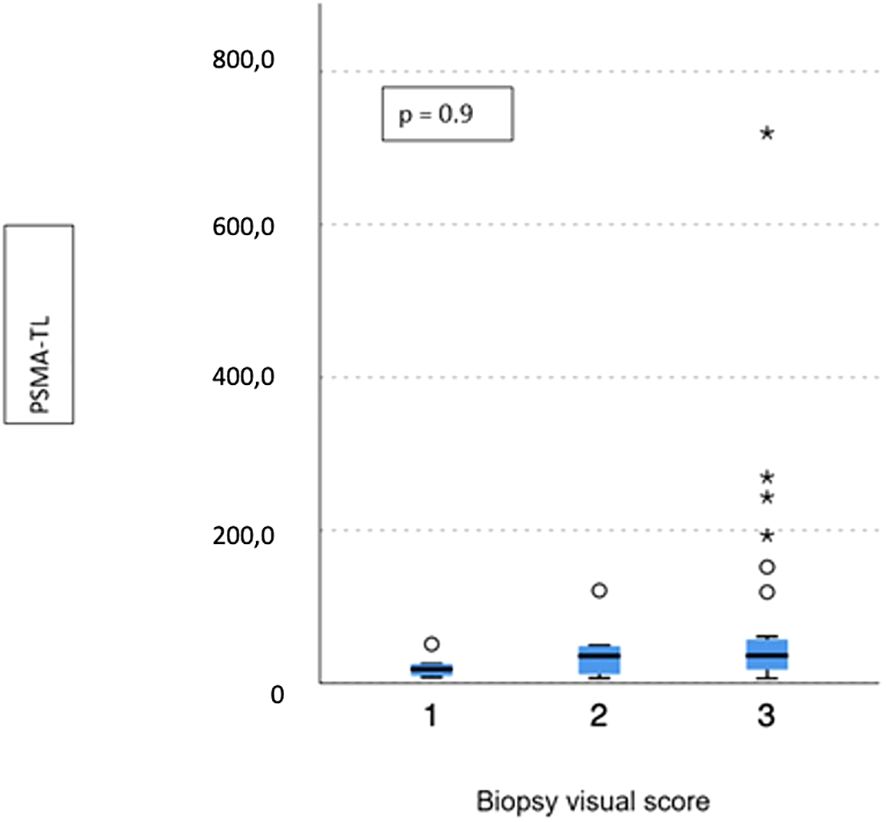
Figure 3 Correlation between biopsy visual score and median PSMA-TL. * means extreme values reported by sass graphics.
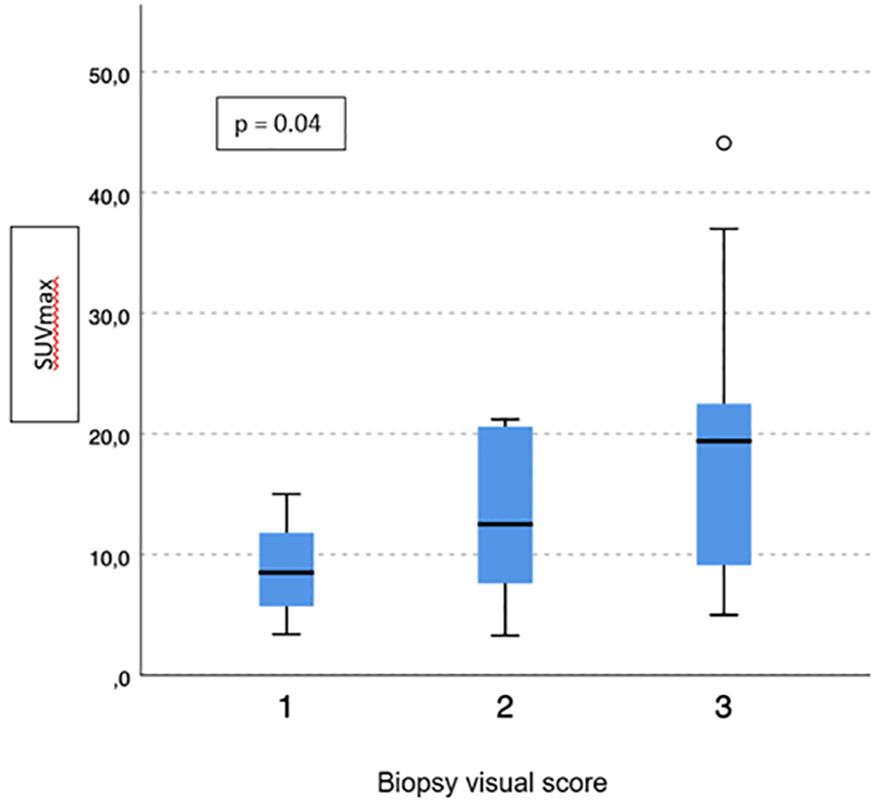
Figure 4 Correlation between biopsy visual score and median SUVmax.
Visual pattern PSMA expression at biopsy was associated with both SUVmax and PSMA-TV at PET-PSMA (p = 0.029 and p = 0.023, respectively) (Figures 5, 6), but not with PSMA-TL (Figure 7). In particular, higher SUVmax was found when membranous expression alone and a combined expression were present in biopsy cores (p = 0.008).
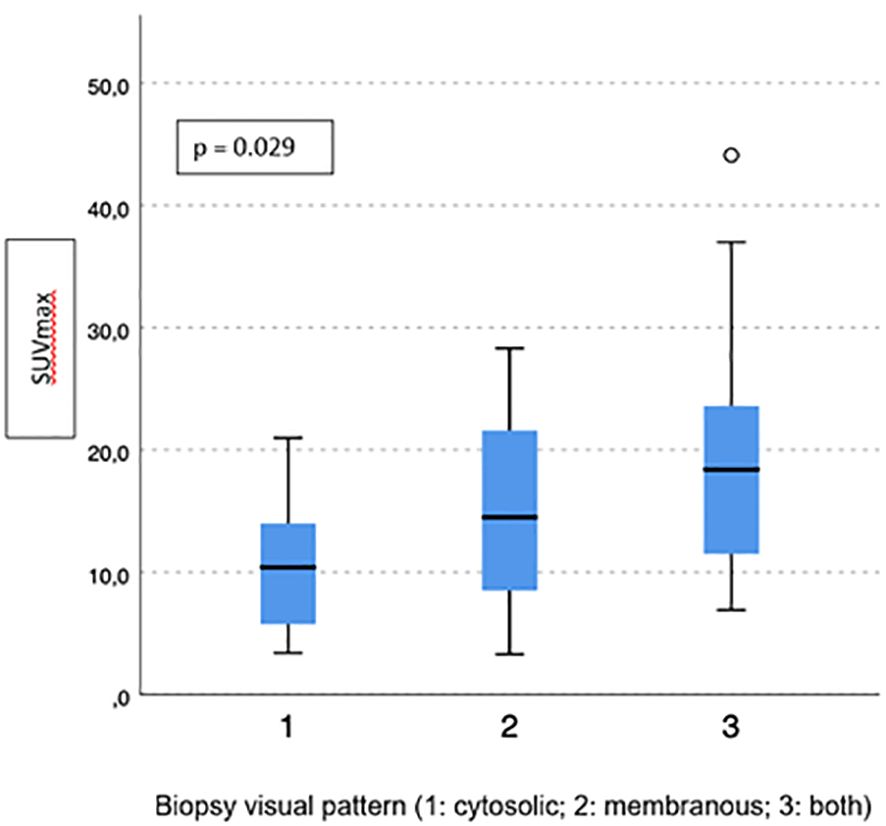
Figure 5 Correlation between biopsy visual pattern and median SUVmax.
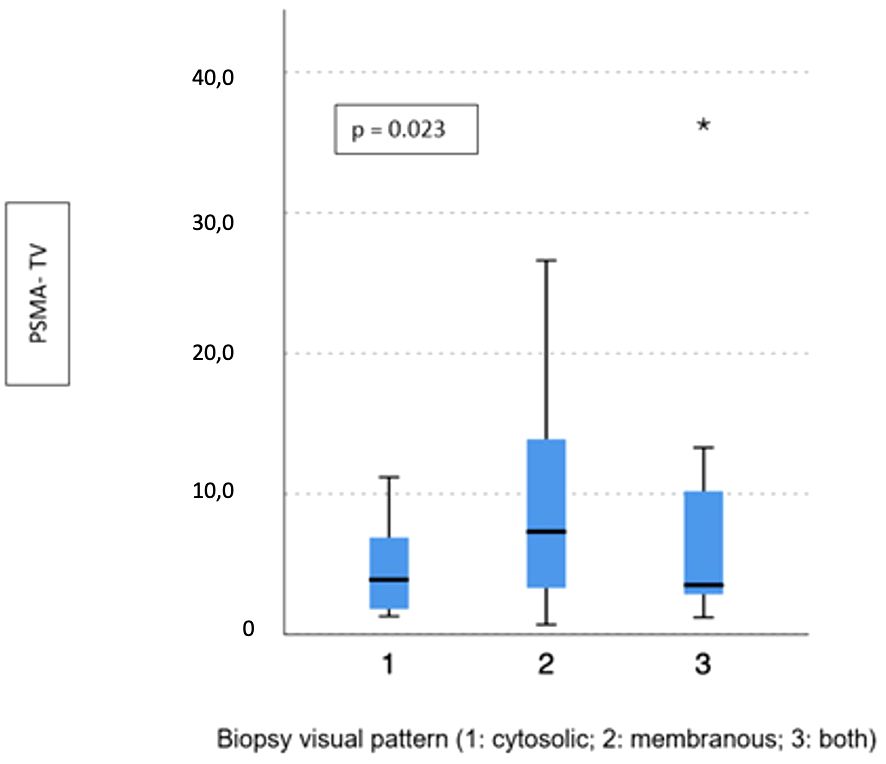
Figure 6 Correlation between biopsy visual pattern and median PSMA-TV. * means extreme values reported by sass graphics.
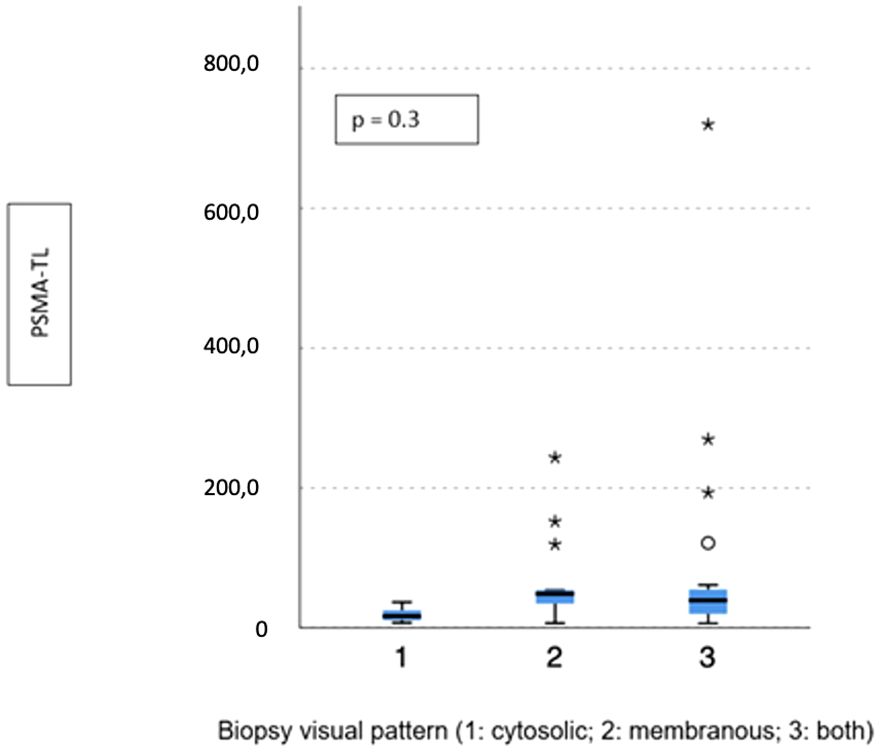
Figure 7 Correlation between biopsy visual pattern and median PSMA-TL. * means extreme values reported by sass graphics.
The presence of any membranous expression at biopsy (alone or combined with cytoplasmic) was associated with a significant difference in terms of median SUVmax (18.2 vs. 10.4; p = 0.02) and PSMA-TL (44.1 vs. 16.4; p = 0.005), but not PSMA-TV (4.4 vs. 3.9; p = 0.3).
No difference emerged between patients with PSMA%neg <20% or PSMA%neg >20% in biopsy cores in terms of SUVmax, PSMA-TL, and PSMA-TV (p = 0.5, p = 0.5, and p = 0.9, respectively).
Discussion
PSMA-PET represents a game-changing procedure for PCa management in restaging patients with BCR after radical treatment, to target the most appropriate treatment according to disease stage and patient characteristics. Similarly, PSMA-PET may represent a prognostic tool and could replace conventional imaging in selected high-risk PCa patients before primary treatment, due to its higher diagnostic accuracy for N and M staging (1, 23); thus, increasing interest emerged for a PSMA-based treatment. Moreover, the routine adoption of PSMA-PET for each high-risk patient for staging proposal may not be available in each center and may increase health system costs; thus, a correct patient selection for PSMA-based imaging is crucial for resource optimization. In this regard, IHC examination for PSMA expression of prostatic index lesions and biopsy cores might provide important data to help physicians identify patients who might benefit the most from a PSMA-PET and avoid false-negative findings, considering that approximately 10%–15% of patients may have no PSMA expression (13).
The impact of IHC expression for PSMA on PET results is still poorly assessed, and only a few studies (10, 13, 24) have assessed the correlation between IHC features of pathologic specimens of radical prostatectomy and PSMA-PET parameters. Woythal et al. (10) showed a significantly lower SUVmax in PCa patients receiving RP with an immunoreactive score (IRS) smaller than 2 or a PSMA staining in less than 50% of the cancer cells in pathological specimens.
Rüschoff et al. (13) found a significantly lower SUVmax in patients with significant PSMA-negative tumor areas: a PSMA%neg >20% strongly correlated with a negative PSMA-PET scan and was an independent predictor for a negative PSMA-PET. However, they found no significant association between visual pattern and SUVmax.
In a recent work from our group, Vetrone et al. (12) found a correlation between high PSMA-total lesion values and PSMA expression on IHC in pathologic specimens, both for visual score (mainly for VS 1 vs. VS 2 and for VS 1 vs. VS 3) and visual pattern (membranous expression). Similarly, a higher SUVmax was associated with VS 3 and a membranous pattern.
Our results support our previous findings on IHC evaluation of pathological specimens, extending the IHC analysis also for the biopsy core of the index lesion with the purpose of selecting patients for PSMA-PET evaluation before any treatment. VS 3 on biopsy cores was associated with higher SUVmax on PET scans, potentially helping in selecting patients for PSMA-PET. Overall, biopsy core VS was poorly related to final pathology, thus limiting the use of IHC in the preoperative setting to select patients for PSMA-PET. However, for patients with <20% PSMA-negative area in the index lesion biopsy cores, the VS concordance between biopsy and the final specimen was discrete. This finding might be due to a suboptimal characterization of PCa IHC expression through biopsy cores in the case of poorly expressed PSMA PCas.
Moreover, the correlation analysis between PSMA%neg and PET parameters showed no statistically significant results, thus limiting patient selection in this context.
A good indicator for patient selection might also be represented by the PSMA expression pattern, with particular regard to membranous expression, either alone or alongside the cytoplasmic pattern. Contrary to the findings of Rüschoff et al., membranous PSMA expression pattern in biopsy cores was associated with higher SUVmax and PSMA-TL at PSMA-PET. This might be due to a higher availability of membrane receptors to the radioligand.
This discrepancy might be due to different inclusion criteria among different studies. In our series, we included only patients affected by high-risk prostate cancer, in contrast to Rüschoff et al. These patients have a more aggressive disease that is usually associated with a higher likelihood of a positive PSMA-PET scan. It is known that a Gleason score >7 is associated with a higher SUVmax at PSMA-PET scan, as described by Uprimny et al. (25) These patients are those that are usually scheduled for systemic assessment of disease burden, and it is within this cohort that insights on optimal patient selection are needed to optimize resources. However, also the PSMA expression pattern (membranous vs. cytoplasmic vs. combined) on biopsy cores was poorly related to the final pathological specimen expression patterns, making the use of IHC less reliable for patient selection.
To our knowledge, this is the first study evaluating IHC parameters analyzed on index lesions in biopsy cores and their correlation with IHC parameters at final pathology and PSMA-PET features. However, we found that IHC features of PCa in biopsy cores poorly reflect the features of the final pathological specimen. This may be due to the variability of PSMA IHC expression in PCa since PSMA IHC analysis was not performed in all bioptic specimens (but only in targeted biopsy cores) and even targeted prostatic biopsy may not be representative of the real tumor volume expression at RP, particularly in low visual score (16). Thus, it might represent a significant limitation in its usefulness for patient selection in the primary staging setting.
Moreover, our cohort included only patients with high-risk PCa, which have a low rate of negative PSMA-PET for primary disease, and the impact of IHC analyses is therefore questionable in this context to identify false-negative findings at PSMA-PET.
Future studies might extend the use of IHC analyses to determine the usefulness of the PSMA-PET scan in the biochemical recurrence (BCR) setting to detect sites of recurrence, thus identifying patients with high PSMA expression as the best candidates for PSMA imaging and PSMA-targeted treatments.
Given these noteworthy findings, our study is not devoid of limitations.
First, the number of patients included in our cohort is relatively small, and it might scarcely represent the variability of tumor PSMA expression. However, our sample was similar to those previously published on the same topic.
Second, only a few patients had a negative PSMA-PET scan for primary disease. However, all included patients were harboring a high-risk disease, thus reducing the likelihood of a negative scan.
Third, the heterogeneity of the inclusion criteria in other studies hinders a comparison with our results.
Fourth, it is possible that the retrospective nature of this study may have introduced selection bias.
Furthermore, the visual score for IHC analysis may be affected by the interoperator variability, and an objective evaluation of IHC expression by using a dedicated scanner could add to this bias.
Conclusions
Although the correlation between IHC parameters of biopsy cores and final pathology was not as high as expected, we found a good correlation between IHC visual score and visual pattern (membranous alone or combined with cytoplasmic) of the index lesion in the targeted biopsy cores and SUVmax at PSMA-PET. Furthermore, we found that the presence of PSMA%neg <20% seems to have a better concordance between biopsy and the final specimen in terms of visual score, suggesting a possible stronger correlation between this factor and PET parameters, possibly leading to a better patient selection in this regard.
Data availability statement
The raw data supporting the conclusions of this article will be made available by the authors, without undue reservation.
Ethics statement
The studies involving humans were approved by IRCCS Azienda Ospedaliero-Unversitaria Policlinico S. Orsola di Bologna 244/2016/O/Oss. The studies were conducted in accordance with the local legislation and institutional requirements. The participants provided their written informed consent to participate in this study.
Author contributions
MD: Conceptualization, Formal analysis, Methodology, Software, Writing – original draft, Writing – review & editing. LB: Conceptualization, Methodology, Supervision, Writing – original draft. MP: Data curation, Investigation, Writing – original draft. LV: Writing – review & editing. AF: Writing – review & editing. RM: Writing – review & editing. FG: Writing – review & editing. ADe: Writing – review & editing. AM: Writing – review & editing. PP: Writing – review & editing. DC: Writing – review & editing. PC: Writing – review & editing. AD’E: Writing – review & editing. RS: Writing – review & editing. EB: Writing – review & editing. SF: Writing – review & editing.
Funding
The author(s) declare financial support was received for the research, authorship, and/or publication of this article. The work reported in this publication was funded by the Italian Ministry of Health, RC-2022-2773410).
Conflict of interest
The authors declare that the research was conducted in the absence of any commercial or financial relationships that could be construed as a potential conflict of interest.
The author(s) declared that they were an editorial board member of Frontiers, at the time of submission. This had no impact on the peer review process and the final decision.
Publisher’s note
All claims expressed in this article are solely those of the authors and do not necessarily represent those of their affiliated organizations, or those of the publisher, the editors and the reviewers. Any product that may be evaluated in this article, or claim that may be made by its manufacturer, is not guaranteed or endorsed by the publisher.
References
1. Hofman MS, Lawrentschuk N, Francis RJ, Tang C, Vela I, Thomas P, et al. Prostate-specific membrane antigen PET-CT in patients with high-risk prostate cancer before curative-intent surgery or radiotherapy (proPSMA): a prospective, randomised, multicentre study. Lancet Lond Engl. (2020) 395:1208–16. doi: 10.1016/S0140-6736(20)30314-7
2. Bianchi L, Schiavina R, Borghesi M, Ceci F, Angiolini A, Chessa F, et al. How does (68) Ga-prostate-specific membrane antigen positron emission tomography/computed tomography impact the management of patients with prostate cancer recurrence after surgery? Int J Urol Off J Jpn Urol Assoc. (2019) 26(8):804–11. doi: 10.1111/iju.14012
3. Schiavina R, Bianchi L, Bunocilla E. PSMA PET/CT to stage high-risk prostate cancer: Is already the time to replace conventional imaging? Minerva Urol Nephrol. (2021) 73:135–6. doi: 10.23736/S2724-6051.21.04343-5
4. van Kalmthout LWM, van Melick HHE, Lavalaye J, Meijer RP, Kooistra A, de Klerk JMH, et al. Prospective validation of gallium-68 prostate specific membrane antigen-positron emission tomography/computerized tomography for primary staging of prostate cancer. J Urol. (2020) 203:537–45. doi: 10.1097/JU.0000000000000531
5. Pienta KJ, Gorin MA, Rowe SP, Carroll PR, Pouliot F, Probst S, et al. A phase 2/3 prospective multicenter study of the diagnostic accuracy of prostate specific membrane antigen PET/CT with 18F-DCFPyL in prostate cancer patients (OSPREY). J Urol. (2021) 206:52–61. doi: 10.1097/JU.0000000000001698
6. Cornford P, Van Den Bergh RCN, Briers E, Van Den Broeck T, Cumberbatch MG, De Santis M, et al. EAU-EANM-ESTRO-ESUR-SIOG guidelines on prostate cancer. Part II—2020 update: treatment of relapsing and metastatic prostate cancer. Eur Urol. (2021) 79:263–82. doi: 10.1016/j.eururo.2020.09.046
7. Bianchi L, Castellucci P, Farolfi A, Droghetti M, Artigas C, Leite J, et al. Multicenter external validation of a nomogram for predicting positive prostate-specific membrane antigen/positron emission tomography scan in patients with prostate cancer recurrence. Eur Urol Oncol. (2023) 6:41–8. doi: 10.1016/j.euo.2021.12.002
8. Bianchi L, Borghesi M, Schiavina R, Castellucci P, Ercolino A, Bianchi FM, et al. Predictive accuracy and clinical benefit of a nomogram aimed to predict 68Ga-PSMA PET/CT positivity in patients with prostate cancer recurrence and PSA < 1 ng/ml external validation on a single institution database. Eur J Nucl Med Mol Imaging. (2020) 47:2100–5. doi: 10.1007/s00259-020-04696-z
9. Rauscher I, Düwel C, Haller B, Rischpler C, Heck MM, Gschwend JE, et al. Efficacy, predictive factors, and prediction nomograms for 68Ga-labeled prostate-specific membrane antigen-ligand positron-emission tomography/computed tomography in early biochemical recurrent prostate cancer after radical prostatectomy. Eur Urol. (2018) 73:656–61. doi: 10.1016/j.eururo.2018.01.006
10. Woythal N, Arsenic R, Kempkensteffen C, Miller K, Janssen JC, Huang K, et al. Immunohistochemical validation of PSMA expression measured by 68Ga-PSMA PET/CT in primary prostate cancer. J Nucl Med Off Publ Soc Nucl Med. (2018) 59:238–43. doi: 10.2967/jnumed.117.195172
11. Paschalis A, Sheehan B, Riisnaes R, Rodrigues DN, Gurel B, Bertan C, et al. Prostate-specific membrane antigen heterogeneity and DNA repair defects in prostate cancer. Eur Urol. (2019) 76:469–78. doi: 10.1016/j.eururo.2019.06.030
12. Vetrone L, Mei R, Bianchi L, Giunchi F, Farolfi A, Castellucci P, et al. Histology and PSMA expression on immunohistochemistry in high-risk prostate cancer patients: comparison with 68Ga-PSMA PET/CT features in primary staging. Cancers. (2023) 15:1716. doi: 10.3390/cancers15061716
13. Rüschoff JH, Ferraro DA, Muehlematter UJ, Laudicella R, Hermanns T, Rodewald AK, et al. What’s behind 68Ga-PSMA-11 uptake in primary prostate cancer PET? Investigation of histopathological parameters and immunohistochemical PSMA expression patterns. Eur J Nucl Med Mol Imaging. (2021) 48:4042–53. doi: 10.1007/s00259-021-05501-1
14. Borghesi M, Bianchi L, Barbaresi U, Vagnoni V, Corcioni B, Gaudiano C, et al. Diagnostic performance of MRI/TRUS fusion-guided biopsies vs. systematic prostate biopsies in biopsy-naïve, previous negative biopsy patients and men undergoing active surveillance. Minerva Urol Nephrol. (2021) 73:357–66. doi: 10.23736/S2724-6051.20.03758-3
15. Droghetti M, Bianchi L, Gaudiano C, Corcioni B, Rustici A, Piazza P, et al. Comparison of prostate cancer detection rate at targeted biopsy of hub and spoke centers mpMRI: experience matters. Minerva Urol Nephrol. (2023) 75:42–9. doi: 10.23736/S2724-6051.22.04932-1
16. Droghetti M, Bianchi L, Beretta C, Balestrazzi E, Costa F, Feruzzi A, et al. Site-specific concordance of targeted and systematic biopsy cores at the index lesion on multiparametric magnetic resonance: can we spare the double-tap? World J Urol. (2023) 41:27–33. doi: 10.1007/s00345-022-04229-3
17. Schiavina R, Droghetti M, Novara G, Bianchi L, Gaudiano C, Panebianco V, et al. The role of multiparametric MRI in active surveillance for low-risk prostate cancer: The ROMAS randomized controlled trial. Urol Oncol Semin Orig Investig. (2021) 39:433.e1–7. doi: 10.1016/j.urolonc.2020.10.018
18. Turkbey B, Rosenkrantz AB, Haider MA, Padhani AR, Villeirs G, Macura KJ, et al. Prostate imaging reporting and data system version 2.1: 2019 update of prostate imaging reporting and data system version 2. Eur Urol. (2019) 76:340–51. doi: 10.1016/j.eururo.2019.02.033
19. Fendler WP, Eiber M, Beheshti M, Bomanji J, Calais J, Ceci F, et al. PSMA PET/CT: joint EANM procedure guideline/SNMMI procedure standard for prostate cancer imaging 2. 0. Eur J Nucl Med Mol Imaging. (2023) 50:1466–86. doi: 10.1007/s00259-022-06089-w
20. Seifert R, Emmett L, Rowe SP, Herrmann K, Hadaschik B, Calais J, et al. Second version of the prostate cancer molecular imaging standardized evaluation framework including response evaluation for clinical trials (PROMISE V2). Eur Urol. (2023) 83:405–12. doi: 10.1016/j.eururo.2023.02.002
21. Netto GJ, Amin MB, Berney DM, Compérat EM, Gill AJ, Hartmann A, et al. The 2022 world health organization classification of tumors of the urinary system and male genital organs-part B: Prostate and urinary tract tumors. Eur Urol. (2022) 82:469–82. doi: 10.1016/j.eururo.2022.07.002
22. McHugh ML. Interrater reliability: the kappa statistic. Biochem Medica. (2012) 22:276–82. doi: 10.11613/issn.1846-7482
23. Perera M, Papa N, Roberts M, Williams M, Udovicich C, Vela I, et al. Gallium-68 prostate-specific membrane antigen positron emission tomography in advanced prostate cancer—Updated diagnostic utility, sensitivity, specificity, and distribution of prostate-specific membrane antigen-avid lesions: A systematic review and meta-analysis. Eur Urol. (2019) 77(4):403–17. doi: 10.1016/j.eururo.2019.01.049
24. Ferraro DA, Rüschoff JH, Muehlematter UJ, Kranzbühler B, Müller J, Messerli M, et al. Immunohistochemical PSMA expression patterns of primary prostate cancer tissue are associated with the detection rate of biochemical recurrence with 68Ga-PSMA-11-PET. Theranostics. (2020) 10:6082–94. doi: 10.7150/thno.44584
25. Uprimny C, Kroiss AS, Decristoforo C, Fritz J, von Guggenberg E, Kendler D, et al. 68Ga-PSMA-11 PET/CT in primary staging of prostate cancer: PSA and Gleason score predict the intensity of tracer accumulation in the primary tumour. Eur J Nucl Med Mol Imaging. (2017) 44:941–9. doi: 10.1007/s00259-017-3631-6
Keywords: PSMA PET, immunohistochemistry, prostate cancer, biopsy, radical prostatectomy
Citation: Droghetti M, Bianchi L, Presutti M, Vetrone L, Farolfi A, Mei R, Giunchi F, Degiovanni A, Mottaran A, Piazza P, Cangemi D, Castellucci P, D’Errico A, Schiavina R, Brunocilla E and Fanti S (2024) Immunohistochemistry analysis of PSMA expression at prostatic biopsy in high-risk prostate cancer: potential implications for PSMA-PET patient selection. Front. Oncol. 14:1324631. doi: 10.3389/fonc.2024.1324631
Received: 19 October 2023; Accepted: 18 April 2024;
Published: 14 May 2024.
Edited by:
Alfonso Urbanucci, Oslo University Hospital, NorwayCopyright © 2024 Droghetti, Bianchi, Presutti, Vetrone, Farolfi, Mei, Giunchi, Degiovanni, Mottaran, Piazza, Cangemi, Castellucci, D’Errico, Schiavina, Brunocilla and Fanti. This is an open-access article distributed under the terms of the Creative Commons Attribution License (CC BY). The use, distribution or reproduction in other forums is permitted, provided the original author(s) and the copyright owner(s) are credited and that the original publication in this journal is cited, in accordance with accepted academic practice. No use, distribution or reproduction is permitted which does not comply with these terms.
*Correspondence: Matteo Droghetti, ZHJvZ2hldEBnbWFpbC5jb20=
†These authors have contributed equally to this work