 Ni An
Ni An Yu Zhang
 Zhilin Sha
 Zhen Xu
 Xiuzhen Liu1*‡
- 1Department of Anesthesiology, The Eighth Medical Center of Chinese PLA General Hospital, Beijing, China
- 2No.91126 Military Hospital of Chinese PLA, Dalian, China
- 3Department I of Biliary Tract Surgery, Eastern Hepatobiliary Surgery Hospital, Naval Medical University, Shanghai, China
Introduction: Type 2 diabetes mellitus (T2DM) was associated with digestive system tumors. We analyzed publicly available data from GWAS studies using Mendelian randomization methods to clarify its causal relationship and mechanisms. Five common digestive system tumors and four diabetes-related phenotypes were included.
Methods: Inverse variance weighted method was the main analytical method. Meta-analysis was used to summarize results of multiple data sources. Horizontal pleiotropy was tested using Egger-intercept method and validated by MRPRESSO method. Heterogeneity and sensitivity analysis were conducted by Cochran’s Q test and leave-one-out method, respectively.
Results: T2DM is associated with a reduced risk of esophageal (OR: 0.77, 95% CI: 0.71 to 0.83, P< 0.001), gastric (OR: 0.87, 95% CI: 0.84 to 0.90, P< 0.001) and colorectal cancer (OR: 0.88, 95% CI: 0.85 to 0.91, P< 0.001) and hepatocellular carcinoma (OR: 0.92, 95% CI: 0.86 to 0.97, P = 0.005) and an increased risk of pancreatic cancer (OR: 1.92, 95% CI: 1.47 to 2.50, P< 0.001) in East Asian population. T2DM causes decreased fasting insulin levels (OR = 0.966, 95% CI: 0.95 to 0.98, P< 0.001) and increased glycated hemoglobin levels (OR=1.41, 95% CI: 1.39 to 1.44, P<0.001). Elevated fasting insulin levels increase the risk of esophageal cancer (OR = 10.35, 95% CI: 1.10 to 97.25, P = 0.041), while increased glycated hemoglobin levels increase pancreatic cancer risk (OR=2.33, 95% CI: 1.37 to 3.97, P=0.002) but decrease gastric cancer risk (OR=0.801, 95% CI: 0.65 to 0.99, P=0.044).
Conclusion: T2DM is associated with a reduced risk of esophageal, gastric and colorectal cancer and hepatocellular carcinoma in East Asian populations. The causal relationships between T2DM with esophageal and gastric cancer are partially mediated by decreased fasting insulin and increased glycated hemoglobin levels, respectively. T2DM indirectly increases the risk of pancreatic cancer by increasing glycated hemoglobin levels.
Highlights
● To clarify the causal relationship and mechanisms between T2DM and five digestive system tumors.
● Is T2DM a risk factor for digestive tract tumors in East Asian population?
● T2DM reduced the risks of esophageal, gastric and colorectal cancer and hepatocellular carcinoma in East Asian population.
● T2DM may have different impacts on different ethnicities.
Introduction
The prevalence of diabetes is increasing worldwide yearly (1) with its age at onset decreasing as shown by several studies (2). The attention to type 2 diabetes mellitus (T2DM) and cancer has increased and led to a rapid proliferation of observation studies. Multiple large-scale epidemiological studies and meta-analyses have found an association between T2DM and various cancers including colorectal cancer, liver cancer and pancreatic cancer (3–5).
However, there are many methodological challenges that must be addressed in observational studies of cancer incidence in people with T2DM, including the usual suspects of potential biases or confounding factors that threaten the validity of studies and also the potential interactions between T2DM and cancer (6). For example, some studies found that the incidences of multiple cancers, including colorectal, lung, liver, cervical, endometrial, ovarian, pancreatic and prostate cancers, were greater within the first months to years following the diagnosis of diabetes, however, after the initial period, the risks of lung, cervical and endometrial cancers in participants with diabetes were the same as those observed in participants without (7). These results suggested that the likelihood of developing cancer was increased by the fact that diabetes was recently identified. A retrospective study from Australia has reported similar results in breast cancer (8). It remains unclear whether T2DM is causally related to cancer, or whether the observed association is confounded by other factors.
T2DM is an insidious condition, with its onset typically recognized in older adults. The potential biological mechanisms for the association between diabetes and cancer include hyperinsulinemia, hyperglycemia and insulin resistance (6, 9). Hyperglycemia is responsible for the induction of oxidative stress and DNA damage, which may trigger the first phase of tumorigenesis (9). Hyperglycemia may also contribute to the generation of advanced glycation end products (AGEs) that stimulates the production of reactive oxygen species and inflammation (10). Chronic activation of the AGEs pathway has been shown to promote the tumor transformation of epithelial cells and the resistance of tumor cells to oxidative stress (10, 11). However, evidence from the large RCTs of intensified glycemic control for T2DM does not support the causal hypothesis that lowering blood glucose will reduce the risk of cancer, and the accumulating experimental and epidemiological evidence is more consistent with the hyperinsulinemia hypothesis, and less so with the hyperglycemia hypothesis (6). Hyperinsulinemia promotes tumor cell growth via insulin receptor directly and IGF-1 receptor indirectly (12), all of which can stimulate the proliferation and survival of cancer cells and promote metastasis, thus favoring cancer progression (9, 13). Insulin stimulation from increased expression of insulin receptors may result in enhanced proliferation with loss of cell contact inhibition, and cancer cells frequently show augmented insulin receptor expression levels, mostly of the isoform A (lacking exon-11), whose activation is more responsible for mitogenic than metabolic effects and also shows high affinity for IGF-2 (9, 14). However, insulin resistance and hyperinsulinemia can predate the clinical diagnosis of T2DM by up to 10 years, thus the influence of this condition on cancer risk may begin well before diabetes diagnosis (6, 12).
A review in 2013 summarized the epidemiological, pathophysiological, genetical and socioeconomical factors in the differences of pathogenesis of T2DM between Asians and Caucasians, and found different characteristics of diabetes in Asians. Comparing with Caucasians, Asians with T2DM have lower mean BMI, greater adiposity or visceral fat and more insulin resistant, also show a tendency to develop young-onset diabetes and a predisposition to impaired insulin secretion, besides, they also have different lifestyles and environmental risk factors (1). These differences raised the need for re-examining the association between cancer and T2DM in Asian.
The genetic alleles associated with exposure are randomly distributed during conception, independent of self-selected lifestyle and environmental factors, and unaffected by disease interference. Mendelian randomization (MR) analysis leverages this characteristic by using genetic variants as instrumental variables to mitigate the influence of confounding factors such as environmental factors, lifestyle changes and reverse causality, thereby strengthening the inference of association between exposure and outcome. Therefore, MR can be an appropriate way to figure out the causal relationship between T2DM and cancer. In this study, we conducted two-sample MR (TSMR) analyses using publicly available genome-wide association studies (GWAS) databases to explore the causal relationship between T2DM and diabetes-related manifestations such as hemoglobin A1c (HbA1c) protein and fasting insulin levels, with five digestive system malignancies including esophageal cancer, gastric cancer, colorectal cancer, liver and bile duct cancer, and pancreatic cancer.
Materials and methods
Study design
The present study primarily utilized the TSMR method to explore the causal relationship between T2DM and its manifestations with five common digestive system tumors including esophageal cancer, gastric cancer, colorectal cancer, liver and bile duct cancer, and pancreatic cancer, resorting genetic variable instruments. Through GWAS published in the Japan Biobank (BBJ), Finnish database (Finn database) and other publicly available resources, single nucleotide polymorphisms (SNPs) that are statistically significant associated with T2DM and its manifestations were screened as instrumental variables, and the TSMR approach was employed to assess the causal relationship between T2DM and its manifestations with the five aforementioned digestive system tumors.
MR analysis relies on the satisfaction of three assumptions: (1) The instrumental variables (IVs) should be strongly associated with the exposure; (2) The IVs should not be associated with confounding factors related to both exposure and outcome; (3) The IVs should only affect the outcome through the exposure rather than through other pathways.
Two-sample Mendelian randomization
Data source
The genetic data used in this study was obtained from the IEU OpenGWAS project (mrcieu.ac.uk). The GWAS data information used in this study is shown in Table 1, and the summarized demographic data of the GWAS of 5 primary outcomes are shown in Table 2.
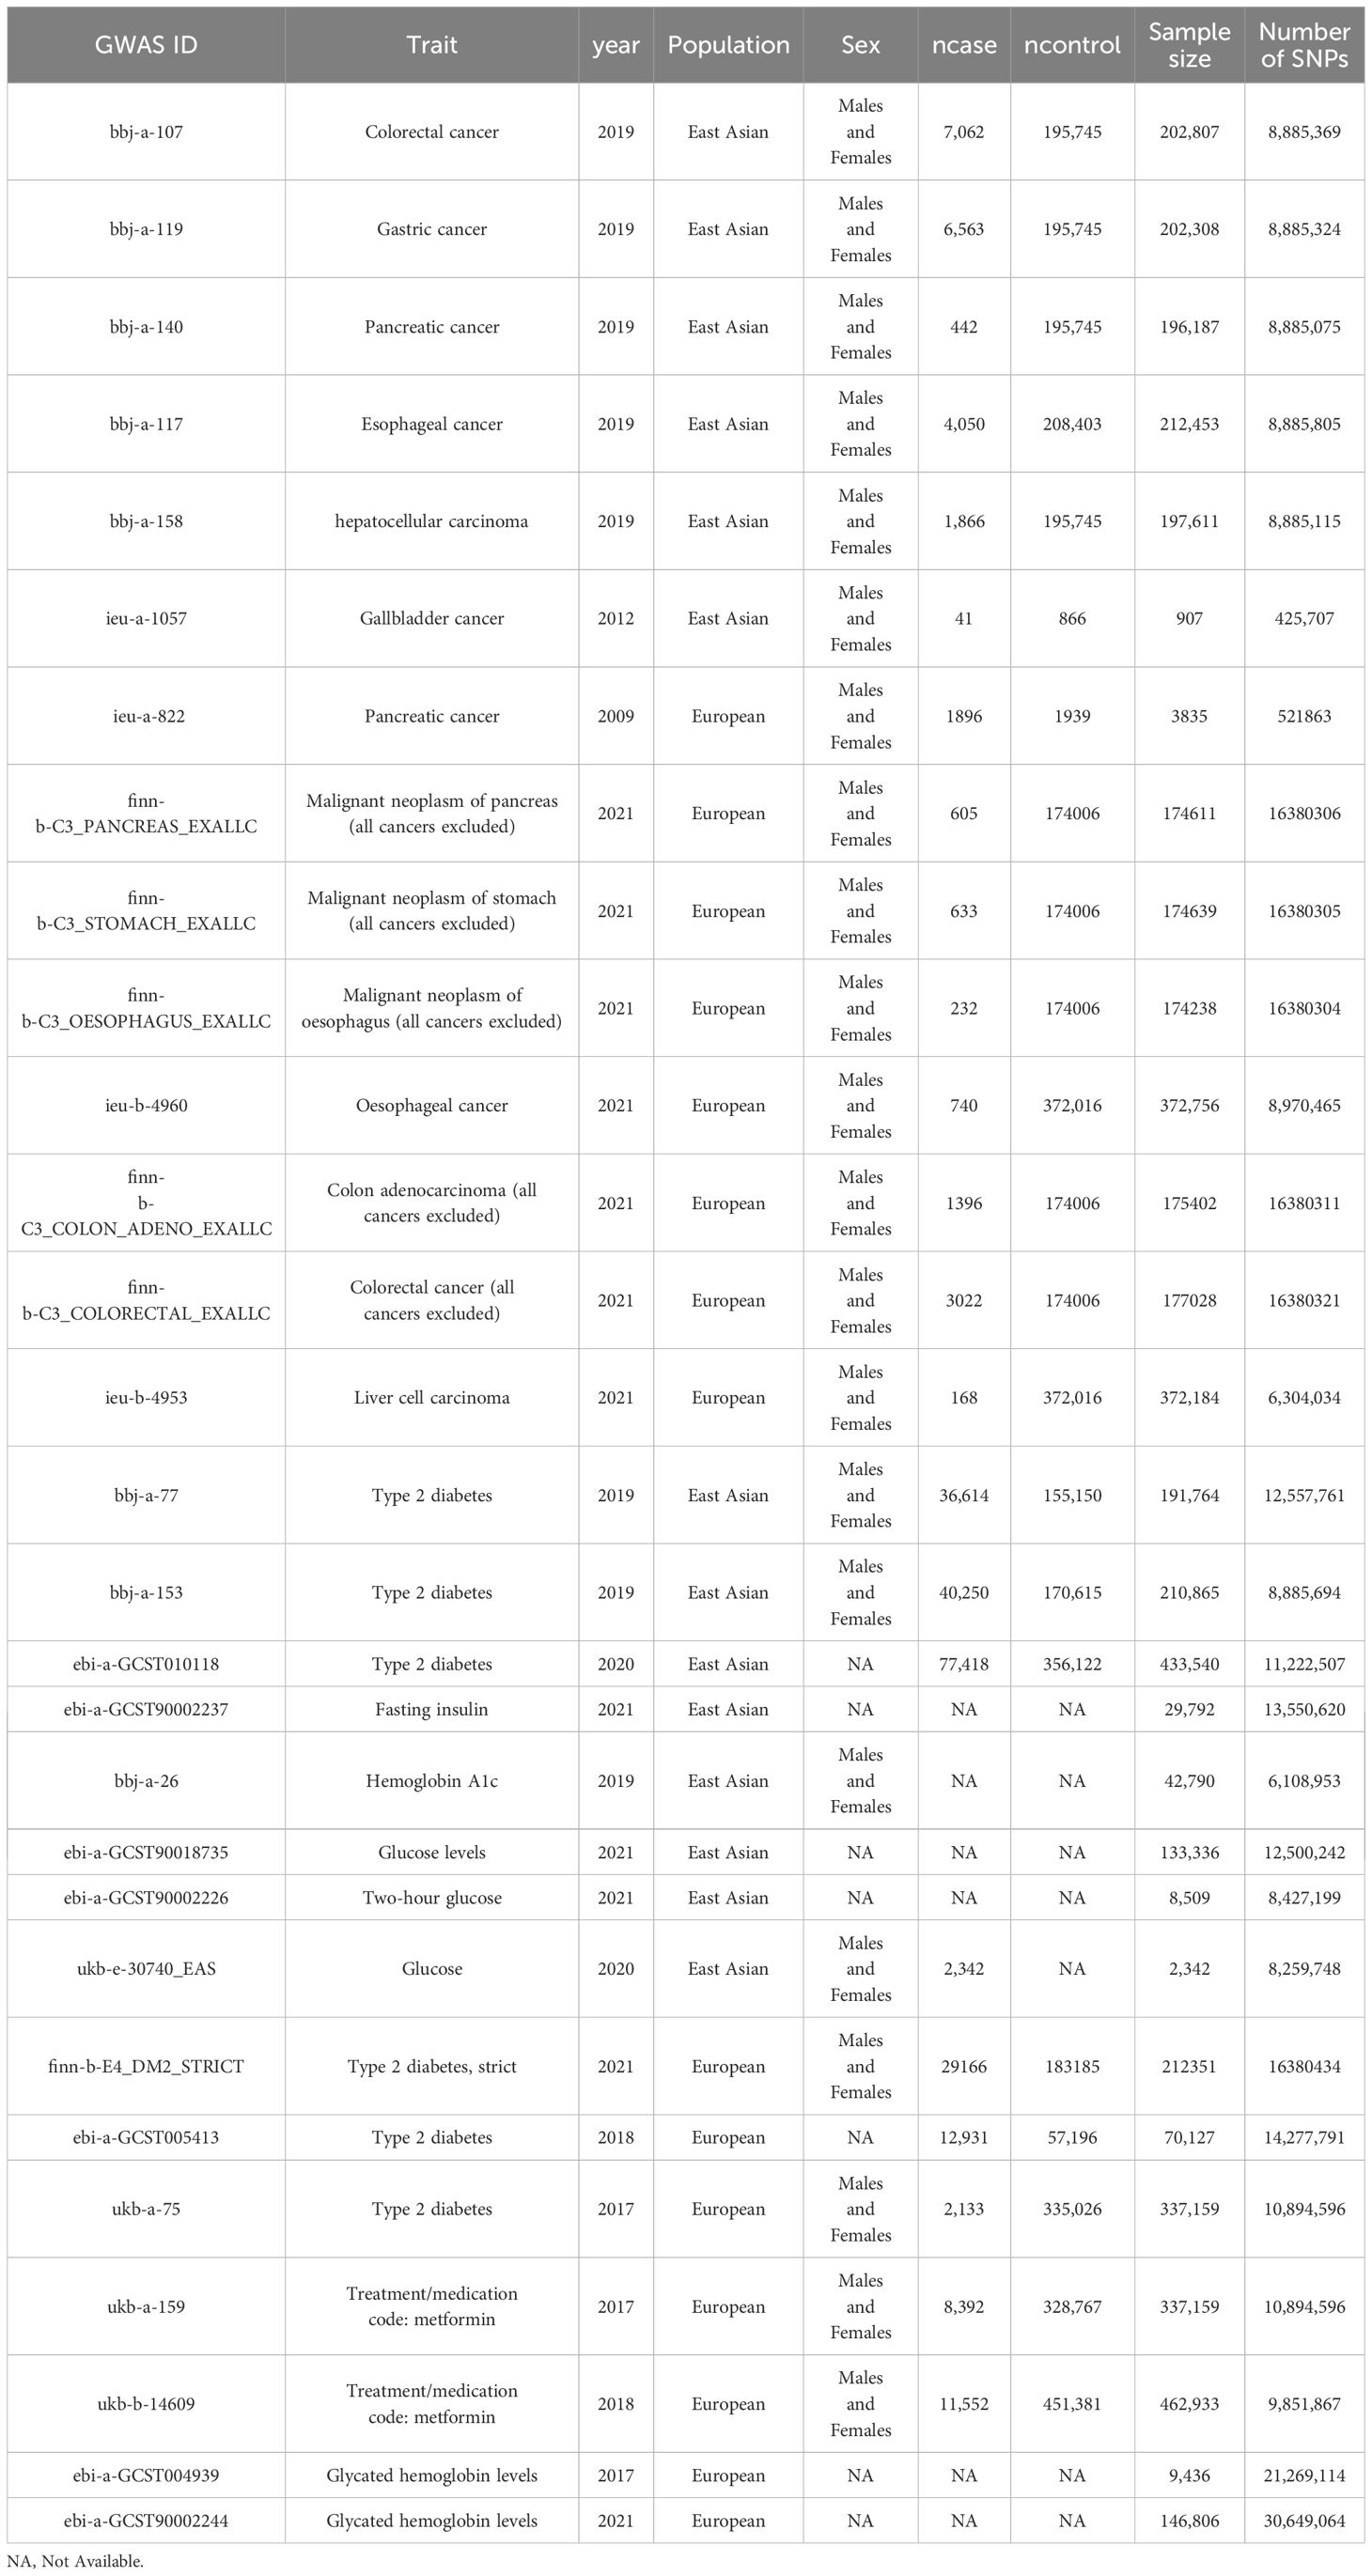
Table 1 Data characteristics of all included GWAS studies.
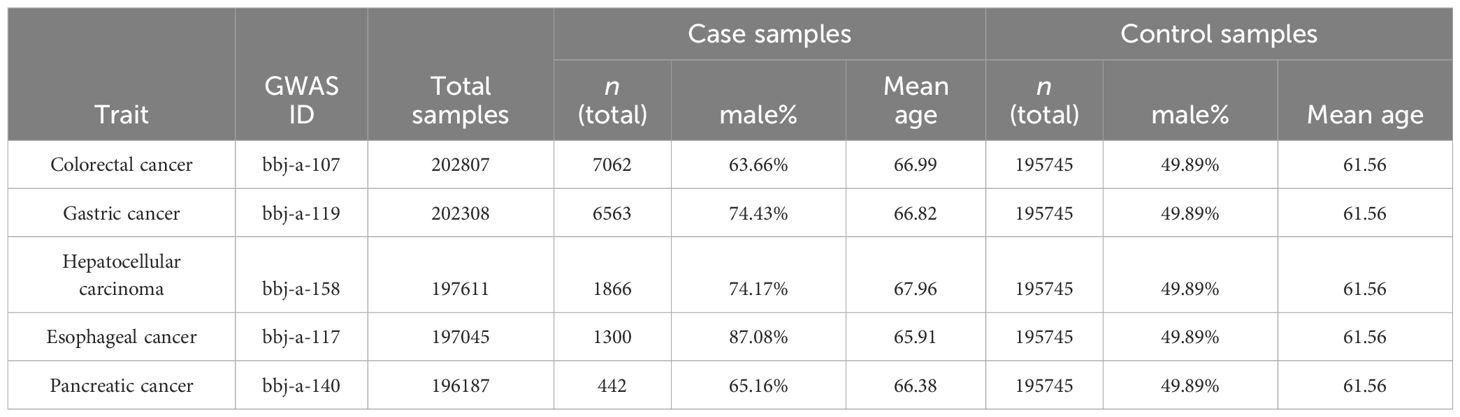
Table 2 Summary Demographic Data of the GWAS of 5 Cancers.
Instrumental variables selection
Single-nucleotide polymorphisms (SNPs) related to T2DM, Hemoglobin A1c, Fasting insulin, Blood sugar, Fasting glucose, and Two-hour glucose were selected as instrumental variables from IEU OpenGWAS project (mrcieu.ac.uk). The process of instrumental variable selection process in this study involves the following steps: (1) The SNPs were considered as strongly correlated with the exposure factor if P< 5×10⁸, and if no SNPs could be screened with this threshold, SNPs were considered as strongly correlated with the exposure factor if P< 5×10⁶. The F-statistics (15) were calculated using Equation 1, in which N represents the sample size of the GWAS analysis, k the number of instrumental variables, R2 (16) the extent to which instrumental variables explain the exposure factor, which was calculated using Equation 2, and F was set >10 to avoid weak instrumental variable bias. Maf, β and SE represents the minor allele frequency, the effect value of the SNP on the exposure factor and the standard error of β, respectively. (2) to avoid linkage disequilibrium (LD) caused by exposure-related SNPs, SNPs with linkage disequilibrium (LD) (R2 > 0.001, clump distance< 10000kb, P< 5×10⁸) were removed.
Statistical analysis
Software and R packages
In this study, mendelian randomization was conducted using the R software (version 4.2.2), the CRAN packages of TwoSampleMR (version 0.5.7) and MRPRESSO (version 1.0) for analysis. The study employed a two-tailed test with a significance level of α=0.05.
The statistical methods of TSMR
To quantify the strength of the association between exposure and outcome, inverse variance weighting (IVW), MR Egger, weighted median (WM), simple model and weighted model analyses were conducted, among which IVW analysis was used as the main result. If heterogeneity was detected by Cochran’s Q test, the IVW (multiplicative random effects) method was used. To distinguish causal effects from reverse causality, the MR Steiger directionality test (17) was used, and the result of “TRUE” means that the predicting association was in the expected orientation.
Multivariable MR (MVMR) to assess the direct causal effect
Previous studies have provided evidence that chronic hepatitis C infection and cirrhosis are 2 potential confounders influencing the incidence risk of hepatocellular carcinoma (18–21). Therefore, further summary results and additional IVs of these 2 confounders were extracted to perform an IVW-based MVMR to confirm the direct effect of T2DM with controlling for the effect of chronic hepatitis C infection and cirrhosis, respectively.
Sensitivity analysis
The heterogeneity of SNP effect sizes was evaluated by Cochran’s Q test, where P<0.05 indicates the presence of heterogeneity. The IVW random-effect model was used when P<0.05. The leave-one-out method was employed to assess the impact of each SNP on the results, checking if the results were robust. MR-Egger and MR Pleiotropy RESidual Sum and Outlier (MR-PRESSO) tests were used to test horizontal pleiotropy and outliers. The Egger-intercept method was used for pleiotropy test, which could estimate whether instrumental variables affect outcome through other paths than exposure. The intercept from the MR-Egger analysis can be interpreted as the average pleiotropic effect of a genetic variant included in the analysis (22, 23). There is no horizontal gene multiplicity in genetic variation if the intercept value is close to zero. The MR-PRESSO global test evaluates overall horizontal pleiotropy amongst all IVs in a single MR test by comparing the observed distance of all the variants to the regression line (residual sum of squares) to the expected distance under the null hypothesis of no horizontal pleiotropy (24). The MR-PRESSO test comprises three parts: (1) the MR-PRESSO global test detects directional horizontal pleiotropy, (2) the outlier-corrected causal estimate corrects the detected directional horizontal pleiotropy, and (3) the MR-PRESSO distortion test estimates whether the causal estimates differ significantly (P< 0.05) after adjustment for the outliers (24).
Meta-analysis of MR results
When there were multiple data sources for the same exposure and outcome factors, meta-analysis was conducted to summarize the results. The exposure and outcome data ID, outcome type, population ethnicity, number of instrumental variables, MR analysis method, OR value, P value and 95% confidence interval (CI) of each MR results were summarized as meta-analysis data. The R (version 4.2.2) meta package was used for meta-analysis. Heterogeneity analysis of included studies was evaluated using the Chi2 test, the heterogeneity among studies was low if P≥0.1 and I2 ≤ 50%, in such cases a fixed-effect model was used, otherwise, a random-effects model was used. The publication bias of the included studies was evaluated using the funnel plot method. All included indicators were subjected to two-tailed tests. The difference was considered statistically significant if P<0.05.
Results
Validity of the instrumental variables
To investigate the causal effects of T2DM on digestive system tumors, SNPs associated with T2DM-related exposures were identified and F-statistics were calculated. Inclusion criteria were explained in the methods section. The number of included SNPs for each data set and exposure is shown in Table 3. The F-statistic of each SNP was > 10, which indicated that no weak instrument bias existed (Supplementary Tables 1–4).
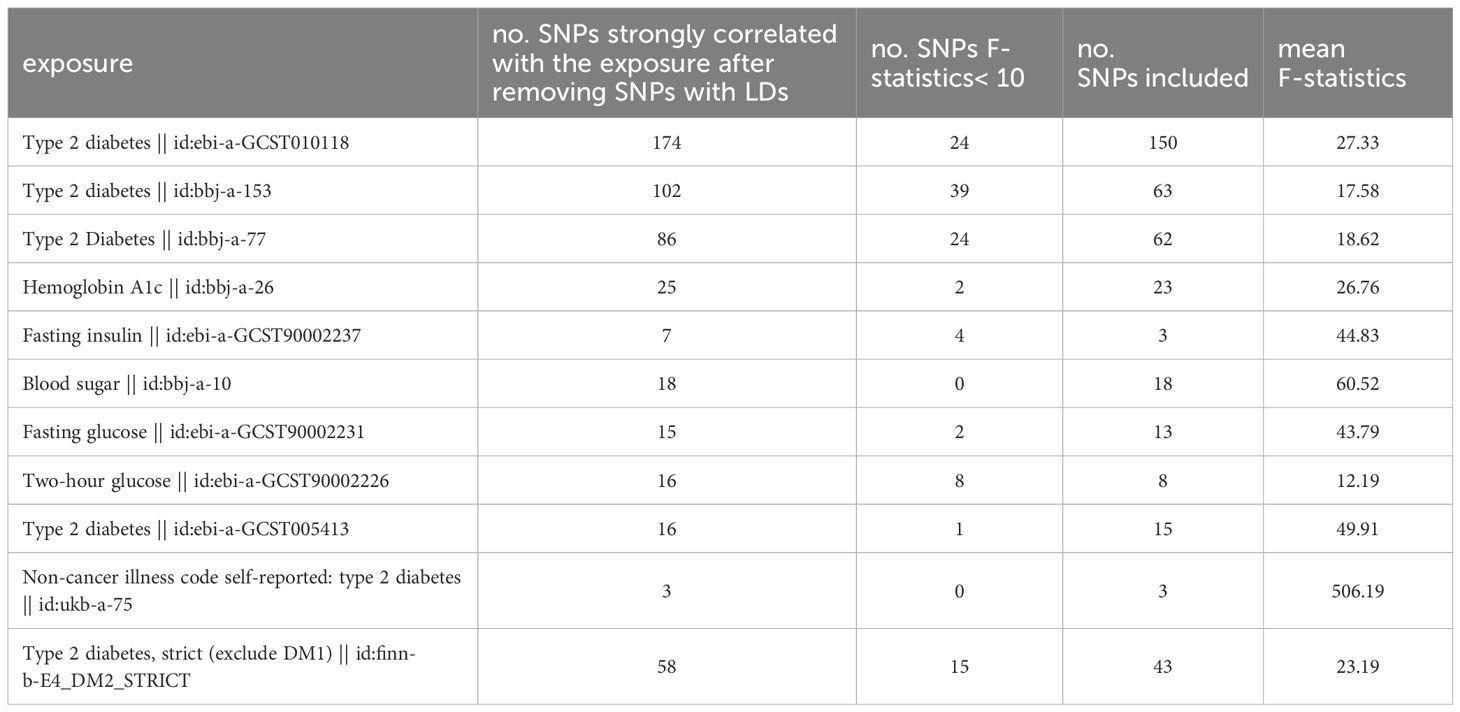
Table 3 The number of included SNPs of the instrumental variables.
The causal relationship between T2DM and digestive system tumors
The results of the MR analysis on the causal relationship between T2DM and various digestive system tumors are shown in Table 4. Through meta-analysis of the MR results of the same outcomes, we found a causal relationship between T2DM with esophageal cancer, gastric cancer, colorectal cancer and hepatocellular carcinoma (Figure 1). However, there were differences among different ethnicities and outcomes. In East Asian population, T2DM was found to decrease the risk of esophageal cancer (OR=0.77, 95% CI: 0.71 to 0.83, P<0.001, Figure 2A), gastric cancer (OR=0.87, 95% CI: 0.84 to 0.90, P<0.001, Figure 2B), colorectal cancer (OR=0.88, 95% CI: 0.85 to 0.91, P<0.001, Figure 2C) and hepatocellular carcinoma (OR=0.92, 95% CI: 0.86 to 0.97, P=0.005, Figure 2D), however, T2DM was found to increase the risk of pancreatic cancer (OR=1.92, 95% CI: 1.47 to 2.50, P<0.001, Figure 2E). Whereas, in European population, no significant causal relationship was observed for the colorectal cancer or pancreatic cancer (Supplementary Figure 1, Supplementary Table 5). Using MR Steiger directionality test, no reverse association between T2DM and digestive system tumors was observed (Supplementary Table 6).
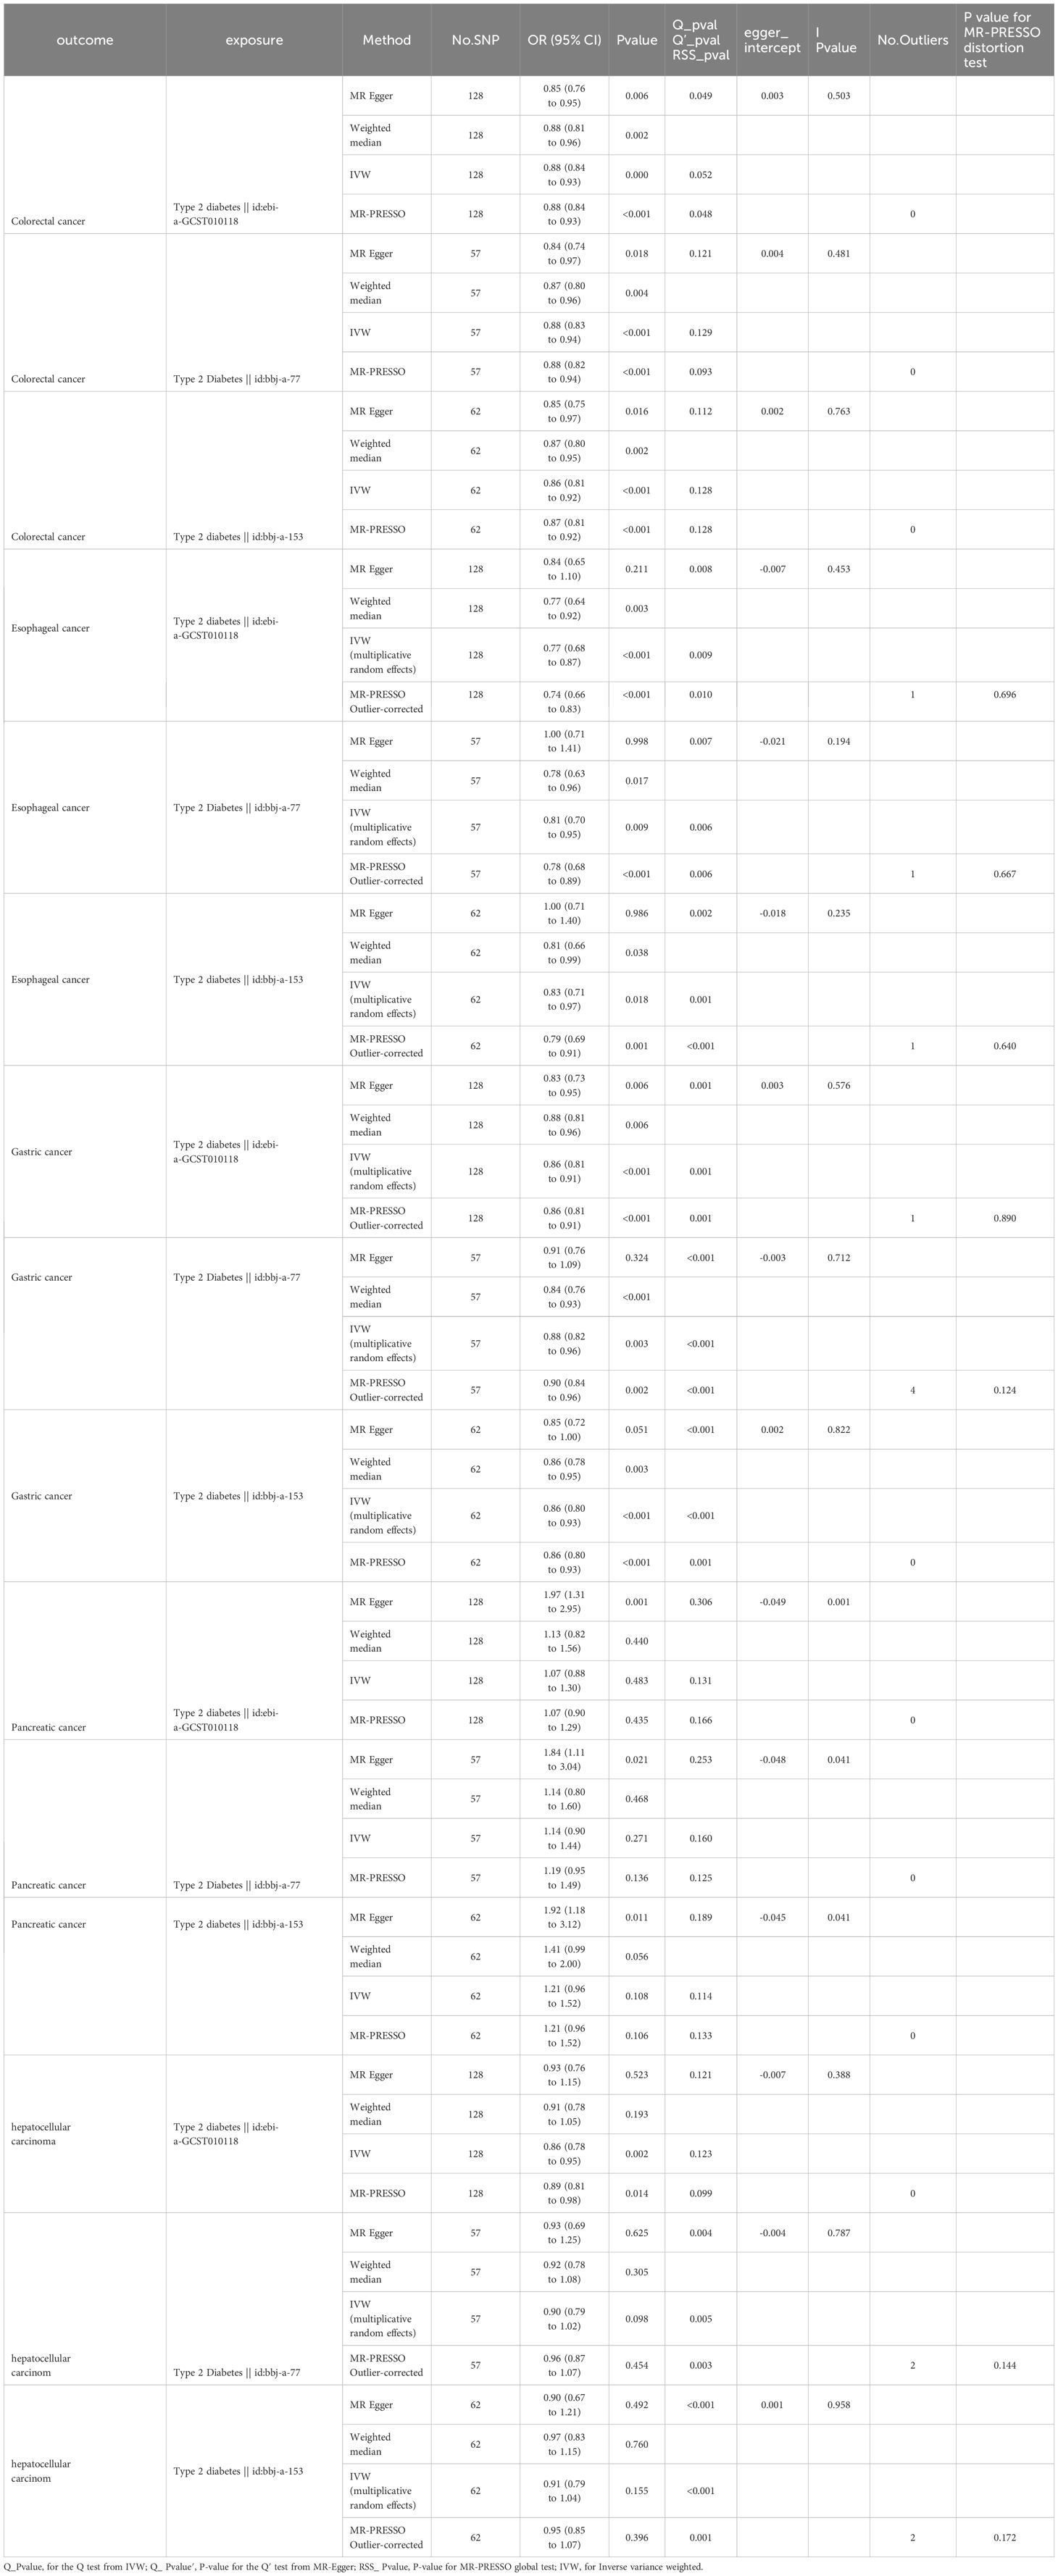
Table 4 Results of MR analysis of the causal effect of T2DM on digestive system tumors.
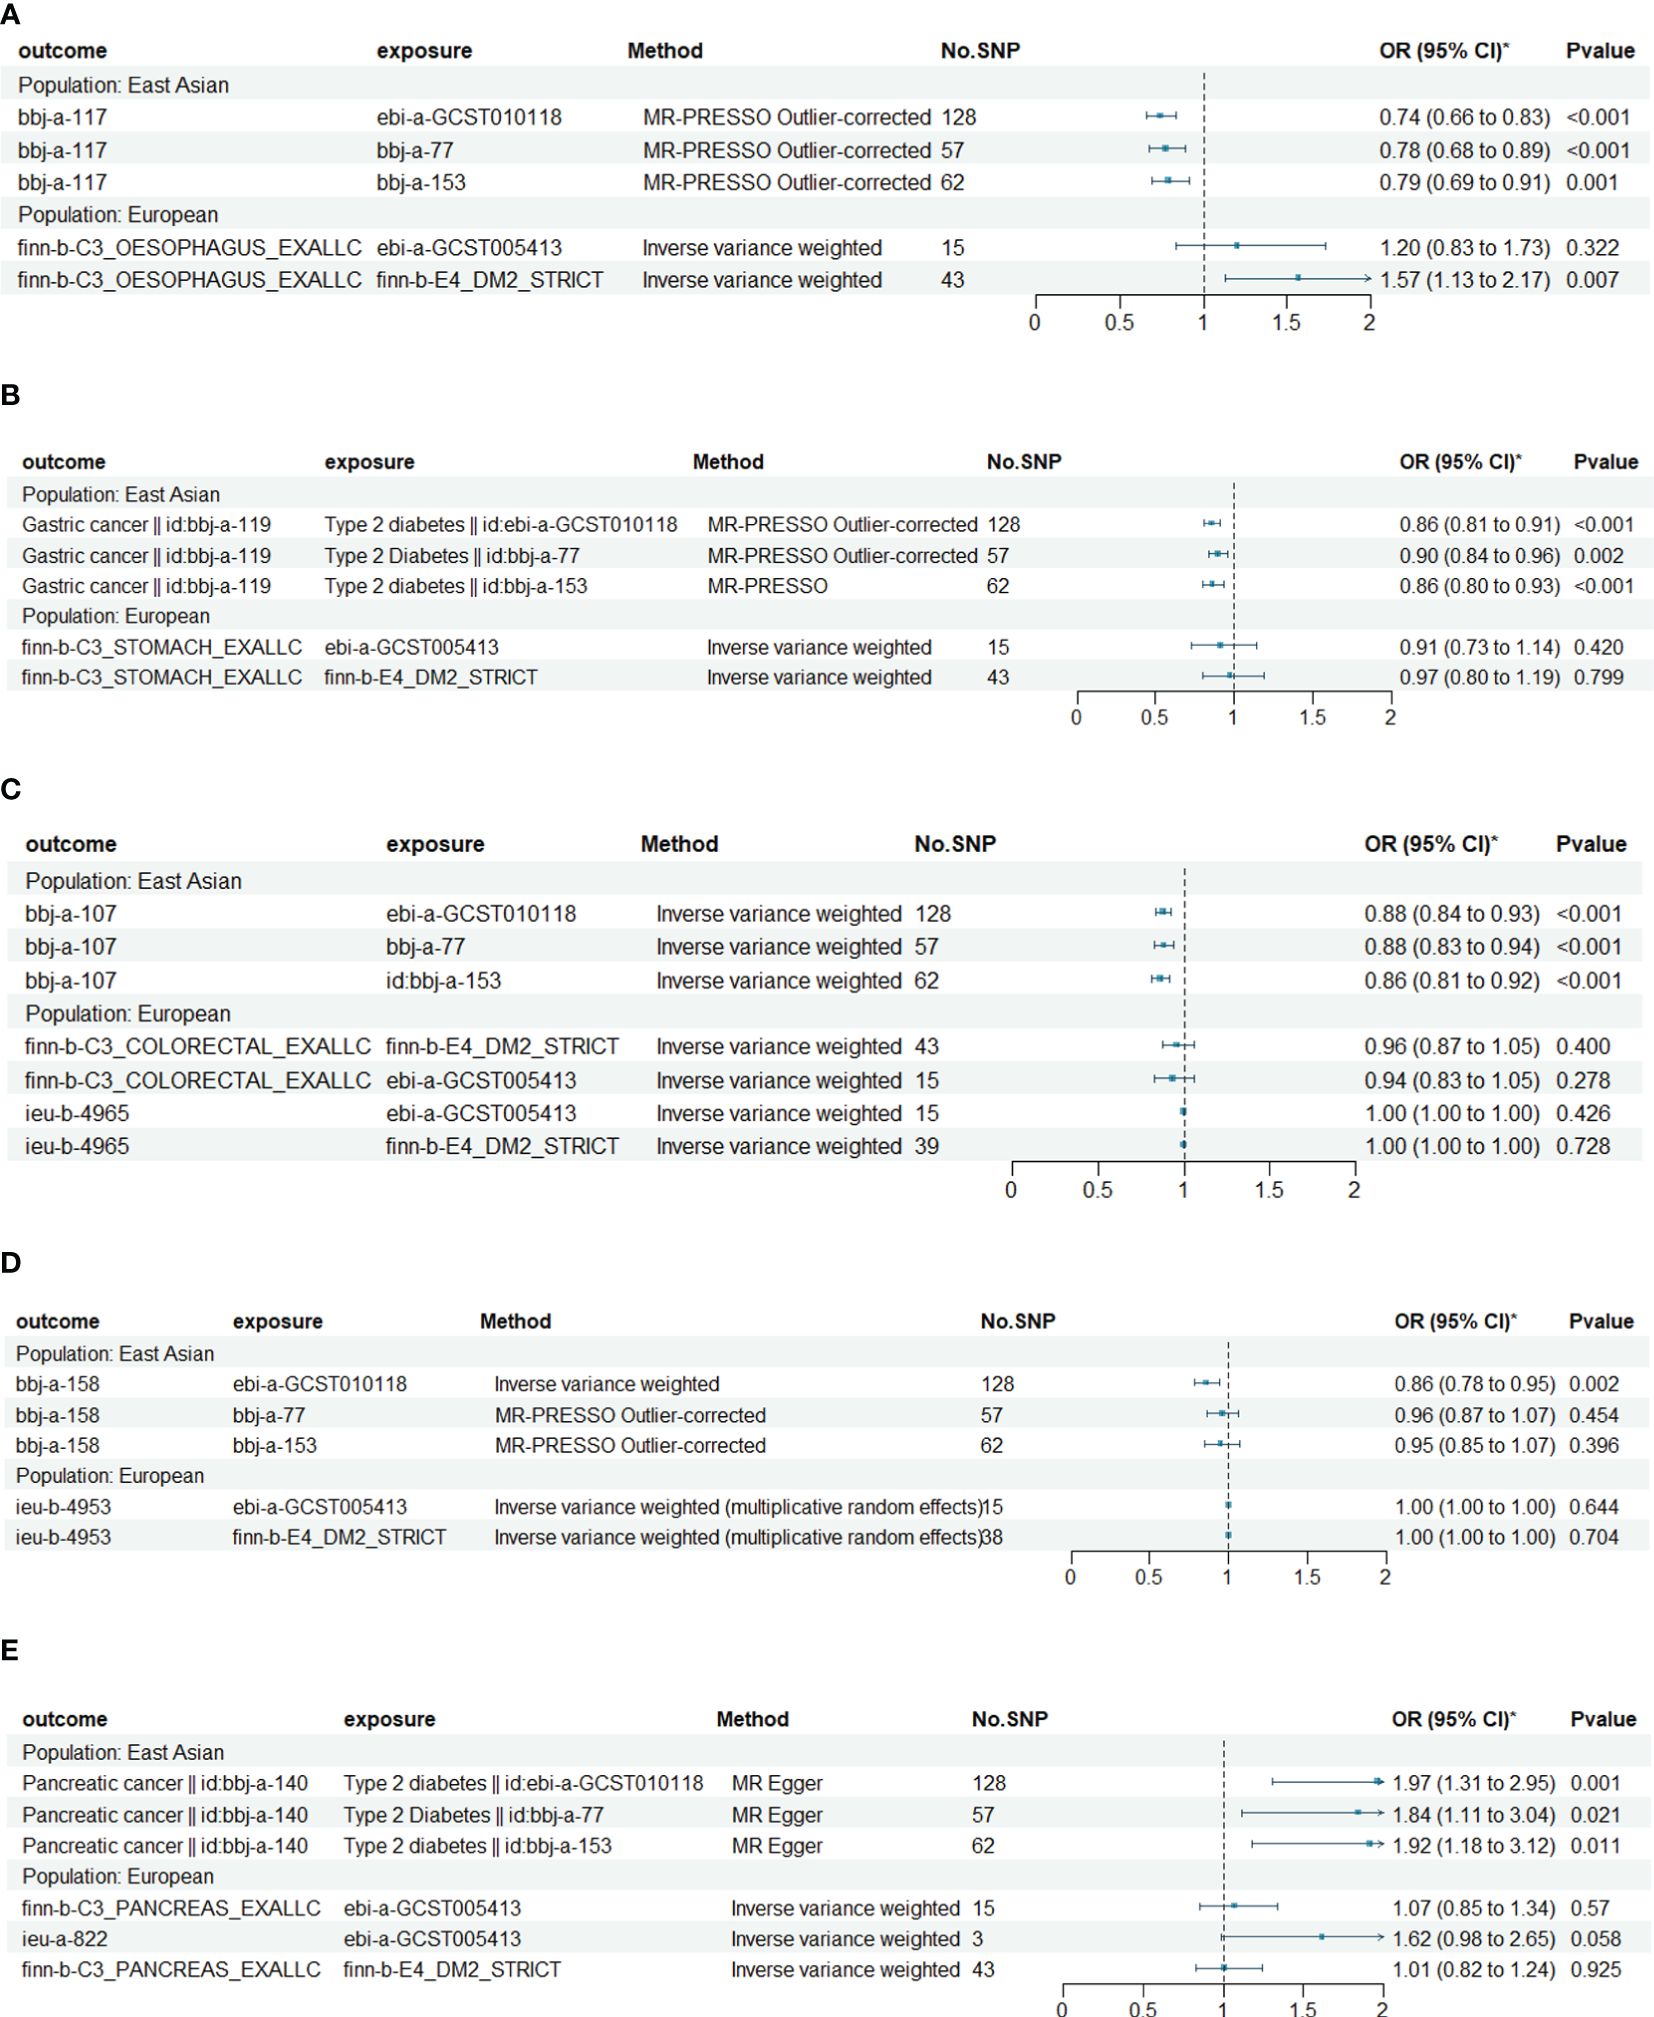
Figure 1 Causal relationships between T2DM and esophageal cancer, gastric cancer, colorectal cancer, hepatocellular carcinoma and pancreatic cancer in East Asian and European. (A) The Mendelian randomization (MR) effects of T2DM on esophageal cancer in European (estimated by IVW method) and East Asian populations (estimated by MR-PRESS method). (B) The MR effects of T2DM on gastric cancer in European (estimated by IVW method) and East Asian populations (estimated by MR-PRESS method). (C) The MR effects of T2DM on colorectal cancer in European and East Asian populations (estimated by IVW method). (D) The MR effects of T2DM on hepatocellular carcinoma in European and East Asian populations (estimated by IVW method). (E) The MR effects of T2DM on pancreatic cancer in European (estimated by IVW method) and East Asian populations (estimated by MR Egger method).
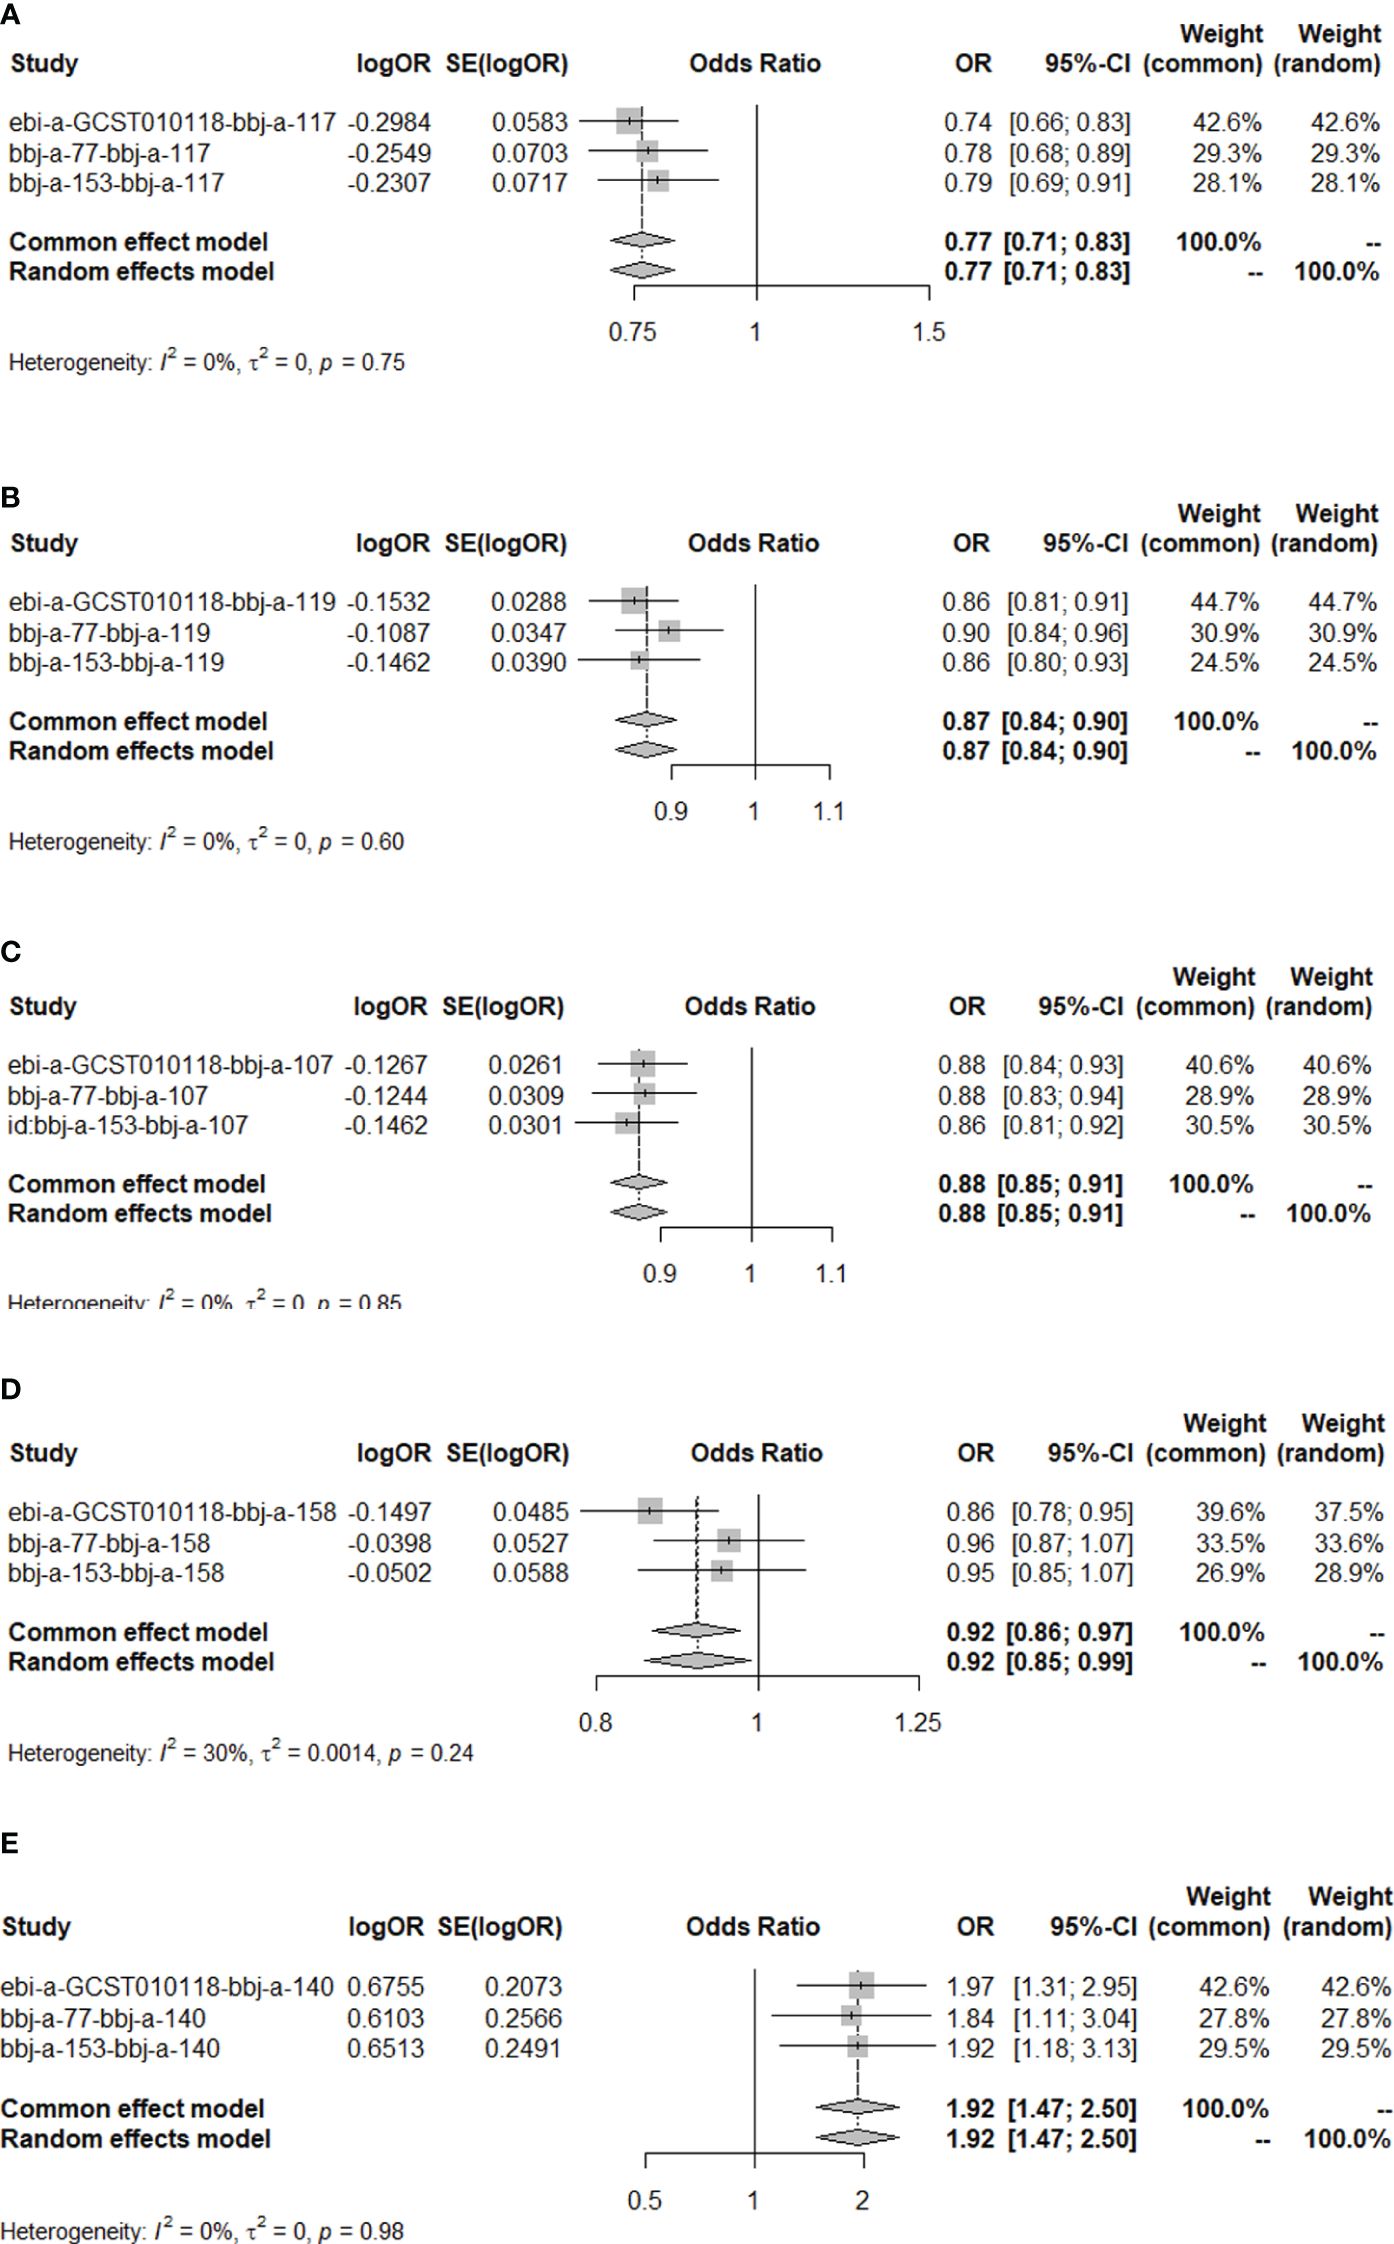
Figure 2 The MR results of T2DM on esophageal cancer, gastric cancer, colorectal cancer, hepatocellular carcinoma and pancreatic cancer in East Asian population. (A) Meta-analysis of the MR effects of T2DM on esophageal cancer in East Asian population (estimated by MR-PRESS method). (B) Meta-analysis of the MR effects of T2DM on gastric cancer in East Asian population (estimated by MR-PRESS method). (C) Meta-analysis of the MR effects of T2DM on colorectal cancer in East Asian population (estimated by IVW method). (D) Meta-analysis of the MR effects of T2DM on hepatocellular carcinoma in East Asian population (estimated by IVW method). (E) Meta-analysis of the MR effects of T2DM on pancreatic cancer in East Asian population (estimated by MR Egger method).
Considering chronic hepatitis C infection and cirrhosis could affect T2DM and play an important role in the pathogenesis of hepatocellular carcinoma, we conducted an MVMR to estimate a direct effect of T2DM on hepatocellular carcinoma accounting for their confounding effects. After adjusting for chronic hepatitis C infection (OR: 0.99, 95% CI: 0.89 to 1.09, P = 0.783) and cirrhosis (OR: 0.95, 95% CI: 0.88 to 1.04, P = 0.296), the effect of T2DM on hepatocellular carcinoma was not significant (Supplementary Figure 2, Supplementary Table 7).
Smoking, alcohol consumption, obesity, physical activity and sedentary behavior are common modifiable risk factors for gastrointestinal cancers in East Asia (25), all of which affect insulin secretion and action, and are major risk factors of T2DM (26). Limited by data resource, we conducted an IVW-based MVMR to estimate a direct effect of T2DM on digestive system tumors accounting for the confounding effect from smoking status, BMI, and Alcohol intake frequency (Supplementary Table 8). For colorectal cancer (smoking status adjusted: OR: 0.89, 95% CI: 0.84 to 0.93, P< 0.001; BMI adjusted: OR: 0.90, 95% CI: 0.85 to 0.95, P< 0.001; Alcohol intake frequency adjusted: OR: 0.89, 95% CI: 0.84 to 0.94, P< 0.001), esophageal cancer (smoking status adjusted: OR: 0.78, 95% CI: 0.68 to 0.90, P< 0.001; BMI adjusted: OR: 0.79, 95% CI: 0.66 to 0.94, P< 0.001; Alcohol intake frequency adjusted: OR: 0.78, 95% CI: 0.67 to 0.90, P< 0.001), gastric cancer (smoking status adjusted: OR: 0.88, 95% CI: 0.82 to 0.93, P< 0.001; BMI adjusted: OR: 0.88, 95% CI: 0.82 to 0.95, P< 0.001; Alcohol intake frequency adjusted: OR: 0.87, 95% CI: 0.82 to 0.92, P< 0.001), and hepatocellular carcinoma (smoking status adjusted: OR: 0.89, 95% CI: 0.80 to 0.99, P = 0.025; BMI adjusted: OR: 0.89, 95% CI: 0.79 to 0.99, P = 0.026; Alcohol intake frequency adjusted: OR: 0.89, 95% CI: 0.80 to 0.90, P = 0.026) the results of MVMR remained consistent with our primary findings. For pancreatic cancer, MVMR failed to find a significant effect of T2DM after adjustment smoking status (OR: 1.17, 95% CI: 0.95 to 1.44, P = 0.133), BMI (OR: 1.16, 95% CI: 0.93 to 1.45, P = 0.177), and Alcohol intake frequency (OR: 1.20, 95% CI: 0.97 to 1.40, P = 0.086).
The causal relationship between T2DM and esophageal cancer in East Asian population is partially mediated by fasting insulin levels
To further explore the mechanism underlying the causal relationship between T2DM and digestive system tumors, we conducted a two-step MR study between T2DM, fasting insulin levels and fasting insulin levels and the aforementioned 5 types of tumors. Results are shown in Table 5. The results showed that T2DM decreased fasting insulin levels (OR = 0.97, 95% CI: 0.95 to 0.98, P< 0.001, Supplementary Figures 3A–C). Elevated fasting insulin levels increased the risk of esophageal cancer (OR = 10.35, 95% CI: 1.10 to 97.25, P = 0.041, Supplementary Figure 4), but no causal relationship was found with the other four types of tumors (Table 5).
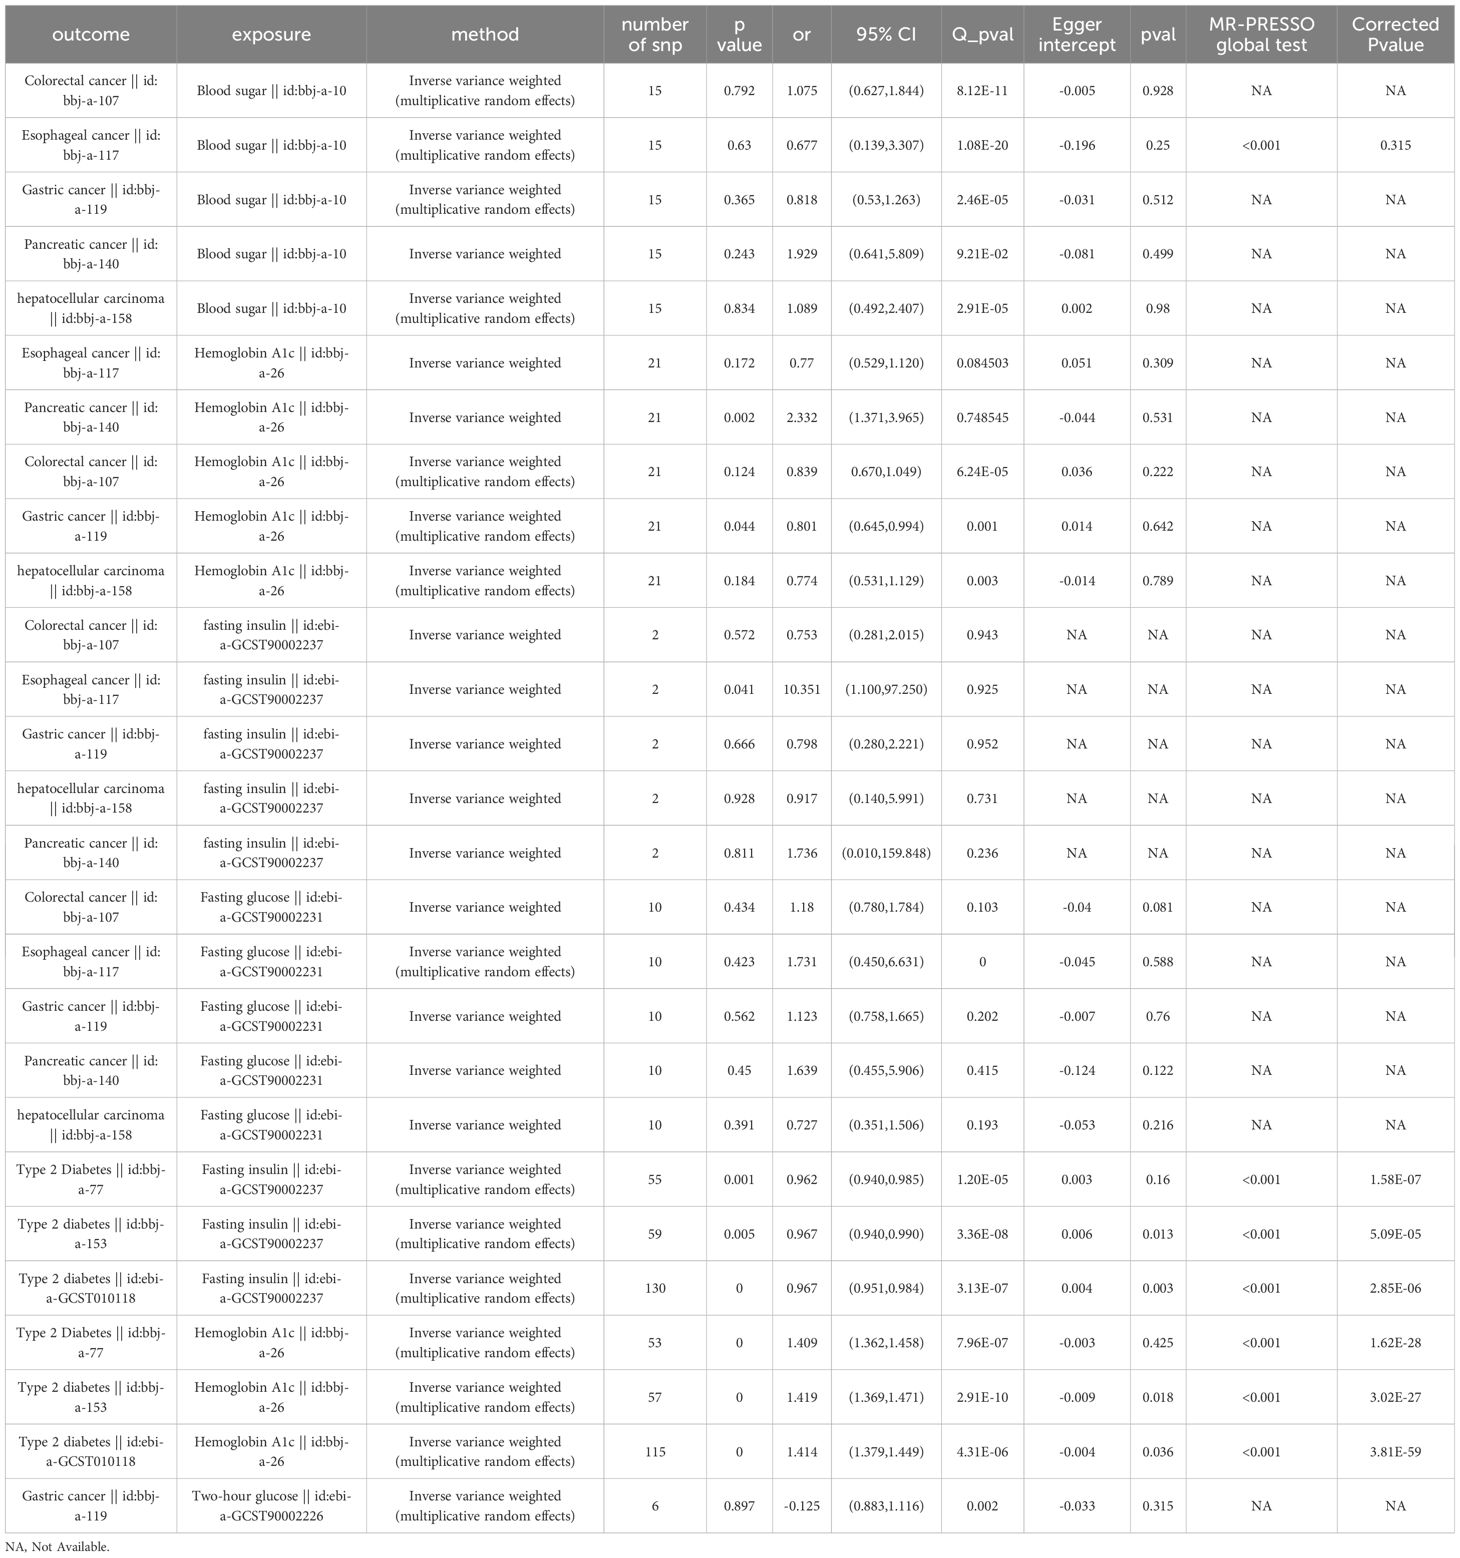
Table 5 Results of MR analysis of the causal effect of T2DM on blood sugar, fasting blood sugar, and glycated hemoglobin A1c (HbA1c) levels, and the latter three on the 5 types of digestive system tumors.
The causal relationship between T2DM and gastric cancer in the East Asian population is partially mediated by glycated hemoglobin A1c levels
Further, we conducted a two-step MR study between T2DM with blood sugar, fasting blood sugar and glycated hemoglobin A1c (HbA1c) levels, and the latter three with the aforementioned 5 types of tumors. Results were shown in Table 5. The results showed that T2DM increased the levels of HbA1c (OR=1.41, 95% CI: 1.39 to 1.44, P<0.001, Supplementary Figure 5) and an increase in the levels of HbA1c could reduce the risk of gastric cancer (OR=0.80, 95% CI: 0.65 to 0.99, P=0.044, Supplementary Figures 3D–G). However, no causal relationship was found between blood sugar and fasting blood sugar with gastric cancer (Table 5). It should be noted that heterogeneity existed for the MR analysis between HbA1c and gastric cancer as P<0.05 by Cochran’s Q test. However, the leave-one-out method confirmed the robustness of the result (P=0.044, Supplementary Figure 3G).
The causal relationship between T2DM and pancreatic cancer in East Asian population is partially mediated by the HbA1c levels
Our results showed that elevated HbA1c levels increased the risk of pancreatic cancer (OR=2.33, 95% CI: 1.37 to 3.97, P=0.002, Supplementary Figures 3H–K), but no causal relationship was found between blood glucose and fasting blood glucose with pancreatic cancer (Table 5). Considering that T2DM increases HbA1c levels (OR=1.41, P<0.001, Supplementary Figure 5) and T2DM has a significant direct causal relationship with pancreatic cancer (OR=1.92, 95% CI: 1.47 to 2.50, P<0.001, Figure 2E), the causal relationship between T2DM and pancreatic cancer is partially mediated by HbA1c levels.
In the sensitivity analyses, the three MR-PRESSO global tests failed to detect any horizontal pleiotropy (p = 0.166, 0.125, 0.133, with instruments of exposure from ebi-a-GCST010118, bbj-a-77,bbj-a-153, respectively) or outliers, while all three TSMR analyses using the MR Egger method with pancreatic cancer as the outcome have detected significant Egger intercepts (-0.049, -0.048, -0.045; p = 0.001, 0.041, 0.041, respectively), indicating some evidence of pleiotropy and the pleiotropy not deriving from individual outliers. Therefore, MR-Egger could be more suitable for detecting and correcting for the bias due to directional pleiotropy. However, causal estimates from the MR-Egger method may be biased and have inflated Type 1 error rates in practice (23).
Discussion
We analyzed a series of phenotypic GWAS data through Mendelian randomization method, and the results showed that T2DM had a significant causal effect on esophageal cancer, colorectal cancer and hepatocellular carcinoma, and a discrepancy existed between European and East Asian populations. In the East Asian population, T2DM has a significant causal effect on esophageal cancer, gastric cancer, colorectal cancer and hepatocellular carcinoma, and the causal relationships between T2DM with esophageal cancer and gastric cancer are partly mediated by fasting insulin and Hb1Ac levels, respectively. Direct causal relationship between T2DM and pancreatic cancer was confirmed, and meanwhile, two-step MR suggests that T2DM increases the risk of pancreatic cancer by increasing Hb1Ac levels.
The association between T2DM and hepatocellular carcinoma
The findings of a study in 2020 confirmed that patients with T2DM carry a higher risk of developing hepatocellular carcinoma (HCC), but the risk may depend on the underlying liver disease etiology (21). When compared with nondiabetics, the strongest correlation was seen among patients with non-alcoholic steatohepatitis (NASH), and the increased risk was confirmed after adjusting for other known risk factors for HCC. Diabetics with NASH, cryptogenic cirrhosis, HCV, and alcoholic liver disease showed a higher risk of HCC than nondiabetics, whereas T2DM did not increase the risk of HCC among patients with HBV or primary biliary cholangitis (PBC) (21). Previous studies have provided evidence that chronic HCV infection may induce insulin resistance (18) and sustained virological response (SVR) reduces the risk of impaired fasting glucose (IFG) and/or T2DM development in patients with chronic HCV (19, 20). Therefore, chronic HCV infection and cirrhosis are 2 potential confounders influencing the incidence risk of HCC. However, we failed to figure out the prevalence of chronic liver disease in the cohorts of HCC (27). We performed an IVW-based MVMR to confirm the direct effect of T2DM on HCC after adjusting for chronic HCV infection and cirrhosis, respectively. After adjusting for chronic HCV infection (OR: 0.99, 95% CI: 0.89 to 1.09, P = 0.783) and cirrhosis (OR: 0.95, 95% CI: 0.88 to 1.04, P = 0.296), the effect of T2DM on HCC was not significant (Supplementary Figure 2, Supplementary Table 7).
The association between T2DM with gastric and colorectal cancer
Our study found a significant causal relationship between T2DM and a reduced incidence of esophageal cancer, gastric cancer and colorectal cancer in East Asian population. However, previous observational cohort studies have suggested an increased risk of cancer associated with diabetes. Tsilidis et al. summarized data from observational studies on the incidence and mortality of cancers in individuals with T2DM and found an increased risk of several cancers, including hepatocellular carcinoma, pancreatic cancer and gastrointestinal cancer, was associated with T2DM (3). A meta-analysis by Noto et al. found an increased incidence of all cancer types associated with diabetes, with significantly higher cancer incidence in Asian male compared to non-Asian male (28). Prospective cohort studies in Japan showed that an increased risk of colorectal, liver and pancreatic cancer was associated with diabetes (4). A cohort study based on the United Kingdom (UK) Clinical Practice Research Datalink (CPRD) (1988–2012) found an increased incidence of liver, colorectal and pancreatic cancer in patients with diabetes compared to those without (5).
The potential mechanisms underlying the link between T2DM and cancer include hyperglycemia, insulin resistance, high insulin levels and increased insulin-like growth factor I (IGF-1) levels, etc (29). Smoking, male gender and low-density lipoprotein cholesterol (LDL-C)<100mg/dl were found to be risk factors for diabetic patients to develop cancer, while body mass index (BMI), alcohol consumption and HbA1C levels were not associated with cancer occurrence in diabetic population (30). A prospective case-control study in Korea showed that higher blood glucose levels, lower high-density lipoprotein cholesterol (HDL-C) and homeostasis model assessment of insulin resistance (HOMA-IR) levels were associated with the risk of early stage gastric cancer (31). A study in Sweden found that high blood glucose levels were associated with male colon cancer risk (32). In contrast, we found that HbA1C levels were inversely associated with gastric cancer risk in East Asian population. Although HbA1c levels are associated with the glycemic control status of diabetic patients, we were unable to determine the causal relationship between blood sugar levels (including overall blood sugar levels, fasting blood sugar levels and 2-hour blood sugar levels) and gastric cancer. Some studies have shown a negative correlation between gastric mucosal innervation density (MID) with fasting blood sugar levels and glycated hemoglobin levels (33), besides, vagotomy inhibits gastric cancer development by inhibiting tumor cell proliferation through suppressing WNT signaling pathway (34, 35), which may help explain our results.
The association between T2DM and esophageal cancer
Our research suggests that in the European population, individuals at high risk of T2DM are at increased risk for esophageal cancer, whereas in the East Asian population, individuals at high risk of T2DM may have a lower risk for esophageal cancer. This protective effect is partially related to the decrease in fasting insulin levels caused by T2DM. Previous studies have shown conflicting results regarding the effect of T2DM on the incidence of esophageal cancer. Mendelian randomization analysis mainly based on European populations showed that the genetic susceptibility of T2DM is negatively associated with the incidence of esophageal cancer (36).
A cohort study based on the UK CPRD (1988–2012) found that the incidence of esophageal cancer was lower in diabetic patients than that in non-diabetic patients (5). Squamous cell carcinoma is the most common histological type of esophageal cancer worldwide, including in China, however, adenocarcinoma is the dominant histological type of esophageal cancer in European and American populations (37). A meta-analysis found a significant correlation between T2DM and esophageal cancer in European and American subjects, while no correlation was found in Asian subjects (38). Another meta-analysis based on American population found a significant correlation between T2DM and the risk of esophageal adenocarcinoma (EADC) (39).
Research from Finland showed that high levels of fasting blood glucose and fasting insulin were associated with an increased risk of liver cancer (40), colorectal cancer (41), pancreatic cancer (42) and colon adenoma (41) in certain populations. A meta-analysis in 2015 showed a significant correlation between high insulin levels and colon adenoma, but the correlation was weak in Asian populations (43). A Mendelian randomization study based on European GWAS data found that fasting insulin levels, rather than high blood glucose, was causally related to the risk of colon cancer (44). Currently, research on the relationship between fasting insulin levels and the risk of esophageal cancer is lacking. Our research found that high fasting insulin levels increased the risk of esophageal cancer, but there was no significant causal relationship between fasting insulin levels and the risks of liver, gastric, colorectal or pancreatic cancer. The characteristics of diabetes in the East Asian population differ from those in the European and American populations. The East Asian population has a lower average BMI, a greater tendency towards body fat and visceral fat, and a younger age of onset and mainly presents with insulin resistance and early-stage beta cell dysfunction (1). The earlier onset and lower levels of fasting insulin levels in the East Asian population (1) may be the reasons for the protective effect of T2DM against esophageal cancer.
The association between T2DM and pancreatic cancer
Previous observational studies showed that T2DM was associated with pancreatic cancer (3–5, 28). We have validated this relationship through TSMR, and what’s more, we found that T2DM may cause elevated HbA1c levels in the East Asian population and high HbA1c levels increased the risk of pancreatic cancer. The meta-analysis conducted by Hope et al. showed that elevated HbA1c levels were associated with an increased risk of colorectal and pancreatic cancer, but not with gastrointestinal malignancies (45). Studies of the British population showed that elevated HbA1c levels were associated with an increased risk of colon, liver, esophageal and pancreatic cancer (46). Results of our study are consistent with these observational studies.
Limitations
This study included four phenotypes of T2DM and its manifestations, as well as five types of digestive system cancers. We conducted a meta-analysis of multiple GWAS datasets for the same phenotype. The main advantage of a TSMR study design is reducing the impacts of confounding factors and reverse causality. However, our study still has certain limitations: currently, there are few instrumental variables for digestive system cancers in East Asian populations. Our GWAS datasets source for digestive system cancers in East Asian populations mainly rely on a single study (27), thus requiring more data sources to confirm our results. In addition, the numbers of SNPs instruments in several analyses were small, and sensitivity analyses could not be performed for three MR analyses, which may have affected the reliability of the results. Third, East Asian regions have a higher prevalence of Helicobacter pylori, liver fluke, and HBV and HCV infections, hot beverage consumption and biliary cyst development, which might have increased the risk of gastrointestinal cancers (25). Instrumental variables may only account for a small portion of the observed variability, and further research is needed to fully understand the complex changes in the gastrointestinal carcinogenesis. Fourth, though MR-PRESSO global test in all three TSMR analyses with pancreatic cancer as the outcome were insignificant, the results of MR Egger intercept test indicated some evidence of pleiotropy. And causal estimates from the MR-Egger method may be biased and have inflated Type 1 error rates in practice. Finally, since detailed baseline characteristics of study subjects (e.g. tumor markers, tumor stage, etc.) were not provided in the GWAS studies we used, we could not further investigate the effect of T2DM on different subgroups of the populations and also could not exclude the possibility that survivorship bias exists in our study.
Conclusion
Our findings suggest that T2DM can reduce the incidence of esophageal cancer, gastric cancer, colorectal cancer and hepatocellular carcinoma in East Asian population. The causal relationships between T2DM with esophageal cancer and gastric cancer are partially attributed to the reduction in fasting insulin levels and the elevation in glycated hemoglobin levels, respectively. T2DM indirectly increases the risk of pancreatic cancer by increasing glycated hemoglobin levels.
Data availability statement
The original contributions presented in the study are included in the article/Supplementary Material. Further inquiries can be directed to the corresponding authors.
Ethics statement
Ethical approval was not required for the study involving humans in accordance with the local legislation and institutional requirements. Written informed consent to participate in this study was not required from the participants or the participants’ legal guardians/next of kin in accordance with the national legislation and the institutional requirements.
Author contributions
NA: Conceptualization, Writing – original draft, Writing – review & editing. YZ: Investigation, Methodology, Visualization, Writing – original draft. ZS: Project administration, Validation, Writing – review & editing. ZX: Resources, Supervision, Writing – review & editing. XL: Project administration, Resources, Supervision, Writing – review & editing.
Funding
The author(s) declare that no financial support was received for the research, authorship, and/or publication of this article.
Conflict of interest
The authors declare that the research was conducted in the absence of any commercial or financial relationships that could be construed as a potential conflict of interest.
Publisher’s note
All claims expressed in this article are solely those of the authors and do not necessarily represent those of their affiliated organizations, or those of the publisher, the editors and the reviewers. Any product that may be evaluated in this article, or claim that may be made by its manufacturer, is not guaranteed or endorsed by the publisher.
Supplementary material
The Supplementary Material for this article can be found online at: https://www.frontiersin.org/articles/10.3389/fonc.2024.1327154/full#supplementary-material
Supplementary Figure 1 | The MR results of T2DM on colorectal cancer and pancreatic cancer in European population. (A) Meta-analysis of the MR effects of T2DM on colorectal cancer in European population (estimated by IVW method). (B) Meta-analysis of the MR effects of T2DM on pancreatic cancer in European population (estimated by IVW method).
Supplementary Figure 2 | The MR results of CHC, Cirrhosis, and T2DM on HCC in East Asian population.
Supplementary Figure 3 | The MR results of fasting insulin and Hb1Ac levels on esophageal, gastric and pancreatic cancer in East Asian population. (C) Scatter plot, forest plot and volcano plot of MR analysis of the relationship between fasting insulin levels and esophageal cancer, respectively. (D–G) Scatter plot, forest plot, volcano plot and leave-one-out plot of MR analysis of the relationship between Hb1Ac levels and gastric cancer, respectively. (H–K) Scatter plot, forest plot, volcano plot and leave-one-out plot of MR analysis of the relationship between Hb1Ac levels and pancreatic cancer, respectively.
Supplementary Figure 4 | The MR results of T2DM on fasting insulin levels in East Asian population. (A) Meta-analysis of the MR effects of T2DM on fasting insulin levels in East Asian population (estimated by IVW method). (B, C) Scatter plot and Leave-one-out plot of MR analysis of the relationship between T2DM and fasting insulin levels, with GWAS ID of bbj-a-77 as the instrumental variable for T2DM, respectively. (D, E) Scatter plot and Leave-one-out plot of MR analysis of the relationship between T2DM and fasting insulin levels, with GWAS ID of bbj-a-153 as the instrumental variable for T2DM, respectively. (F, G) Scatter plot and Leave-one-out plot of MR analysis of the relationship between T2DM and fasting insulin levels, with GWAS ID of ebi-a-GCST010118 as the instrumental variable for T2DM, respectively.
Supplementary Figure 5 | The MR results of T2DM on Hb1Ac levels in East Asian population. (A) Meta-analysis of the MR effects of T2DM on Hb1Ac levels in East Asian population (estimated by IVW method). (B, C) Scatter plot and Leave-one-out plot of MR analysis of the relationship between T2DM and Hb1Ac levels, with GWAS ID of bbj-a-77 as the instrumental variable for T2DM, respectively. (D, E) Scatter plot and Leave-one-out plot of MR analysis of the relationship between T2DM and Hb1Ac levels, with GWAS ID of bbj-a-153 as the instrumental variable for T2DM, respectively. (F, G) Scatter plot and Leave-one-out plot of MR analysis of the relationship between T2DM and Hb1Ac levels, with GWAS ID of ebi-a-GCST010118 as the instrumental variable for T2DM, respectively.
Supplemental File 1 | The plot of MR result of T2DM on colorectal cancer in East Asian.
Supplemental File 2 | The plot of MR result of T2DM on esophageal cancer in East Asian.
Supplemental File 3 | The plot of MR result of T2DM on gastric cancer in East Asian.
Supplemental File 4 | The plot of MR result of T2DM on hepatocellular carcinoma in East Asian.
Supplemental File 5 | The plot of MR result of T2DM on pancreatic cancer in East Asian.
References
1. Ma RCW, Chan JCN. Type 2 diabetes in East Asians: similarities and differences with populations in Europe and the United States. Ann New York Acad Sci. (2013) 1281:64–91. doi: 10.1111/nyas.12098
2. Chen L, Magliano DJ, Zimmet PZ. The worldwide epidemiology of type 2 diabetes mellitus–present and future perspectives. Nat Rev Endocrinol. (2011) 8:228–36. doi: 10.1038/nrendo.2011.183
3. Tsilidis KK, Kasimis JC, Lopez DS, Ntzani EE, Ioannidis JP. Type 2 diabetes and cancer: umbrella review of meta-analyses of observational studies. BMJ. (2015) 350:g7607. doi: 10.1136/bmj.g7607
4. Sasazuki S, Charvat H, Hara A, Wakai K, Nagata C, Nakamura K, et al. Diabetes mellitus and cancer risk: pooled analysis of eight cohort studies in Japan. Cancer Sci. (2013) 104:1499–507. doi: 10.1111/cas.12241
5. de Jong RGPJ, Peeters PJHL, Burden AM, de Bruin ML, Haak HR, Masclee AAM, et al. Gastrointestinal cancer incidence in type 2 diabetes mellitus; results from a large population-based cohort study in the UK. Cancer Epidemiol. (2018) 54:104–11. doi: 10.1016/j.canep.2018.04.008
6. Johnson JA, Carstensen B, Witte D, Bowker SL, Lipscombe L, Renehan AG. Diabetes and cancer (1): evaluating the temporal relationship between type 2 diabetes and cancer incidence. Diabetologia. (2012) 55:1607–18. doi: 10.1007/s00125-012-2525-1
7. Johnson JA, Bowker SL, Richardson K, Marra CA. Time-varying incidence of cancer after the onset of type 2 diabetes: evidence of potential detection bias. Diabetologia. (2011) 54:2263–71. doi: 10.1007/s00125-011-2242-1
8. Onitilo AA, Stankowski RV, Berg RL, Engel JM, Glurich I, Williams GM, et al. Breast cancer incidence before and after diagnosis of type 2 diabetes mellitus in women: increased risk in the prediabetes phase. Eur J Cancer Prev. (2014) 23:76–83. doi: 10.1097/CEJ.0b013e32836162aa
9. Rey-Reñones C, Baena-Díez JM, Aguilar-Palacio I, Miquel C, Grau M. Type 2 diabetes mellitus and cancer: epidemiology, physiopathology and prevention. Biomedicines. (2021) 9. doi: 10.3390/biomedicines9101429
10. Rojas A, Añazco C, González I, Araya P. Extracellular matrix glycation and receptor for advanced glycation end-products activation: a missing piece in the puzzle of the association between diabetes and cancer. Carcinogenesis. (2018) 39:515–21. doi: 10.1093/carcin/bgy012
11. El-Far AH, Sroga G, Jaouni SKA, Mousa SA. Role and mechanisms of RAGE-ligand complexes and RAGE-inhibitors in cancer progression. Int J Mol Sci. (2020) 21. doi: 10.3390/ijms21103613
12. Pollak M. Insulin and insulin-like growth factor signalling in neoplasia. Nat Rev Cancer. (2008) 8:915–28. doi: 10.1038/nrc2536
13. Cignarelli A, Genchi VA, Caruso I, Natalicchio A, Perrini S, Laviola L, et al. Diabetes and cancer: Pathophysiological fundamentals of a 'dangerous affair'. Diabetes Res Clin Pract. (2018) 143:378–88. doi: 10.1016/j.diabres.2018.04.002
14. Blyth AJ, Kirk NS, Forbes BE. Understanding IGF-II Action through Insights into Receptor Binding and Activation. Cells. (2020) 9. doi: 10.3390/cells9102276
15. Palmer TM, Lawlor DA, Harbord RM, Sheehan NA, Tobias JH, Timpson NJ, et al. Using multiple genetic variants as instrumental variables for modifiable risk factors. Stat Methods Med Res. (2012) 21:223–42. doi: 10.1177/0962280210394459
16. Pierce BL, Ahsan H, Vanderweele TJ. Power and instrument strength requirements for Mendelian randomization studies using multiple genetic variants. Int J Epidemiol. (2011) 40:740–52. doi: 10.1093/ije/dyq151
17. Hemani G, Tilling K, Davey Smith G. Orienting the causal relationship between imprecisely measured traits using GWAS summary data. PloS Genet. (2017) 13:e1007081. doi: 10.1371/journal.pgen.1007081
18. Hui JM, Sud A, Farrell GC, Bandara P, Byth K, Kench JG, et al. Insulin resistance is associated with chronic hepatitis C virus infection and fibrosis progression [corrected]. Gastroenterology. (2003) 125:1695–704. doi: 10.1053/j.gastro.2003.08.032
19. Romero-Gómez M, Fernández-Rodríguez CM, Andrade RJ, Diago M, Alonso S, Planas R, et al. Effect of sustained virological response to treatment on the incidence of abnormal glucose values in chronic hepatitis C. J Hepatol. (2008) 48:721–7. doi: 10.1016/j.jhep.2007.11.022
20. Boraie MB, Elnaggar YA, Ahmed MO, Mahmoud AM. Effect of direct acting antiviral therapy of Chronic Hepatitis C virus on insulin resistance and Type2 DM in Egyptian patients (prospective study). Diabetes Metab Syndr. (2019) 13:2641–6. doi: 10.1016/j.dsx.2019.07.032
21. Doycheva I, Zhang T, Amjad W, Thuluvath PJ. Diabetes and hepatocellular carcinoma: incidence trends and impact of liver disease etiology. J Clin Exp Hepatol. (2020) 10:296–303. doi: 10.1016/j.jceh.2019.11.004
22. Bowden J, Davey Smith G, Burgess S. Mendelian randomization with invalid instruments: effect estimation and bias detection through Egger regression. Int J Epidemiol. (2015) 44:512–25. doi: 10.1093/ije/dyv080
23. Burgess S, Thompson SG. Interpreting findings from Mendelian randomization using the MR-Egger method. Eur J Epidemiol. (2017) 32:377–89. doi: 10.1007/s10654-017-0255-x
24. Verbanck M, Chen CY, Neale B, Do R. Detection of widespread horizontal pleiotropy in causal relationships inferred from Mendelian randomization between complex traits and diseases. Nat Genet. (2018) 50:693–8. doi: 10.1038/s41588-018-0099-7
25. Huang J, Lucero-Prisno DE 3rd, Zhang L, Xu W, Wong SH, Ng SC, et al. Updated epidemiology of gastrointestinal cancers in East Asia. Nat Rev Gastroenterol Hepatol. (2023) 20:271–87. doi: 10.1038/s41575-022-00726-3
26. Zheng Y, Ley SH, Hu FB. Global aetiology and epidemiology of type 2 diabetes mellitus and its complications. Nat Rev Endocrinol. (2018) 14:88–98. doi: 10.1038/nrendo.2017.151
27. Ishigaki K, Akiyama M, Kanai M, Takahashi A, Kawakami E, Sugishita H, et al. Large-scale genome-wide association study in a Japanese population identifies novel susceptibility loci across different diseases. Nat Genet. (2020) 52:669–79. doi: 10.1038/s41588-020-0640-3
28. Noto H, Tsujimoto T, Noda M. Significantly increased risk of cancer in diabetes mellitus patients: A meta-analysis of epidemiological evidence in Asians and non-Asians. J Diabetes Invest. (2012) 3:24–33. doi: 10.1111/j.2040-1124.2011.00183.x
29. Shlomai G, Neel B, LeRoith D, Gallagher EJ. Type 2 diabetes mellitus and cancer: the role of pharmacotherapy. J Clin Oncol. (2016) 34:4261–9. doi: 10.1200/JCO.2016.67.4044
30. Iwase M, Fujii H, Idewaki Y, Nakamura U, Ohkuma T, Ide H, et al. Prospective study of cancer in Japanese patients with type 2 diabetes: the Fukuoka Diabetes Registry. Diabetol Int. (2019) 10:260–7. doi: 10.1007/s13340-019-00390-0
31. Kwon HJ, Park MI, Park SJ, Moon W, Kim SE, Kim JH, et al. Insulin resistance is associated with early gastric cancer: A prospective multicenter case control study. Gut Liver. (2019) 13:154–60. doi: 10.5009/gnl17556
32. Vulcan A, Manjer J, Ohlsson B. High blood glucose levels are associated with higher risk of colon cancer in men: a cohort study. BMC Cancer. (2017) 17:842. doi: 10.1186/s12885-017-3874-4
33. Tseng P-H, Chao CC, Cheng YY, Chen CC, Yang PH, Yang WK, et al. Diabetic visceral neuropathy of gastroparesis: Gastric mucosal innervation and clinical significance. Eur J Neurol. (2022) 29:2097–108. doi: 10.1111/ene.15333
34. Rabben H-L, Zhao CM, Hayakawa Y, Wang TC, Chen D. Vagotomy and gastric tumorigenesis. Curr Neuropharmacology. (2016) 14:967–72. doi: 10.2174/1570159X14666160121114854
35. Vaes N, Idris M, Boesmans W, Alves MM, Melotte V. Nerves in gastrointestinal cancer: from mechanism to modulations. Nat Rev Gastroenterol Hepatol. (2022) 19:768–84. doi: 10.1038/s41575-022-00669-9
36. Yuan S, Kar S, Carter P, Vithayathil M, Mason AM, Burgess S, et al. Is type 2 diabetes causally associated with cancer risk? Evidence from a two-sample mendelian randomization study. Diabetes. (2020) 69:1588–96. doi: 10.2337/db20-0084
37. Domper Arnal MJ, Ferrández Arenas Á, Lanas Arbeloa Á. Esophageal cancer: Risk factors, screening and endoscopic treatment in Western and Eastern countries. World J Gastroenterol. (2015) 21:7933–43. doi: 10.3748/wjg.v21.i26.7933
38. Xu B, Zhou X, Li X, Liu C, Yang C. Diabetes mellitus carries a risk of esophageal cancer: A meta-analysis. Medicine. (2017) 96:e7944. doi: 10.1097/MD.0000000000007944
39. Zhou R, Huang C, Luo Z, Wang T. The association between the risk of esophageal cancer and type 2 diabetes mellitus: an updated meta-analysis. BioMed Res International 2022. (2022) 2024:8129771. doi: 10.1155/2022/8129771
40. Loftfield E, Freedman ND, Lai GY, Weinstein SJ, McGlynn KA, Taylor PR, et al. Higher Glucose and Insulin Levels Are Associated with Risk of Liver Cancer and Chronic Liver Disease Mortality among Men without a History of Diabetes. Cancer Prev Res (Philadelphia Pa.). (2016) 9:866–74. doi: 10.1158/1940-6207.CAPR-16-0141
41. Limburg PJ, Stolzenberg-Solomon RZ, Vierkant RA, Roberts K, Sellers TA, Taylor PR, et al. Insulin, glucose, insulin resistance, and incident colorectal cancer in male smokers. Clin Gastroenterol Hepatol. (2006) 4:1514–21. doi: 10.1016/j.cgh.2006.09.014
42. Stolzenberg-Solomon RZ, Graubard BI, Chari S, Limburg P, Taylor PR, Virtamo J, et al. Insulin, glucose, insulin resistance, and pancreatic cancer in male smokers. JAMA. (2005) 294:2872–8. doi: 10.1001/jama.294.22.2872
43. Yoon YS, Keum N, Zhang X, Cho E, Giovannucci EL. Hyperinsulinemia, insulin resistance and colorectal adenomas: A meta-analysis. Metabolism: Clin Exp. (2015) 64:1324–33. doi: 10.1016/j.metabol.2015.06.013
44. Murphy N, Song M, Papadimitriou N, Carreras-Torres R, Langenberg C, Martin RM, et al. Associations between glycemic traits and colorectal cancer: A mendelian randomization analysis. J Natl Cancer Institute. (2022) 114:740–52. doi: 10.1093/jnci/djac011
45. Hope C, Robertshaw A, Cheung KL, Idris I, English E. Relationship between HbA1c and cancer in people with or without diabetes: a systematic review. Diabetic Med. (2016) 33:1013–25. doi: 10.1111/dme.13031
Keywords: type 2 diabetes mellitus, digestive system tumors, Mendelian randomization, causal relationship, East Asian population
Citation: An N, Zhang Y, Sha Z, Xu Z and Liu X (2024) T2DM may exert a protective effect against digestive system tumors in East Asian populations: a Mendelian randomization analysis. Front. Oncol. 14:1327154. doi: 10.3389/fonc.2024.1327154
Received: 13 November 2023; Accepted: 29 May 2024;
Published: 14 June 2024.
Edited by:
Bangzhou Zhang, Xiamen University, ChinaReviewed by:
Aaron Balasingam Koenig, INOVA Health System, United StatesUmamaheswaran Gurusamy, Nationwide Children’s Hospital, United States
Copyright © 2024 An, Zhang, Sha, Xu and Liu. This is an open-access article distributed under the terms of the Creative Commons Attribution License (CC BY). The use, distribution or reproduction in other forums is permitted, provided the original author(s) and the copyright owner(s) are credited and that the original publication in this journal is cited, in accordance with accepted academic practice. No use, distribution or reproduction is permitted which does not comply with these terms.
*Correspondence: Zhen Xu, c2xvd3Nob2NrQDE2My5jb20=; Xiuzhen Liu, eGl1emhfbGl1QHNpbmEuY29t
†These authors have contributed equally to this work and share first authorship
‡These authors have contributed equally to this work and share last authorship
§ORCID: Zhilin Sha, orcid.org/0009-0002-6189-395X