 Philippe Metellus1,2*Clara Camilla1,3Emilie Bialecki2Nathalie Beaufils3Christine Vellutini1Eric Pellegrino3Pascale Tomasini4,5
 Manmeet S. Ahluwalia6,7
 Alireza Mansouri8Isabelle Nanni3
 L’Houcine Ouafik1,3
- 1Aix Marseille Univ, Centre national de Recherche Scientifique (CNRS), INP, Inst Neurophysiopathol, Marseille, France
- 2Ramsay Santé, Hôpital Privé Clairval, Département de Neurochirurgie, Marseille, France
- 3Aix Marseille Univ, APHM, CHU Timone, Service d’OncoBiologie, Marseille, France
- 4Aix Marseille Univ, APHM, Oncologie multidisciplinaire et innovations thérapeutiques, Marseille, France
- 5Aix-Marseille Univ, Centre national de Recherche Scientifique (CNRS), Inserm, CRCM, Marseille, France
- 6Miami Cancer Institute, Baptist Health South Florida, Miami, FL, United States
- 7Herbert Wertheim College of Medicine, Florida International University, Miami, FL, United States
- 8Department of Neurosurgery, Penn State Cancer Institute, Hershey, PA, United States
Background: Oncogenic fusions of neurotrophic receptor tyrosine kinase NTRK1, NTRK2, or NTRK3 genes have been found in different types of solid tumors. The treatment of patients with TRK fusion cancer with a first-generation TRK inhibitor (such as larotrectinib or entrectinib) is associated with high response rates (>75%), regardless of tumor histology and presence of metastases. Due to the efficacy of TRK inhibitor therapy of larotrectinib and entrectinib, it is clinically important to identify patients accurately and efficiently with TRK fusion cancer. In this retrospective study, we provide unique data on the incidence of oncogenic NTRK gene fusions in patients with brain metastases (BM) and gliomas.
Methods: 140 samples fixed and paraffin-embedded tissue (FFPE) of adult patients (59 of gliomas [17 of WHO grade II, 20 of WHO grade III and 22 glioblastomas] and 81 of brain metastasis (BM) of different primary tumors) are analyzed. Identification of NTRK gene fusions is performed using next-generation sequencing (NGS) technology using Focus RNA assay kit (Thermo Fisher Scientific).
Results: We identified an ETV6 (5)::NTRK3 (15) fusion event using targeted next-generation sequencing (NGS) in one of 59 glioma patient with oligodendroglioma–grade II, IDH-mutated and 1p19q co-deleted at incidence of 1.69%. Five additional patients harboring TMPRSS (2)::ERG (4) were identified in pancreatic carcinoma brain metastasis (BM), prostatic carcinoma BM, endometrium BM and oligodendroglioma (grade II), IDH-mutated and 1p19q co-deleted. A FGFR3 (17)::TACC3 (11) fusion was identified in one carcinoma breast BM. Aberrant splicing to produce EGFR exons 2-7 skipping mRNA, and MET exon 14 skipping mRNA were identified in glioblastoma and pancreas carcinoma BM, respectively.
Conclusions: This study provides data on the incidence of NTRK gene fusions in brain tumors, which could strongly support the relevance of innovative clinical trials with specific targeted therapies (larotrectinib, entrectinib) in this population of patients. FGFR3 (17)::TACC3 (11) rearrangement was detected in breast carcinoma BM with the possibility of using some specific targeted therapies and TMPRSS (2)::ERG (4) rearrangements occur in a subset of patients with, prostatic carcinoma BM, endometrium BM, and oligodendroglioma (grade II), IDH-mutated and 1p19q co-deleted, where there are yet no approved ERG-directed therapies.
1 Introduction
The tropomyosin receptor kinase (TRK) family of receptors is composed of TRKA, TRKB, and TRKC, which are neurotrophic tyrosine receptor kinase (NTRK) proteins encoded by the NTRK1, NTRK2 and NTRK3 genes, respectively (1, 2). These receptors are highly expressed in neural tissue and participate in the development and proper functioning of the central nervous system (CNS). These receptors activate the RAS/MAPK pathway and can also signal via the PI3K/AKT/mTOR and the PLCγ/PLK pathways, depending on which docking protein binds to the kinase domain. Via these pathways, the signal transduction leads to neuronal survival, development, proliferation, synaptic plasticity, neuronal differentiation as well as memory and cognition (3–5). These receptors and their signaling cascade are also implicated in neoplastic cells (6).
Although mutations and alternative splicing occur, fusions are the most common aberrations of NTRK in tumors. Gene fusion events that involve NTRK genes (NTRK1, NTRK2 and NTRK3) occur when the 3’ region of a NTRK gene encoding the tyrosine kinase domain is joined in-frame with 5’-end of a fusion partner gene, either by intra- or inter-chromosomal rearrangement (7, 8). The resulting fusion oncogene leads to the production of chimeric protein, with a constitutive activation of the kinase, due to loss of the extracellular domain, continuous downstream signaling and thus proliferation and cell survival (7).
Among adult and pediatric patients, the incidence of NTRK gene fusions varies between <5% in solid cancers (e.g., lung cancer, colorectal cancer, glioma) and >75% in rare cancers (e.g., infantile fibrosarcoma, secretory breast, secretory carcinoma of the salivary gland) (9). The presence of NTRK gene fusions in both adult and pediatric populations suggests it may be one of the first oncogenic drivers that are both tissue- and age-agnostic (10–12).
Regarding the central nervous system (CNS) tumors, NTRK fusions occur in up to 2% of gliomas in adults (13, 14). The incidence in pediatric high-grade gliomas (HGG) and diffuse infiltrating pontine glioma is around 5% and even 40% in infants with non-brainstem HGG (15–18). NTRK2 is the most common fusion partner of the NTRK family in pediatric brain tumors (7, 8). Nevertheless, the occurrence of NTRK gene fusions in different types of brain tumors in adults remain quite unexplored.
The FGFR family exists of four transmembrane tyrosine kinase receptors (FGFR 1-4). The FGFR plays an important role in embryonal CNS development and in tumorigenesis, regulating angiogenesis, proliferation, differentiation, migration, and survival. FGFR genomic alterations (amplification, mutations, and fusions) occur in ~ 8% of gliomas, with most aberrations occurring in FGFR1 and FGFR3 (19). Chromosomal translocations that fuse the tyrosine kinase domains of FGFR1 or FGFR3 and TACC1 or TACC3 have been identified in 2% to 4% of gliomas (20–22). The IDH1/2 wild-type (3.5%) but none of IDH1/2-mutant grade II and III gliomas harbored FGFR3-TACC3 fusions (21). FGFR-TACC rearrangements are reported in 2.9% of glioblastoma (GBM) (21). These FGFR fusion genes, such as FGFR3-TACC3, are capable of ligand-independent dimerization by virtue of the newly fused coiled-coil domain and have demonstrated oncogenic potential in vitro and in vivo (20). Further, FGFR3-TACC3 fusion has been reported as predictive of response to FGFR tyrosine kinase inhibitors both preclinically (20, 21) and clinically in various solid tumors including gliomas (21). Clinical trials with FGFR inhibitors in brain tumors are being conducted (23, 24). FGFR fusions also have been identified as oncogenic drivers in breast tumors, lung cancer, and bladder carcinomas. FGFR3-TACC3 fusions were identified in a subset of bladder carcinomas (25), raising an interest in FGFR pathway inhibitors (23).
The detection of NTRK and FGFR gene fusions in brain tumors and brain metastases is relevant in clinical practice because these alterations can be predictive biomarkers and therapeutic targets for specific kinase inhibitors. NTRK and FGFR gene fusions result in overexpression of the fusion kinase and its constitutive activation, promoting tumor growth as a driver mutation. Both NTRK and FGFR inhibitors are currently being or already tested in clinical trials with patients who have fusions and available for treatment in tumors, respectively. Therefore, assessing NTRK and FGFR gene fusions in brain tumors and brain metastases could help identify those patients who could receive a clinically relevant response. Clinical outcomes from administering the above-targeted kinase inhibitors for patients could benefit from therapy if the NTRK and FGFR gene fusions were detected.
The incidence of cancer-associated fusions in patients with brain tumors remains poorly documented in France. Although several diagnostic approaches can be used to detect gene fusions, RNA-based next generation sequencing remains one of the most sensitive methods, as it can directly detect the transcribed product of gene fusion at the mRNA level (26). In this retrospective study, we herein report the results of detection of incidence of cancer-associated fusions in different types of brain tumors (gliomas and brain metastases).
2 Materials and methods
2.1 Patients’ selection
Patients were selected for the analysis of brain tumors samples to NGS. This retrospective, single-center, exploratory study was reviewed and approved by the Institutional Ethic Committee of Ramsay Santé. Patient samples were identified from the AP-HM tumor library (AC-2013-1786) using the electronic patient record.
The selection criteria were adult patient with histologically proven glioma and brain metastasis (BM) operated in Clairval hospital since February 2015, paraffin-embedded tissue samples (< 5 years old) available in the AP-HM biobank with clinico-radiological data. Written informed consent was obtained from all patients to use of their tumor samples for research purposes and no-opposition was obtained from all patients to use their personal and medical data.
Samples from 140 patients with a brain tumor (59 glioma samples including [17 glioma-grade II, 20 glioma-grade III and 22 glioma-grade IV] and 81 BM samples) were selected for this study.
Data collected included: sex of patients, age at time of surgery, patient habits (smoking), location of brain tumor, tumor histology with molecular data, origin of primary tumor for BM samples, previous treatments (chemotherapy, immunotherapy, radiotherapy, others, …), tumor percentage of samples analyzed, NGS results (transcript fusions), date of recurrence/progression, postoperative treatments, date of death and patient consent for scientific research.
2.2 RNA based Next-Generation Sequencing (NGS)
2.2.1 Tumor specimens and RNA preparation
Blocks of FFPE tumor were obtained from the pathology archives of Clairval hospital (Marseille). Tumor-rich areas (80% to 90%) were dissected from unstained sections by comparison with a hematoxylin and eosin-stained slide (HES-slide). Total RNAs were extracted using the Maxwell® RSC RNA FFPE Kit (Promega, Lyon, France) with treatment with DNAse. RNAs were eluted with 50 µL of elution buffer, and purified RNA was quantified with a Qubit fluorometer (Quantifluor RNA system, Promega).
2.2.2 Detection of Gene Fusions
The panel RNA Oncomine™ FOCUS Assay (OFA) contains a targeted, multi-biomarker panel that enables highly sensitive and robust detection of known fusions covering > 284 isoforms from 23 fusion drivers associated with solid tumors (Solid Tumor Fusion Transcript Panel Oncomine Focus Assay (A35956) Thermo Fisher Scientific). The panel also includes control amplicons representing five housekeeping gene transcripts (MYC, ITGB7, HMBS, LRP1, TBP), as well as amplicons that detect exons in the 5’ and 3’ regions of 4 of the target kinases (ALK, RET, ROS, NTRK). The latter are used to evaluate whether relative overexpression of the 3’ kinase domain is indicative of a gene fusion.
Amplicons sequencing libraries were prepared with 10 ng of RNA, according to manufacturer’s instructions with Oncomine Focus RNA assay kit using the AmpliSeq Kit (Thermo Fisher Scientific). Briefly, reverse transcription of total RNA with the superscript IV VILO Master-mix (Thermo Fisher Scientific) and amplification with the multiplexed fusion pool. Library preparation was performed according to the manufacturer’s instructions and concentration was determined using a quantitative PCR with the Ion library TaqMan® Quantitation kit (cat. No. 44688002). Libraries typically have yields of 100-500 pM and below 100 pM the library is excluded. Final libraries were diluted, pooled and further processed on Ion spheres using Ion 530 Chef Kits (Thermo Fisher Scientific) on the Ion Chef (Thermo Fisher Scientific). Sequencing was performed on the Ion S5-XL System, with 500 flows, and subsequent quality assessment for the run was completed using the Torrent Suite Software v5.16 (Thermo Fisher Scientific). Obligatory run metrics were composed of mean RNA read length (> 60bp), mean raw accuracy (> 99%), and total sequencing reads (> x 21,000,000). Further sample-specific quality assessment and analysis was completed using Ion reporter software (v5.12 February 2020, Thermo Fisher Scientific). For RNA variant annotation, the « Oncomine focus-520-w2.5-Fusions-Single Sample” workflow was used with default parameters. The validation criteria for RNA samples were as follows: each sample must generate at least 50,000 reads mapped and have a minimum mean read length of 60 bp. Additionally, at least three of the five RNA internal controls (TBP, LRP1, ITGB7, MYC, and HMBS) must be called. Finally, RNA alterations were reported only if a minimum number of reads was reached: 20 for targeted fusions, 250 for non-targeted fusions, and 120 for exon skipping.
To evaluate the limit of detection of the Oncomine assay, a dilution (1/10) of Seraseq Fusion RNA reference materials (SeraSeq fusion RNA Mix v4; Part Code 0710-0497; Seracare Life sciences Inc., Milford, MA) was made in a background of GM24386 RNA (mild-type material). Seventeen clinically relevant RNA fusions, which include TPM3-NTRK1, FGFR3-TACC3, ETV6-NTRK3, TFG-NTRK1, CCDC6-RET, CD74-ROS1, FGFR3-BAIAP2L1, KIF5B-RET, EML4-ALK, LMNA-NTRK1, NCOA4-RET, PAX8-PPARG1, SLC34A2-ROS1, SLC45A3-BRAF, TMPRSS2-ERG, EGFR variant III and MET ex 14 skipping, were tested using Seraseq Fusion RNA Reference Materials (Seracare Life Sciences Inc.), to evaluate analytical sensitivity of the assay.
2.2.3 Mutation calling
For detection of gene fusions and gene expression, the raw data in FASTQ format generated by the S5-XL were aligned to a custom reference genome using Torrent Suite version 5.18, with alignment performed by TMAP (https://github.com/iontorrent/TMAP; accessed February 2021), following removal of adapter sequences by Cutadapt software version 1.2.1 (27). The custom reference genome was assembled to include sequences of the designed fusion transcripts, normal transcripts of the genes involved in the fusions, gene regions for differential expression analysis, and the entire hg19 reference genome. Quality control of the raw FASTQ data was performed internally by the Torrent Suite software. Additionally, sequence reads were manually inspected in the Integrative Genomics Viewer (IGV; Broad Institute, Cambridge, MA). Notably, variant calling was performed using Ion Reporter software. Subsequently, fusion partners identified by the amplicon panel were further confirmed by RT-PCR analysis.
2.3 RT-PCR validation of fusion transcripts
RT-PCR of ETV6-NTRK3, TMPRSS2-ERG, FGFR3-TACC3 fusion transcripts in formalin-fixed paraffin-embedded sections was based on previously described methods (28). Briefly, RNA was isolated from two 30 μm paraffin sections and reverse-transcribed to cDNA as described by the manufacturer (Thermo Fisher Scientific). The cDNA was then subjected to PCR for ETV6-NTRK3 using sense TEL971 (5’-ACCACATCATGGTCTCTCTGTCTCCC-3’) and antisense TRKC 1059 (5’- CAGTTCTCGCTTCAGCACGATG-3’) primers (24); for TMPRSS2-ERG using TMPRSS2 sense primer (nt: 81-98; 5’-GAGGTGAAAGCGGGTGTG-3’) and ERG antisense primer (nt: 253-234; 5’-GGCACACTCAAACAACGACT-3’); for FGFR3-TACC3 using FGFR3 sense primer (nt:2514-2533; 5’-GACCTGGACCGTGTCCTTAC-3’) and TACC3 antisense primer (nt: 2087-2067; 5’-TCTCCTCCTGTGTCGCCTTT-3’). PCR conditions were as follows: 94°C for 5 min, followed by 35 cycles of 94°C for 45 s, 60°C for 1 min, 72°C for 1 min and a final extension of 72°C for 10 min. The reaction produced a 110 bp, 180 bp, and 108 bp PCR fragments for ETV6-NTRK3, TMPRSS2-ERG, and FGFR3-TACC3; respectively. Amplified products were visualized by electrophoresis using 2% polyacrylamide gels stained with ethidium bromide. ETV6-NTRK3, TMPRSS2-ERG, FGFR3-TACC3 amplification products were confirmed by sequencing of the PCR products.
2.4 Statistical analyses
The inclusion population was described according to all patient characteristics. A descriptive analysis of the variables of interest included the frequencies of patient demographics, histology of brain tumors, origin of primary tumors, transcript fusions and exons skipping genes, was carried out by SAS® Software.
3 Results
3.1 Characteristics of patients and samples
A total of 140 samples were analyzed, including 59 samples from patients operated on glioma with the following distribution: 17 samples from WHO grade II glioma, 20 from WHO grade III glioma and 22 from WHO grade IV glioma (Table 1, Figure 1). The remaining 81 samples are from patients operated on BM, from 13 different types of primary tumors (Table 2). Among brain metastasis tumors histology, breast cancer and lung cancer were represented at 28.4% and 27.2%, respectively (Figure 2). The median percentage of cellularity of the samples analyzed was 90% (n = 140, range: 1-100%).
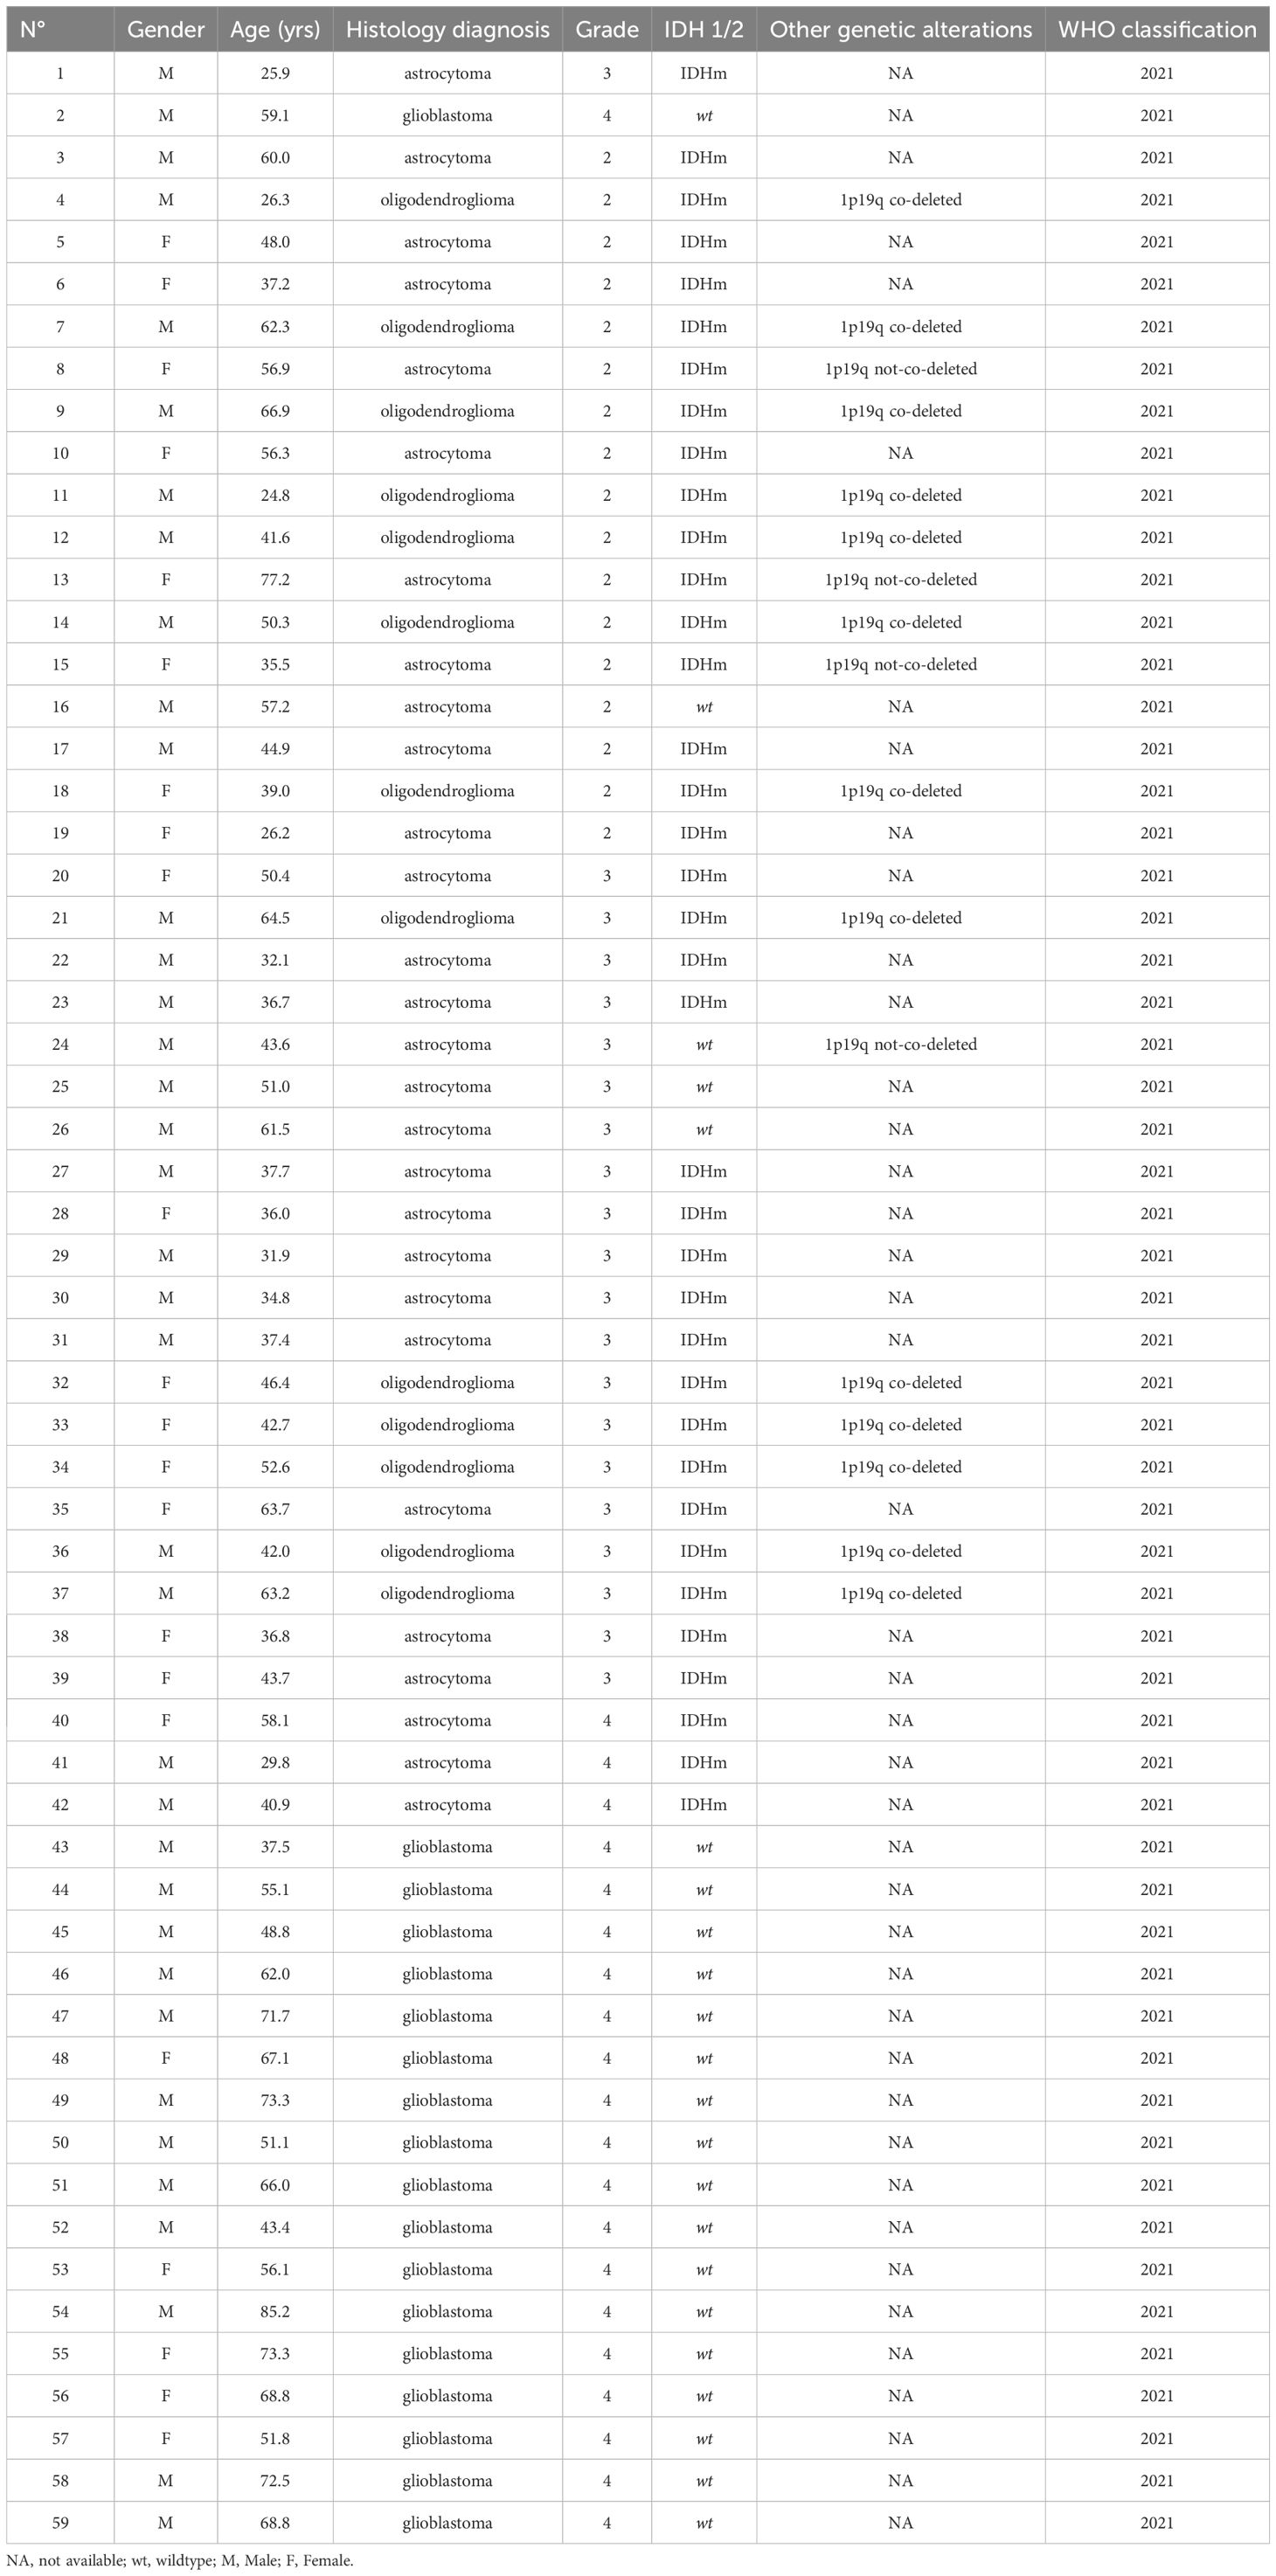
Table 1 Characteristics of glioma patients and tumor genomic alterations.
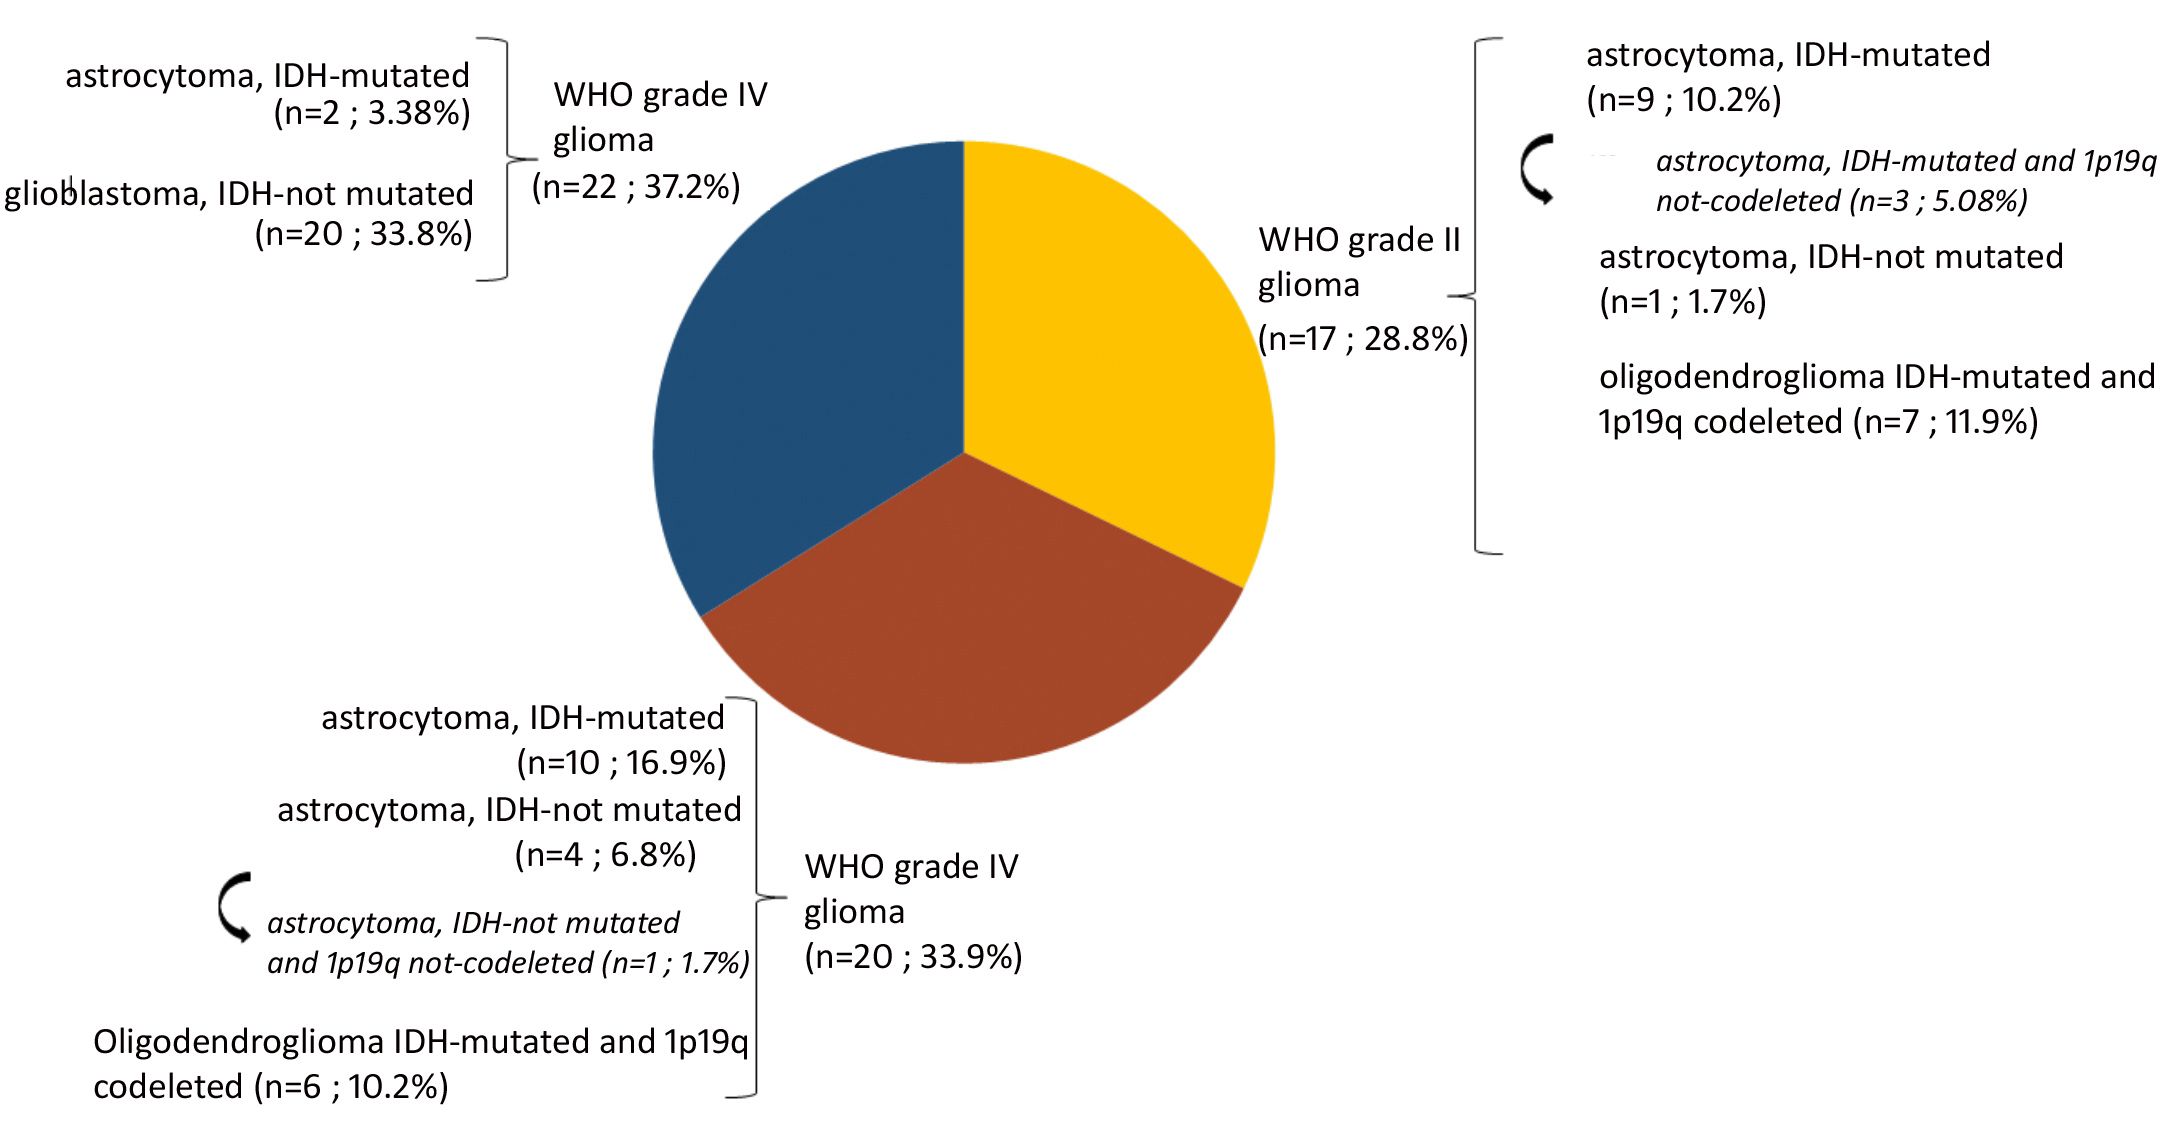
Figure 1 Prevalence of molecular profiles of gliomas samples analyzed. Astrocytoma IDH-mutated (n = 9; 10.2%) with three tumors (n = 3; 5.08%) do not present 1p19q co-deletion (arrow). Astrocytoma IDH-not mutated (n = 4; 6.8%) among which one tumor having 1p19q not co-deleted (1.7%) (arrow).
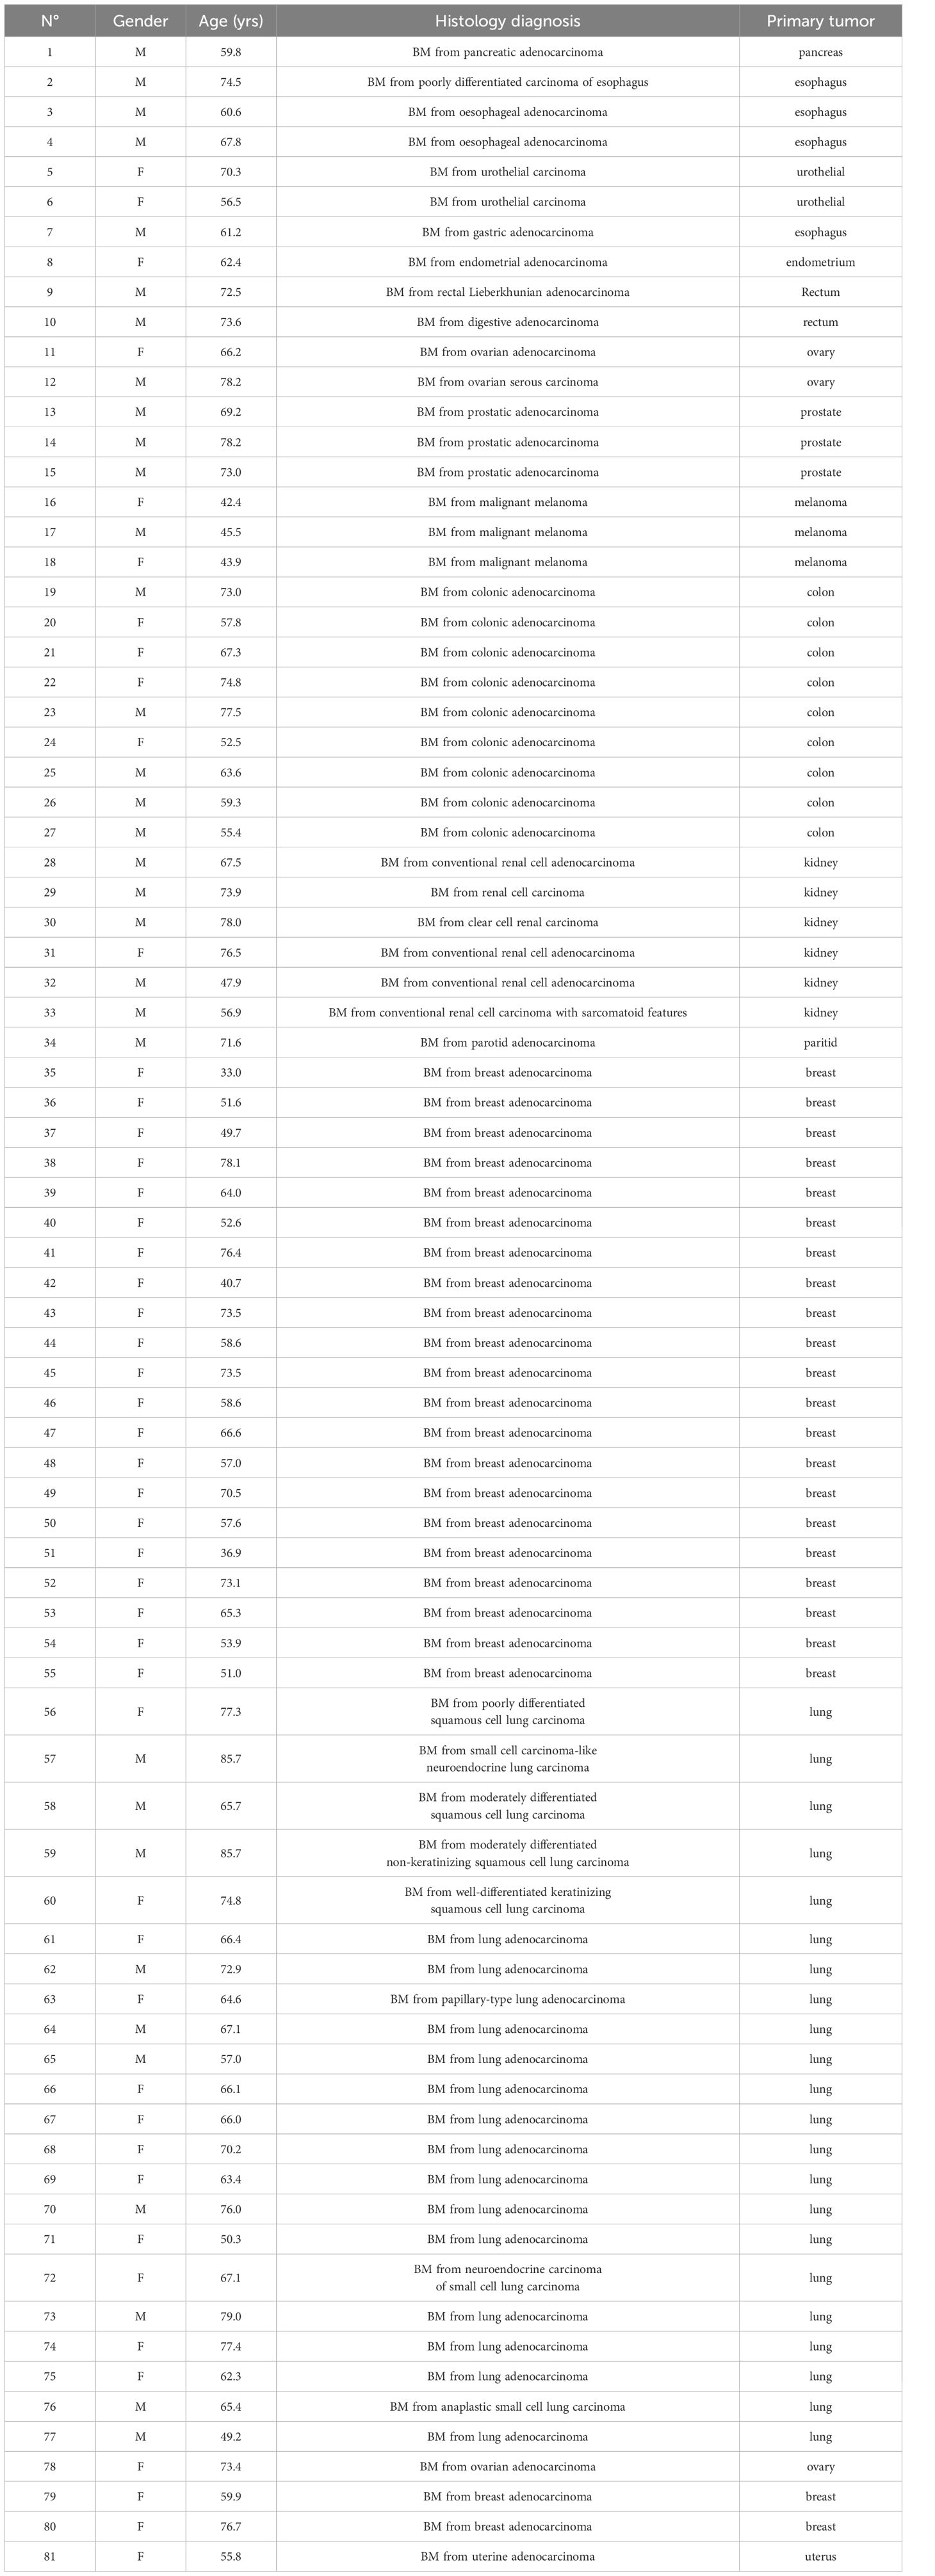
Table 2 Brain Metastasis histology diagnosis.
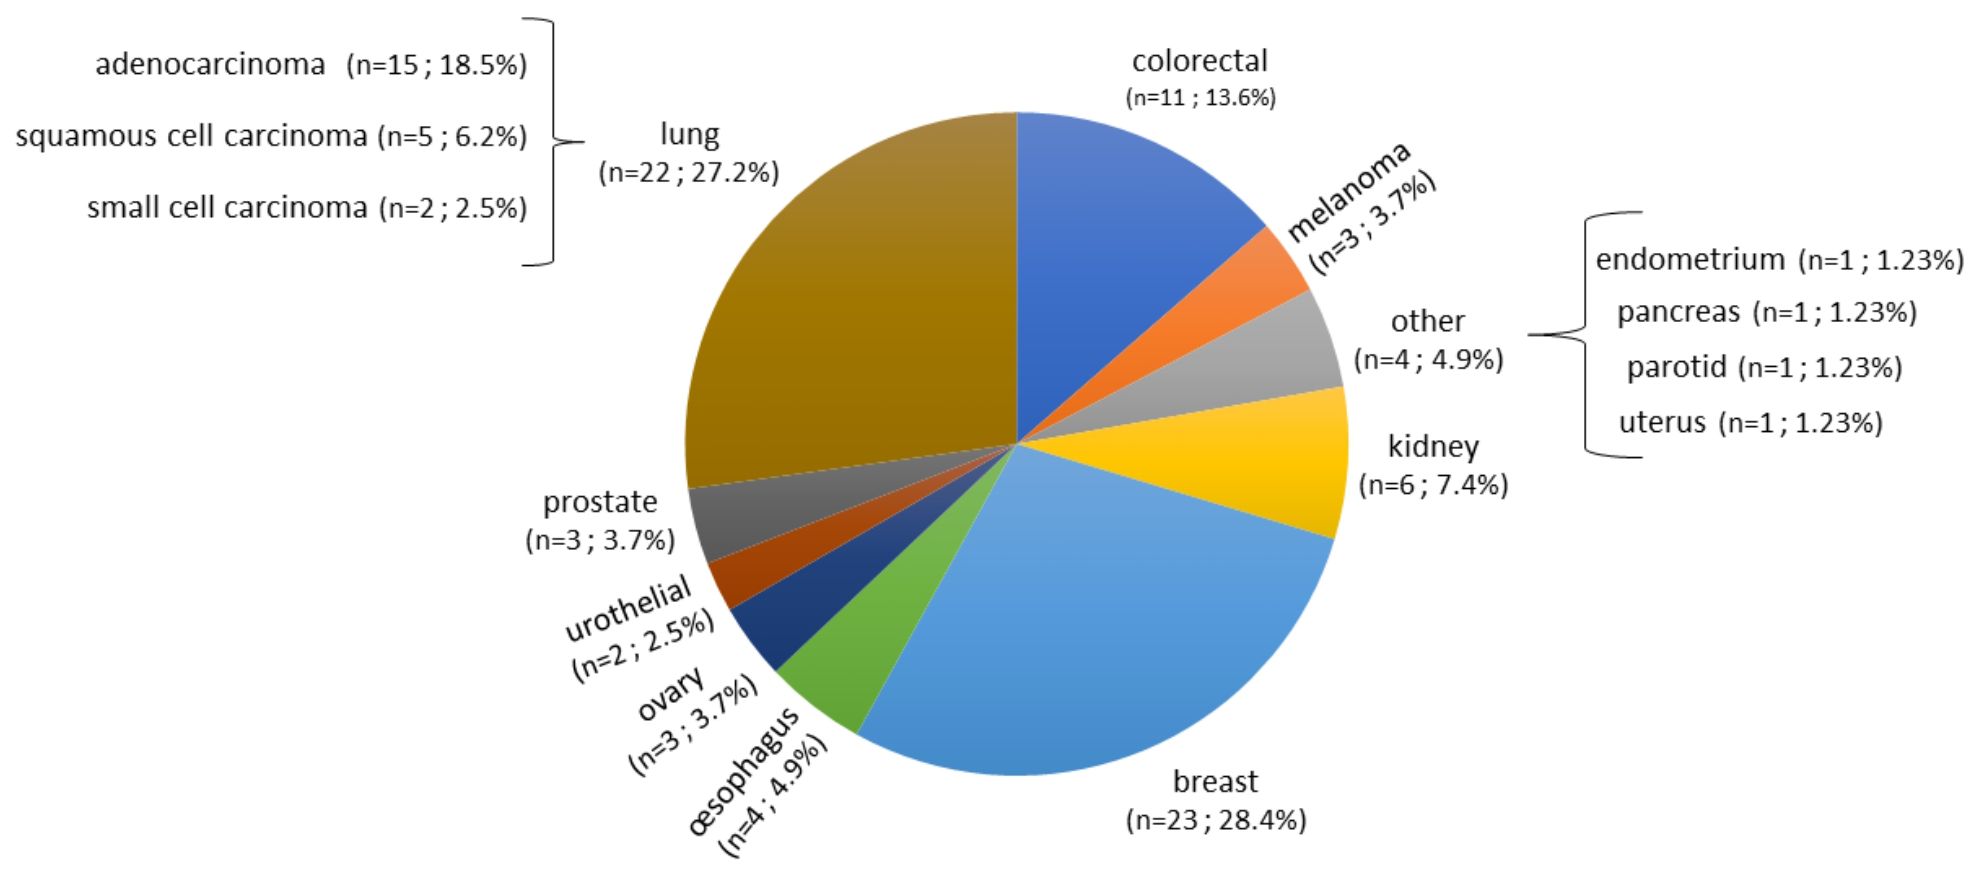
Figure 2 Prevalence of primary tumor types of brain metastases samples analyzed. Eighty-one samples are from patients operated on BM, from 13 different types of primary tumors as shown in the figure. Breast cancer, lung cancer, and colorectal cancer were represented at 28.4%, 27.2%, and 13.6%, respectively. The rest of the primary tumors were represented with percentage comprised between 2.5% to 7.4%.
The patients’ characteristics are summarized in Table 3. In the overall population analyzed, we had as many men as women. The average age at the time of surgery is 58.6 ± 14.5 with a median age of 60.9 [rank: 24.8 – 85.7]. The demographic characteristics of the two cohorts: gliomas and BM are also detailed in Table 3.
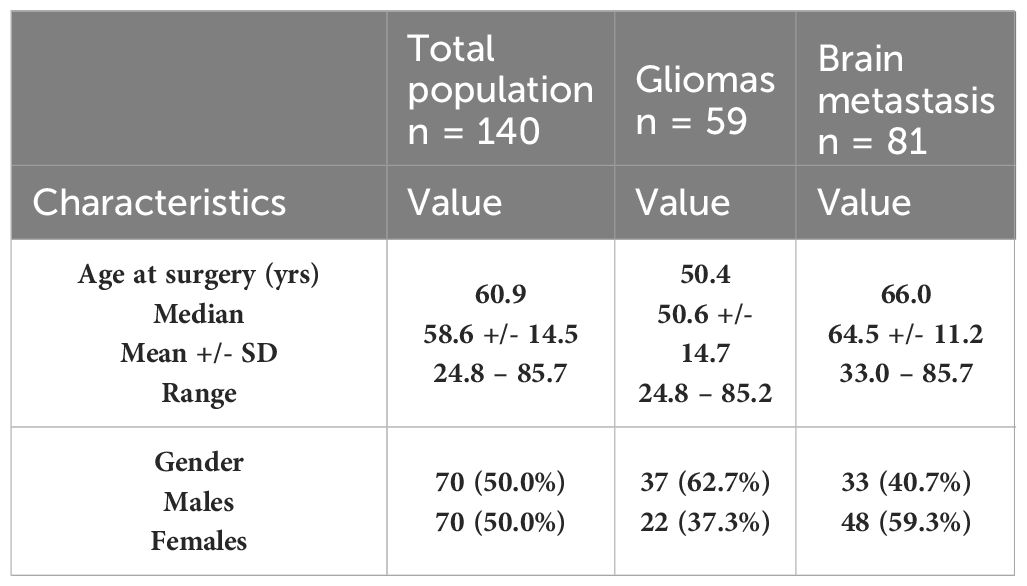
Table 3 Demographic characteristics of the two cohorts: glioma and BM.
3.2 Baseline characteristics of the panel
Several groups have published on multiplex amplicon approaches that specifically target fusions across known break points (29–31). The main advantages of such amplicon approaches include lower-input requirements, potentially increased sensitivity attributable to extensive amplification, shorter technical time for the assay, and reduced complexity for data analysis.
In accordance with our pre-defined quality control parameter, the sequencing data was processed carefully to make sure the correctness of the analysis. Quality control was an integral part of our strategy where specific metrics such as mean RNA read length (> 60 bp) and mean raw accuracy (> 99%) are used as indicators of sequencing. Besides, the minimum threshold of total sequencing reads (> x 21,000,000) was set to ensure the adequacy of coverage for the reliable analysis. The quality of sequencing data was assessed by analyzing the number of mapped reads by analyzing the number of mapped reads for each sample. Most samples exhibited consistent and high levels of mapped reads, ranging from approximately 150,000 to 400,000 reads. This consistency indicated successful library preparation, sequencing, and alignment processes for most the samples.
Transcripts derived from five housekeeping genes ranged from a mean of approximately 700 (HBM5) to 15,000 (TBP) reads per 100,000 mapped reads. The expression of housekeeping genes was evaluated in 59 gliomas and 81 metastases. The panel revealed no significant variability in expression of housekeeping genes between metastatic and primary tumors (Figure 3). The 3’/5’ read ratio was measured for 4 kinases (ALK, NTRK, RET, ROS) on the panel. The observed reads in the gliomas and metastasis samples ranged from approximately 100 to 10,000 mapped reads per 100,000 mapped reads (Figure 3). The 3’/5’ ratios were close to one for the four kinases (Figure 3).
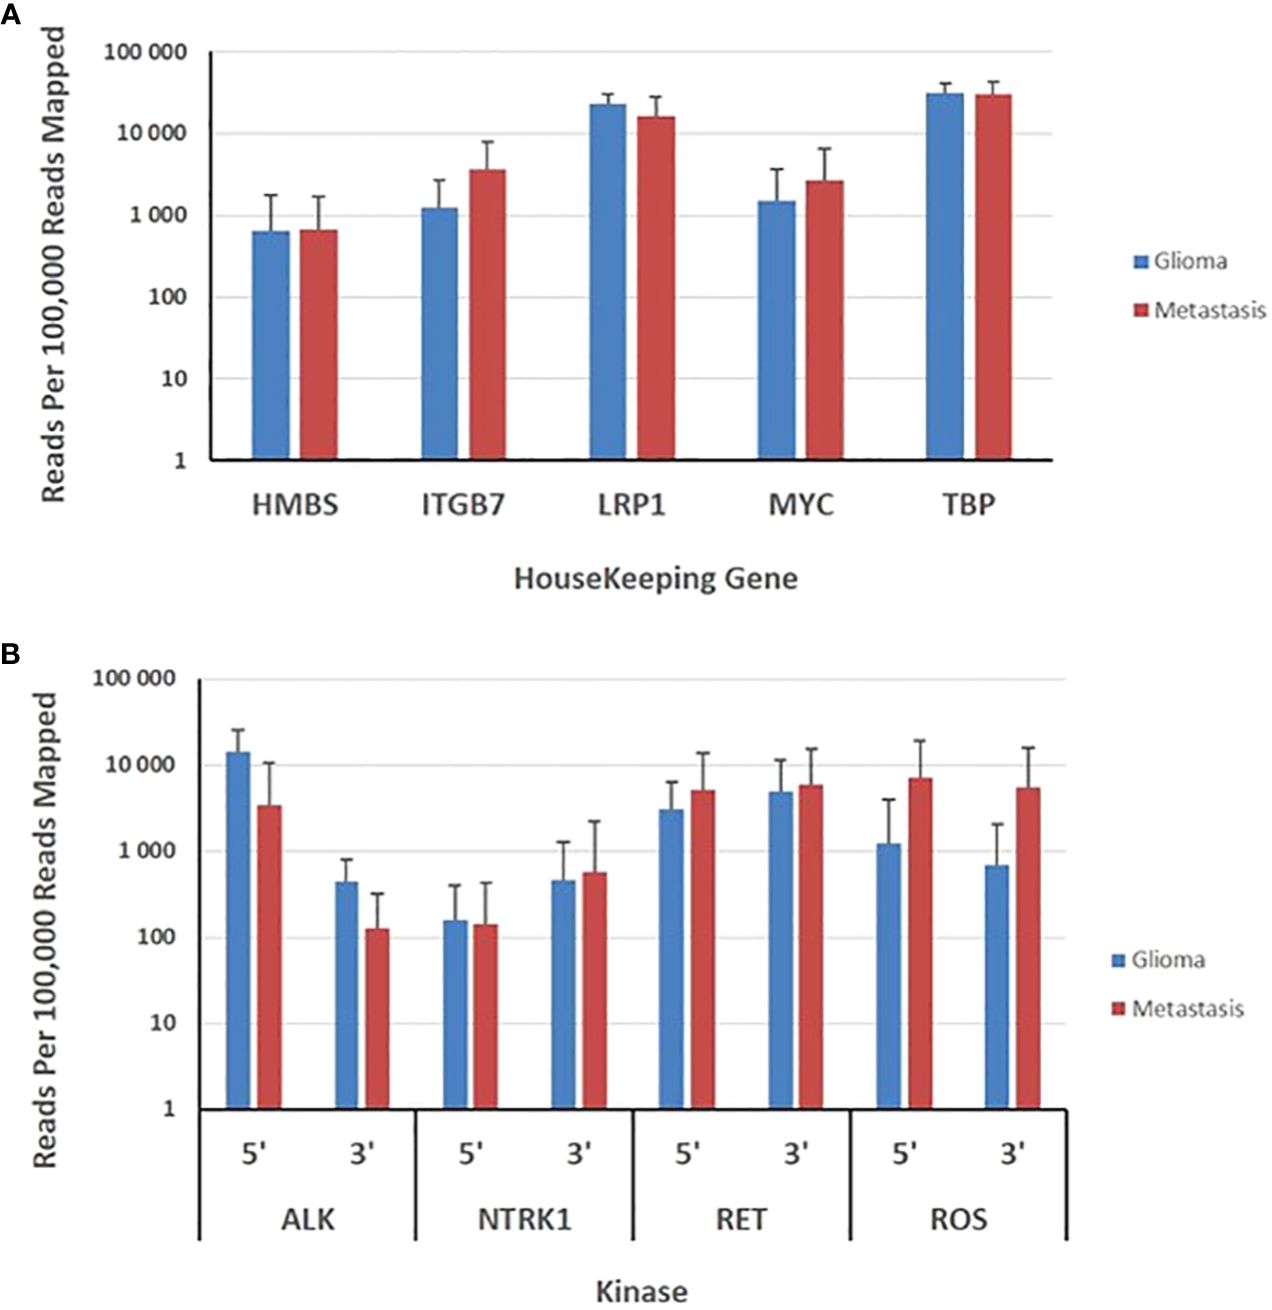
Figure 3 Evaluation of brain gliomas and brain metastasis tissues specimens. (A), Expression levels of five housekeeping genes are depicted as the normalized number of reads per 100,000 reads mapped to assay amplicons for each transcript and represent the means ± SD derived from 59 gliomas and 81 brain metastasis tissue specimens. (B), Expression levels of 5’ and 3’ exons in 4 kinases are depicted as the means ± SD of the normalized sequence reads observed in 59 gliomas and 81 brain metastasis tissue specimens.
To determine the limit of detection of the RNA Oncomine assay to detect the fusion transcripts, SeraSeq Fusion RNA Mix v4 (Seracare Life Sciences Inc.) was used, which contains 17 clinically relevant NTRK fusions, including high prevalence fusions, such as TPM3-NTRK1 and FGFR3-TACC3, ETV6-NTRK3, as well as less common fusions, such as TFG-NTRK1, CCDC6-RET, CD74-ROS1, FGFR3-BAIAP2L1, KIF5B-RET, EML4-ALK, LMNA-NTRK1, NCOA4-RET, PAX8-PPARG1, SLC34A2-ROS1, SLC45A3-BRAF, TMPRSS2-ERG, EGFR variant III and MET ex 14 skipping. All 17 RNA fusions were detected by the panel RNA Oncomine™ FOCUS Assay (OFA) with 560, 1454, 455, 1014, 194, 222, 446, 391, 142, 37, 100, 118, 299, 460, 85, 126, and 264 mapped reads, respectively.
Based on these results, we defined a high-confidence gene fusion meeting the following criteria: a minimum threshold of 20 fusion reads per 100,000 reads mapped to assay amplicons (0.01%) and clear evidence that the reads spanned the target fusion. We further required a library yield at least 100,000 mapped reads for a specimen to be called truly negative.
3.3 Fusion gene detection in tumor specimens
We performed targeted NGS on a subset (n = 140) of tumors. This subset presents an average of tumor content > 80%. The RNA sequencing analysis of 140 samples of the two cohorts ‘gliomas and BM revealed samples with gene rearrangements that involve NTRK3, FGFR3, ERG, EGFR, or MET genes in seven samples (5%) (Figure 4). In one tumor of 59 glioma specimens, one rearrangement with 6225 fusion reads mapped fusing exon 5 of the gene ETV6 to exon 15 of NTRK3 was identified (Figure 5, Table 4) in oligodendroglioma–grade II, IDH-mutated and 1p19q co-deleted at frequency of 1.69%. The TMPRSS (2)::ERG (4) fusion (5/140 – 3.6%) was the most frequently gene fusions detected with 1101, 3306, 8918, 116645 and 162560 fusion mapped reads (Figure 5), two of them were identified in two patients operated on WHO grade II gliomas, both of whom had a history of other cancers (adenocarcinoma of the lower esophagus and papillary adenocarcinoma of thyroid), two were identified in two patients operated on for prostate carcinomas brain metastasis and one was identified in patient operated on for endometrium carcinomas brain metastasis. A rearrangement fusing exon 17 of the gene FGFR3 to exon 11 of TACC3 gene (1/140 – 0.7%) (Table 2) was detected with 184470 fusion mapped reads in patient operated for breast carcinoma brain metastasis (Figure 5). The high numbers of NGS mapped reads suggest the higher expression of the fusion transcripts in the tumor tissues (Table 4). The characteristics of the corresponding samples identified with fusions are summarized in Table 4. The visualization of RNA sequencing reads supports the fusion between the ETV6 exon 5 and NTRK3 exon 15 (Figure 6), the TMPRSS exon 2 and ERG exon 4 (Figure 6), and FGFR3 exon 17 and TACC3 exon 11 (Figure 6). We used specific PCR primers flanking the breaking points of ETV6 (exon 5) and NTRK3 (exon 15), FGFR3 (exon 17) and TACC3 (exon 11), and TMPRSS2 (exon 2) and ERG (exon 4) to realize RT-PCR analysis in order to confirm and validate the identified fusions events by targeted RNA sequencing (Figure 7).
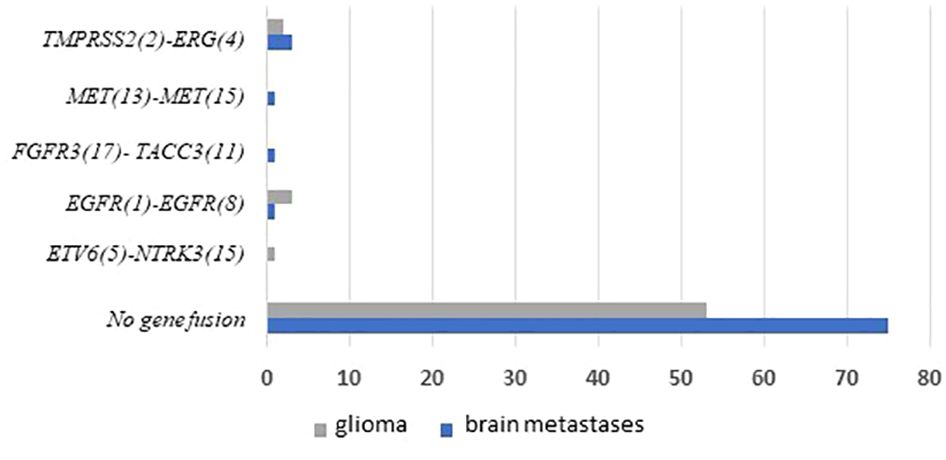
Figure 4 Frequencies and distributions of fusions for all brain gliomas and brain metastases with 140 cases analyzed. The RNA sequencing analysis of the two cohorts ‘gliomas and BM demonstrated samples with gene rearrangements that involve NTRK3, FGFR3, ERG, EGFR, or MET genes in seven samples (5%). Different types of alterations are found such as ETV6 (5)- NTRK3 (15) (1/59 gliomas – 1.69%), TMPRSS (2)-ERG (4) fusion (5/140 – 3.6%), FGFR3 (17)-TACC3 (11) fusion(1/140 – 0.7%), EGFR (1)-EGFR (8) RNA transcripts (4/59 gliomas - 6.78%); MET (13)-MET (15) RNA transcripts (1/140 – 0.7%).
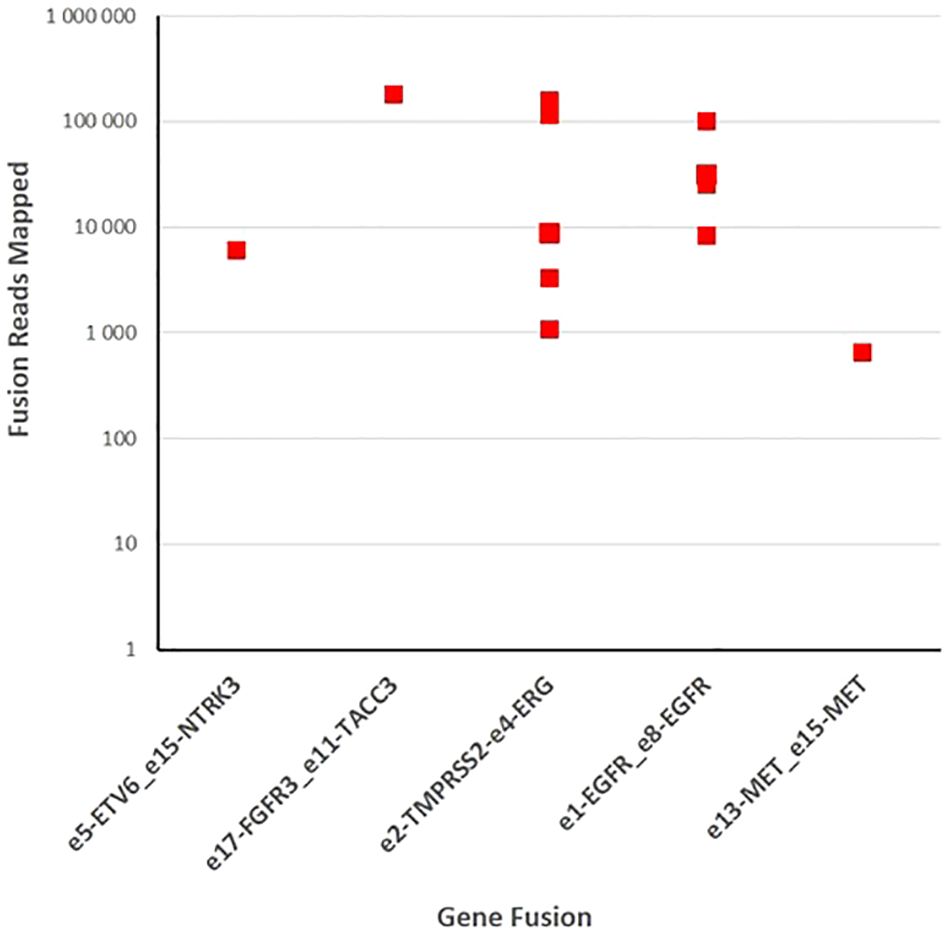
Figure 5 Fusion gene detection in tumor specimens. One hundred forty samples of gliomas and brain metastases were sequenced with fusion gene amplicon panel. Twelve samples were found to harbor gene rearrangements that involve NTRK3, FGFR3, ERG, EGFR, and MET.
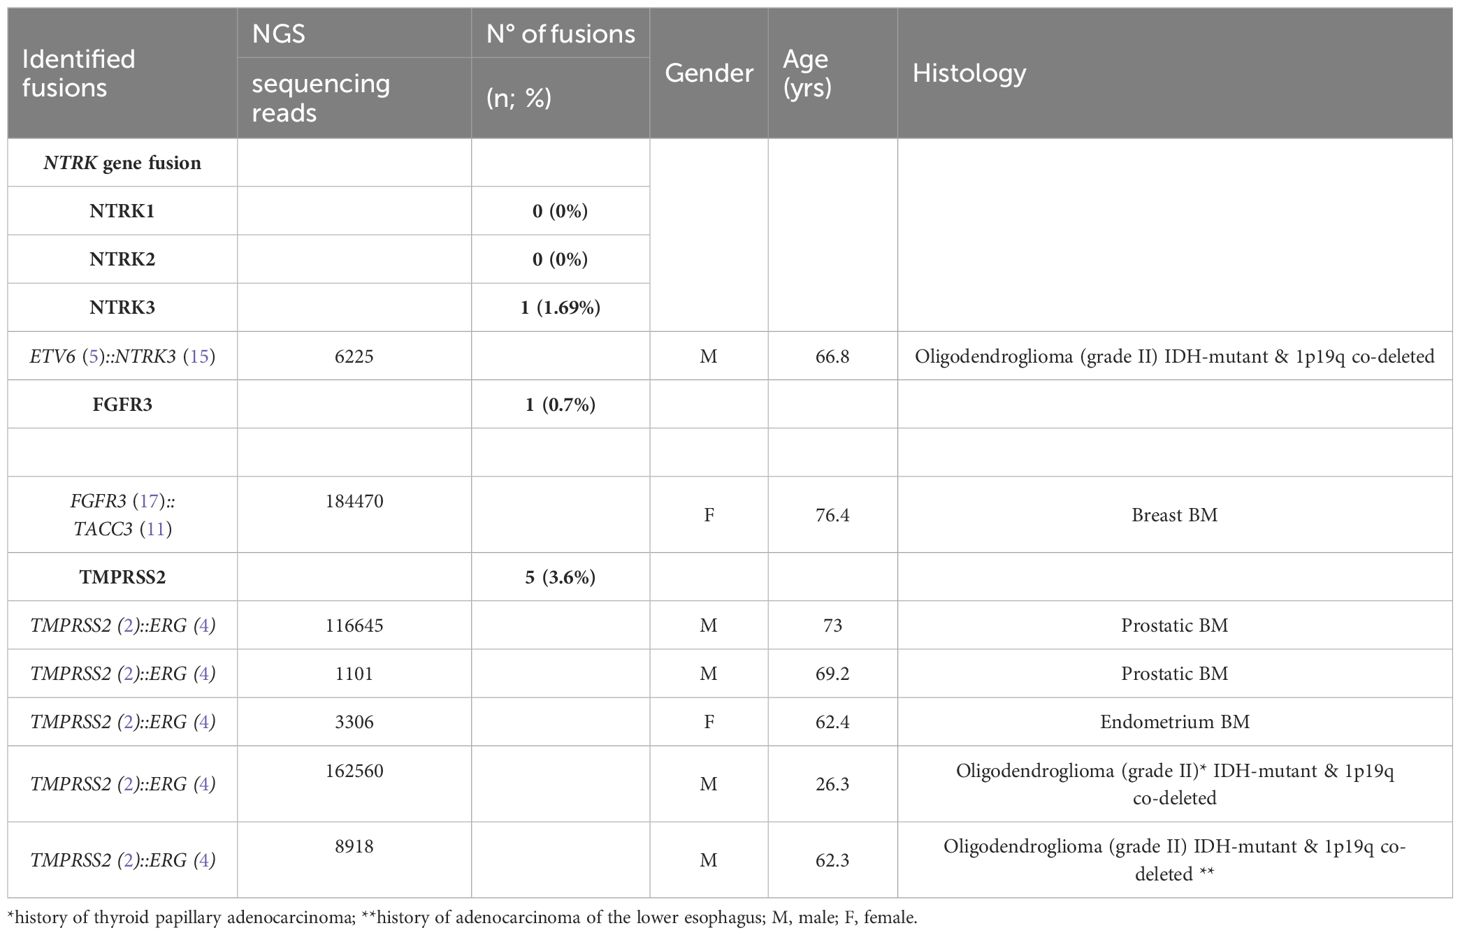
Table 4 Identified fusions and characteristics of the corresponding samples.
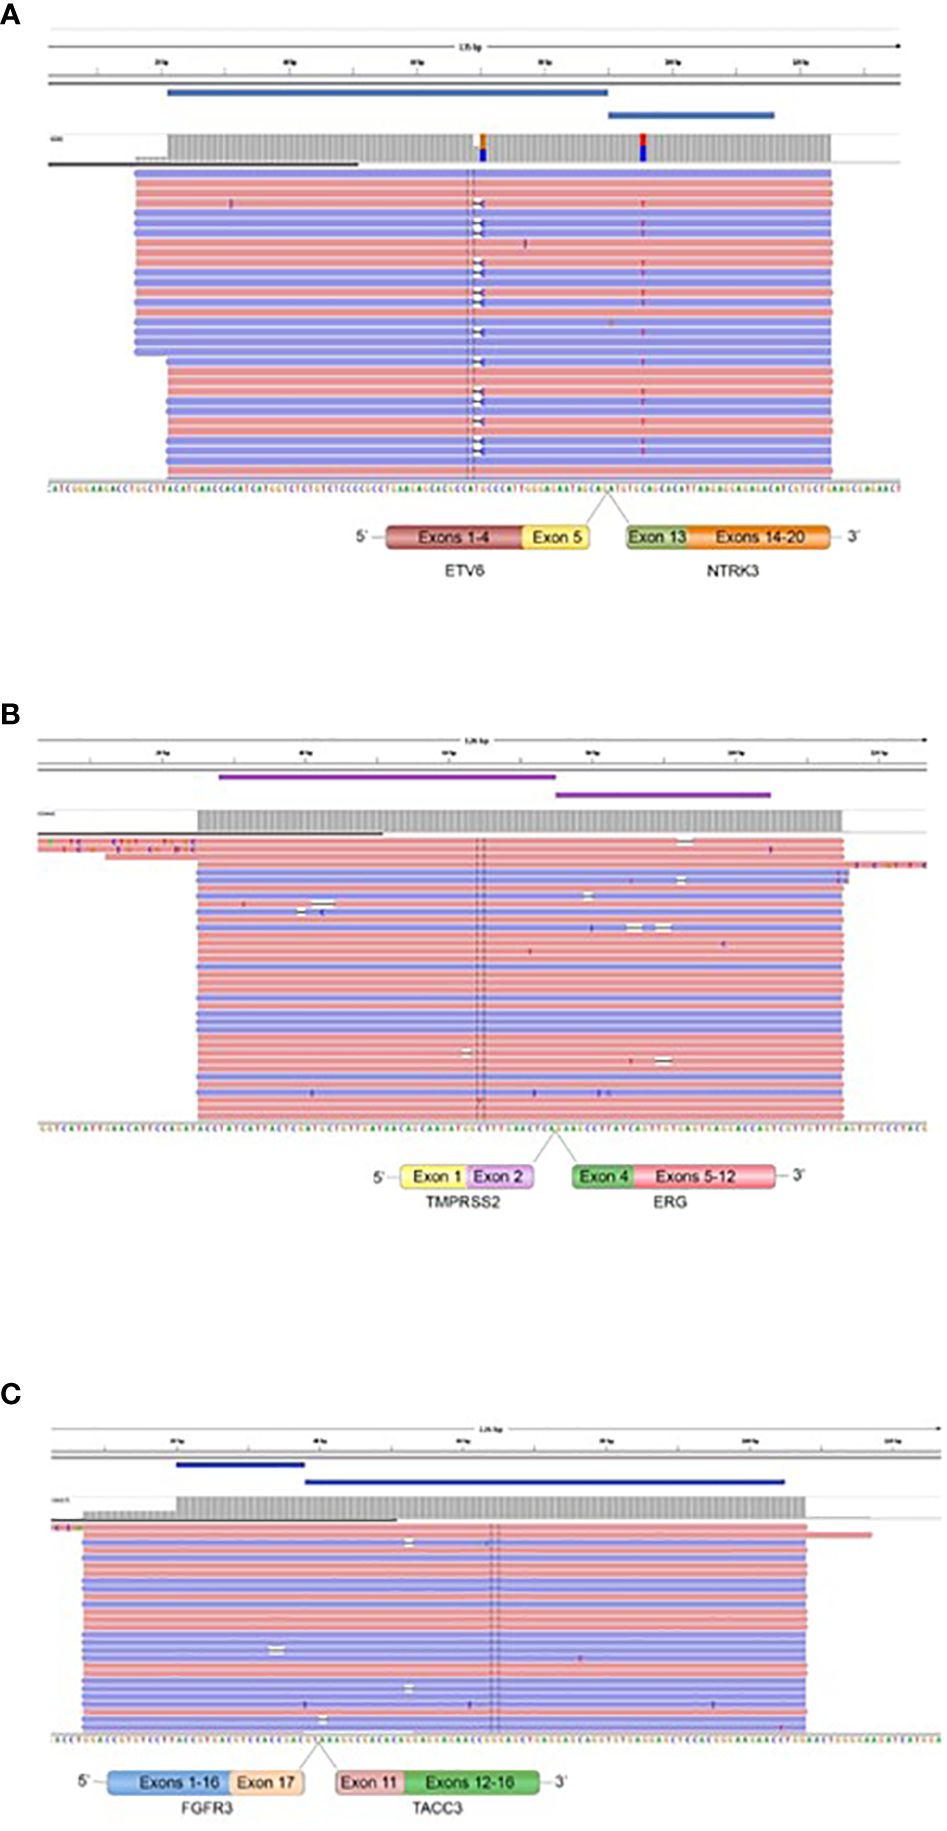
Figure 6 Fusions confirmed by targeted Next Generation Sequencing. The presence of ETV6::NTRK3 in oligodendroglioma (grade II), IDH-mutated and 1p19q co-deleted (A), TMPRSS2::ERG in prostatic carcinoma BM, endometrium BM, and oligodendroglioma (grade II), IDH-mutated and 1p19q co-deleted (B), and FGFR3::TACC3 in breast BM (C) is demonstrated by fusion amplicon panel. Visualization of RNA sequencing reads supports the fusions junctions between ETV6 exon 5 and NTRK3 exon 15, TMPRSS2 exon 2 and ERG exon 4, and FGFR3 exon 17 and TACC3 exon 11.
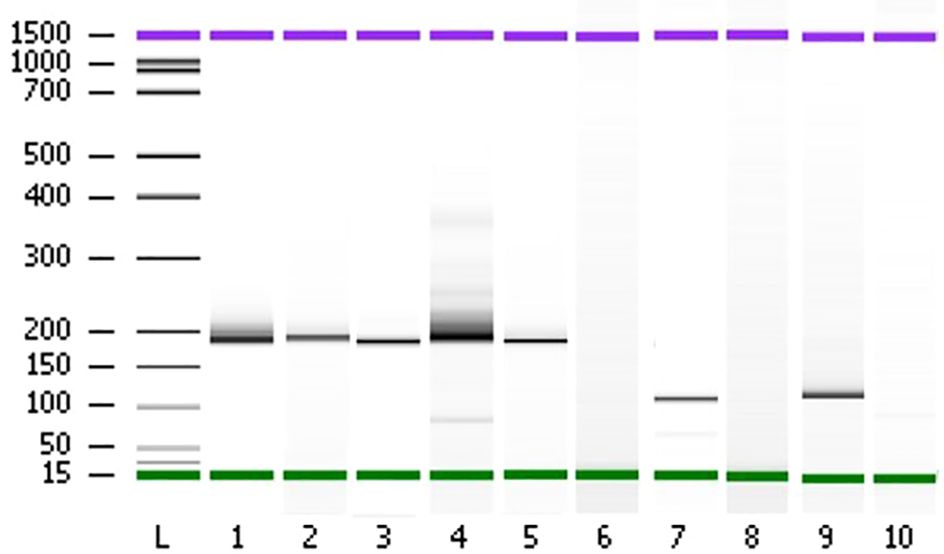
Figure 7 Polyacrylamide gel separation of the TMPRSS2 (2)::ERG (4), FGFR3 (17)::TACC3 (11), ETV6 (15)::NTRK3 (15) fusion specific RT-PCR amplicons. Samples (1–5) show one major band corresponding to the variant of the fusion between TMPRSS2 exon 2 and ERG exon 4. Sample 7 shows a variant connecting exon 5 of ETV6 and exon 15 of NTRK3. Sample 9 shows one variant fusing together FGFR3 exon 17 and TACC3 exon 11. The sample of total RNA from patient 80 which didn’t show any fusion events was used as negative controls (lanes 6, 8, and 10). L; Ladder on base pair (bp).
3.4 Exons skipping transcripts
Four patients operated for GBM IDH wild-type (grade IV) showed EGFR exons 2-7 skipping mRNA with variable levels of the number of fusion reads at 8453, 25600, 31705, and 10214 reads, respectively, to generate EGFR (1)-EGFR (8) RNA transcripts (4/59 gliomas - 6.78%) (Figure 5, Table 5). One patient operated for pancreas carcinoma BM was identified harboring METex14 skipping with 667 reads to generate MET (13)-MET (15) RNA transcripts (1/140 – 0.7%) (Figure 5, Table 5). The RNA sequence analysis supports the fusion of exon 1 to exon 8 for the EGFR gene (Figure 8) and the fusion of exon 13 to exon 15 for the MET gene (Figure 8). In contrast to DNAseq in which detection limits rely strictly on the prevalence of cancer cells present in the tumor sample, additional variation must be considered when dealing with RNAseq data, including expression of fusion genes, which can be highly variable. As can be observed in Table 5 and Figure 5, the number of reads of each alteration is highly variable between tumor samples meaning high variability of expression of these transcripts which, could be a consequence of in vivo conditions and microenvironment of each tumor sample. The more the number of reads is high the more the RNA transcript fusion is present.
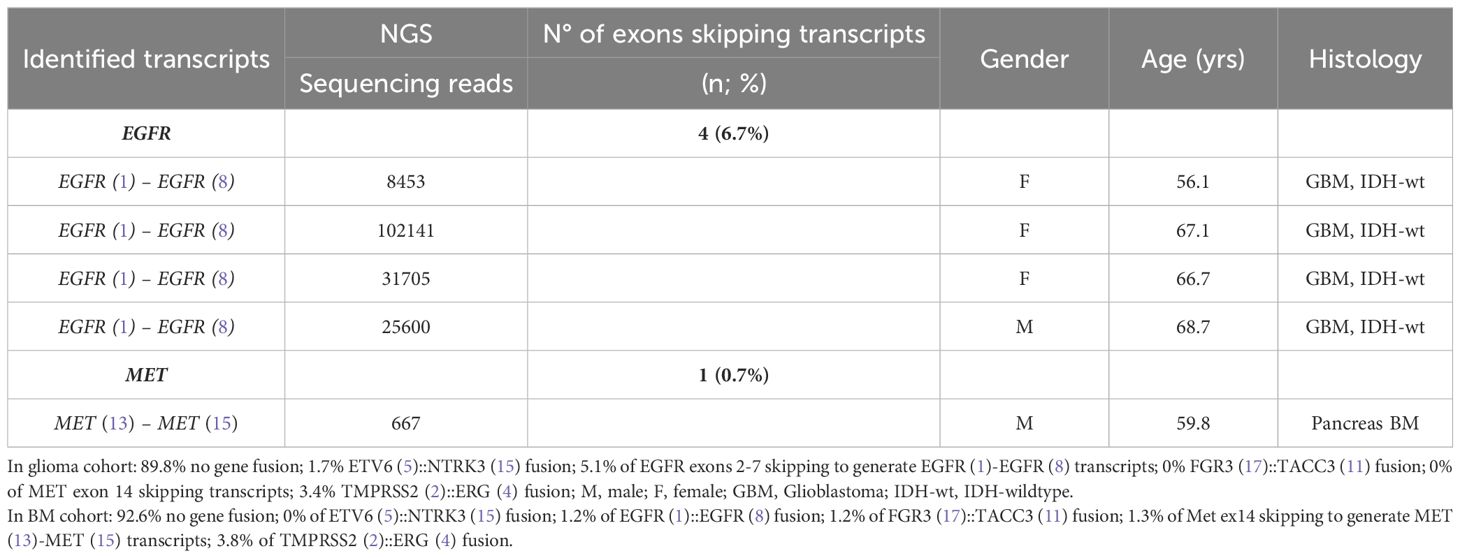
Table 5 Exons skipping transcripts and characterization of the corresponding samples.
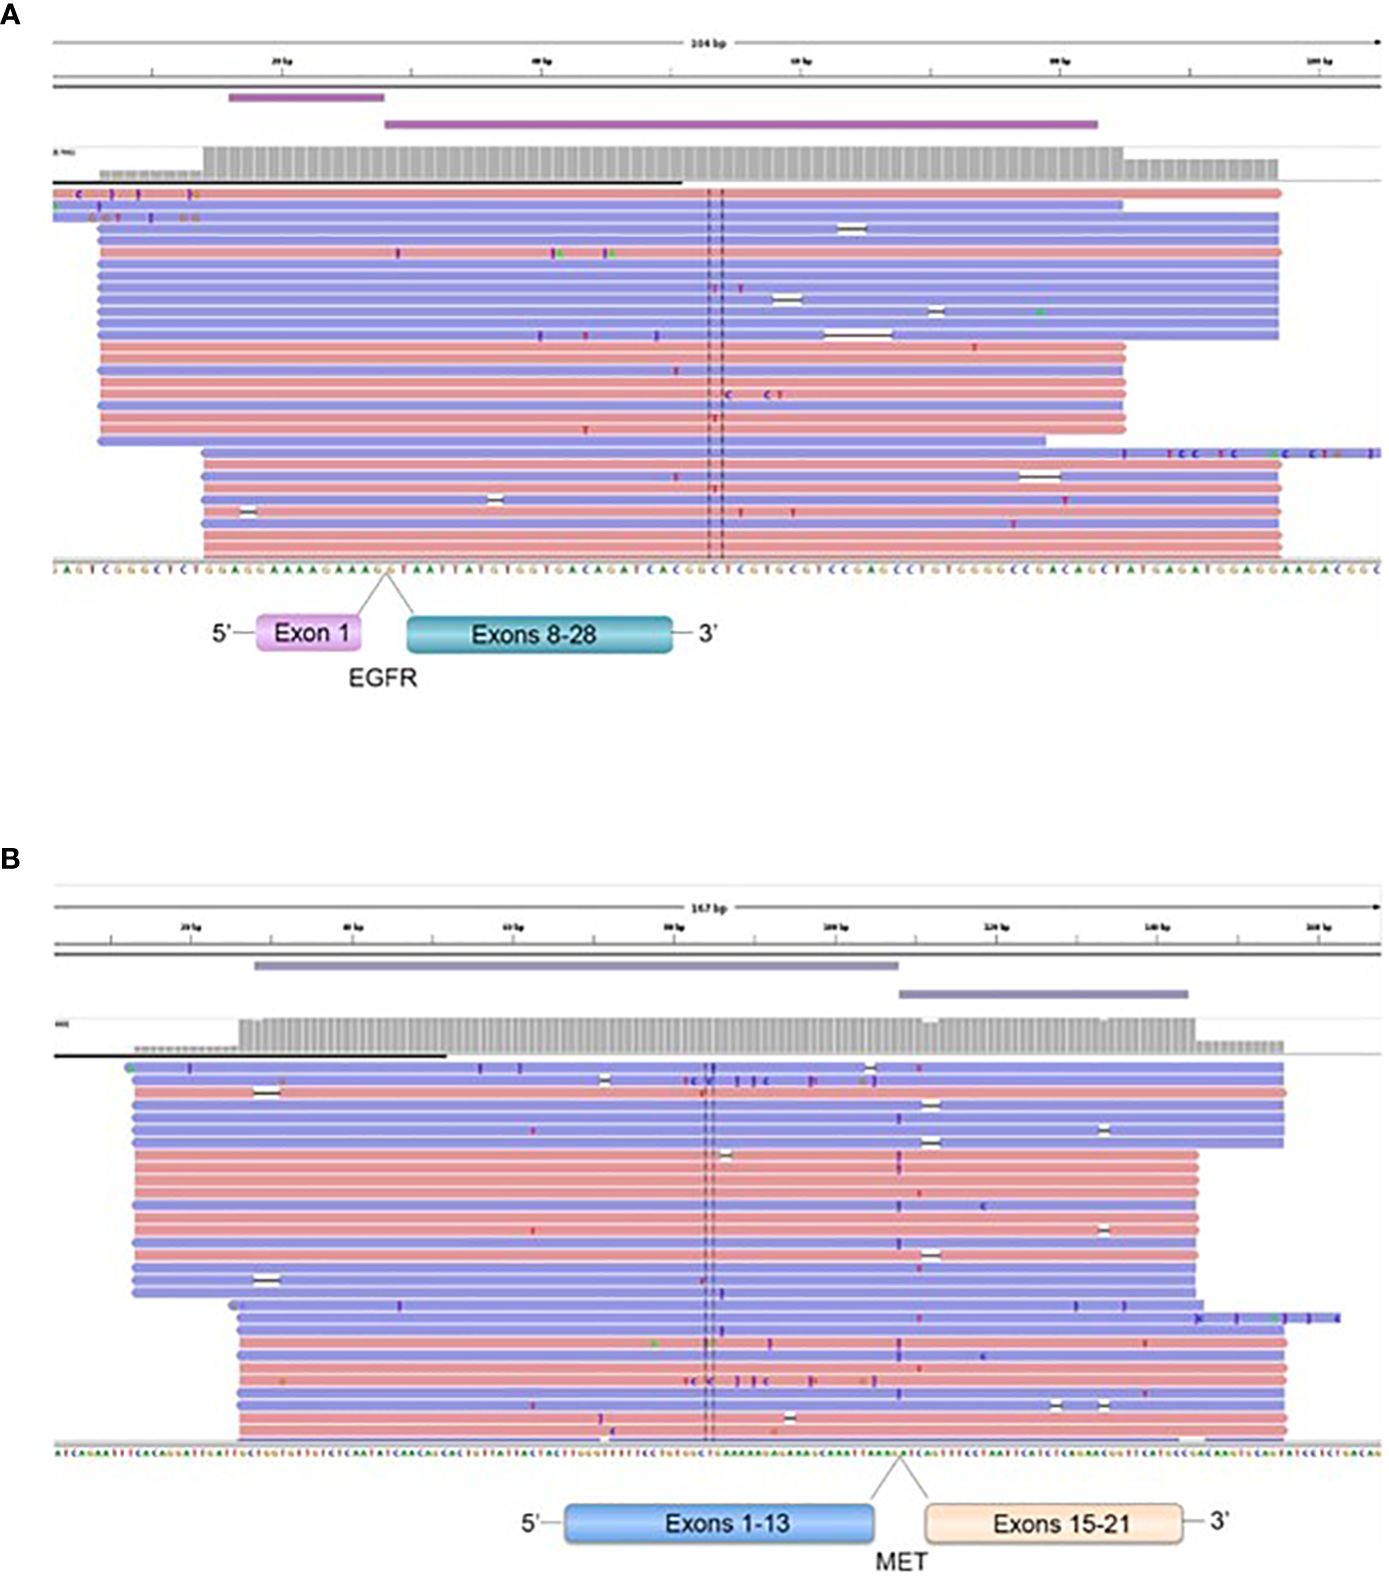
Figure 8 Representation of the EGFR (1)-EGFR (8) in a GBM patient (A), and MET (13)-MET (15) (B), fusions transcripts. Visualization of RNA sequencing reads by Next Generation Sequencing demonstrates the fusion junction between EGFR exon 1-EGFR exon 8 and MET exon 13-MET exon 15.
3.5 Brain tumors and brain metastasis molecular testing in clinics
Identifying molecular oncogenic drivers is crucial for precision oncology. Chromosomal rearrangements could result in gene fusions that lead to the expression of oncoproteins. When the fusion involves a receptor tyrosine kinase (RTK), the tyrosine kinase domain (TKD) is activated—often constitutively and ligand-independent—and downstream effectors of the receptor receive constant signaling, causing uncontrolled cell growth and invasiveness (32). Then, the tumor cell becomes dependent on this oncogenic RTK to maintain its malignant properties. This dependency, also called “oncogene addiction,” can be therapeutically approached with drugs that inhibit the activity of the oncoprotein (Figure 9). Currently, most RTKs inhibitors are designed to prevent either the binding of the ligand—often by using monoclonal or bispecific antibodies, and antibody-drug conjugates—or the binding of the ATP to the catalytic domain—mostly with small molecules (Figure 9). According to clinical guidelines, an upfront genomic profiling test should be a priority to detect targetable oncogenic alterations in gliomas and brain metastases. Different diagnostic methods, including IHC, FISH, reverse transcriptase PCR, and DNA/RNA-based NGS, can be used to detect gene fusions. However, based on the increasingly frequent need for a comprehensive genomic evaluation, NGS panels are becoming the preferred approach.
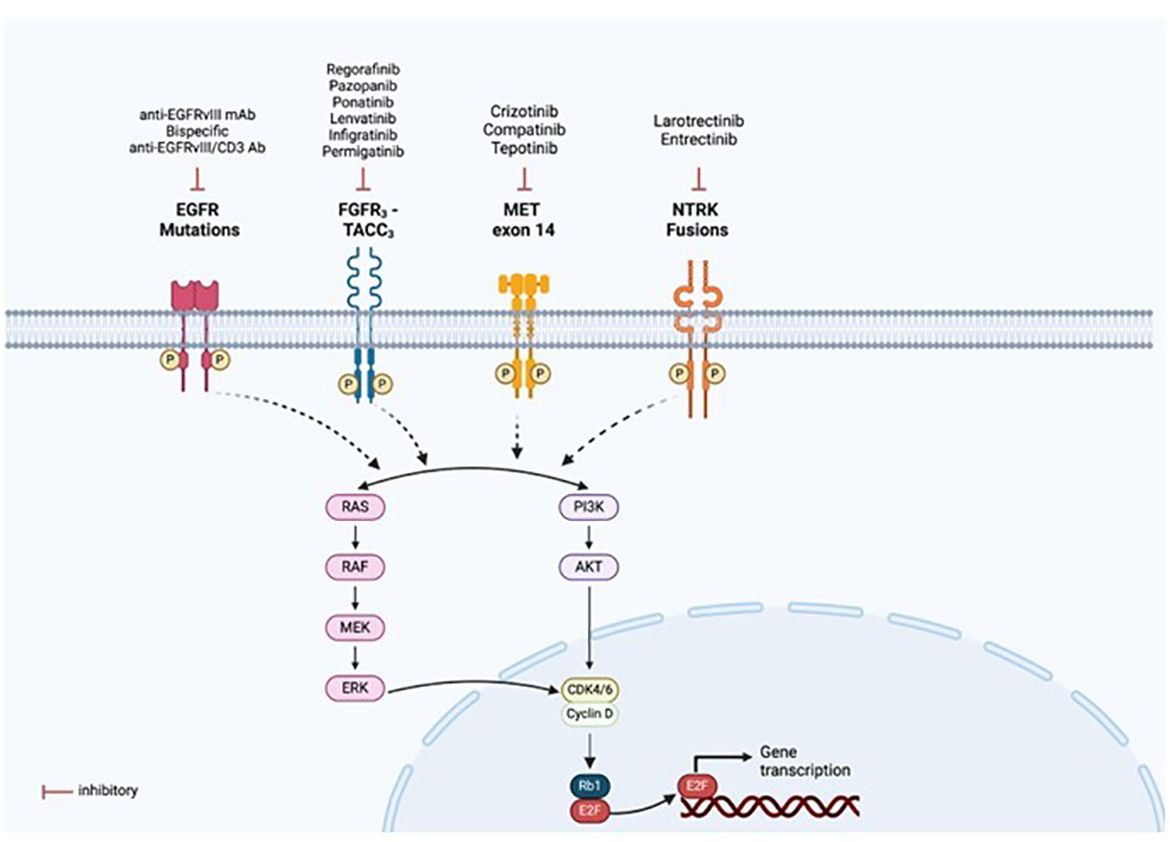
Figure 9 Targeted therapies available for the fusion proteins detected. Mutations or rearrangements in receptor tyrosine kinases (RTKs) result in constitutive activation of the kinase domain even in the absence of ligand binding and aberrant downstream signalling, leading to activation of multiple pathways, notably PI3K/AKT and RAS/MAPK. This allows for drug designs and development of targeted therapies specific to each oncogenic alteration, as illustrated in the figure. Created with BioRender.com.
4 Discussion
Tumors often utilize a recurring mechanism to achieve over-expression of oncogenic kinases, which involves fusing kinases to genes that are highly expressed in tumors or the tissue of tumor-origin (28, 33–35). Since then, targeting the fusion genes has become the primary treatment option for fusion-positive patients, given that tumors with those fusions usually exhibit strong oncogenic addiction (26, 36). In our study, we observed an ETV6 (5)::NTRK3 (15) fusion in 1.69% of diffuse IDH-mutated 1p19q co-deleted oligodendroglioma (grade II), accounting for a significant portion of glioma by this mechanism. Although a prior study observed NTRK1 fusions at an incidence of 1% in glioblastoma (37), we didn’t find any NTRK1 fusion in our series of 59 tumor samples from patients operated for low and high-grade gliomas. NTRK fusions are present in a small percentage of gliomas/neuroepithelial tumors, with an estimated incidence ranging from 0.55% to 2% (13, 14, 38, 39). However, the incidence may be higher in certain groups, such as up to 5.3% in pediatric high-grade gliomas (HGG) (15), 4% of diffuse intrinsic pontine gliomas (DIPG), and up to 40% of non-brainstem HGG in patients younger than 3 years old (33). Gliomas with NTRK fusions have been previously reported to possess co-occurring genetic alterations such as IDH (13, 14, 31), H3.3 K27M (11), H3F3A (40), EGFR amplification (13), EGFRvIII (13), PTEN (13), CDKN2A/2B deletion (11, 37), CDKN2C deletion (37), TP53 mutations/inactivation (13), and ATRX (41), among others (13). A variety of NTRK fusion types (NTRK1, NTRK2, and NTRK3) have also been described in pediatric high-grade gliomas (11). Several downstream signaling pathways, including SHC-RAS-MAPK, PI3K-AKT, PLCγ-PKC, or STAT3, are activated by the three wildtype TRK family members (42), suggesting that most NTRK fusions would use many of these downstream signaling cascades as full-length receptors. It has been demonstrated that the TRK oncogenes induce a transformation of NIH-3T3 fibroblasts and thyroid epithelial cells (43). Similarly, mammary epithelial cells was shown to be transformed using ETV6 (5)::NTRK3 (15) fusion (44). Experiments with ETV6::NTRK3 fusion showed that the fusion protein signals mainly through RAS/MAPK but also activates PI3K/AKT/mTOR. Activation of both pathways might result in a potency oncogene to stimulate proliferation and inhibits apoptosis (45). Taken together, these data support that the ETV6::NTRK3 fusion present in the oligodendroglioma (grade II) could be a driver to promote tumor growth in vivo, suggesting that NTRK inhibitors may be a valuable therapeutic option to delay or avoid the need for radiotherapy in this population.
The NTRK fusion has been previously targeted by different drugs among which the most used are the first-in class TRK-targeting inhibitors are Larotrectinib (selective TRK inhibitor) and entrectinib (pan-TRK, ROS1 and ALK inhibitor). In 2018, the United States Food and Drug Administration (FDA) approved larotrectinib, a highly specific inhibitor of all three TRK proteins, for adult and pediatric patients with solid tumors (46). Larotrectinib’s approval was based on results from three multi-center clinical studies (a phase 1 trial (NCT02122913), SCOUT (NCT02637687), and NAVIGATE (NCT02576431)) (10, 47). According to a clinical trial involving solid tumors positive for NTRK fusion, Larotrectinib showed an overall response rate of 79.1%, with a median duration of response lasting 35.2 months, and a progression-free survival of 28.2 months (48). In 2019, entrectinib, a multi-kinase inhibitor targeting TRK proteins, c-ROS oncogene 1 (ROS1), and anaplastic lymphoma kinase (ALK) was approved by the FDA for adult and pediatric patients (>12 years) with the same indication as larotrectinib (49). Entrectinib’s approval was based on results of the multi-center trials; ALKA-372-001, STARTRK-1, and STARTRK-2 (50, 51). These trials revealed a response rate of 57% in patients with TRK fusion-positive solid tumors across 10 different tumor types (50, 51). The use of inhibitors targeting TRK is associated with high response rates regardless of tumor histology and patient age (1, 2, 52).
Several studies demonstrate the activity of Larotrectinib in TRK fusion-positive primary CNS tumors regardless of histology, which confirms its capacity for blood-brain barrier penetrance as reported previously by the response observed in metastases of extra-cranial tumors to CNS (48, 53). Larotrectinib demonstrated rapid and durable responses in TRK fusion-positive primary CNS tumors, and responses were seen in patients with low- and high-grade gliomas as well as non-gliomas (54). The intracranial efficacy of Larotrectinib has been demonstrated in TRK fusion-positive tumors that have metastasized to the brain (48, 53). These results further support expanded testing for actionable therapeutic targets, including NTRK gene fusions, in patients with primary adult and pediatric CNS tumors and BM.
Members of the receptor tyrosine kinase gene family including EGFR, MET, PDGFRA, and FGFR3 have been known to be heavily involved in the initiation and progression of glioblastoma (20, 55, 56). In the present study, we also identified the presence of FGFR3 (17)::TACC3 (11) fusion in breast carcinomas BM. The constitutively active signal of FGFR3 also transduces via the RAS/MAPK pathway (57). Previously, Singh et al. reported three fusions of FGFR::TACC in 97 glioblastoma examined (20). They demonstrated that the fusion protein has oncogenic activity when introduced into astrocytes and treatment with FGFR inhibitor extends the survival of mice harboring intracranial FGFR::TACC-initiated glioma. Previously, Parker et al. reported that 4 out of 48 glioblastoma samples harbored the FGFR3::TACC3 fusion and remarkably showed that the tumorigenic FGFR3::TACC3 gene fusion escapes miR-99a regulation in glioblastoma due to the loss of the 3’-UTR of FGFR3 (57). FGFR3 is very lowly expressed in normal brain but is highly expressed in fusion positive glioblastoma that is likely due to the loss of microRNA regulation (58, 59). The 3’-UTR of the FGFR3 gene is negatively controlled by microRNAs in the normal brain. In the fusion gene, the region is lost and FGFR3 can no longer be controlled by mir-99a (58). The FGFR3::TACC3 fusion was detected in one out of 72 samples of glioblastoma in the Ivy Center cohort (60), and 2 of 161 samples in the TCGA cohort. FGFR genes fusions are also identified in other cancers, including bladder cancer, cholangiocarcinoma, squamous lung cancer, thyroid cancer, oral cancer, head and neck squamous cell carcinoma, and prostate cancer (25, 61). Clinical trials with FGFR inhibitors in brain tumors are being conducted (23, 24). The FGFR inhibitor ponatinib demonstrate an improved therapeutic activity of temozolomide on DIPG cells derived from patient in in vitro study (62).
The EGFR gene is frequently amplified and rearranged in malignant gliomas with an expression of oncogenic deletion mutants (56). In this study, we found four glioblastoma harboring EGFR exons 2-7 skipping, also known as EGFRvIII, which is constitutively auto phosphorylated and inefficiently down regulated (63).
In this study, we also identified a METex14 skipping within the RNA in pancreas carcinomas BM resulting in an in-frame deletion of the juxta-membrane domain, which normally is a negative regulator of the kinase catalytic activities. Aberrant MET/HGF regulation is observed in a wide variety of human cancers with a dysregulated proliferative and invasive signaling program, epithelial-to-mesenchymal transition, cell motility/migration, angiogenesis, invasion, and metastasis. The METex14 mutations were identified in 221 positive cases (0.6%) out of 38,028 profiled tumors in the largest tumor genomic profiling cohort performed for MET alteration (64).
This study showed also the presence of TMPRSS2 (2)::ERG (4) fusions in prostate carcinomas BM, endometrium carcinomas BM, and oligodendroglioma (grade II), IDH-mutated and 1p19q co-deleted. Studies have shown that the androgen signaling pathway plays a role in facilitating the formation of the TMPRSS2::ERG gene fusion, which is present in approximately 50% of prostate carcinomas. This pathway induces proximity of the TMPRSS2::ERG genomic loci, which are then exposed to gamma irradiation, resulting in DNA double-strand breaks (65). Ongoing clinical trials are further evaluating the prognostic and predictive value of ERG fusions in prostate cancer patients at different stages of the disease or during treatment (e.g., trials evaluating the AR signaling inhibitors enzalutamide and apalutamide, PSMA theranostics, brachytherapy; see ClinicalTrials.gov for reference) and include the analysis of ERG fusion status both in primary and secondary outcome measures.
5 Conclusion
Genomic rearrangements are the primary way fusions arise in gliomas. Although clinically relevant fusions are rare, RNA-Seq of low- and high-grade glioma samples is a crucial molecular biology technique to discover patient-specific fusions that could guide personalized treatment. FGFR1-3 fusions, like NTRK1-3, offer a therapeutic option for current and forthcoming FGFR inhibitors across various patient subgroups.
Data availability statement
The raw data supporting the conclusions of this article will be made available by the authors, without undue reservation.
Ethics statement
The studies involving humans were approved by COS (Comité d’Orientation Scientifique) de la Direction Recherche et Enseignement Ramsay Santé. The studies were conducted in accordance with the local legislation and institutional requirements. The participants provided their written informed consent to participate in this study.
Author contributions
PM: Conceptualization, Funding acquisition, Validation, Writing – original draft, Writing – review & editing. CC: Writing – review & editing. EB: Formal analysis, Resources, Validation, Writing – original draft, Writing – review & editing. NB: Methodology, Validation, Writing – review & editing. CV: Methodology, Writing – review & editing. EP: Software, Writing – review & editing. PT: Writing – review & editing. MA: Writing – review & editing. AM: Writing – review & editing. IN: Formal analysis, Methodology, Validation, Writing – review & editing. LO: Conceptualization, Funding acquisition, Writing – original draft, Writing – review & editing.
Funding
The author(s) declare financial support was received for the research, authorship, and/or publication of this article. This research was funded by Groupement de coopération Sanitaire (GCS) Ramsay Santé pour l’Enseignement et la Recherche and by Bayer Health SAS, APHM, CNRS, AMU, and ARTC Sud.
Acknowledgments
We thank V. GAGNA for her secretarial assistance.
Conflict of interest
The authors declare that the research was conducted in the absence of any commercial or financial relationships that could be construed as a potential conflict of interest.
The author(s) declared that they were an editorial board member of Frontiers, at the time of submission. This had no impact on the peer review process and the final decision
Publisher’s note
All claims expressed in this article are solely those of the authors and do not necessarily represent those of their affiliated organizations, or those of the publisher, the editors and the reviewers. Any product that may be evaluated in this article, or claim that may be made by its manufacturer, is not guaranteed or endorsed by the publisher.
References
1. Cocco E, Scaltriti M, Drilon A. NTRK fusion-positive cancers and TRK inhibitor therapy. Nat Rev Clin Oncol. (2018) 15:731–47. doi: 10.1038/s41571-018-0113-0
2. Amatu A, Sartore-Bianchi A, Siena S. NTRK gene fusions as novel targets of cancer therapy across multiple tumour types. ESMO Open. (2016) 1:e000023. doi: 10.1136/esmoopen-2015-000023
3. Huang EJ, Reichardt LF. Neurotrophins: roles in neuronal development and function. Annu Rev Neurosci. (2001) 24:677–736. doi: 10.1146/annurev.neuro.24.1.677
4. Reichardt LF. Neurotrophin-regulated signalling pathways. Philos Trans R Soc Lond B Biol Sci. (2006) 361:1545–64. doi: 10.1098/rstb.2006.1894
5. Amatu A, Sartore-Bianchi A, Bencardino K, Pizzutilo EG, Tosi F, Siena S. Tropomyosin receptor kinase (TRK) biology and the role of NTRK gene fusions in cancer. Ann Oncol. (2019) 30 Suppl 8:viii5–viii15. doi: 10.1093/annonc/mdz383
6. Nakagawara A. Trk receptor tyrosine kinases: A bridge between cancer and neural development. Cancer Lett. (2001) 169:107–14. doi: 10.1016/S0304-3835(01)00530-4
7. Vaishnavi A, Le AT, Doebele RC. TRKing down an old oncogene in a new era of targeted therapy. Cancer Discovery. (2015) 5:25–34. doi: 10.1158/2159-8290.CD-14-0765
8. Stransky N, Cerami E, Schalm S, Kim JL, Lengauer C. The landscape of kinase fusions in cancer. Nat Commun. (2014) 5:4846. doi: 10.1038/ncomms5846
9. Hsiao SJ, Zehir A, Sireci AN, Aisner DL. Detection of tumor NTRK gene fusions to identify patients who may benefit from tyrosine kinase (TRK) inhibitor therapy. J Mol Diagn. (2019) 21:553–71. doi: 10.1016/j.jmoldx.2019.03.008
10. Drilon A, Laetsch TW, Kummar S, DuBois SG, Lassen UN, Demetri GD, et al. Efficacy of larotrectinib in TRK fusion-positive cancers in adults and children. N Engl J Med. (2018) 378:731–9. doi: 10.1056/NEJMoa1714448
11. Torre M, Vasudevaraja V, Serrano J, DeLorenzo M, Malinowski S, Blandin AF, et al. Molecular and clinicopathologic features of gliomas harboring NTRK fusions. Acta Neuropathologica Commun. (2020) 8:107. doi: 10.1186/s40478-020-00980-z
12. Roosen M, Odé Z, Bunt J, Kool M. The oncogenic fusion landscape in pediatric CNS neoplasms. Acta Neuropathol. (2022) 143:427–51. doi: 10.1007/s00401-022-02405-8
13. Gatalica Z, Xiu J, Swensen J, Vranic S. Molecular characterization of cancers with NTRK gene fusions. Mod Pathol. (2019) 32:147–53. doi: 10.1038/s41379-018-0118-3
14. Ferguson SD, Zhou S, Huse JT, de Groot JF, Xiu J, Subramaniam DS, et al. Targetable gene fusions associate with the IDH wild-type astrocytic lineage in adult gliomas. J Neuropathol. Exp Neurol. (2018) 77:437–42. doi: 10.1093/jnen/nly022
15. Okamura R, Boichard A, Kato S, Sicklick JK, Bazhenova L, Kurzrock R. Analysis of NTRK alterations in pan-cancer adult and pediatric Malignancies: implications for NTRK-targeted therapeutics. JCO Precis. Oncol. (2018) 2:1–20. doi: 10.1200/PO.18.00183
16. Wu G, Diaz AK, Paugh BS, Rankin SL, Ju B, Li Y, et al. The genomic landscape of diffuse intrinsic pontine glioma and pediatric non-brainstem high-grade glioma. Nat Genet. (2014) 46:444–50. doi: 10.1038/ng.2938
17. Zhang J, Wu G, Miller CP, Tatevossian RG, Dalton JD, Tang B, et al. St. Jude Children’s Research Hospital-Washington University Pediatric Cancer Genome Project. Whole-genome sequencing identifies genetic alterations in pediatric low-grade gliomas. Nat Genet. (2013) 45:602–12. doi: 10.1038/ng.2611
18. Albert CM, Davis JL, Federman N, Casanova M, Laetsch TW. TRK fusion cancers in children: A clinical review and recommendations for screening. J Clin Oncol. (2019) 37:513–24. doi: 10.1200/JCO.18.00573
19. Helsten T, Elkin S, Arthur E, Tomson BN, Carter J, Kurzrock R. The FGFR landscape in cancer: analysis of 4,853 tumors by next-generation sequencing. Clin Cancer Res. (2016) 22:259–67. doi: 10.1158/1078-0432.CCR-14-3212
20. Singh D, Chan JM, Zoppoli P, Niola F, Sullivan R, Castano A, et al. Transforming fusions of FGFR and TACC genes in human glioblastoma. Science. (2012) 337:1231–5. doi: 10.1126/science.1220834
21. Di Stefano AL, Fucci A, Frattini V, Labussiere M, Mokhtari K, Zoppoli P, et al. Detection, characterization, and inhibition of FGFR-TACC fusions in IDH wild-type glioma. Clin Cancer Res. (2015) 21:3307–17. doi: 10.1158/1078-0432.CCR-14-2199
22. Jonsson P, Lin AL, Young RJ, DiStefano NM, Hyman DM, Li BT, et al. Genomic correlates of disease progression and treatment response in prospectively characterized gliomas. Clin Cancer Res. (2019) 25:5537–47. doi: 10.1158/1078-0432.CCR-19-0032
23. Dieci MV, Arnedos M, Andre F, Soria JC. Fibroblast growth factor receptor inhibitors as a cancer treatment: from a biologic rationale to medical perspectives. Cancer Discovery. (2013) 3:264–79. doi: 10.1158/2159-8290.CD-12-0362
24. Jimenez-Pascual A, Siebzehnrubl F. Fibroblast growth factor receptor functions in glioblastoma. Cells. (2019) 8:715. doi: 10.3390/cells8070715
25. Williams SV, Hurst CD, Knowles MA. Oncogenic FGFR3 gene fusions in bladder cancer. Hum Mol Genet. (2013) 22:795–803. doi: 10.1093/hmg/dds486
26. Marchiò C, Scaltriti M, Ladanyi M, Iafrate AJ, Bibeau F, Dietel M, et al. ESMO recommendations on the standard methods to detect NTRK fusions in daily practice and clinical research. Ann Oncol. (2019) 30:1417–27. doi: 10.1093/annonc/mdz204
27. Martin M. Cutadapt removes adapter sequences from high-throughput sequencing reads. EMBnet J. (2011) 17:10–2. doi: 10.14806/ej.17.1.200
28. Bourgois JM, Knezevich SR, Methers JA, Sorensen PHB. Molecular detection of the ETV6-NTRK3 gene fusion differentiates congenital fibrosarcoma from other childhood spindle cell tumors. Am J Surg Path. (2000) 24:937–46. doi: 10.1097/00000478-200007000-00005
29. Beadling C, Wald AI, Warrick A, Neff TL, Zhong S, Nikiforov YE, et al. A multiplexed amplicon approach for detecting gene fusions by next-generation sequencing. J Mol Diagn. (2016) 18:165–75. doi: 10.1016/j.jmoldx.2015.10.002
30. Pfarr N, Stenzinger A, Penzel R, Warth A, Dienemann H, Schirmacher P, et al. High-throughput diagnostic profiling of clinically actionable gene fusions in lung cancer. Genes Chromosomes Cancer. (2016) 55:30–44. doi: 10.1002/gcc.22297
31. Takeda M, Sakai K, Terashima M, Kaneda H, Hayashi H, Tanaka K, et al. Clinical application of amplicon-based next- generation sequencing to therapeutic decision making in lung cancer. Ann Oncol. (2015) 26:2477–82. doi: 10.1093/annonc/mdv475
32. Schram AM, Chang MT, Jonsson P, Drilon A. Fusions in solid tumours: diagnostic strategies, targeted therapy, and acquired resistance. Nat Rev Clin Oncol. (2017) 14:735–48. doi: 10.1038/nrclinonc.2017.127
33. Druker BJ. Perspectives on the development of imatinib and the future of cancer research. Nat Med. (2009) 15:1149–52. doi: 10.1038/nm1009-1149
34. Soda M, Choi YL, Enomoto M, Takada S, Yamashita Y, Ishikawa S, et al. Identification of the transforming EML4–ALK fusion gene in non-small-cell lung cancer. Nature. (2007) 448:561–6. doi: 10.1038/nature05945
35. Ju YS, Lee WC, Shin JY, Lee S, Bleazard T, Won JK, et al. A transforming KIF5B and RET gene fusion in lung adenocarcinoma revealed from whole-genome and transcriptome sequencing. Genome Res. (2012) 22:436–45. doi: 10.1101/gr.133645.111
36. Greco A, Miranda C, Pierotti MA. Rearrangements of NTRK1 gene in papillary thyroid carcinoma. Mol Cell Endocrinol. (2010) 321:44–9. doi: 10.1016/j.mce.2009.10.009
37. Kwak EL. Anaplastic lymphoma kinase inhibition in non-small- cell lung cancer. N Engl J Med. (2010) 363:1693–703. doi: 10.1056/NEJMoa1006448
38. Kim J, Lee Y, Cho HJ, Lee YE, An J, Cho GH, et al. NTRK1 fusion in glioblastoma multiforme. PloS One. (2014) 9:e91940. doi: 10.1371/journal.pone.0091940
39. Rosen EY, Goldman DA, Hechtman JF, Benayed R, Schram AM, Cocco E, et al. TRK fusions are enriched in cancers with uncommon histologies and the absence of canonical driver mutations. Clin Cancer Res. (2020) 26:1624–32. doi: 10.1158/1078-0432.CCR-19-3165
40. Clarke M, Mackay A, Ismer B, Pickles JC, Tatevossian RG, Newman S, et al. Infant high-grade gliomas comprise multiple subgroups characterized by novel targetable gene fusions and favorable outcomes. Cancer Discovery. (2020) 10:942–63. doi: 10.1158/2159-8290.CD-19-1030
41. Schram AM, Jonsson P, Drilon A, Bale TA, Hechtman JF. Benayed R.Genomic heterogeneity underlies mixed response to tropomyosin receptor kinase inhibition in recurrent glioma. JCO Precis Oncol. (2018) 2:PO.18.00089. doi: 10.1200/PO.18.00089
42. Loeb DM, Stephens RM, Copeland T, Kaplan DR, Greene LA. A trk nerve growth factor (NGF) receptor point mutation affecting interaction with phospholipase C-gamma 1 abolishes NGF-promoted peripherin induction but not neurite outgrowth. J Biol Chem. (1994) 269:8901–10. doi: 10.1016/S0021-9258(17)37053-9
43. Russell JP, Powell DJ, Cunnane M, Greco A, Portella G, Santoro M, et al. The TRK-T1 fusion protein induces neoplastic transformation of thyroid epithelium. Oncogene. (2000) 19:5729–35. doi: 10.1038/sj.onc.1203922
44. Tognon C, Knezevich SR, Huntsman D, Roskelley CD, Melnyk N, Mathers JA, et al. Expression of the ETV6-NTRK3 gene fusion as a primary event in human secretory breast carcinoma. Cancer Cell. (2002) 2:367–76. doi: 10.1016/S1535-6108(02)00180-0
45. U.S. Food and Drug A ministration. Highlights of prescribing information VITRAKVI® (Larotrectinib) (2020). Available online at: https://www.accessdata.fda.gov/drugsatfda_docs/label/2018/211710s000lbl.pdf.
46. Cook PJ, Thomas R, Kannan R, de Leon ES, Drilon A, Rosenblum MK, et al. Somatic chromosomal engineering identifies BCAN-NTRK1 as a potent glioma driver and therapeutic target. Nat Commun. (2017) 8:15987. doi: 10.1038/ncomms15987
47. Hong DS, Bauer TM, Lee JJ, Dowlati A, Brose MS, Farago AF, et al. Larotrectinib in adult patients with solid tumours: A multi-centre, open-label, phase I dose-escalation study. Ann Oncol. (2019) 30:325–31. doi: 10.1093/annonc/mdy539
48. Hong DS, DuBois SG, Kummar S, Farago AF, Albert CM, Rohrberg KS, et al. Larotrectinib in patients with TRK fusion-positive solid tumours: A pooled analysis of three phase 1/2 clinical trials. Lancet Oncol. (2020) 21:531–40. doi: 10.1016/S1470-2045(19)30856-3
49. U.S. Food and Drug Administration. Highlights of prescribing information: ROZLYTREK (Entrectinib) (2020). Available online at: https://www.accessdata.fda.gov/drugsatfda_docs/label/2019/212725s000lbl.pdf.
50. Doebele RC, Drilon A, Paz-Ares L, Siena S, Shaw AT, Farago AF, et al. trial investigators. Entrectinib in patients with advanced or metastatic NTRK fusion-positive solid tumours: integrated analysis of three phase 1-2 trials. Lancet Oncol. (2020) 21:271–82. doi: 10.1016/S1470-2045(19)30691-6
51. Drilon A, Siena S, Ou SI, Patel M, Ahn MJ, Lee J, et al. Safety and antitumor activity of the multitargeted pan-TRK, ROS1, and ALK inhibitor entrectinib: combined results from two phase I trials (ALKA-372-001 and STARTRK-1). Cancer Discovery. (2017) 7:400–9. doi: 10.1158/2159-8290.CD-16-1237
52. Khotskaya YB, Holla VR, Farago AF, Mills Shaw KR, Meric-Bernstam F, Hong DS. Targeting TRK family proteins in cancer. Pharmacol Ther. (2017) 173:58–66. doi: 10.1016/j.pharmthera.2017.02.006
53. Rosen EY, Schram AM, Young RJ, Schreyer MW, Hechtman JF, Shu CA, et al. Larotrectinib demonstrates CNS efficacy in TRK fusion-positive solid tumors. JCO Precis Oncol. (2019) 3:1–5. doi: 10.1200/po.19.00011
54. Doz F, van Tilburg CM, Geoerger B, Højgaard M, Øra I, Boni V, et al. Efficacy and safety of larotrectinib in TRK fusion-positive primary central nervous system tumors. Neuro-Oncology. (2022) 24:997–1007. doi: 10.1093/neuonc/noab274
55. Bai RY, Staedtke V, Riggins GJ. Molecular targeting of glioblastoma: drug discovery and therapies. Trends Mol Med. (2011) 17:301–12. doi: 10.1016/j.molmed.2011.01.011
56. The Cancer Genome Atlas Research Network. Comprehensive genomic characterization defines human glioblastoma genes and core pathways. Nature. (2008) 455:1061–8. doi: 10.1038/nature07385
57. Nelson KN, Meyer AN, Siari A, Campos AR, Motamedchaboki K, Donoghue DJ. Oncogenic gene fusion FGFR3-TACC3 Is regulated by tyrosine phosphorylation. Mol Cancer Res. (2016) .14:458–69. doi: 10.1158/1541-7786.MCR-15-0497
58. Parker BC, Annala MJ, Cogdell DE, Granberg KJ, Sun Y, Ji P, et al. The tumorigenic FGFR3-TACC3 gene fusion escapes miR-99a regulation in glioblastoma. J Clin Invest. (2013) 123:855–65. doi: 10.1172/JCI67144
59. Schittenhelm J, Ziegler L, Sperveslage J, Mittelbronn M, Capper D, Burghardt I, et al. FGFR3 overexpression is a useful detection tool for FGFR3 fusions and sequence variations in glioma. Neuro-Oncology Pract. (2020) 8:209–21. doi: 10.1093/nop/npaa075
60. Shah N, Lankerovich M, Lee H, Yoon JG, Schroeder B, Foltz G. Exploration of the gene fusion landscape of glioblastoma using transcriptome sequencing and copy number data. BMC Genomics. (2013) 14:818. doi: 10.1186/1471-2164-14-818
61. Wu YM, Su F, Kalyana-Sundaram S, Khazanov N, Ateeq B, Cao X, et al. Identification of targetable FGFR gene fusions in diverse cancers. Cancer Discovery. (2013) 3:636–47. doi: 10.1158/2159-8290.CD-13-0050
62. Schramm K, Iskar M, Statz B, Jaüger N, Haag D, Słabicki M, et al. DECIPHER pooled shRNA library screen identifies PP2A and FGFR signaling as potential therapeutic targets for diffuse intrinsic pontine gliomas. Neuro Oncol. (2019) 21:867–77. doi: 10.1093/neuonc/noz057
63. Ciesielski MJ, Fenstermaker RA. Oncogenic epidermal growth factor receptor mutants with tandem duplication: gene structure and effects on receptor function. Oncogene. (2000) 19:810–20. doi: 10.1038/sj.onc.1203409
64. Frampton GM, Ali SM, Rosenzweig M, Chmielecki J, Lu X, Bauer TM, et al. Activation of MET via diverse exon 14 splicing alterations occurs in multiple tumor types and confers clinical sensitivity to MET inhibitors. Cancer Discovery. (2015) 5:850–9. doi: 10.1158/2159-8290.CD-15-0285
Keywords: NTRK gene fusion, TMPRSS gene fusion, FGFR3 gene fusion, glioma, brain metastases, NGS analysis
Citation: Metellus P, Camilla C, Bialecki E, Beaufils N, Vellutini C, Pellegrino E, Tomasini P, Ahluwalia MS, Mansouri A, Nanni I and Ouafik LH (2024) The landscape of cancer-associated transcript fusions in adult brain tumors: a longitudinal assessment in 140 patients with cerebral gliomas and brain metastases. Front. Oncol. 14:1382394. doi: 10.3389/fonc.2024.1382394
Received: 05 February 2024; Accepted: 17 June 2024;
Published: 17 July 2024.
Edited by:
Gennaro Daniele, Agostino Gemelli University Polyclinic (IRCCS), ItalyReviewed by:
Vadim Kumeiko, Far Eastern Federal University, RussiaQuintino Giorgio D’Alessandris, Fondazione Policlinico Universitario “A. Gemelli” IRCCS, Italy
Copyright © 2024 Metellus, Camilla, Bialecki, Beaufils, Vellutini, Pellegrino, Tomasini, Ahluwalia, Mansouri, Nanni and Ouafik. This is an open-access article distributed under the terms of the Creative Commons Attribution License (CC BY). The use, distribution or reproduction in other forums is permitted, provided the original author(s) and the copyright owner(s) are credited and that the original publication in this journal is cited, in accordance with accepted academic practice. No use, distribution or reproduction is permitted which does not comply with these terms.
*Correspondence: Philippe Metellus, cGhpbGlwcGUubWV0ZWxsdXNAcmFtc2F5c2FudGUuZnI=