 Naoko Hattori1,2,3*†
 Hironori Takamatsu2,4†
 Naoko Iida2Naofumi Asano4
 Satoshi Yamashita5
 Gina Miku Oba6Kozue Kimura3Akihiko Yoshida7Eisuke Kobayashi4,7
 Robert Nakayama4Morio Matsumoto4Masaya Nakamura4Akira Kawai8
 Toshikazu Ushijima1,2*
- 1Department of Epigenomics, Institute for Advanced Life Sciences, Hoshi University, Tokyo, Japan
- 2Division of Epigenomics, National Cancer Center Research Institute, Tokyo, Japan
- 3Laboratory of Integrative Metabolic Regulation, Institute for Molecular and Cellular Regulation, Gunma University, Maebashi, Japan
- 4Department of Orthopaedic Surgery, Keio University School of Medicine, Tokyo, Japan
- 5Department of Life Engineering, Faculty of Engineering, Maebashi Institute of Technology, Maebashi, Japan
- 6Laboratory of Computational Genomics, Institute for Quantitative Biosciences, The University of Tokyo, Tokyo, Japan
- 7Department of Diagnostic Pathology, National Cancer Center Hospital, Tokyo, Japan
- 8Department of Musculoskeletal Oncology, National Cancer Center Hospital, Tokyo, Japan
Liposarcoma (LPS) is the most common soft-tissue sarcoma in adults, and well-differentiated liposarcoma (WDLPS) and dedifferentiated liposarcoma (DDLPS) are the most frequent subtypes. These LPSs are considered to develop due to disturbances in the adipogenic differentiation of mesenchymal stem cells. However, the molecular mechanisms underlying the disturbances remain unclear. Here, we aimed to identify the mechanism and explore its therapeutic advantages focusing upon their epigenetic alterations, known to be important in differentiation. First, we conducted a genome-wide DNA methylation analysis using 15 LPSs (6 WDLPSs and 9 DDLPSs) and 6 normal adipose tissues. Unsupervised hierarchical cluster analysis using DNA methylation profiles at enhancers classified the samples into the three histological types, whereas analysis using promoters did not. Principal component analysis revealed that normal adipose tissues and WDLPSs were grouped closely, whereas DDLPSs were scattered. Genomic regions hypermethylated in DDLPSs were enriched for enhancers, especially super-enhancers (13.5% of hypermethylated regions and 7.0% of the whole genome), which were located in the genes involved in adipogenesis, such as PPARG2 and its target genes (FABP4 and PLIN1). In addition, marked decreases in PPARG2 and FABP4 expression were confirmed in DDLPSs. Then, treatment of PPARG2-expressing DDLPS cell lines with 5-aza-2’-deoxycytidine, a DNA demethylating agent, and rosiglitazone, a PPARγ agonist, was shown to induce differentiation with enhanced expression of FABP4. These findings indicate that aberrant DNA methylation of adipogenic gene enhancers plays a crucial role in the development of DDLPS and can be a therapeutic target.
Introduction
Liposarcoma (LPS) is one of the most common adult soft-tissue sarcomas, and well-differentiated liposarcomas (WDLPS) and dedifferentiated liposarcomas (DDLPS) constitute the most frequent subtypes (48 - 58% of all LPS) (1, 2). Retroperitoneal DDLPSs have metastatic potential and showed a 6-fold increased risk of death compared to retroperitoneal WDLPSs (3, 4). Approximately 10% of DDLPS cases arise from WDLPS, and WDLPS and DDLPS share similar characteristics of genetic aberrations (5–10). Both WDLPS and DDLPS are considered to develop because of disturbances in normal adipogenic differentiation from mesenchymal stem cells (11). Among DDLPS, those in the retroperitoneum are known to have a worse prognosis than those in the extremities (12).
The involvement of epigenetic alterations has been indicated as a mechanism of disturbance in differentiation. Among multiple types of sarcomas, DNA methylation profiles successfully distinguished multiple types of sarcomas (13), and DDLPS from other types of sarcomas (14). Within LPSs, methylation-silencing of specific genes, such as CEBPA and miR-193b, was characteristic of DDLPSs (15). Even when limited to DDLPSs, DNA methylation profiles produced two groups with distinct leukocyte infiltration and disease-specific survival (16). However, despite the recent recognition of the essential role of enhancers in determining cell fate (17, 18), information on DNA methylation alterations in enhancer regions remains limited because the microarrays used in early studies had a limited number of probes in enhancer regions. Noteworthily, enhancers are particularly sensitive to aberrant DNA methylation (19), and their methylation alterations are expected to be important in disturbances in differentiation.
In this study, we aimed to elucidate the role of DNA methylation alterations in the enhancers of DDLPS development and explore the therapeutic value of targeting epigenetic disruption in DDLPS.
Materials and methods
Liposarcomas and normal adipose tissues
Frozen samples of 6 WDLPSs, 9 DDLPSs, and 6 normal adipose tissues were obtained from the National Cancer Center Biobank (Tokyo, Japan). Among them, 4 WDLPSs, 3 DDLPSs, and 6 normal adipose tissues were obtained from the extremities, and 2 WDLPSs and 6 DDLPSs were obtained from the retroperitoneum. The detailed clinical and pathological information is shown in Supplementary Table S1. For extraction of genomic DNA and total RNA, frozen normal adipose tissues and tumors were ground using a Multi-beads Shocker (Yasui Machine, Osaka, Japan). Genomic DNA was extracted using standard phenol-chloroform extraction and ethanol precipitation methods. Total RNA was extracted using ISOGEN reagent (Nippon Gene, Tokyo, Japan) and purified using the RNeasy MinElute Cleanup Kit (Qiagen, Hilden, Germany). The mean ages of the groups of WDLPS, DDLPS, and normal control were 53.5, 63.9, and 56.3 years old, respectively. The specimens were obtained with written informed consents from patients who underwent surgery. This study was approved by the Institutional Review Board of the National Cancer Center (protocol number 2004-050).
Liposarcoma cell lines
Human WDLPS cell lines (93T449 and 94T778) and DDLPS cell lines (LP6 and LSP12) were a kind gift from Dr. Andrew J Wagner at Dana-Farber Cancer Institute (Boston, MA, USA). The cells were cultured in RPMI-1640 (FUJIFILM Wako Pure Chemical Corp., Osaka, Japan) supplemented with 10% fetal bovine serum and 1% penicillin/streptomycin at 37°C in a humidified atmosphere with 5% CO2. The cells were checked for Mycoplasma infection using the MycoAlert Mycoplasma Detection Kit (Lonza, Basel, Switzerland).
Genome-wide DNA methylation analysis
Genome-wide DNA methylation analysis was performed using the Infinium MethylationEPIC BeadChip (Illumina, San Diego, CA) (v1.0 for normal adipose tissues, primary liposarcomas, and normal peripheral leukocytes, and v2.0 for DDLPS cell lines) as described previously (20, 21). Each sample was analyzed once because high analytical reproducibility is known for this microarray (22). The microarray assessed the degree of methylation of 865,860 probes (MethylationEPIC BeadChip v1.0) and 937,056 probes (MethylationEPIC BeadChip v2.0) with a β-value ranging from 0 (unmethylated) to 1 (fully methylated). For the data from MethylationEPIC BeadChip v1.0, to adjust probe design biases, β-mixture quantile (BMIQ) normalization was conducted using a web tool, MACON (23). To reduce the data size for convenience of handling, using MACON, the CpG probes were grouped into 538,616 genomic blocks (GBs) consisting of probes within 500 bp. The GBs were classified based on their locations relative to a transcription start site (TSS) [TSS200 (200 bp upstream region from TSS), TSS1500 (regions between 200 bp upstream and 1500 bp upstream from TSS), 5’-UTR, first exon, gene body, 3’-UTR, and intergenic region] and their locations against a CpG island (CGI) (N Shelf, N Shore, CGI, S Shore, S Shelf, and non-CGI). The annotation for MethylationEPIC originating from the ENCODE and FAMTOM5 projects was used to define enhancer regions. To address the issue of cellular heterogeneity, as in our previous studies (24, 25), tumor cell contents were estimated using DNA methylation statuses of 262 genomic blocks (GBs) unmethylated (β-value < 0.2) in normal peripheral leukocytes and normal adipose tissues but methylated (β-value > 0.8) in three or more of four liposarcoma cell lines (Supplementary Figure S1A). Enrichment of a binding motif compared to Refseq coding genes was conducted using ChIP-Atlas (https://chip-atlas.org).
Quantitative reverse transcription PCR
Complementary DNA (cDNA) was synthesized from total RNA using oligo-(dT)12-18 (Thermo Fisher Scientific, Waltham, MA), SuperScript III Reverse Transcriptase for primary samples and LP6 cells, and SuperScript IV for LPS12 cells. Quantification of cDNA molecules was performed by RT-qPCR using specific primers shown in Supplementary Table S1, SYBR Green I (Lonza), and the CFX Connect Real-Time PCR Detection System (Bio-Rad, Hercules, CA). The number of cDNA molecules of a target gene in a sample was determined by comparing an amplification curve with those of standard DNA samples with known copy numbers. The quantified number of target cDNA molecules was normalized to that of GAPDH cDNA molecules.
Overexpression of PPARγ2
pCMV-full-length PPARG2 vector and pCMV-nuclear transported EGFP vector were purchased from VectorBuilder (Yokohama, Japan) and were introduced into LP6 and LPS12 cell lines using Lipofectamine 2000 (Thermo Fisher Scientific). Stable clones were obtained by selection using puromycin (0.8 µg/mL for LP6 cells and 0.6 µg/mL for LPS12 cells).
Western blot analysis
Nuclear and cytoplasmic proteins were extracted using NE-PER™ Nuclear and Cytoplasmic Extraction Reagents (Thermo Fisher Scientific). Proteins were resolved using SDS-PAGE and transferred to an Immobilon-P nylon membrane (Merck Millipore, Billerica, MA). Each membrane was treated with BlockAce (Dainippon Pharmaceutical Co., Ltd., Suita, Japan) and reacted with a rabbit antibody against PPARγ (PP-A3409-00, 1:1000; Perseus Proteomics, Tokyo, Japan), a rabbit antibody against NUP98 (2598; 1:1000; Cell Signaling Technology, Danvers, MA), or a mouse antibody against TUBULIN (69-1251, 1:5000; ICN Biomedicals, Aurora, OH). After three cycles of 10-min washes in Tris-buffered saline supplemented with 0.5% Tween 20 (TBST), the blots were reacted with a secondary antibody conjugated with peroxidase (rabbit IgG, 7074, 1:1000; Cell Signaling Technology, mouse IgG, 7076, 1:1000; Cell Signaling Technology) and rewashed. Enhanced chemiluminescence detection was performed using an ECL kit (Cytiva, Marlborough, MA).
Treatment of cells with 5-aza-dC and rosiglitazone
Cells were seeded in a 6-well plate on Day 0 in triplicate (8 × 10⁴ cells/well for LP6 and 1 × 10⁵ cells/well for LPS12) and were treated with 0.3 µM of 5-aza-2’-deoxycytidine (5-aza-dC, Sigma-Aldrich, St Louis, MO) on Days 1 and 3. On Days 5 and 6, 50 µM of rosiglitazone (Sigma-Aldrich) was added to the medium. On Day 7, the cells were analyzed for morphology viability and harvested for RNA extraction. The dose and treatment schedule of 5-aza-dC were based on previous reports (20, 26, 27). Total RNA was extracted using ReliaPrep RNA Miniprep Systems (Promega, Madison, WI).
Analyses of cell morphology, cell viability, and Oil Red O staining
Cell morphology was analyzed under a phase-contrast microscope, and at least two images were captured at high magnification using a BZ-X710 microscope system (Keyence, Osaka, Japan). Cell viability was assessed using a TC10 automated cell counter (Bio-Rad Laboratories Inc., Hercules, CA). For Oil Red O staining, LP6 cells were fixed with 10% formaldehyde and incubated at 37°C for 15 min. After washing with 60% isopropanol, the samples were stained with 60% Oil Red O (Sigma-Aldrich) in isopropanol. The ratio of Oil Red O-positive lipid area to the total cell area was measured using the BZ-X (BZ-H4A) Analyzer software (six fields for mock-treated cells, and four fields for cells treated with 5-aza-dC and rosiglitazone).
Unsupervised hierarchical clustering, principal component analysis, and correlation of DNA methylation profiles
Unsupervised hierarchical clustering was conducted using R 3.61 with the Heatplus package from Bioconductor. Principal component analysis and Spearman’s correlation analysis were performed using the prcomp() and cor() functions in R.
Identification of regulatory regions and PPARγ binding sites in adipocytes
ChIP-seq data for H3K27ac in pre-adipocyte cells (hASCs) (https://www.ncbi.nlm.nih.gov/; GSM534468) (28) were downloaded and processed to categorize them into promoters, typical-enhancers, and super-enhancers using an algorithm described in a previous study (29). The read density was normalized to reads per million per base pair (rpm/bp), and all peaks were ranked along the x-axis on the total background-subtracted ChIP-seq density in increasing order. Enhancers were defined as any regions with H3K27ac peaks, excluding those within ±2000 bp of the transcription start site (TSS). Super-enhancers were distinguished from typical enhancers if their locations were above the point where the slope of the plot was 1. A gene was considered to be associated with an enhancer when its TSS was within 50 k bp of the enhancer. The ChIP-seq data for PPARγ in pre-adipocyte cells were downloaded (https://www.ncbi.nlm.nih.gov/; GSM534493 for PPARγ1 and GSM534494 for PPARγ2).
Statistical analysis
Differences in β-values and gene expression were assessed using an unpaired Student’s t-test with significance set at P < 0.05 obtained from a two-sided test. The Jonckheere-Terpstra test was used to evaluate the trend of differences in β-values among normal adipose tissues, WDLPSs, and DDLPSs. Statistical significance was set at P < 0.01. All statistical analyses were performed using Excel (Microsoft Corp., Seattle, WA).
Results
DDLPSs showed heterogeneity in DNA methylation
Genome-wide DNA methylation profiles of normal adipose tissues (n = 6), WDLPSs (n = 6), and DDLPSs (n = 9) were evaluated using Infinium MethylationEPIC BeadChip. Hierarchical clustering analysis using 30,000 GBs with the highest standard deviation (HSD) revealed that normal adipose tissues and WDLPSs showed similar profiles, whereas the profiles of DDLPSs were different (Figure 1A). When promoter CpG islands (CGIs), defined by the annotations of TSS200 and CGI, were analyzed using 1,000 GBs with HSD, DDLPSs, especially those originating from the retroperitoneum, exhibited higher methylation levels than did normal adipose tissues and WDLPSs (Figure 1A). When enhancers were analyzed using 2,000 GBs with HSD, normal adipose tissues and WDLPSs again showed similar profiles, but the former had more hypermethylated GBs. DDLPSs had very different profiles and showed both hyper- and hypomethylation (Figure 1A).
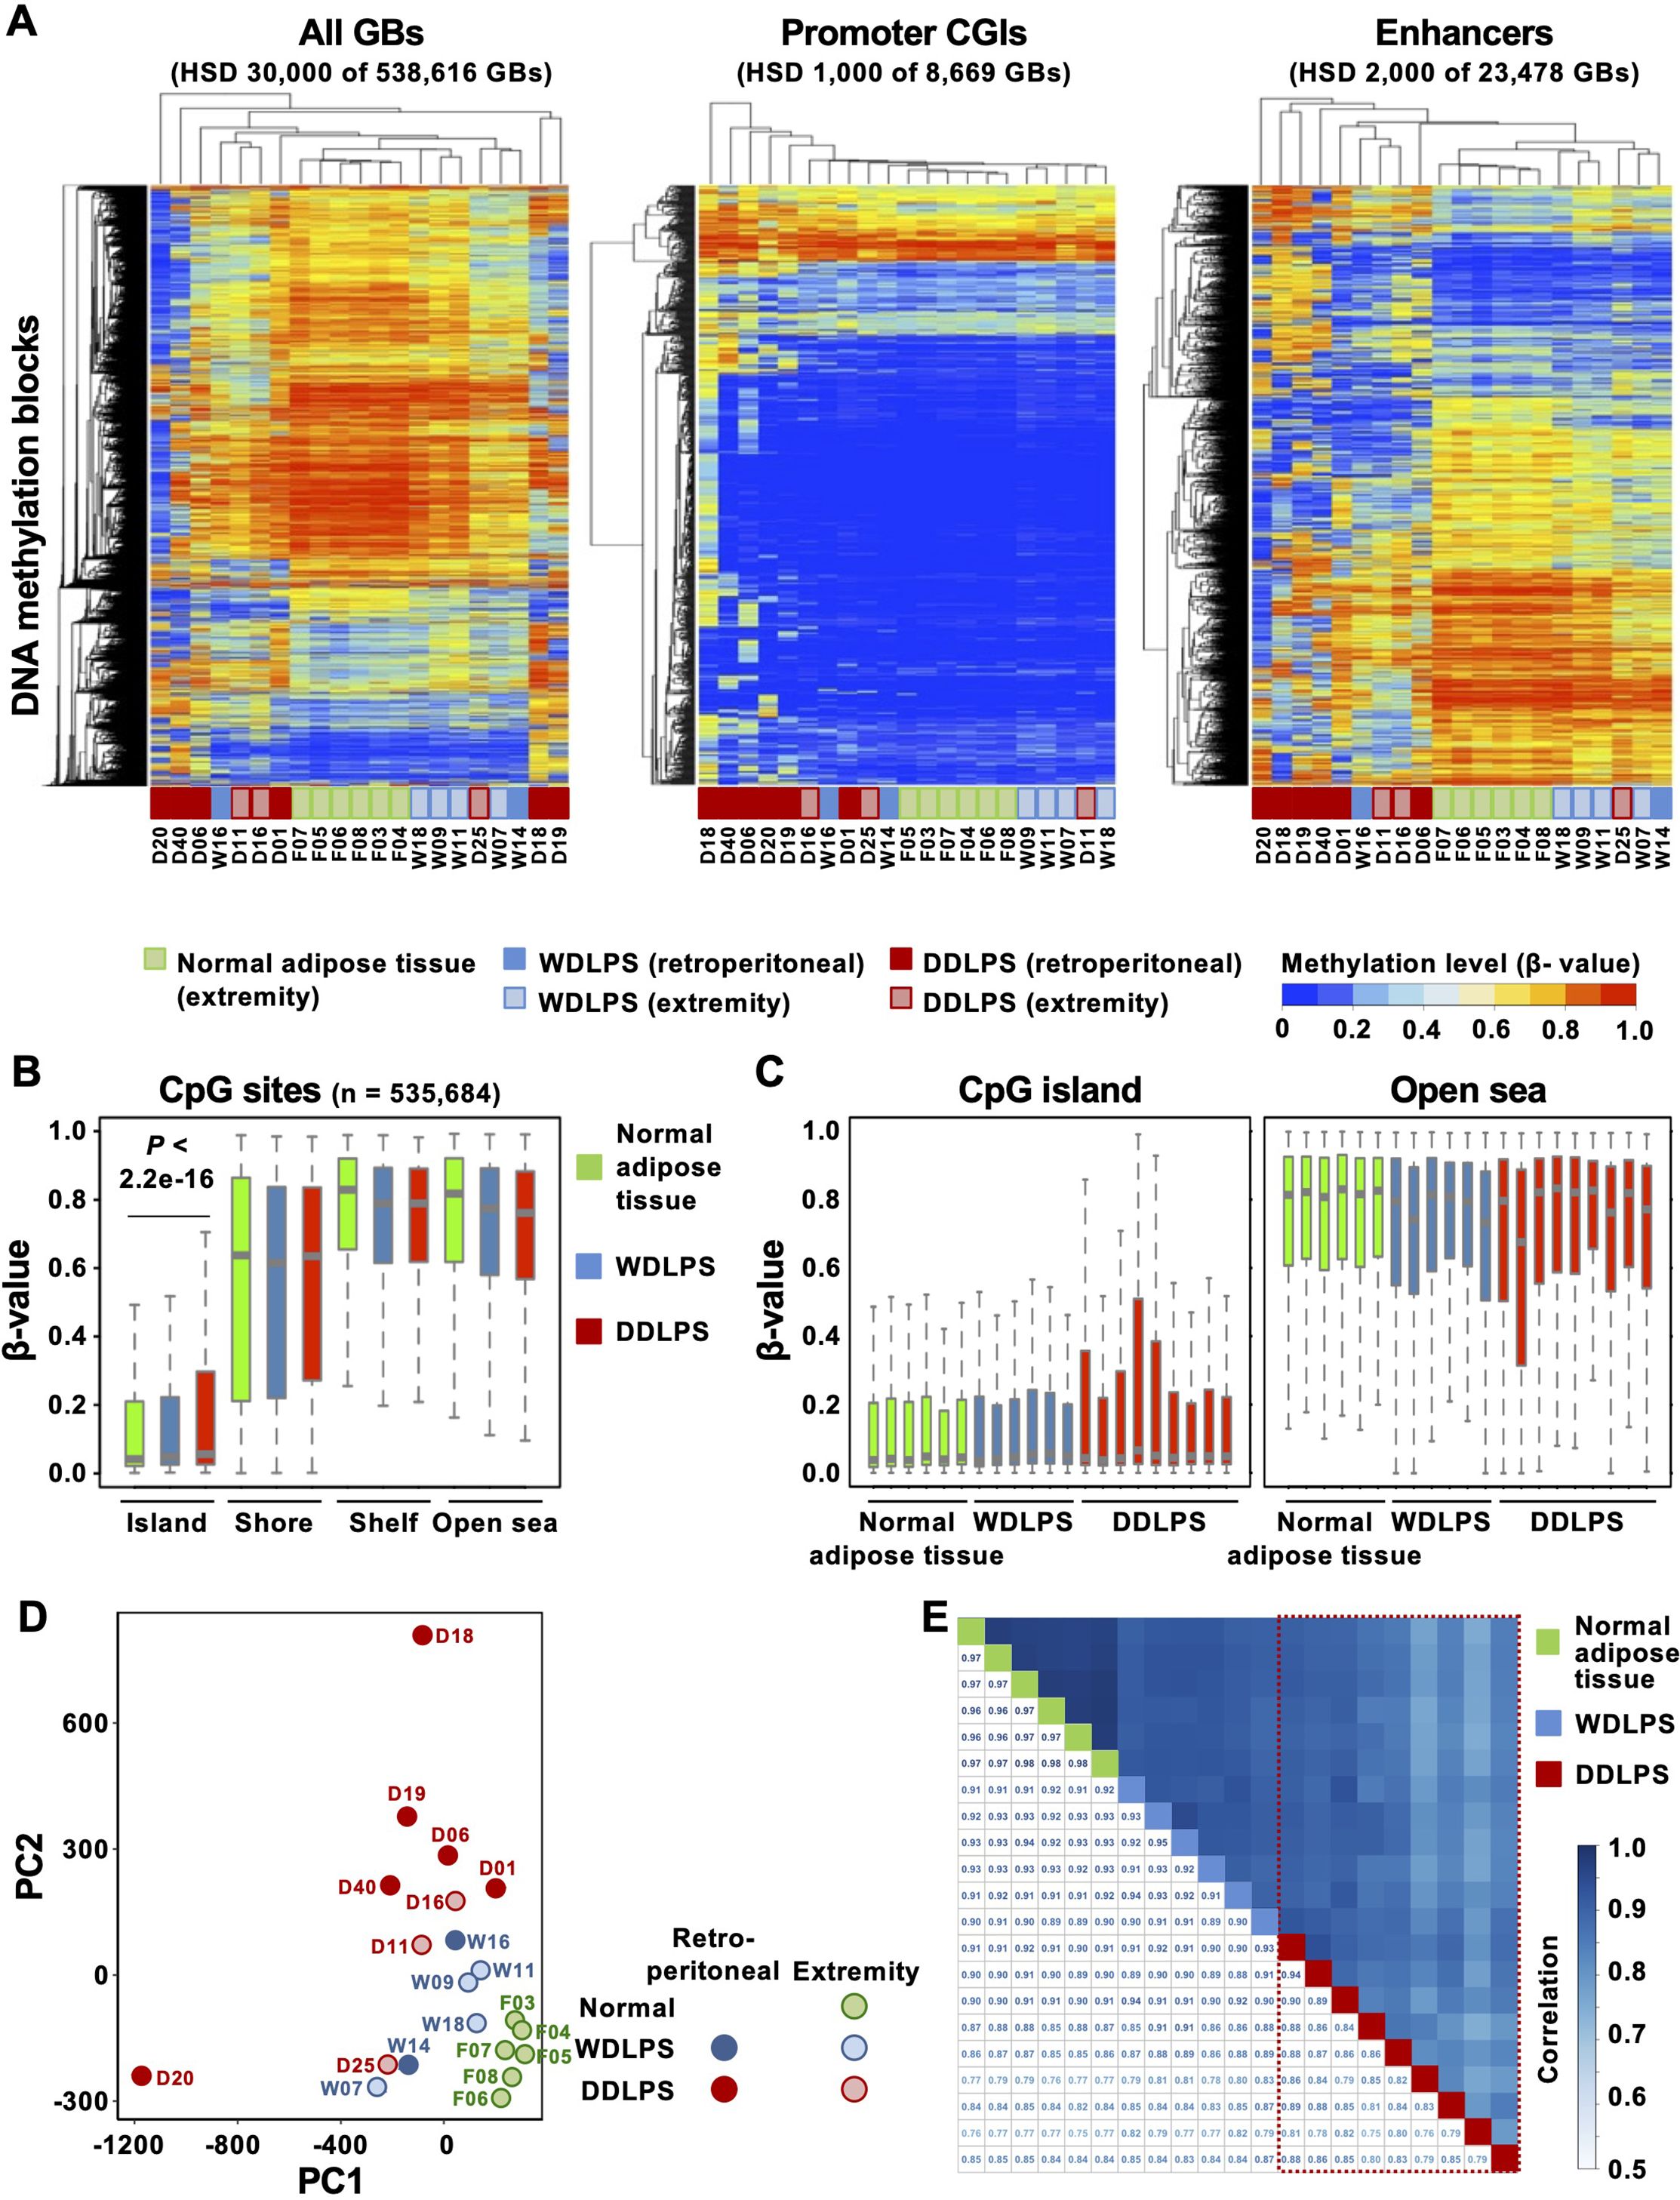
Figure 1. Genome-wide DNA methylation profiles of normal adipose tissues, well-differentiated liposarcomas (WDLPSs), and dedifferentiated liposarcomas (DDLPSs). (A) Hierarchical clustering using the genomic blocks (GBs) with the highest standard deviation (HSD). DNA methylation profiles at the enhancers classified the samples into three tissue types, whereas those at the promoters did not. (B) Box plots of β-values of CpG sites in specific regions against the CpG island (CGI). DDLPSs showed hypermethylation at CGIs, but not in the shores, shelves, or open seas. Results are shown as mean ± SE, and statistical significance was tested using an unpaired Student’s t-test. (C) Box plots of β-values of individual samples. DDLPSs showed intertumoral heterogeneity in their DNA methylation profiles. (D) Principal component analysis using all GBs. Normal adipose tissues were closely positioned, whereas DDLPSs were scattered. (E) Correlation analysis using all GBs. DDLPSs showed large variation in their degrees of correlation, whereas WDLPSs and normal adipose tissues showed high correlations.
Next, to analyze the characteristics of the genomic regions that were differentially methylated in the three groups, methylation differences were analyzed for 535,684 CpG sites based on their positions against a CGI. Those in CGIs were hypermethylated in DDLPSs, but those in the shore, shelf, and open sea were not (Figure 1B). When individual samples were analyzed, the four DDLPSs displayed higher methylation levels in CGIs than in normal adipose tissues and WDLPSs (Figure 1C). In the open sea, one DDLPS showed lower methylation levels than in WDLPSs and normal adipose tissues. This suggested the presence of intertumoral heterogeneity in DNA methylation profiles of DDLPSs.
To pursue the intertumoral heterogeneity in DNA methylation profiles of DDLPSs, we conducted principal component analysis and correlation analysis using all the samples. Principal component analysis also showed that normal adipose tissues were closely positioned, whereas DDLPSs were scattered (Figure 1D). The correlation coefficients between two of the 9 DDLPSs showed a large variation from 0.72 to 0.95 (marked by a trapezoid with a red broken line), whereas those of the 6 WDLPSs and 6 normal adipose tissues consistently had large values (0.93 to 0.96 for WDLPSs and 0.98 to 0.99 for normal adipose tissues) (Figure 1E). The influence of stromal cell contamination on DNA methylation levels was assessed by estimating tumor cell content. Since DDLPSs exhibited higher tumor cell contents than WDLPSs (Supplementary Figures S1A, B), stromal cell contents could not account for the large variation of DNA methylation levels in DDLPSs. In addition, cases D18 and D20, outliers in PCA (Figure 1D), had high tumor cell contents, excluding the influence of stromal cell contamination on the strong variation of DNA methylation levels. Together with the data from the hierarchical cluster analysis, intertumoral heterogeneity in DNA methylation was observed in DDLPSs.
Genomic regions hypermethylated in DDLPSs involved adipogenic genes
To explore the features of genomic regions methylated in DDLPSs, GBs with increasing or decreasing β-values in the order of normal adipose tissues, WDLPS, and DDLPS were isolated using the Jonckheere-Terpstra trend test Figure 2A). Among all GBs (n = 535,684), 9,945 GBs were hypermethylated in DDLPSs with Δβ-values between those of DDLPSs and normal adipose tissues (P < 0.01), and 18,791 GBs were hypomethylated (Figures 2A, B). Compared to the overall GBs, the GBs hypermethylated in DDLPSs were enriched at 5’ UTR and in the CGI shore (Supplementary Figures S2A, B) with a high fraction having a binding site of PPARγ, a master transcription factor for adipogenic differentiation (30) (Figure 2C). GBs hypomethylated in DDLPSs were enriched in the intergenic regions and were excluded from CGIs. Enrichment analysis using ChIP-Atlas showed that GBs hypermethylated in DDLPSs significantly overlapped the binding sites of transcription regulators, such as CTCF, SMARCC1, PPARγ, JUN, and MED1 (Supplementary Figure S2C), whereas hypomethylated GBs did not show significant overlap.
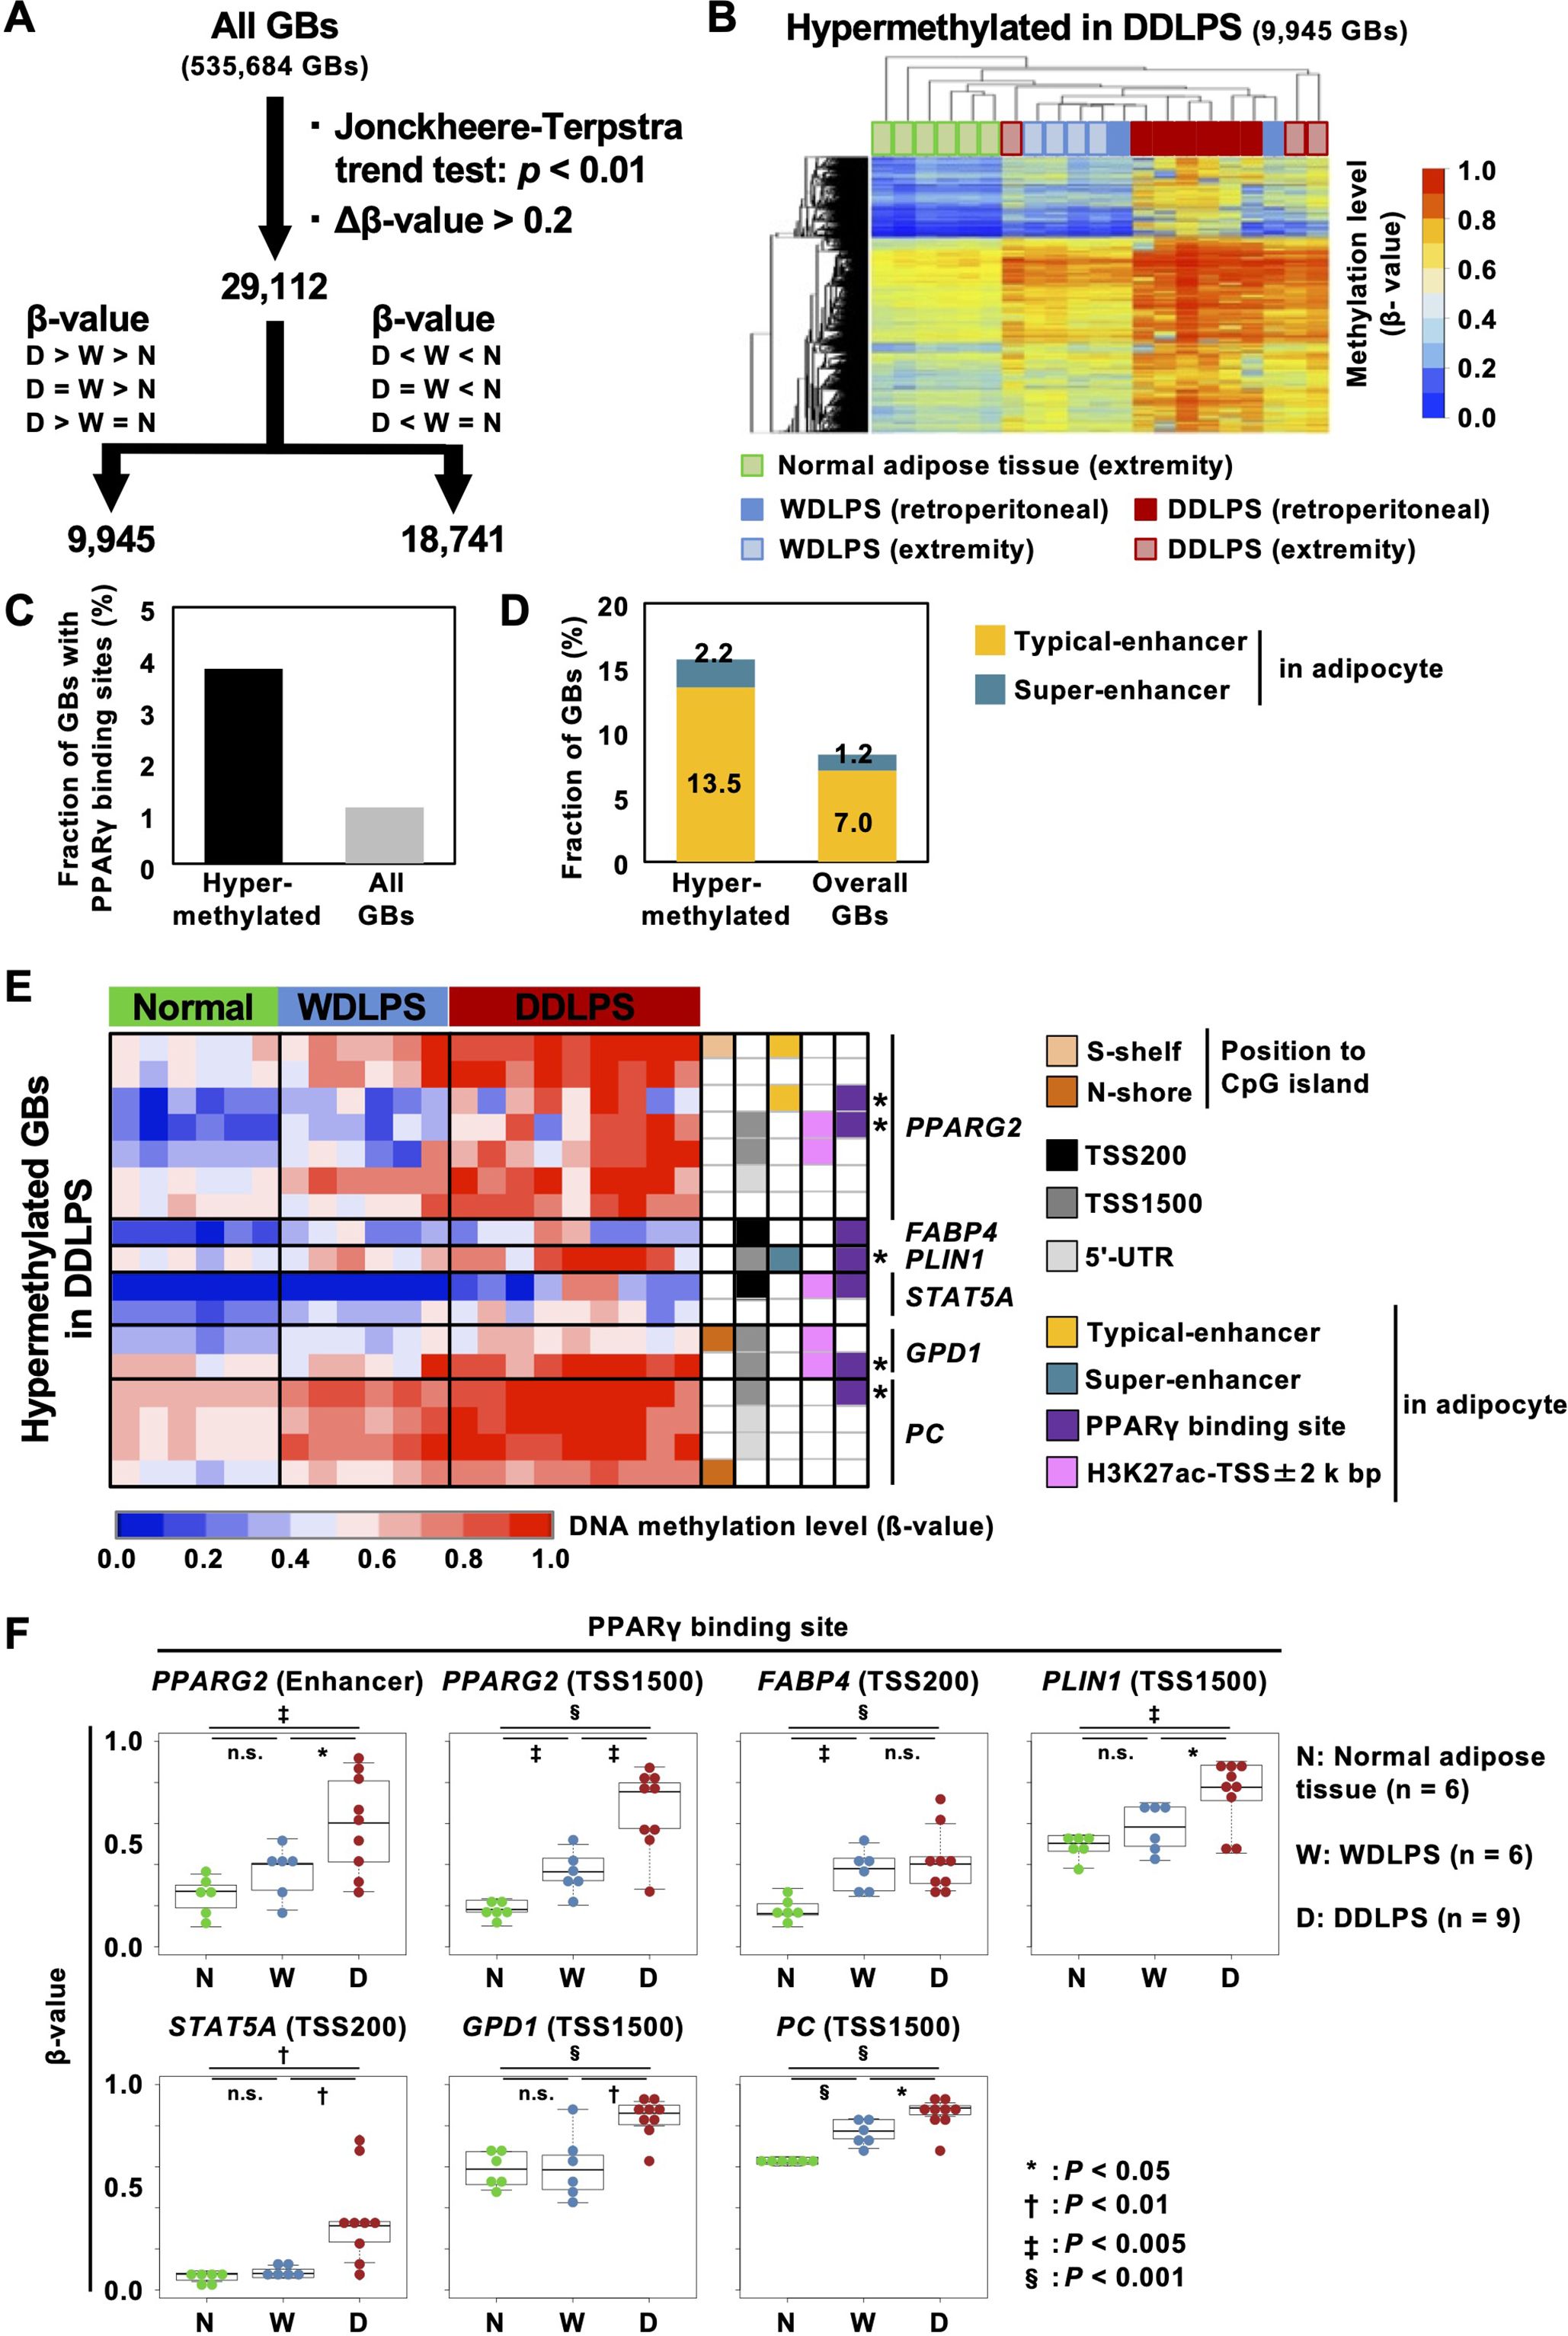
Figure 2. Characteristics of GBs hypermethylated in DDLPSs. (A) Identification of differentially methylated regions in DDLPSs using the Jonckheere-Terpstra trend test. A total of 29,112 GBs were identified as GBs significantly different among the three groups. (B) Heatmap of GBs hypermethylated in DDLPSs. A total of 9,945 GBs were hypermethylated in DDLPSs. (C) Fraction of GBs with PPARγ binding sites. The GBs hypermethylated in DDLPSs had a high chance of containing a PPARγ binding site. (D) Fraction of GBs overlapping typical and super-enhancers in adipocytes. The GBs hypermethylated in DDLPSs were enriched in super-enhancers in adipocytes. (E) DNA methylation statuses of the downstream genes of PPARγ. Asterisks indicate PPARγ binding sites heavily methylated in DDLPSs. The regulatory regions of PPARγ target genes, such as PPARG, FABP4, PLIN1, STAT5A, GPD1, and PC, were methylated in DDLPSs. (F) DNA methylation levels of PPARγ binding sites. DNA methylation levels of PPARγ binding sites in DDLPSs were significantly increased compared with those of normal adipose tissues and WDLPSs.
Among the hypermethylated binding sites, the presence of a binding site of PPARγ suggested a possibility that genes involved in adipogenesis were dysregulated by enhancer hypermethylation in DDLPSs and that this led to a disturbance in adipogenic differentiation. To explore this possibility, we first isolated GBs marked with histone H3K27 acetylation in adipocytes based on a previous report (28) and classified them into typical and super-enhancers (Supplementary Figure S2D). Compared to the overall GBs, the GBs hypermethylated in DDLPSs frequently overlapped with the typical and super-enhancer GBs (Figure 2D).
When downstream genes of PPARγ, such as PPARG, FABP4, PLIN1, STAT5A, GPD1, and PC, were analyzed, PPARG2 enhancers, upstream regions of GPD1 and PC (TSS1500), and PLIN1 super-enhancer with PPARγ binding sites were highly methylated in DDLPSs (shown with asterisks in Figure 2E, Supplementary Figure S3). In addition, the FABP4 promoter with a PPARγ binding site was also methylated in DDLPSs. A significant increase in DNA methylation levels of PPARγ binding sites in DDLPSs compared to normal adipose tissues and WDLPSs was confirmed by statistical analysis (Figure 2F). We examined the DNA methylation levels of additional genes involved in adipogenesis, namely SREBF1, CEBPA, CEBPB, CFD, and LPL, and found that the upstream regions of SREBF1 and CFD exhibited higher methylation levels in DDLPSs than in normal adipose tissues and WDLPSs (Supplementary Figure S6A). Importantly, aberrant methylation of PPARγ downstream genes in DDLPSs was also observed in an independent cohort from the TCGS-SARC database (Supplementary Figure S4).
Hypermethylated adipogenic genes were downregulated in DDLPSs
To analyze the impact of DNA methylation on gene expression, the expression of adipogenic genes in normal adipose tissues (n = 5), WDLPSs (n = 11), and DDLPSs (n = 18) was analyzed using RT-qPCR. One transcript variant of PPARG, PPARG1 known to be expressed in nearly all cells, was highly expressed in normal adipose tissues and in approximately 60% of WDLPSs. In contrast, only 10% of DDLPSs expressed PPARG1, and the remaining DDLPSs had downregulation of PPARG1. The PPARG1 promoter itself was not methylated in any of the nine DDLPSs (data not shown). The other transcript variant of PPARG, PPARG2, whose expression is restricted to adipose tissue, was expressed in normal adipose tissues and in a half of the WDLPSs, but downregulated in most of DDLPS (Figure 3). The proximal enhancers of PPARG2 (shown by * in Figure 2E) were methylated (β-value ≥ 0.6) in five of nine DDLPSs, but in none of six WDLPSs and six normal adipose tissues (Figure 2E). Two PPARγ target genes, STAT5A and FABP4, were expressed in normal adipose tissues and WDLPSs but downregulated in DDLPSs (Figure 3). Protein downregulation of FABP4 in DDLPS was previously reported (31). Among the DDLPSs, those with complete loss of STAT5A expression had high DNA methylation levels, suggesting the importance of DNA methylation of its promoter.
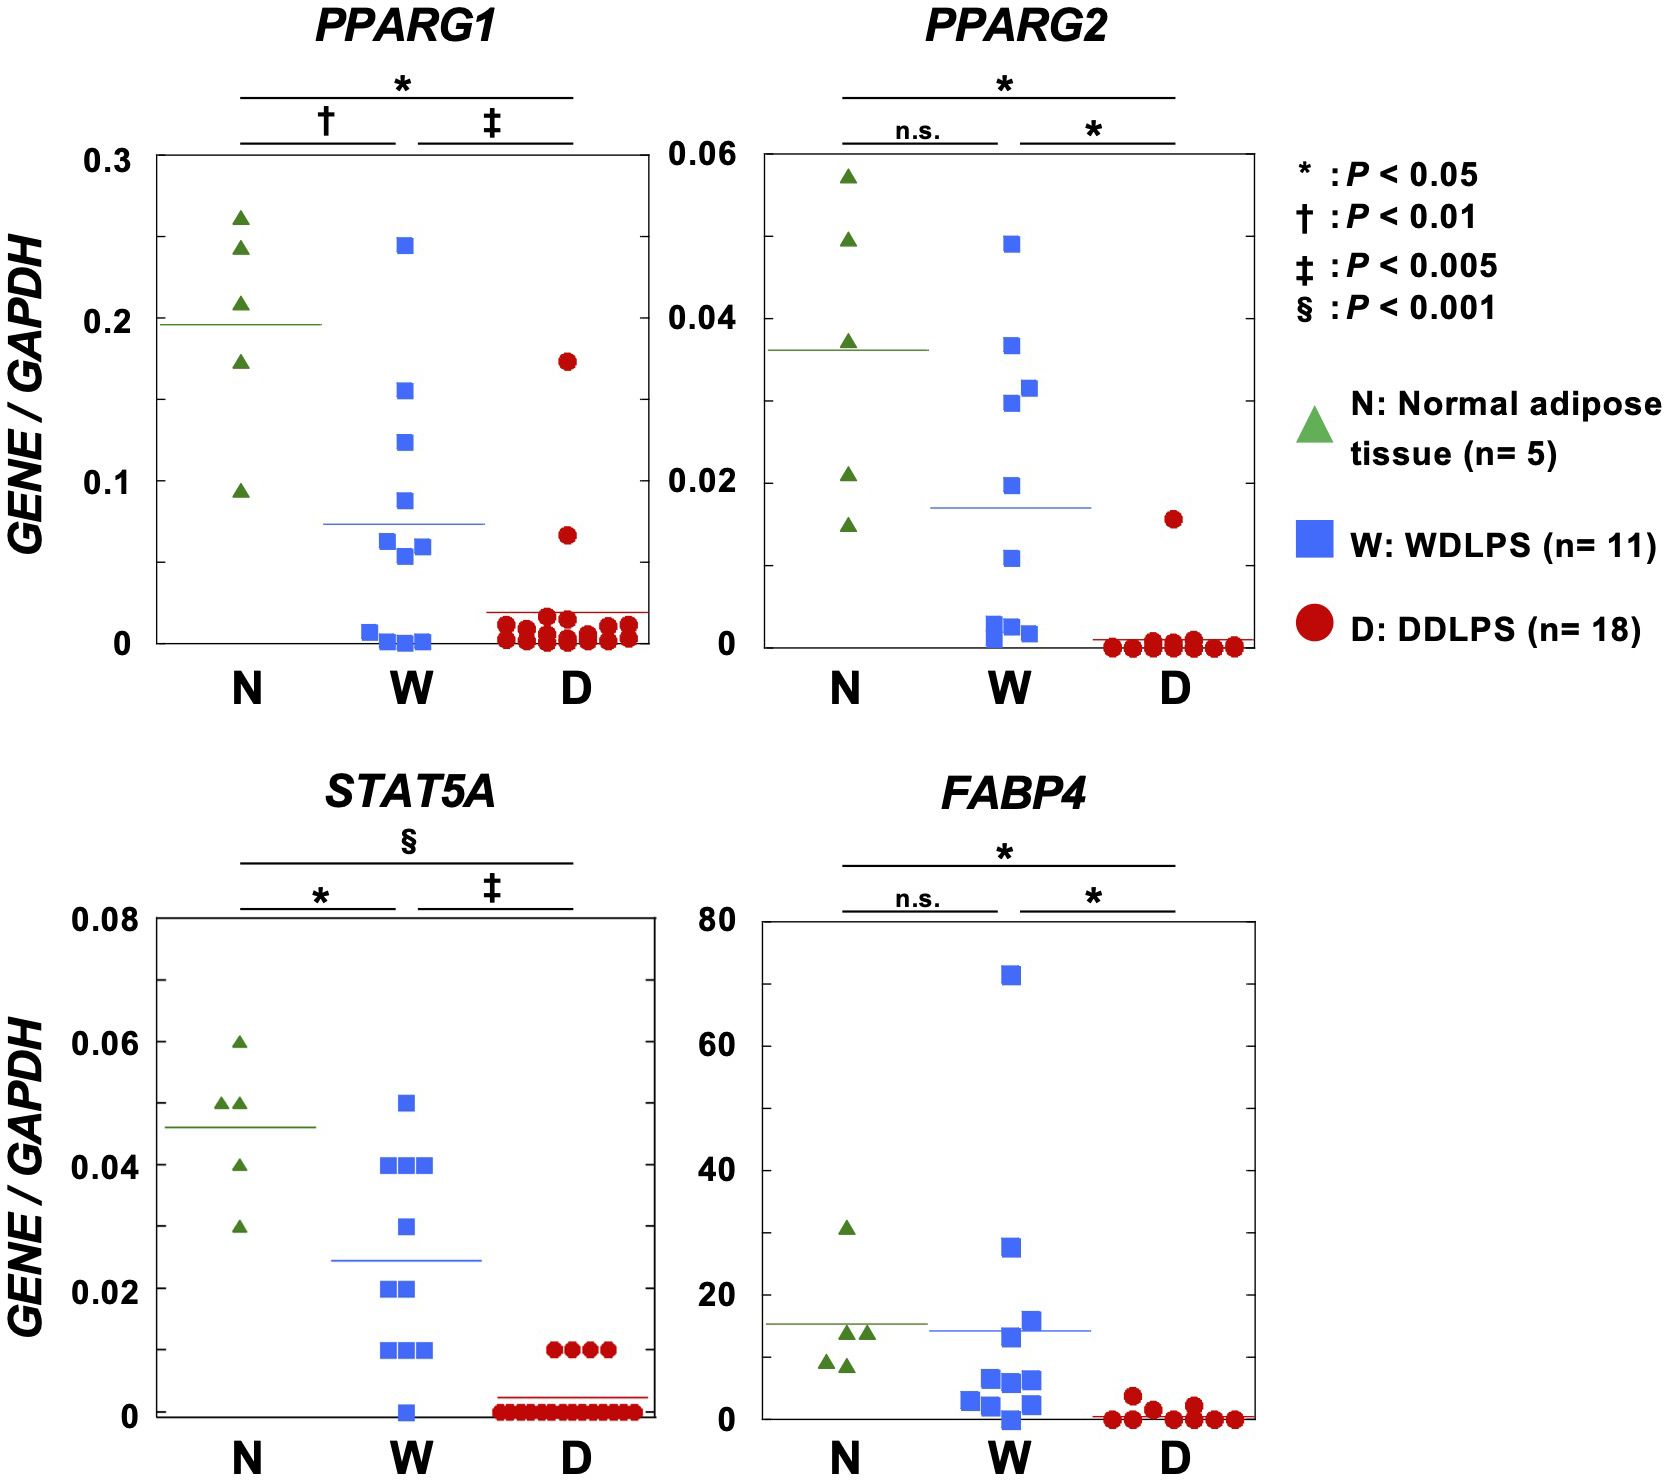
Figure 3. Expression levels of adipogenic genes in normal adipose tissues, primary WDLPSs, and DDLPSs. STAT5A, FABP4, and two transcript variants of PPARG were downregulated in primary DDLPSs. Statistical significance was tested using an unpaired Student’s t-test. *P < 0.05, †P < 0.01, ‡P < 0.005, §P < 0.001.
DNA demethylating agent enhanced adipose differentiation together with PPARγ2
The PPARγ agonist is known to induce differentiation of liposarcoma to adipose tissues (32, 33), but a phase II trial of rosiglitazone against liposarcoma showed no clinical response (34). In the present study, based on the presence of aberrant DNA methylation of genes involved in adipogenesis, we hypothesized that when combined with a DNA demethylating agent, rosiglitazone may be effective in inducing DDLPS differentiation.
As PPARG itself was downregulated in DDLPSs (Figure 3), we first introduced the PPARG2 transcript isoform into LP6 and LSP12 cells and confirmed sufficient expression of the PPARγ2 protein (Figure 4A for LP6). To investigate the enhancing effects of 5-aza-2’-deoxycytidine (5-aza-dC) on the rosiglitazone-induced differentiation, LP6 and LPS12 cells expressing EGFP or PPARG2 were first treated with 0.3 µM of 5-aza-dC for 3 d, then treated with 50 µM of rosiglitazone for an additional 2 d (Supplementary Figure S5A). Differences in cell morphology were unclear between EGFP- and PPARG2-expressing LP6 and LPS12 cells when 5-aza-dC and rosiglitazone were added (Figure 4B, Supplementary Figure S5B). Treatment with 5-aza-dC decreased the number of both EGFP- and PPARG2-expressing LP6 and LPS12 cells, showing a repressive effect of 5-aza-dC on cell growth (Figure 4C). An increase in Oil Red O-positive cells was observed among PPARG2-expressing LP6 cells treated with 5-aza-dC and rosiglitazone (Figure 4D).
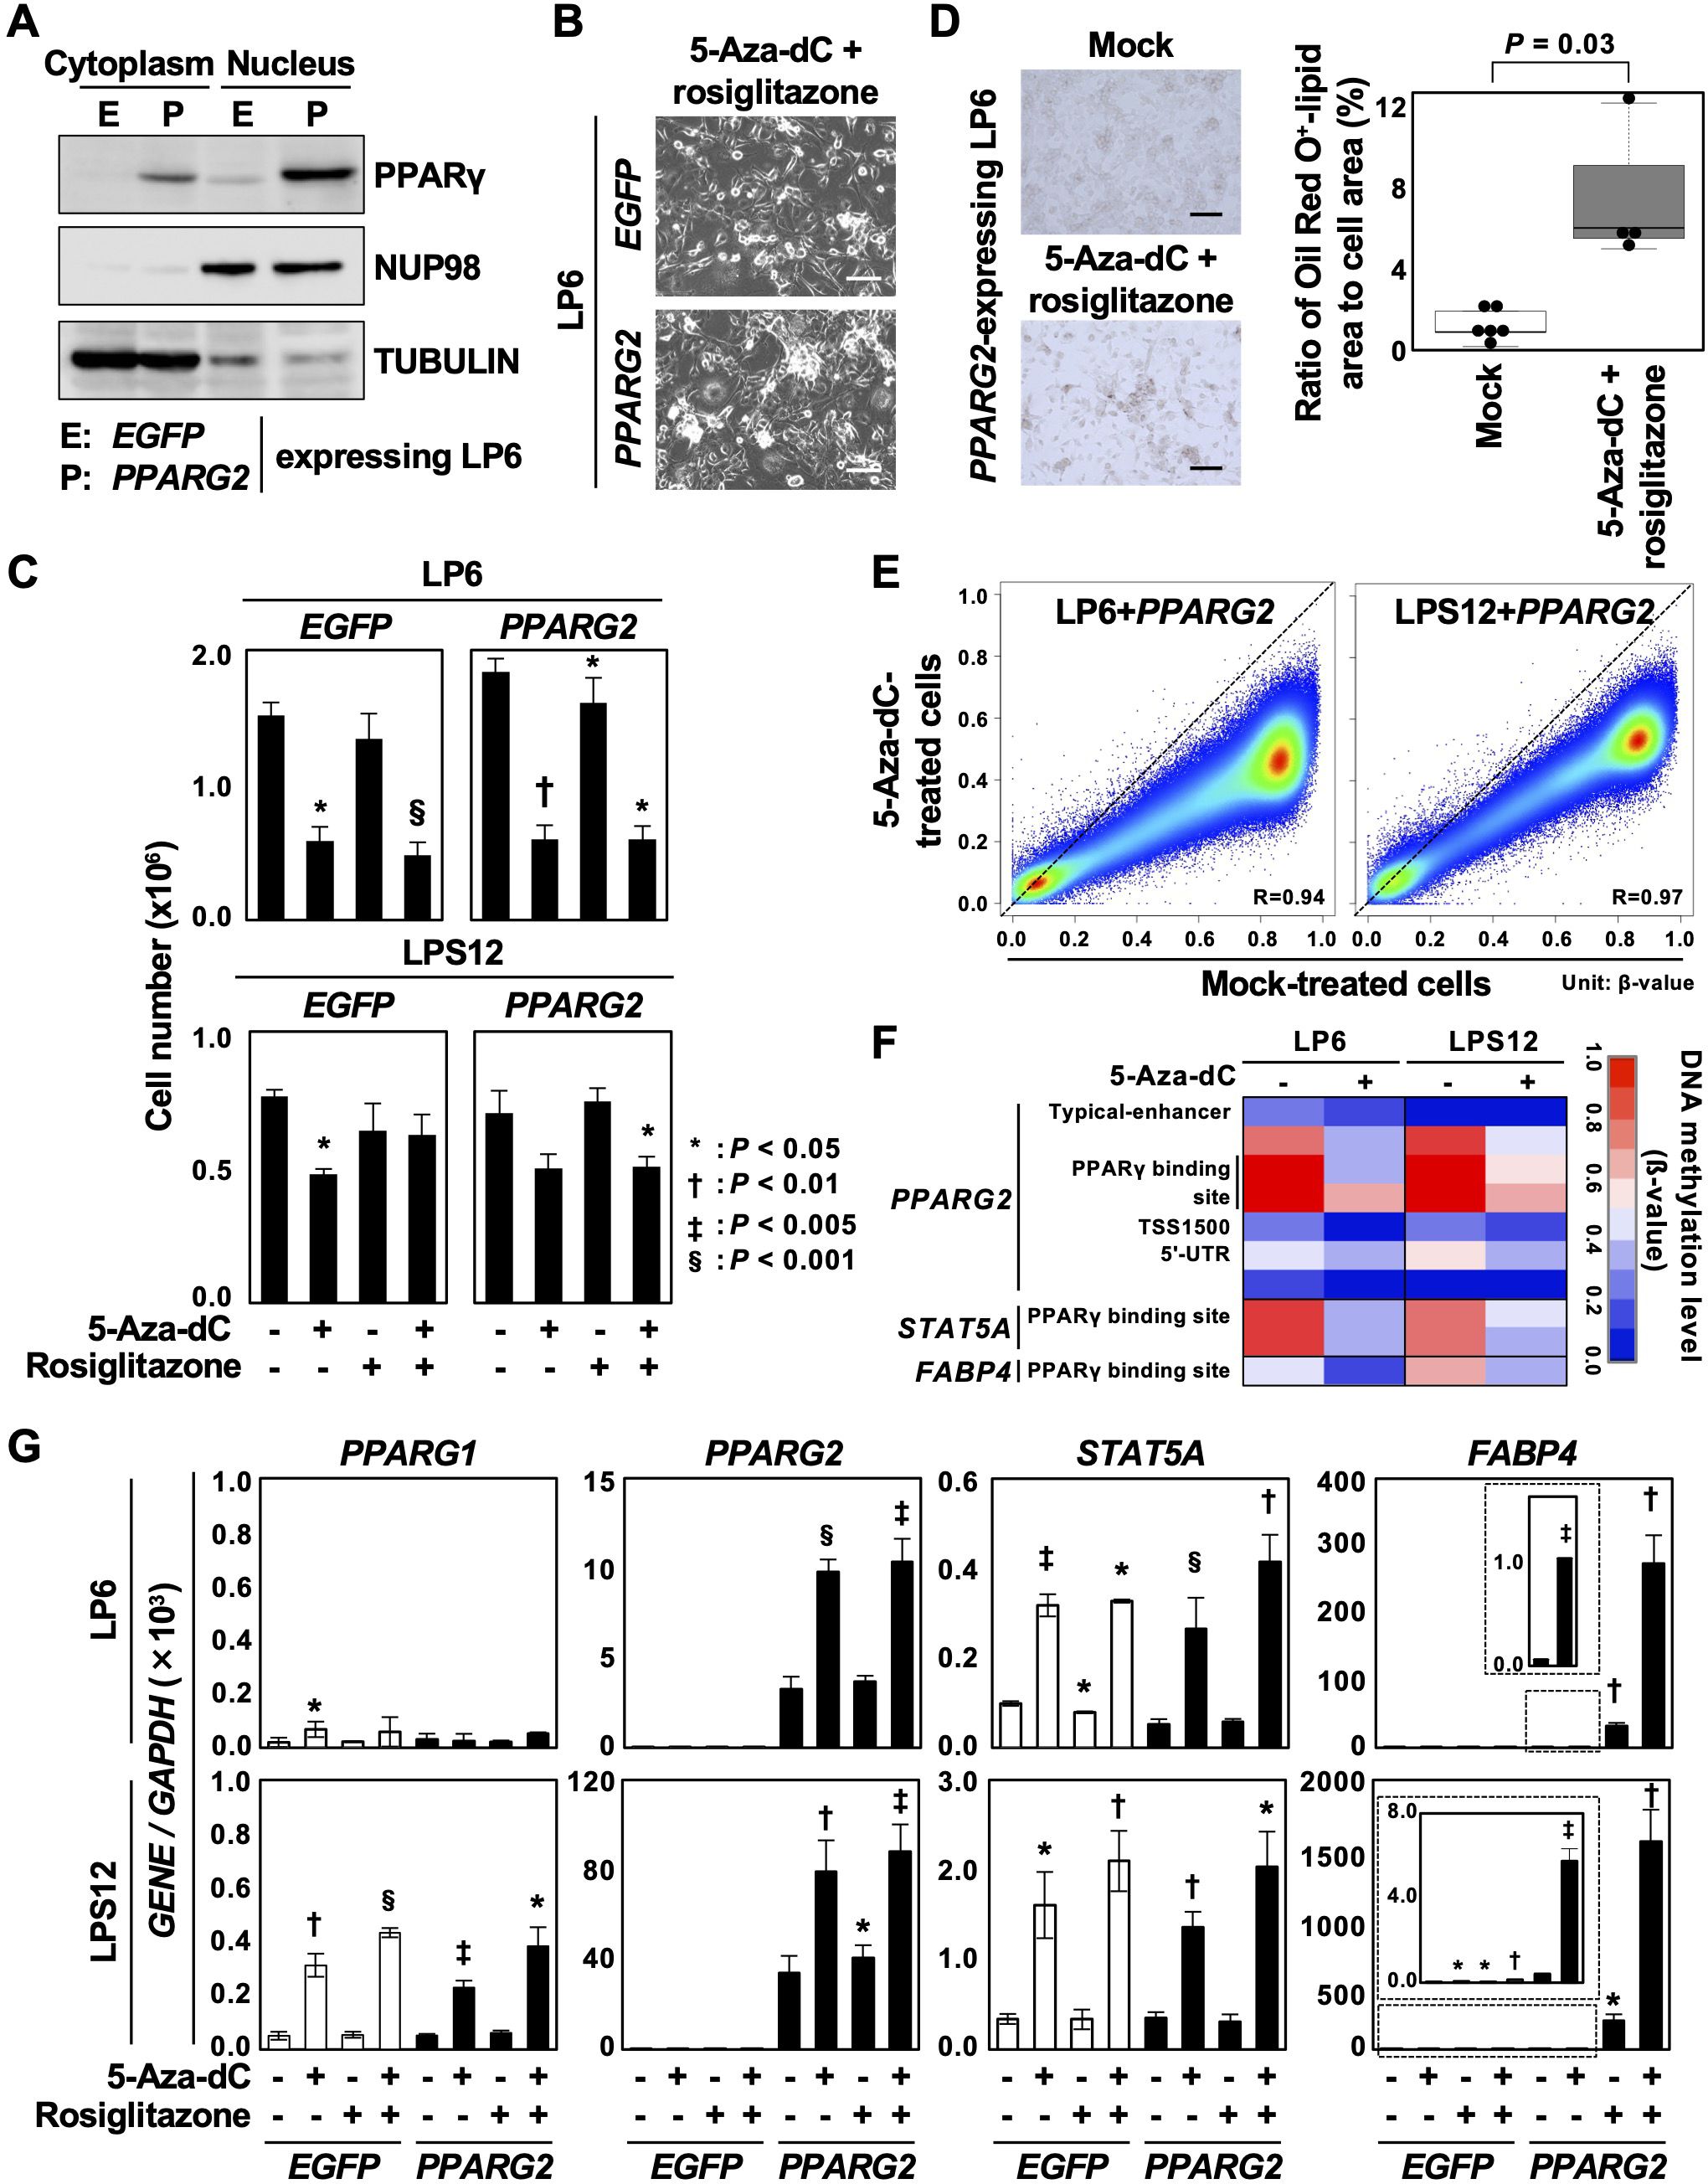
Figure 4. Enhancement of adipose differentiation by the combined treatment with 5-aza-dC and a PPARγ agonist. (A) PPARγ2 protein expression in LP6 cells with PPARG2 overexpression. Overexpression of the PPARγ2 protein was confirmed. (B) Representative cell morphology. No clear difference in cell morphology was observed between EGFP- and PPARG2-expressing LP6 cells after treatment with 5-aza-dC and rosiglitazone. Scale bar = 100 µm. (C) Changes in cell numbers after the treatment with 5-aza-dC and rosiglitazone. Cell number was decreased by the treatment with 5-aza-dC in both EGFP- and PPARG2-expressing LP6 and LPS12 cells. Data are shown as the mean ± SD obtained from three experiments. (D) Representative Oil Red O staining. Oil Red O-positive cells slightly increased in PPARG2-expressing LP6 cells treated with 5-aza-dC and rosiglitazone (left panel). The ratio of Oil Red O-positive lipid area to the total cell area was quantified (right panel). Statistical significance was tested using an unpaired Student’s t-test. Scale bar = 100 µm. (E) Genome-wide DNA demethylation by 5-aza-dC in LP6 and LPS12 cells expressing PPARG2. Genome-wide DNA methylation levels were analyzed using the Infinium MethylationEPIC BeadChip in mock-treated cells and 5-aza-dC-treated cells (0.3 µM) and compared. Methylation levels are shown as β-values (0.0 to 1.0). Comparison between mock-treated cells and treated cells showed that 5-aza-dC induced DNA demethylation of virtually all genomic blocks. (F) DNA methylation status of the downstream genes of PPARγ. The regulatory regions of PPARG2, STAT5A, and FABP4 were demethylated by 5-aza-dC treatment. (G) Expression levels of the genes methylated in DDLPSs after the treatment with 5-aza-dC and rosiglitazone. Treatment with 5-Aza-dC additively induced the expressions of PPARG2 and STAT5A in PPAR2-expressing LP6 and LPS12 cells. The expression of FABP4 was synergistically induced by the combined treatment. Each RT-qPCR analysis was performed in triplicate, and the results are presented as mean ± SE. *P < 0.05, †P < 0.01, ‡P < 0.005, §P < 0.001.
The demethylation effect of 5-aza-dC was analyzed in LP6 and LPS12 expressing PPARG2 using the Infinium MethylationEPIC BeadChip. Compared with the mock-treated cells, the 5-aza-dC-treated cells showed decreased β-values at virtually all CpG sites in both cell lines, meaning that the demethylation ability of 5-aza-dC was achieved by the dose and treatment schedule used in this study (Figure 4E). In addition, the demethylation occurred at the regulatory regions of PPARG2, STAT5A, and FABP4 in the 5-aza-dC-treated cells (Figure 4F). 5-Aza-dC treatment also induced demethylation at the regulatory regions of CEBPA, CEBPB, CFD and LPL among the genes involved in adipogenesis (Supplementary Figure S6B). These data indicate that 5-aza-dC treatment reprogrammed adipogenic genes and enhanced the differentiation induction by rosiglitazone.
The expression of PPARG1, whose promoter was not methylated in DDLPS, was induced by 5-aza-dC treatment in LPS12 cells, potentially due to the upregulation of its transcription factors. PPARG2 and STAT5A were additively induced by 5-aza-dC treatment in PPAR2-expressing LP6 and LPS12 cells, although rosiglitazone alone could not induce their expressions (Figure 4G), which may be attributable to the high methylation status of PPARγ binding sites within the regulatory regions of these genes. The combination of 5-aza-dC and rosiglitazone synergistically induced the expression of FABP4 in PPARG2-expressing LP6 and LPS12 cells, whereas monotherapy with 5-aza-dC induced only a slight expression (Figure 4G). These data indicated that DNA demethylation by 5-aza-dC prior to rosiglitazone treatment may be effective, at least in specific contexts.
Discussion
This study shows that aberrant DNA methylation of adipogenic gene enhancers is involved in the pathogenesis of DDLPS. The genomic regions hypermethylated in DDLPSs had a high fraction of adipocyte enhancers and were associated with the repression of PPARγ target genes, such as STAT5A and FABP4. Aberrant hypermethylation at the regulatory regions of PPARG2, SATA5A, and FABP4 was reversed by treatment with a DNA demethylating agent in DDLSP cell lines. Although single treatment with a PPARγ agonist led only to limited upregulation of these genes, the prior treatment with a DNA demethylating agent had a synergistic effect on the expression of FABP4, which was expected to lead to enhanced DDLPS differentiation. These results indicated a potential therapeutic value of targeting aberrant DNA methylation, along with activation of PPARγ, in DDLPS.
The GBs hypermethylated in DDLPSs were enriched with enhancers in adipocytes, suggesting that enhancer methylation is a characteristic of DDLPS. Enhancers are known to have low DNA methylation level and be sensitive to alterations in DNA methylation during differentiation or development (35–37). One possible mechanism for maintaining low methylation in enhancers is cooperative binding of multiple transcription factors that block de novo methylation and/or increase active demethylation by TET enzymes (37–39). If the regulation of transcription factors is impaired, enhancers are critically involved in disturbances in differentiation because of their importance in determining cell fate (17–19, 40). PPARG1 and PPARG2 expression was lower in DDLPSs than in normal adipose tissues and WDLPSs, and this may have led to methylation of adipocyte enhancers with PPARγ binding sites, making simple PPARG2 overexpression ineffective for inducing differentiation. Taken together, the downregulation of PPARγ expression by some mechanism appears to have led to the methylation of enhancers that resulted in irreversible loss of differentiation. The presence of enhancer methylation in DDLPSs can explain the difference in differentiation induction by ectopic expression of PPARγ in human fibroblasts (32) and the lack of differentiation induction in DDLPS cells.
The limitations of this study lie in the relatively small sample size, the age differences among the groups, and the lack of our own validation cohort. On the other hand, since aberrant DNA methylation of PPARγ downstream genes was also observed in an independent cohort in the TCGA database, we assume that the aberrant methylation associated with DDLPS development could be generalized. Additionally, a small number of genes showed synergistic responses to the treatment with a DNA demethylating agent and rosiglitazone. We believe that, if transcriptome analysis is conducted, more genes will be identified.
In conclusion, aberrant DNA methylation of adipogenic gene enhancers occurred in DDLPSs, and targeting aberrant DNA methylation before the induction of differentiation by PPARγ agonists appears to be a promising strategy.
Data availability statement
The datasets presented in this study can be found in online repositories. The names of the repository/repositories and accession number(s) can be found below: https://www.ncbi.nlm.nih.gov/, GSE252182 https://www.ncbi.nlm.nih.gov/, GSE278425.
Ethics statement
This study (protocol number 2004-050) was approved by the Committee of National Cancer Center and were conducted according to the institutional guidelines. The studies were conducted in accordance with the local legislation and institutional requirements. The participants provided their written informed consent to participate in this study.
Author contributions
NH: Conceptualization, Funding acquisition, Investigation, Supervision, Writing – original draft, Writing – review & editing. HT: Investigation, Writing – original draft, Writing – review & editing. NI: Investigation, Methodology, Resources, Visualization, Writing – review & editing. NA: Conceptualization, Funding acquisition, Resources, Writing – review & editing. GO: Methodology, Visualization, Writing – review & editing. AY: Resources, Writing – review & editing. EK: Resources, Supervision, Writing – review & editing. RN: Resources, Supervision, Writing – review & editing. MM: Resources, Supervision, Writing – review & editing. MN: Resources, Supervision, Writing – review & editing. AK: Resources, Supervision, Writing – review & editing. TU: Conceptualization, Funding acquisition, Supervision, Writing – original draft, Writing – review & editing. SY: Data curation, Methodology, Investigation, Resources, Writing – original draft. KK: Formal analysis, Validation, Investigation, Writing – original draft.
Funding
The author(s) declare that financial support was received for the research and/or publication of this article. This study was supported by AMED-CREST, AMED under Grant Number JP20gm1310006 to TU. This study was supported by JSPS KAKENHI Grant Numbers JP20K07628 to N.H. and JP21K15601 to N.A.
Acknowledgments
The authors are grateful to the Department of Biobank and Tissue Resources, National Cancer Center Research Institute for providing fresh-frozen samples of liposarcomas and normal fat tissues. We would like to thank Editage (www.editage.jp) for English language editing. This work was the result of using research equipment shared in the Institute for Molecular and Cellular Regulation Joint Usage/Research Support Center (IMCR-JURSC), Gunma University.
Conflict of interest
The authors declare that the research was conducted in the absence of any commercial or financial relationships that could be construed as a potential conflict of interest.
The author(s) declared that they were an editorial board member of Frontiers, at the time of submission. This had no impact on the peer review process and the final decision.
Publisher’s note
All claims expressed in this article are solely those of the authors and do not necessarily represent those of their affiliated organizations, or those of the publisher, the editors and the reviewers. Any product that may be evaluated in this article, or claim that may be made by its manufacturer, is not guaranteed or endorsed by the publisher.
Supplementary material
The Supplementary Material for this article can be found online at: https://www.frontiersin.org/articles/10.3389/fonc.2025.1419877/full#supplementary-material
References
1. Fletcher CDM, World Health Organization, International Agency for Research on Cancer. WHO classification of tumours of soft tissue and bone. 4th ed. Lyon: IARC Press (2013). p. 468.
2. Oda Y, Yamamoto H, Kohashi K, Yamada Y, Iura K, Ishii T, et al. Soft tissue sarcomas: From a morphological to a molecular biological approach. Pathol Int. (2017) 67:435–46. doi: 10.1111/pin.12565
3. Dalal KM, Antonescu CR, Singer S. Diagnosis and management of lipomatous tumors. J Surg Oncol. (2008) 97:298–313. doi: 10.1002/jso.20975
4. Singer S, Antonescu CR, Riedel E, Brennan MF. Histologic subtype and margin of resection predict pattern of recurrence and survival for retroperitoneal liposarcoma. Ann Surg. (2003) 238:358–70; discussion 70-1. doi: 10.1097/01.sla.0000086542.11899.38
5. Asano N, Yoshida A, Mitani S, Kobayashi E, Shiotani B, Komiyama M, et al. Frequent amplification of receptor tyrosine kinase genes in welldifferentiated/ dedifferentiated liposarcoma. Oncotarget. (2017) 8:12941–52. doi: 10.18632/oncotarget.14652
6. Barretina J, Taylor BS, Banerji S, Ramos AH, Lagos-Quintana M, Decarolis PL, et al. Subtype-specific genomic alterations define new targets for soft-tissue sarcoma therapy. Nat Genet. (2010) 42:715–21. doi: 10.1038/ng.619
7. Binh MB, Sastre-Garau X, Guillou L, de Pinieux G, Terrier P, Lagace R, et al. MDM2 and CDK4 immunostainings are useful adjuncts in diagnosing well-differentiated and dedifferentiated liposarcoma subtypes: a comparative analysis of 559 soft tissue neoplasms with genetic data. Am J Surg Pathol. (2005) 29:1340–7. doi: 10.1097/01.pas.0000170343.09562.39
8. Hirata M, Asano N, Katayama K, Yoshida A, Tsuda Y, Sekimizu M, et al. Integrated exome and RNA sequencing of dedifferentiated liposarcoma. Nat Commun. (2019) 10:5683. doi: 10.1038/s41467-019-13286-z
9. Kallen ME, Hornick JL. The 2020 WHO classification: what's new in soft tissue tumor pathology? Am J Surg Pathol. (2021) 45:e1–e23. doi: 10.1097/PAS.0000000000001552
10. Yang L, Chen S, Luo P, Yan W, Wang C. Liposarcoma: advances in cellular and molecular genetics alterations and corresponding clinical treatment. J Cancer. (2020) 11:100–7. doi: 10.7150/jca.36380
11. Mariani O, Brennetot C, Coindre JM, Gruel N, Ganem C, Delattre O, et al. JUN oncogene amplification and overexpression block adipocytic differentiation in highly aggressive sarcomas. Cancer Cell. (2007) 11:361–74. doi: 10.1016/j.ccr.2007.02.007
12. Henricks WH, Chu YC, Goldblum JR, Weiss SW. Dedifferentiated liposarcoma: a clinicopathological analysis of 155 cases with a proposal for an expanded definition of dedifferentiation. Am J Surg Pathol. (1997) 21:271–81. doi: 10.1097/00000478-199703000-00002
13. Koelsche C, Schrimpf D, Stichel D, Sill M, Sahm F, Reuss DE, et al. Sarcoma classification by DNA methylation profiling. Nat Commun. (2021) 12:498. doi: 10.1038/s41467-020-20603-4
14. Renner M, Wolf T, Meyer H, Hartmann W, Penzel R, Ulrich A, et al. Integrative DNA methylation and gene expression analysis in high-grade soft tissue sarcomas. Genome Biol. (2013) 14:r137. doi: 10.1186/gb-2013-14-12-r137
15. Taylor BS, DeCarolis PL, Angeles CV, Brenet F, Schultz N, Antonescu CR, et al. Frequent alterations and epigenetic silencing of differentiation pathway genes in structurally rearranged liposarcomas. Cancer Discov. (2011) 1:587–97. doi: 10.1158/2159-8290.CD-11-0181
16. Cancer Genome Atlas Research Network, Electronic address, e.d.s.c., Cancer Genome Atlas Research N. Comprehensive and integrated genomic characterization of adult soft tissue sarcomas. Cell. (2017) 171:950–65 e28. doi: 10.1016/j.cell.2017.10.014
17. Choi J, Lysakovskaia K, Stik G, Demel C, Soding J, Tian TV, et al. Evidence for additive and synergistic action of mammalian enhancers during cell fate determination. Elife. (2021) 10:e65381. doi: 10.7554/eLife.65381
18. Panigrahi A, O'Malley BW. Mechanisms of enhancer action: the known and the unknown. Genome Biol. (2021) 22:108. doi: 10.1186/s13059-021-02322-1
19. Alajem A, Roth H, Ratgauzer S, Bavli D, Motzik A, Lahav S, et al. DNA methylation patterns expose variations in enhancer-chromatin modifications during embryonic stem cell differentiation. PloS Genet. (2021) 17:e1009498. doi: 10.1371/journal.pgen.1009498
20. Hattori N, Asada K, Miyajima N, Mori A, Nakanishi Y, Kimura K, et al. Combination of a synthetic retinoid and a DNA demethylating agent induced differentiation of neuroblastoma through retinoic acid signal reprogramming. Br J Cancer. (2021) 125:1647–56. doi: 10.1038/s41416-021-01571-y
21. Ishihara H, Yamashita S, Liu YY, Hattori N, El-Omar O, Ikeda T, et al. Genetic and epigenetic profiling indicates the proximal tubule origin of renal cancers in end-stage renal disease. Cancer Sci. (2020) 111:4276–87. doi: 10.1111/cas.14633
22. Bibikova M, Barnes B, Tsan C, Ho V, Klotzle B, Le JM, et al. High density DNA methylation array with single CpG site resolution. Genomics. (2011) 98:288–95. doi: 10.1016/j.ygeno.2011.07.007
23. Iida N, Okuda Y, Ogasawara O, Yamashita S, Takeshima H, Ushijima T. MACON: a web tool for computing DNA methylation data obtained by the Illumina Infinium Human DNA methylation BeadArray. Epigenomics. (2018) 10:249–58. doi: 10.2217/epi-2017-0093
24. Takahashi T, Matsuda Y, Yamashita S, Hattori N, Kushima R, Lee YC, et al. Estimation of the fraction of cancer cells in a tumor DNA sample using DNA methylation. PloS One. (2013) 8:e82302. doi: 10.1371/journal.pone.0082302
25. Zong L, Hattori N, Yoda Y, Yamashita S, Takeshima H, Takahashi T, et al. Establishment of a DNA methylation marker to evaluate cancer cell fraction in gastric cancer. Gastric Cancer. (2016) 19:361–9. doi: 10.1007/s10120-015-0475-2
26. Zong L, Hattori N, Yasukawa Y, Kimura K, Mori A, Seto Y, et al. LINC00162 confers sensitivity to 5-Aza-2'-deoxycytidine via modulation of an RNA splicing protein, HNRNPH1. Oncogene. (2019) 38:5281–93. doi: 10.1038/s41388-019-0792-8
27. Takeshima H, Yoda Y, Wakabayashi M, Hattori N, Yamashita S, Ushijima T. Low-dose DNA demethylating therapy induces reprogramming of diverse cancer-related pathways at the single-cell level. Clin Epigenetics. (2020) 12:142. doi: 10.1186/s13148-020-00937-y
28. Mikkelsen TS, Xu Z, Zhang X, Wang L, Gimble JM, Lander ES, et al. Comparative epigenomic analysis of murine and human adipogenesis. Cell. (2010) 143:156–69. doi: 10.1016/j.cell.2010.09.006
29. Whyte WA, Orlando DA, Hnisz D, Abraham BJ, Lin CY, Kagey MH, et al. Master transcription factors and mediator establish super-enhancers at key cell identity genes. Cell. (2013) 153:307–19. doi: 10.1016/j.cell.2013.03.035
30. Wakabayashi K, Okamura M, Tsutsumi S, Nishikawa NS, Tanaka T, Sakakibara I, et al. The peroxisome proliferator-activated receptor gamma/retinoid X receptor alpha heterodimer targets the histone modification enzyme PR-Set7/Setd8 gene and regulates adipogenesis through a positive feedback loop. Mol Cell Biol. (2009) 29:3544–55. doi: 10.1128/MCB.01856-08
31. Kashima TG, Turley H, Dongre A, Pezzella F, Athanasou NA. Diagnostic utility of aP2/FABP4 expression in soft tissue tumours. Virchows Arch. (2013) 462:465–72. doi: 10.1007/s00428-013-1392-6
32. Tontonoz P, Hu E, Spiegelman BM. Stimulation of adipogenesis in fibroblasts by PPAR gamma 2, a lipid-activated transcription factor. Cell. (1994) 79:1147–56. doi: 10.1016/0092-8674(94)90006-x
33. Tontonoz P, Singer S, Forman BM, Sarraf P, Fletcher JA, Fletcher CD, et al. Terminal differentiation of human liposarcoma cells induced by ligands for peroxisome proliferator-activated receptor gamma and the retinoid X receptor. Proc Natl Acad Sci U S A. (1997) 94:237–41. doi: 10.1073/pnas.94.1.237
34. Debrock G, Vanhentenrijk V, Sciot R, Debiec-Rychter M, Oyen R, Van Oosterom A. A phase II trial with rosiglitazone in liposarcoma patients. Br J Cancer. (2003) 89:1409–12. doi: 10.1038/sj.bjc.6601306
35. Kim M, Park YK, Kang TW, Lee SH, Rhee YH, Park JL, et al. Dynamic changes in DNA methylation and hydroxymethylation when hES cells undergo differentiation toward a neuronal lineage. Hum Mol Genet. (2014) 23:657–67. doi: 10.1093/hmg/ddt453
36. Luo C, Hajkova P, Ecker JR. Dynamic DNA methylation: In the right place at the right time. Science. (2018) 361:1336–40. doi: 10.1126/science.aat6806
37. Stadler MB, Murr R, Burger L, Ivanek R, Lienert F, Scholer A, et al. DNA-binding factors shape the mouse methylome at distal regulatory regions. Nature. (2011) 480:490–5. doi: 10.1038/nature10716
38. Feldmann A, Ivanek R, Murr R, Gaidatzis D, Burger L, Schubeler D. Transcription factor occupancy can mediate active turnover of DNA methylation at regulatory regions. PloS Genet. (2013) 9:e1003994. doi: 10.1371/journal.pgen.1003994
39. Kreibich E, Krebs AR. Relevance of DNA methylation at enhancers for the acquisition of cell identities. FEBS Lett. (2023) 597:1805–17. doi: 10.1002/1873-3468.14686
Keywords: epigenome, DNA methylation, sarcoma, adipogenic differentiation, DNA demethylating agent
Citation: Hattori N, Takamatsu H, Iida N, Asano N, Yamashita S, Oba GM, Kimura K, Yoshida A, Kobayashi E, Nakayama R, Matsumoto M, Nakamura M, Kawai A and Ushijima T (2025) Epigenetic disruption of adipogenic gene enhancers in dedifferentiated liposarcomas and its therapeutic value. Front. Oncol. 15:1419877. doi: 10.3389/fonc.2025.1419877
Received: 19 April 2024; Accepted: 09 April 2025;
Published: 30 April 2025.
Edited by:
Gabi U Dachs, University of Otago, Christchurch, New ZealandReviewed by:
Zhenzhong Deng, University of Southern California, United StatesHongying Zhang, Sichuan University, China
Copyright © 2025 Hattori, Takamatsu, Iida, Asano, Yamashita, Oba, Kimura, Yoshida, Kobayashi, Nakayama, Matsumoto, Nakamura, Kawai and Ushijima. This is an open-access article distributed under the terms of the Creative Commons Attribution License (CC BY). The use, distribution or reproduction in other forums is permitted, provided the original author(s) and the copyright owner(s) are credited and that the original publication in this journal is cited, in accordance with accepted academic practice. No use, distribution or reproduction is permitted which does not comply with these terms.
*Correspondence: Naoko Hattori, bmFva28uaGF0dG9yaUBndW5tYS11LmFjLmpw; Toshikazu Ushijima, dHVzaGlqaW1hMTQyQGhvc2hpLmFjLmpw
†These authors have contributed equally to this work