 Bradley L. Goodnight1
 Glenn J. Hanna2
 Dandan Zheng3Magdiel Habila3
 Marie Cassese1Alexander Fortman1Harold Walbert1Fred Sieling1
 Christopher M. Black3*
- 1Health Data Science, Guidehouse Inc., Tysons, VA, United States
- 2Center for Head & Neck Oncology, Dana-Farber Cancer Institute, Boston, MA, United States
- 3Outcomes Research, Merck & Co., Inc., Rahway, NJ, United States
Introduction: Head and neck (H&N) cancers, a diverse group of epithelial malignancies, significantly impact patients' quality of life and require complex, multidisciplinary care. Despite the need for specialized care, access to H&N cancer specialists is uneven across the United States, leading to disparities in patient outcomes and health equity. To assess geographic disparities in access to H&N cancer specialists in the U.S. and to identify factors contributing to these disparities, with the goal of informing targeted interventions and policies that promote equitable healthcare access.
Methods: This geospatial analysis utilized data from various public databases, including the National Provider Identifier Registry, American Society of Clinical Oncology, and U.S. News and World Report, to examine the distribution of H&N cancer specialists relative to incident cancer cases. The study analyzed county-level data across the United States, incorporating demographic factors such as race/ethnicity, age, education, and socioeconomic status. Travel time to the nearest H&N specialist was estimated using the Travel Time API. The analysis included 1,112 H&N specialists (453 surgical oncologists, 346 medical oncologists, and 308 radiation oncologists) identified through self-reported data and relevant fellowships. The primary outcome was the estimated travel time to the nearest H&N specialist, with secondary measures including a disparity index that combined cancer incidence, social vulnerability, and travel time to highlight regions with the greatest access disparities.
Results: Significant regional disparities in access to H&N specialists were identified, with non-metropolitan areas and regions outside the Northeast showing notably longer travel times. Socioeconomic and demographics factors, including lower household income, lower insurance coverage, and higher median age, were associated with increased travel times. Disparity Index scores highlighted counties in the South and Western regions as having the highest access disparities.
Conclusion: Geographic and socioeconomic disparities in access to H&N cancer specialists contribute to health inequities in the U.S. The disparity index developed in this study provides a valuable tool for identifying high-need areas and guiding policy interventions. Addressing these disparities through targeted resource allocation, mobile clinics, and provider incentives is essential for improving access to specialized care and promoting health equity.
1 Introduction
Head and neck (H&N) cancers represent a diverse and challenging group of epithelial malignancies that target complex anatomical structures comprised of the larynx, pharynx, nasal cavity, paranasal sinuses, and oral cavity (1–4). Worldwide, H&N cancer ranks as the seventh most common type of cancer (5). While tobacco, alcohol use and occupational exposures are traditional risk factors, human papillomavirus (HPV) infection-related carcinomas are on the rise (1, 3, 5, 6). Both the cancer and its treatment can affect essential functions, such as speech, swallowing, and respiration, which has a profound impact on the patient’s quality of life (2). As such, treatment goals aim to improve survival and to preserve function.
Due to the complexity of the disease and potential impact on patients, optimal care planning and management of H&N cancer should involve collaboration among a range of healthcare professionals with relevant expertise via a multidisciplinary team, or MDT (2, 7). Governing organizations such as the European Society for Medical Oncology (ESMO), the National Comprehensive Cancer Network® (NCCN®), the Society of Medical Oncology (SEOM), and the American College of Surgeons (ACS) recommend that treatment plans be established by an MDT (8–11). Treatment plans for H&N cancers may require surgery, radiation, chemotherapy, targeted therapy, and supportive care, depending upon the location and stage of disease (2, 4, 7). Patients with H&N cancers often present with locoregionally advanced disease, and surgery, radiotherapy, and/or chemotherapy is the initial treatment in many of these patients (12, 13). Access to this specialized care is pivotal in determining the trajectory of a patient's journey from diagnosis to survival (14, 15). The complex treatment modalities required for H&N cancers, including intricate surgical procedures and targeted radiation therapy delivery and techniques, necessitate specialized knowledge and experience (1–4, 11, 16). These patients may also develop complications associated with their disease and treatments, which can lead to physical, social, and psychological problems. Careful monitoring and participation in supportive care programs are important to maintain these patients’ quality of life (17).
However, in the United States access to specialized cancer care is not equally available for all patients, particularly in rural areas and in the West and Midwest regions (18, 19). These disparities are rooted in a complex web of factors, including socioeconomic status, racial and ethnic background, and healthcare infrastructure (20–24). H&N cancers are impacted by disparities in access to specialized care, which results in disparities in individual patient outcomes and the perpetuation of health inequities (25–28). Specifically, limited access to H&N cancer specialists could potentially result in delayed diagnoses, suboptimal treatment, and poorer outcomes, as well as reduced survival rates and quality of life (25, 29). A deeper understanding of disparities based on location and social determinants of health can drive the development of targeted interventions, improvement healthcare policies, and innovative healthcare delivery models that mitigate the impact of inequities (21, 27, 29).
To help improve the survival prospects and quality of life for individuals confronting H&N cancers while contributing to the broader mission of reducing healthcare disparities in the U.S. a comprehensive exploration of disparities in geographic access to H&N cancer specialists across the United States was conducted. The aims of the current study are to advance dialogue on healthcare disparities and advocate for equitable, patient-centered cancer care that transcends geographical and social boundaries. Geospatial analysis was used to assess the impact of factors, such as. This study tested the hypotheses that U.S. region, metropolitan status, socio-economic factors, and cancer epidemiology significantly contribute to disparities in access to H&N cancer specialists. By shedding light on these disparities, this study provides valuable insights for clinicians, policymakers, and researchers to develop strategies that promote equitable access to H&N cancer specialized care.
2 Materials and methods
2.1 Study design
This geospatial analysis examines the geographic distribution of H&N cancer specialists and incident cancer cases at the state and county levels for larynx and oral cavity/pharynx sites. It assesses demographic factors such as race/ethnicity, age, gender, education, insurance coverage, and employment status using secondary data.
2.2 Data sources
Data on H&N providers were sourced from the National Provider Identifier Registry (NPI/NPPES), American Society of Clinical Oncology (ASCO), and US News and World Report Doctor Finder. H&N specialists included those with self-reported primary specialties in medical, radiation, or surgical oncology and reported H&N cancer as a subspecialty. Specialists were matched to unique entries in the NPPES NPI Registry and H&N cancer care fellowships. While several types of providers may provide H&N cancer care, such as clinical social workers, physicians, and nurses, we included only H&N cancer oncologists that had a specialization within the taxonomy codes listed in Table 1, and further limited our list of H&N specialists to those providers that self-identified as H&N specialists either by: 1) being listed as a H&N specialist in the ASCO database, or 2) by listing H&N oncology (combination of “head and neck” with “cancer” or “oncology/oncologist”) as a specialization among their list of specialties in the US News Doctor Finder. Otolaryngologists (ENTs) in the US News dataset were further reduced to include only H&N specialists that completed a fellowship in a field related to oncology or H&N-related surgery (Table 2). Final distribution of specialists by type is shown in Figure 1.
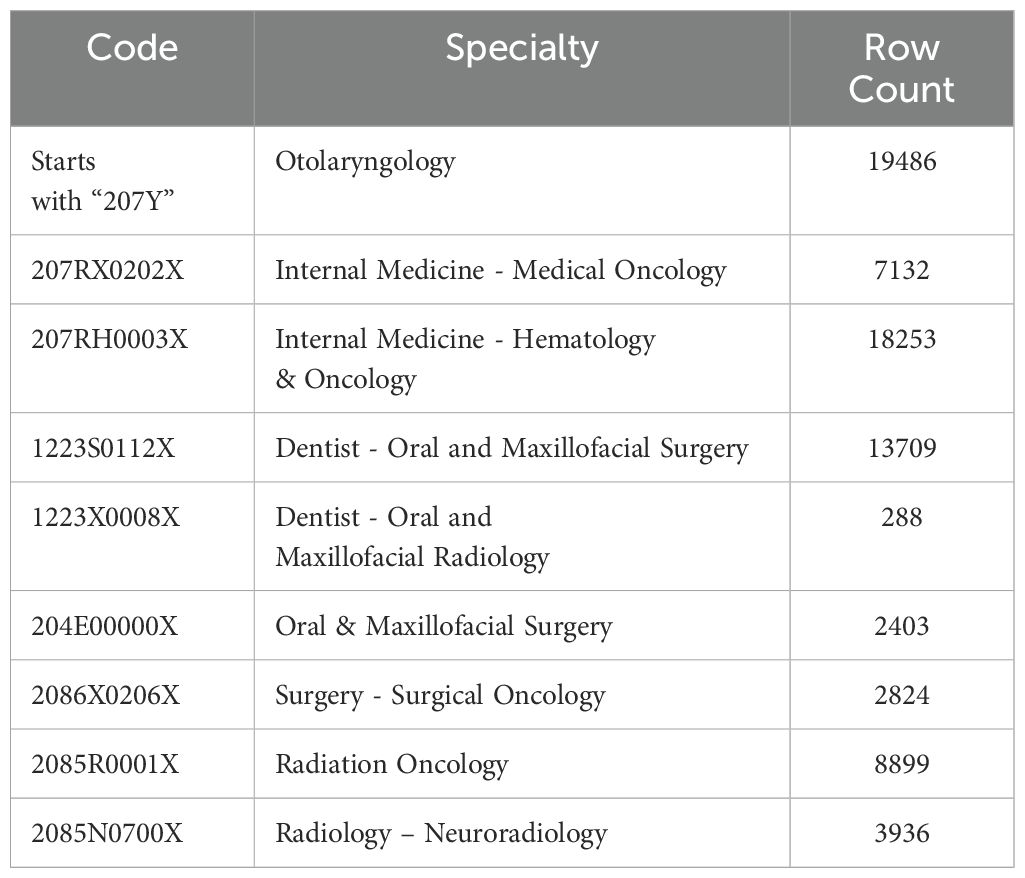
Table 1. List of taxonomy codes used to identify potential head and neck specialists.
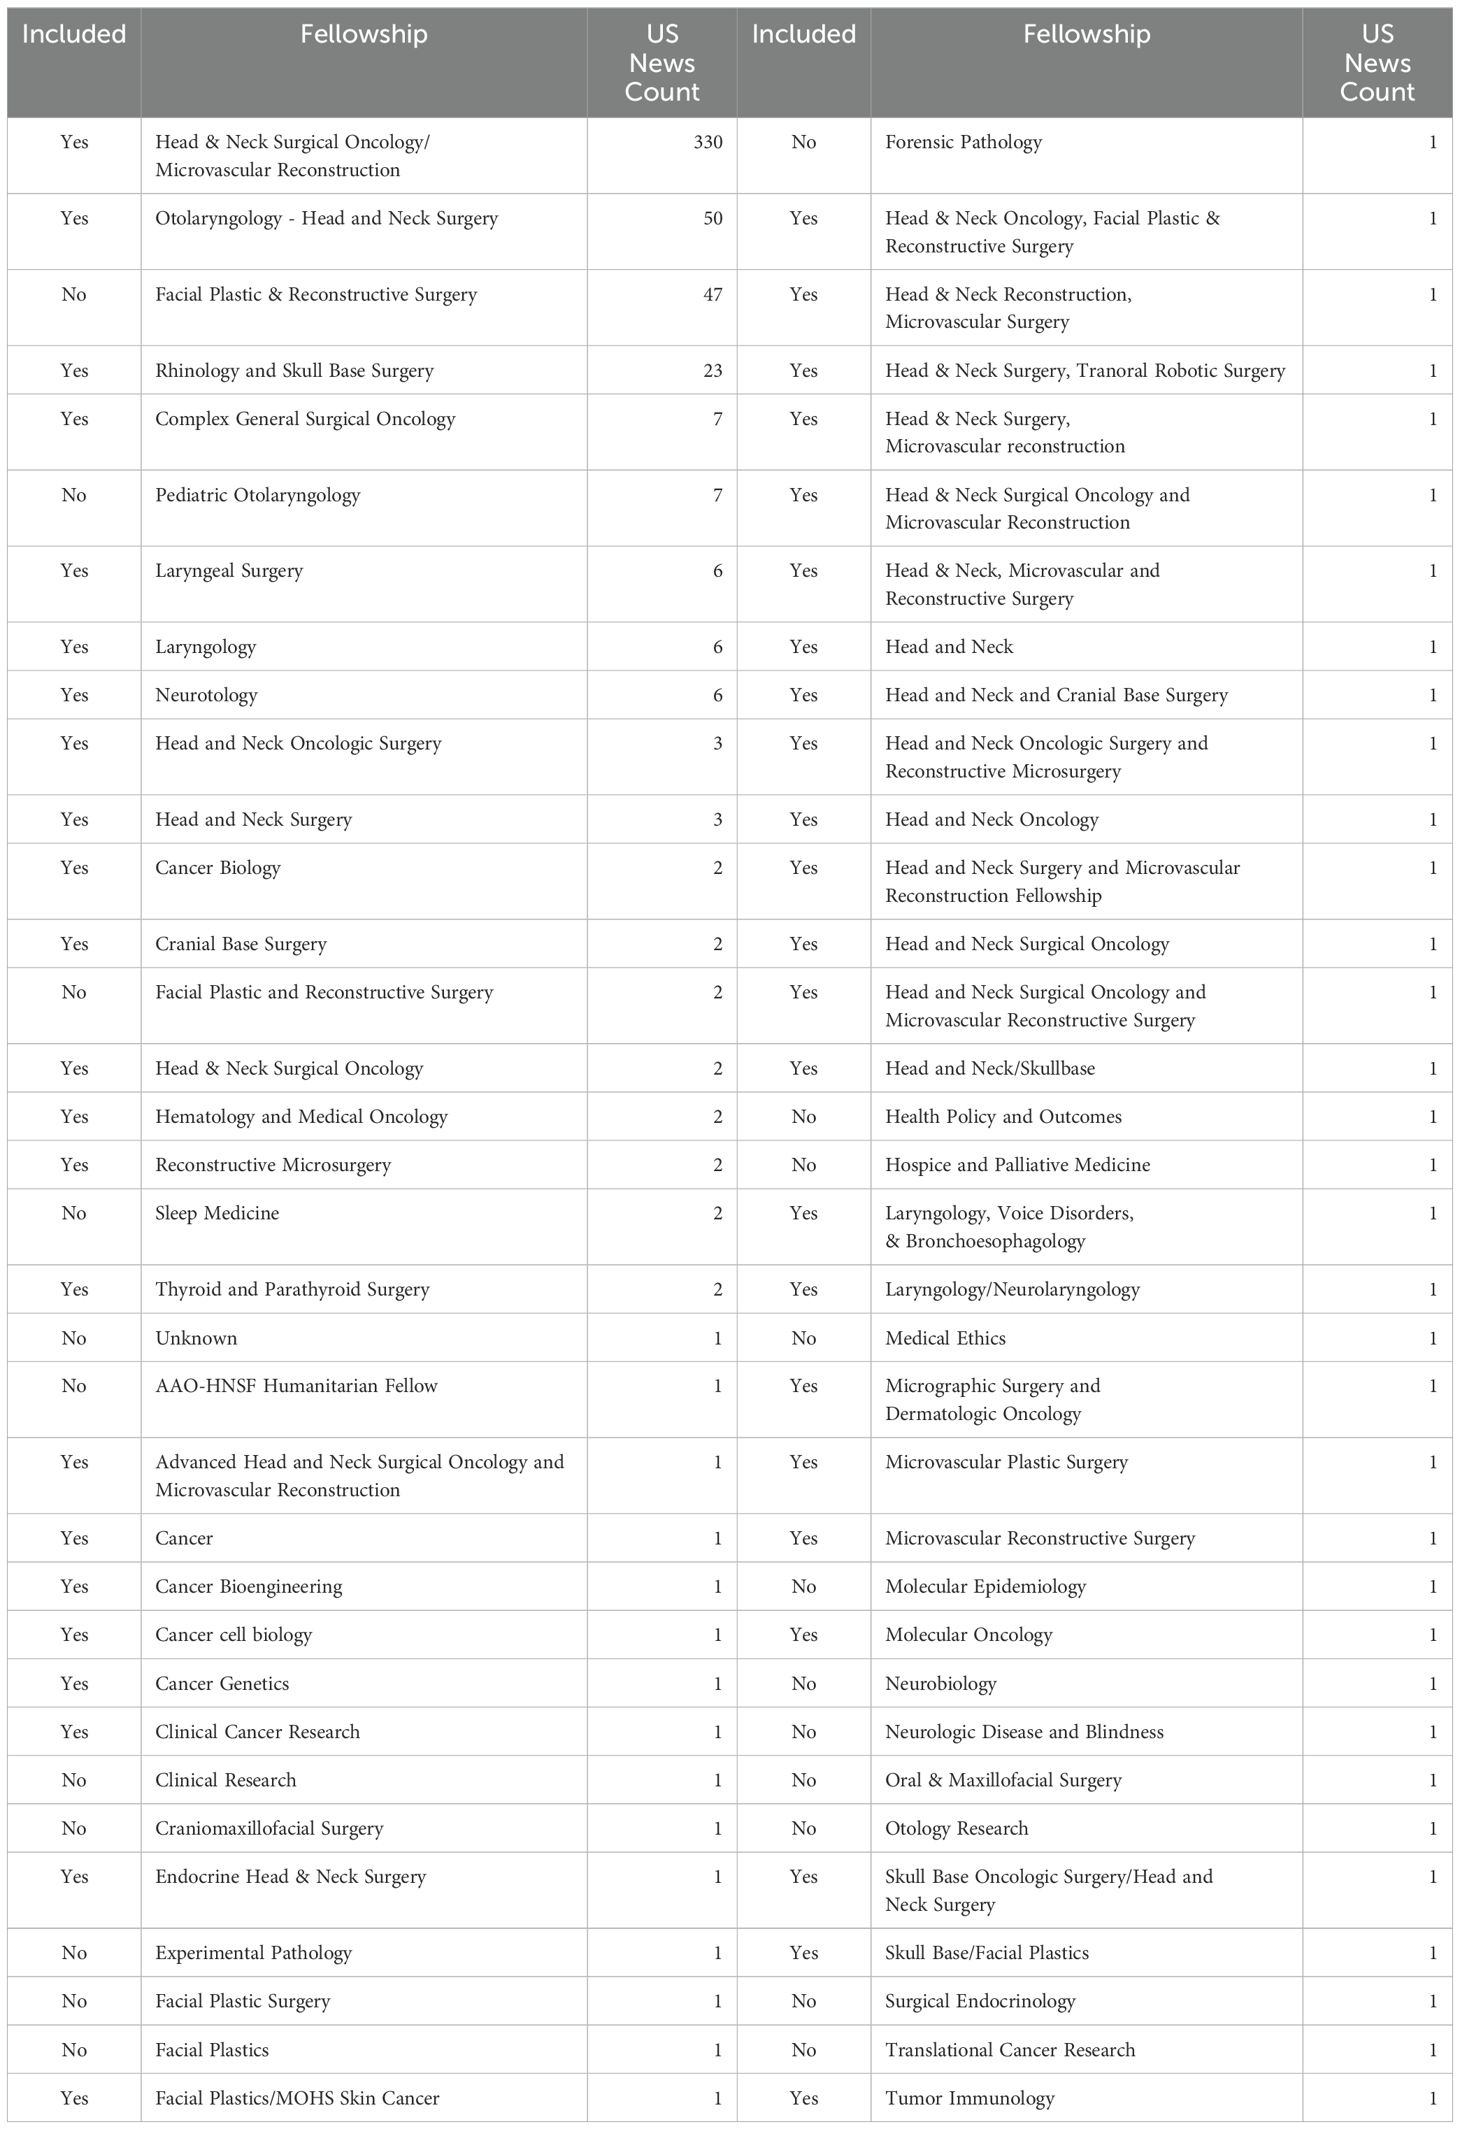
Table 2. List of ENT fellowships from US news data with inclusion / exclusion status.
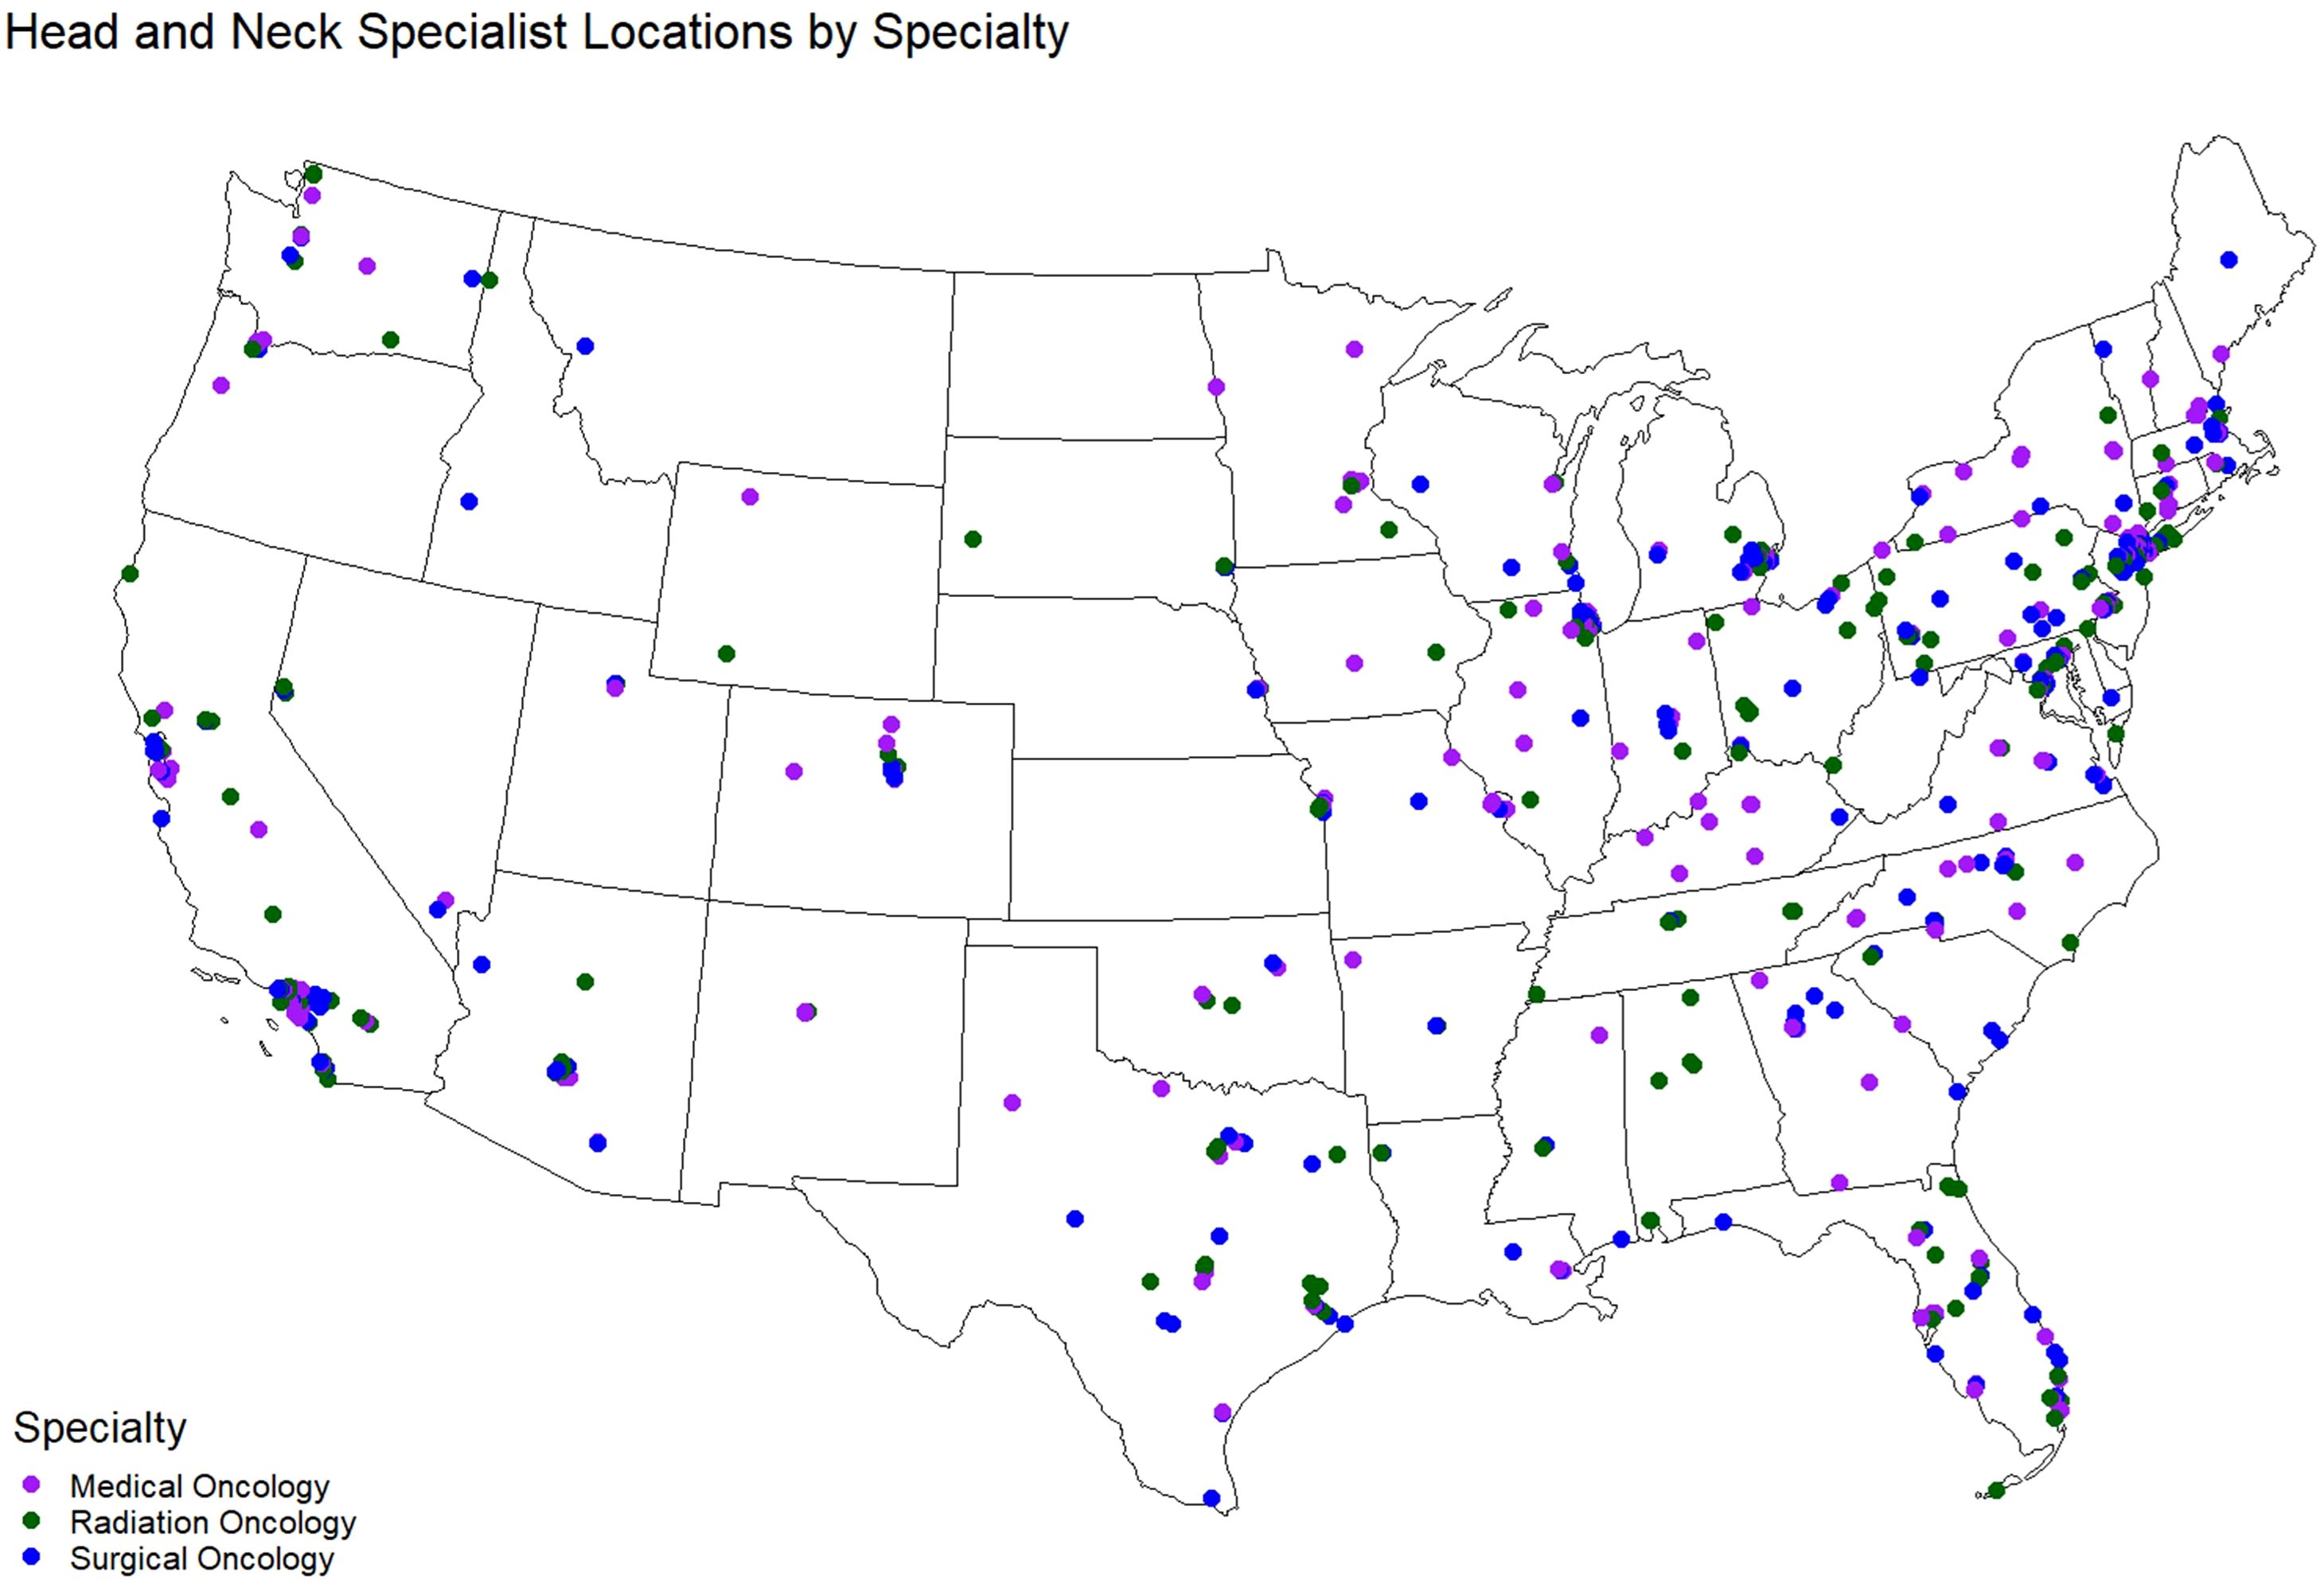
Figure 1. Map of H&N specialists in the U.S.
US population data were obtained from the US Census and CDC Social Vulnerability Index, which combines 16 census variables to measure community-level risk and vulnerability (30). Cancer incidence was obtained from CDC’s United States Cancer Statistics (USCS). H&N cancer incidence was measured for the following cancer sites: 1) larynx, 2) oral cavity and 3) pharynx. All data sources underwent thorough cleaning and integration to ensure consistency and reliability.
2.3 Travel time estimation
Travel time in minutes was estimated from US county population-weighted centroids to nearest H&N specialist using the Travel Time API (31). This utilized road network data and considered various factors affecting travel time. All estimates assumed a starting time of 9:00AM local time for the county centroid. TravelTime offers options for walking, biking, and public transportation, although analyses indicated that travel by car was consistently the fastest mode of transportation. The fastest available mode of transportation by location was used in all analyses. Travel time estimation could only return values under twelve hours (720 minutes), and counties more than twelve hours from the nearest H&N specialist were excluded from analyses. Figure 2 shows travel time to the nearest H&N specialists geographically, by metro status, region, and specialist type.
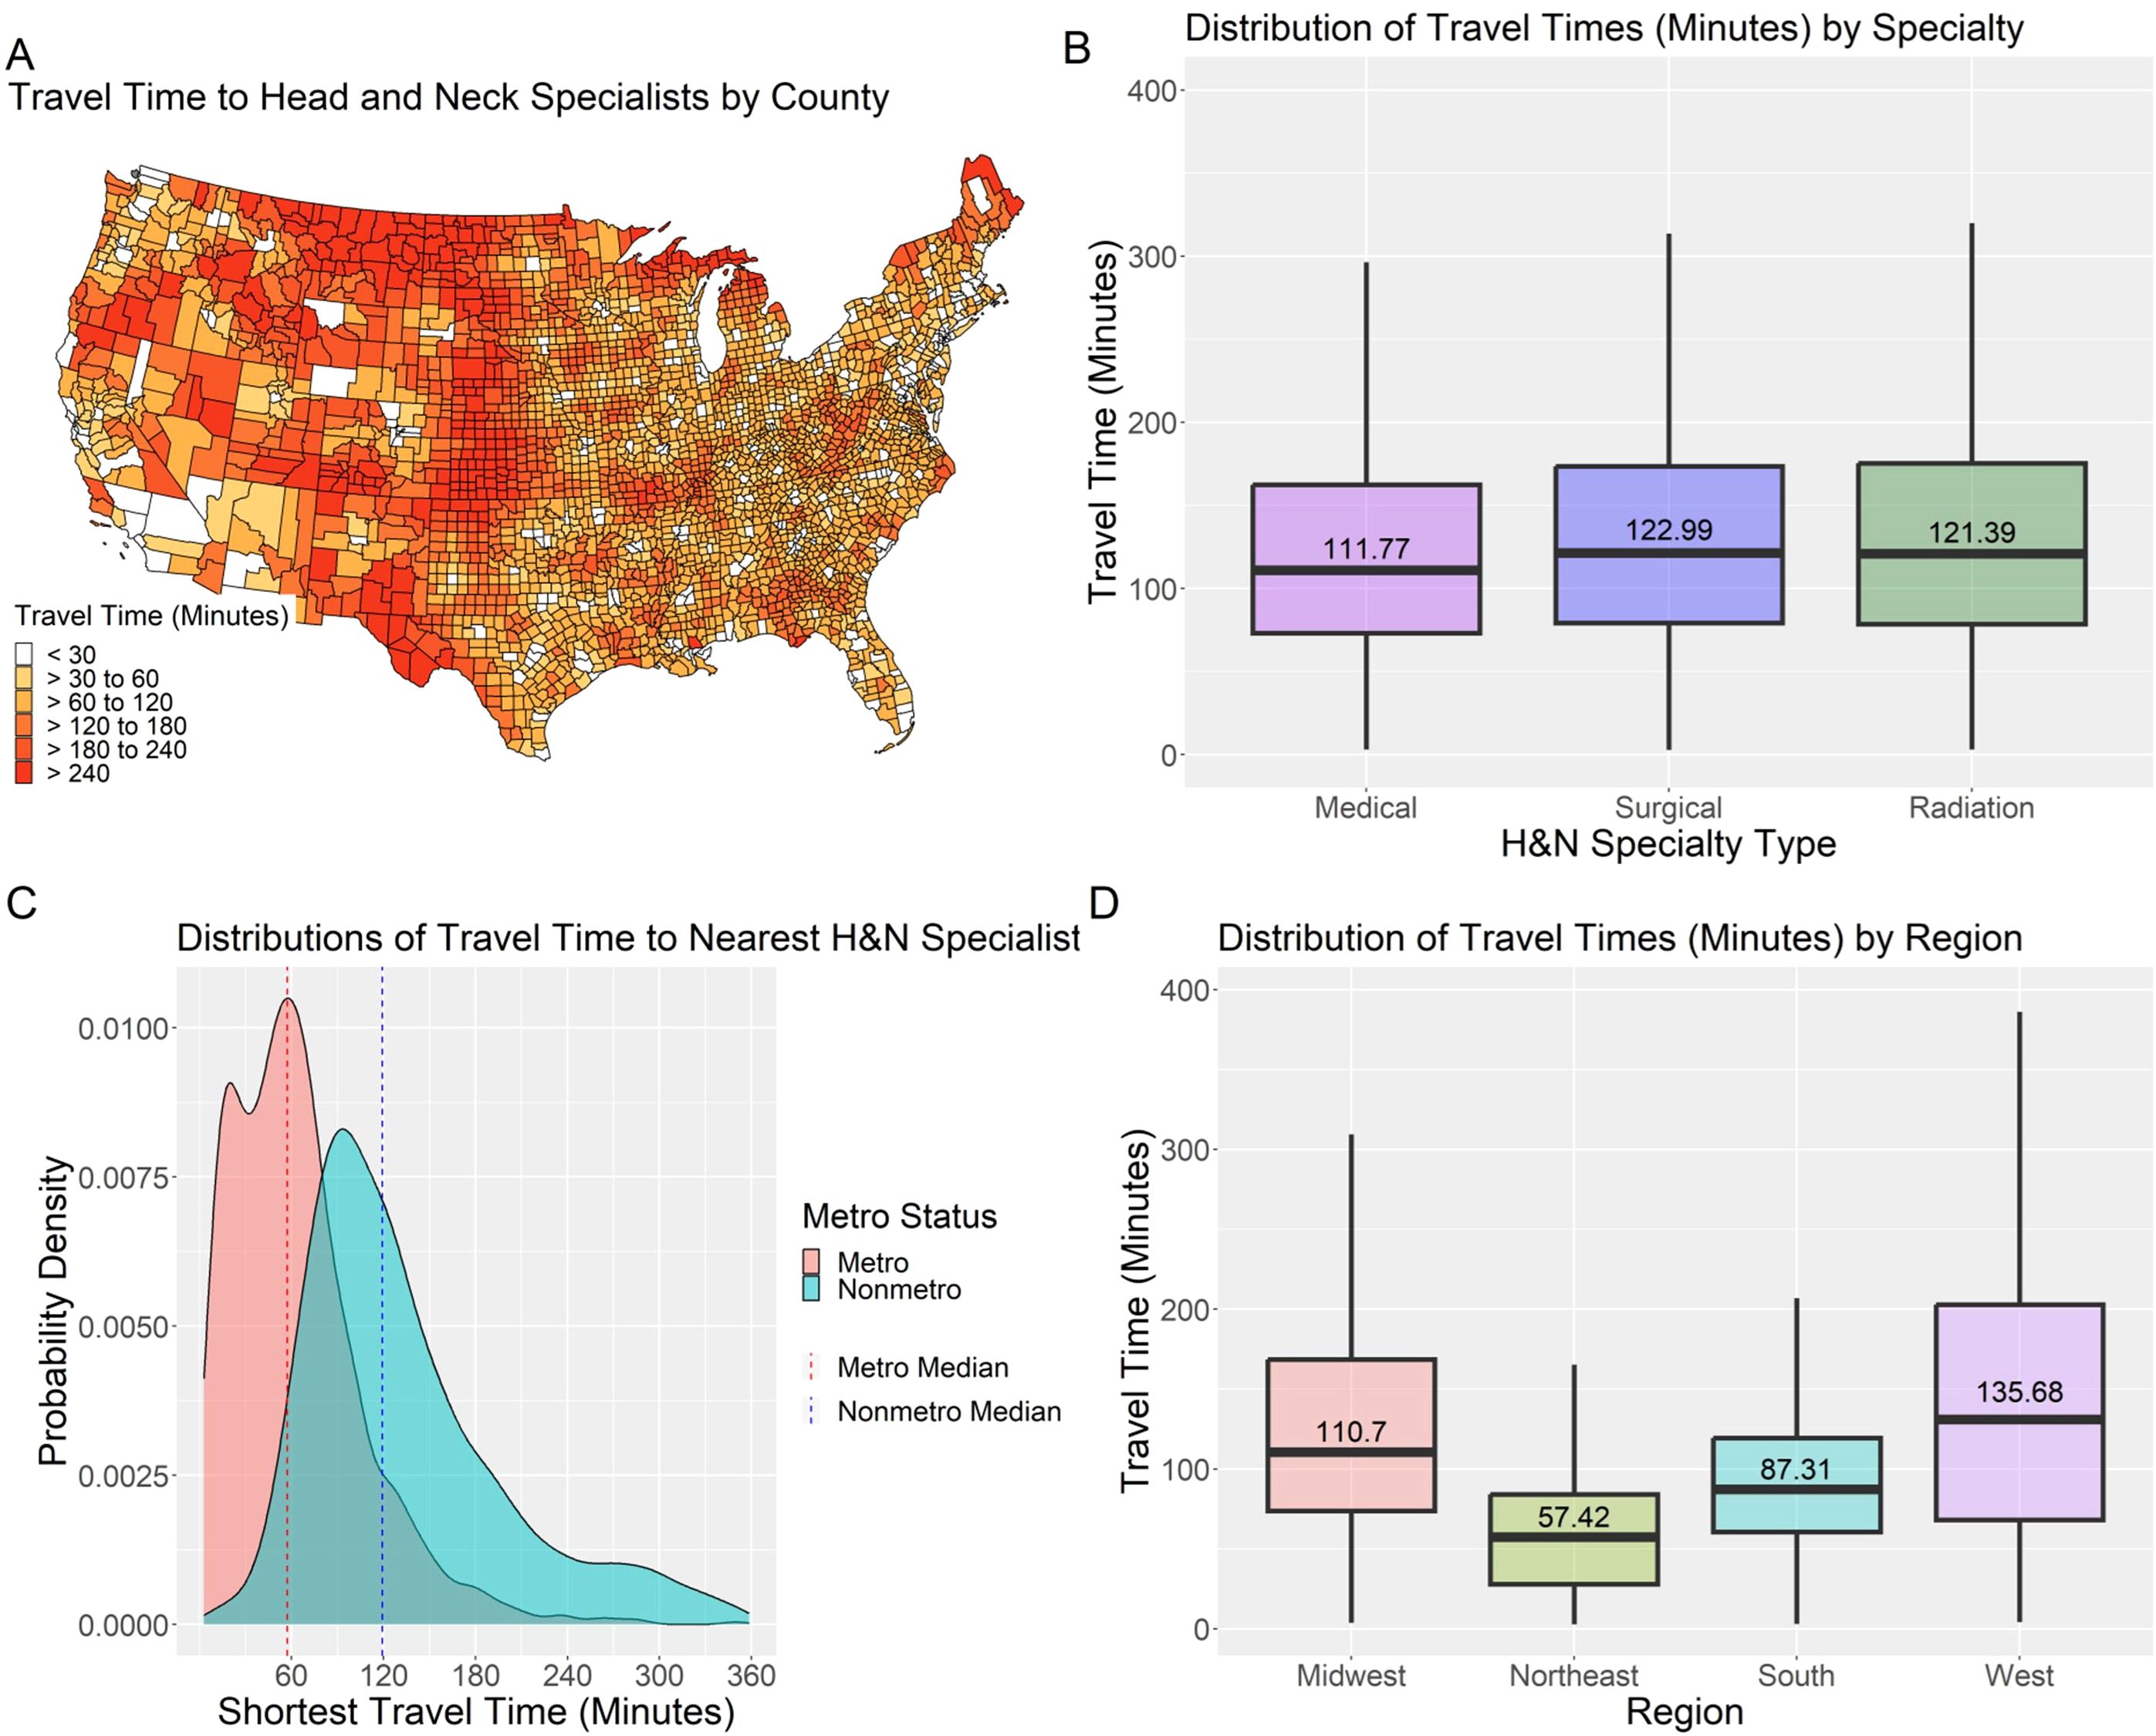
Figure 2. Distributions of travel time to the nearest H&N specialist by US county, provider specialty, county metro status, and US region: (A) isochrone map of travel time to nearest head and neck cancer specialist from population-weighted county centroid; (B) box plot of access metric by head and neck specialist type; (C) probability density function of county-level drive-time to nearest head and neck cancer specialist by metro status; and (D) box plots of access metric by U.S. Census region.
2.4 Statistical analysis
The analysis consisted of descriptive and visual inspections of travel time distributions and social determinants of health variables from the SVI. Social determinants of health (SDOH) variables included in the analysis were the median age and income of all county residents, and the percent of the county population that were male, white, Hispanic, employed, had health insurance, or had a high-school diploma. Other SDOH variables from the SVI were excluded to avoid multicollinearity. Median travel time by U.S. region and metropolitan (metro) and non-metropolitan (non-metro) status was analyzed. Pairwise differences in accessibility in regions were compared using Pairwise Wilcoxon Tests (Table 3). Multivariate quantile regression analysis was performed to assess the relative effects of SDOH and cancer incidence on median estimated travel time across specialist types. Quantile regression was selected over standard linear regression due to the observed skewness in travel time (Figure 3). The model included a suppression flag control variable to account for the effect of suppressed values for cancer incidence (mortality counts below 16 in the USCS data) in the model. Data cleaning, integration, and statistical analyses were conducted using R version 4.3.1.
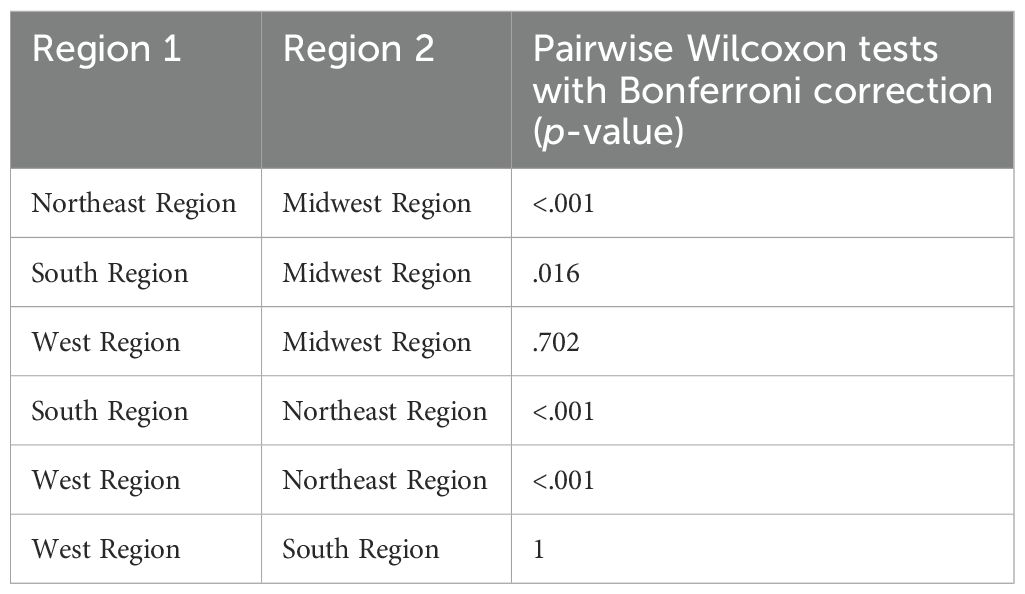
Table 3. Pairwise Wilcoxon tests for differences in access by US region.
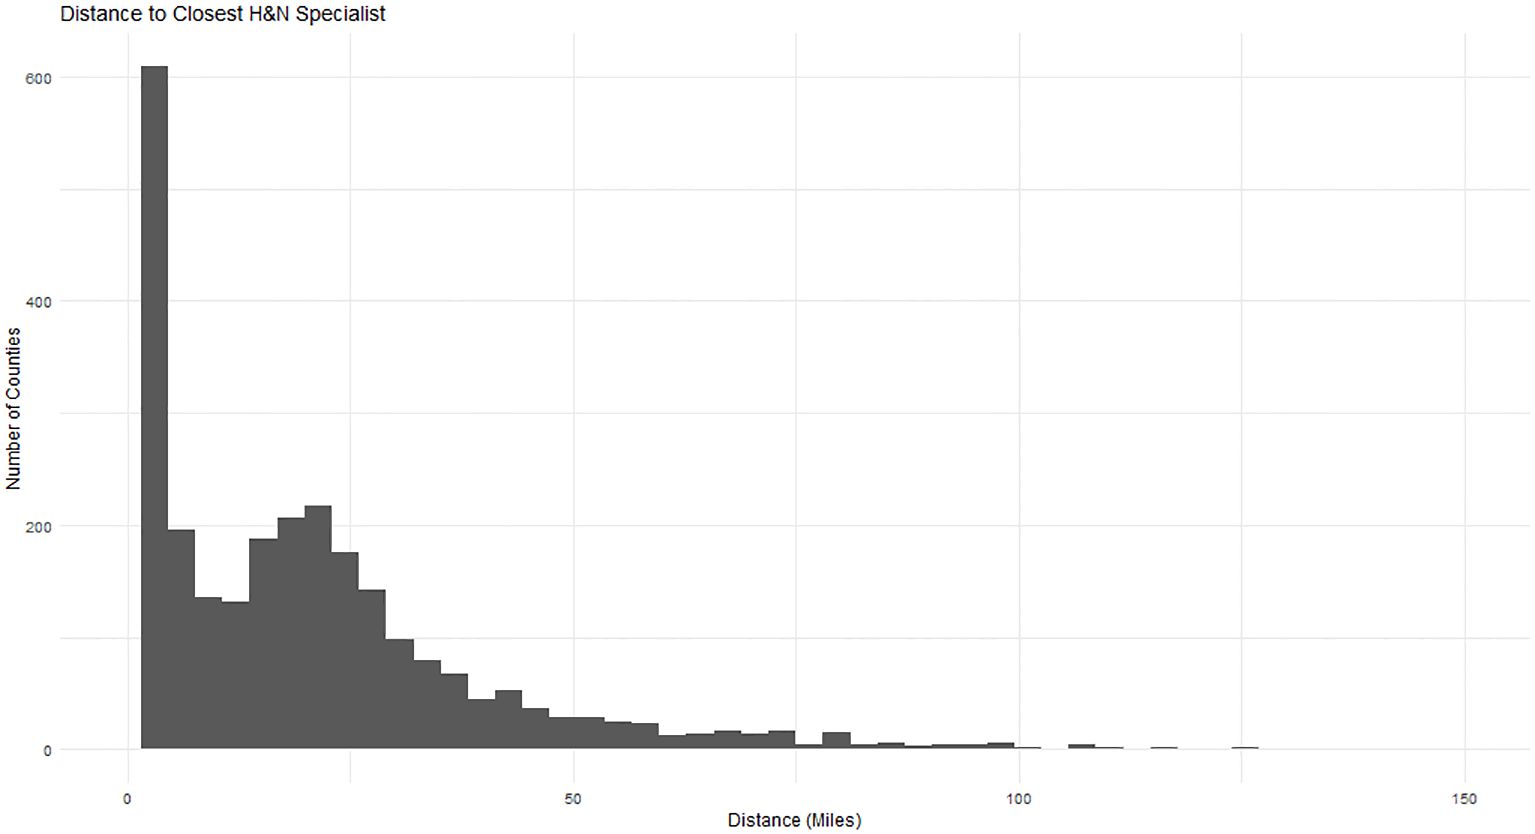
Figure 3. Histogram of travel time to the nearest H&N specialist from county population-weighted centroids.
2.5 Disparity index
A disparity index for H&N specialist access at the county-level was developed, combining H&N cancer incidence, SVI, and estimated travel time to the nearest specialist. The disparity index is a linear combination of county-level access to H&N specialists, cancer incidence, and social vulnerability, which highlights areas where need for care (measured by cancer incidence and SVI) is high and access to care (measured by minimum travel time to the nearest H&N specialist) is low. The index is visualized as a choropleth showing the distribution of access disparity across the US allowing for identification of counties with highest and lowest disparity (Table 4) in terms of access to care (travel time), need for care (cancer incidence), and barriers to care (social vulnerability). Each of the three factors were weighted equally using percentile rank in the calculation. A reliability assessment was performed using Cronbach’s alpha to assess the level of internal consistency between all items in the SVI, H&N cancer incidence rates, and estimated travel time.
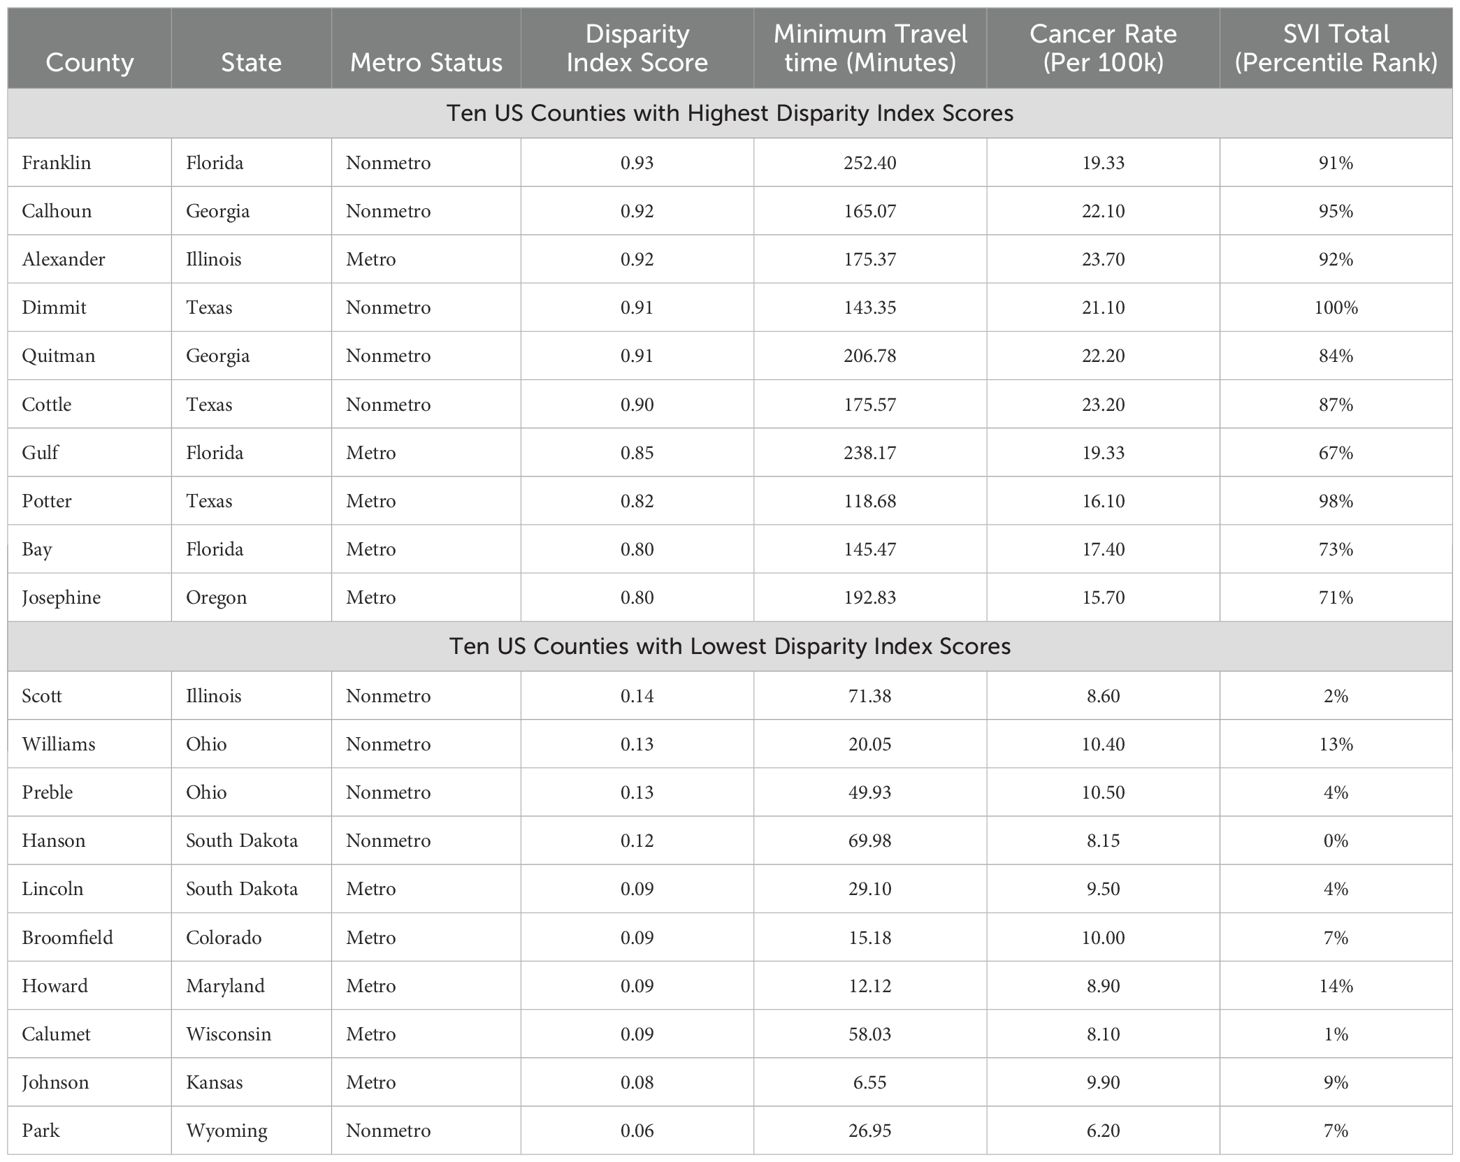
Table 4. Highest and lowest counties by disparity index and metro status.
3 Results
3.1 Classification of specialist types
The combination of ASCO and US News data sources captured 1,112 H&N specialists who all had active NPI records.
The final sample consisted of 453 surgical oncology H&N specialists, 346 medical oncology H&N specialists, and 308 radiation oncology H&N specialists (Figure 1).
3.2 Factors associated with travel time to the nearest H&N specialist
To determine the level of association between US region, metro vs non-metro status, social determinants of health, and travel time, a quantile regression model was evaluated (Figure 4). The alpha level used for significance was.05. In terms of geographic effects, Non-Metro status (B = 35.89, p <.001), Northeast region (B = -22.96, p <.001), South region (B = -14.86, p <.001), and West region (B = 11.59, p = .011) all differed statistically significantly from the reference group of Midwest Metro.
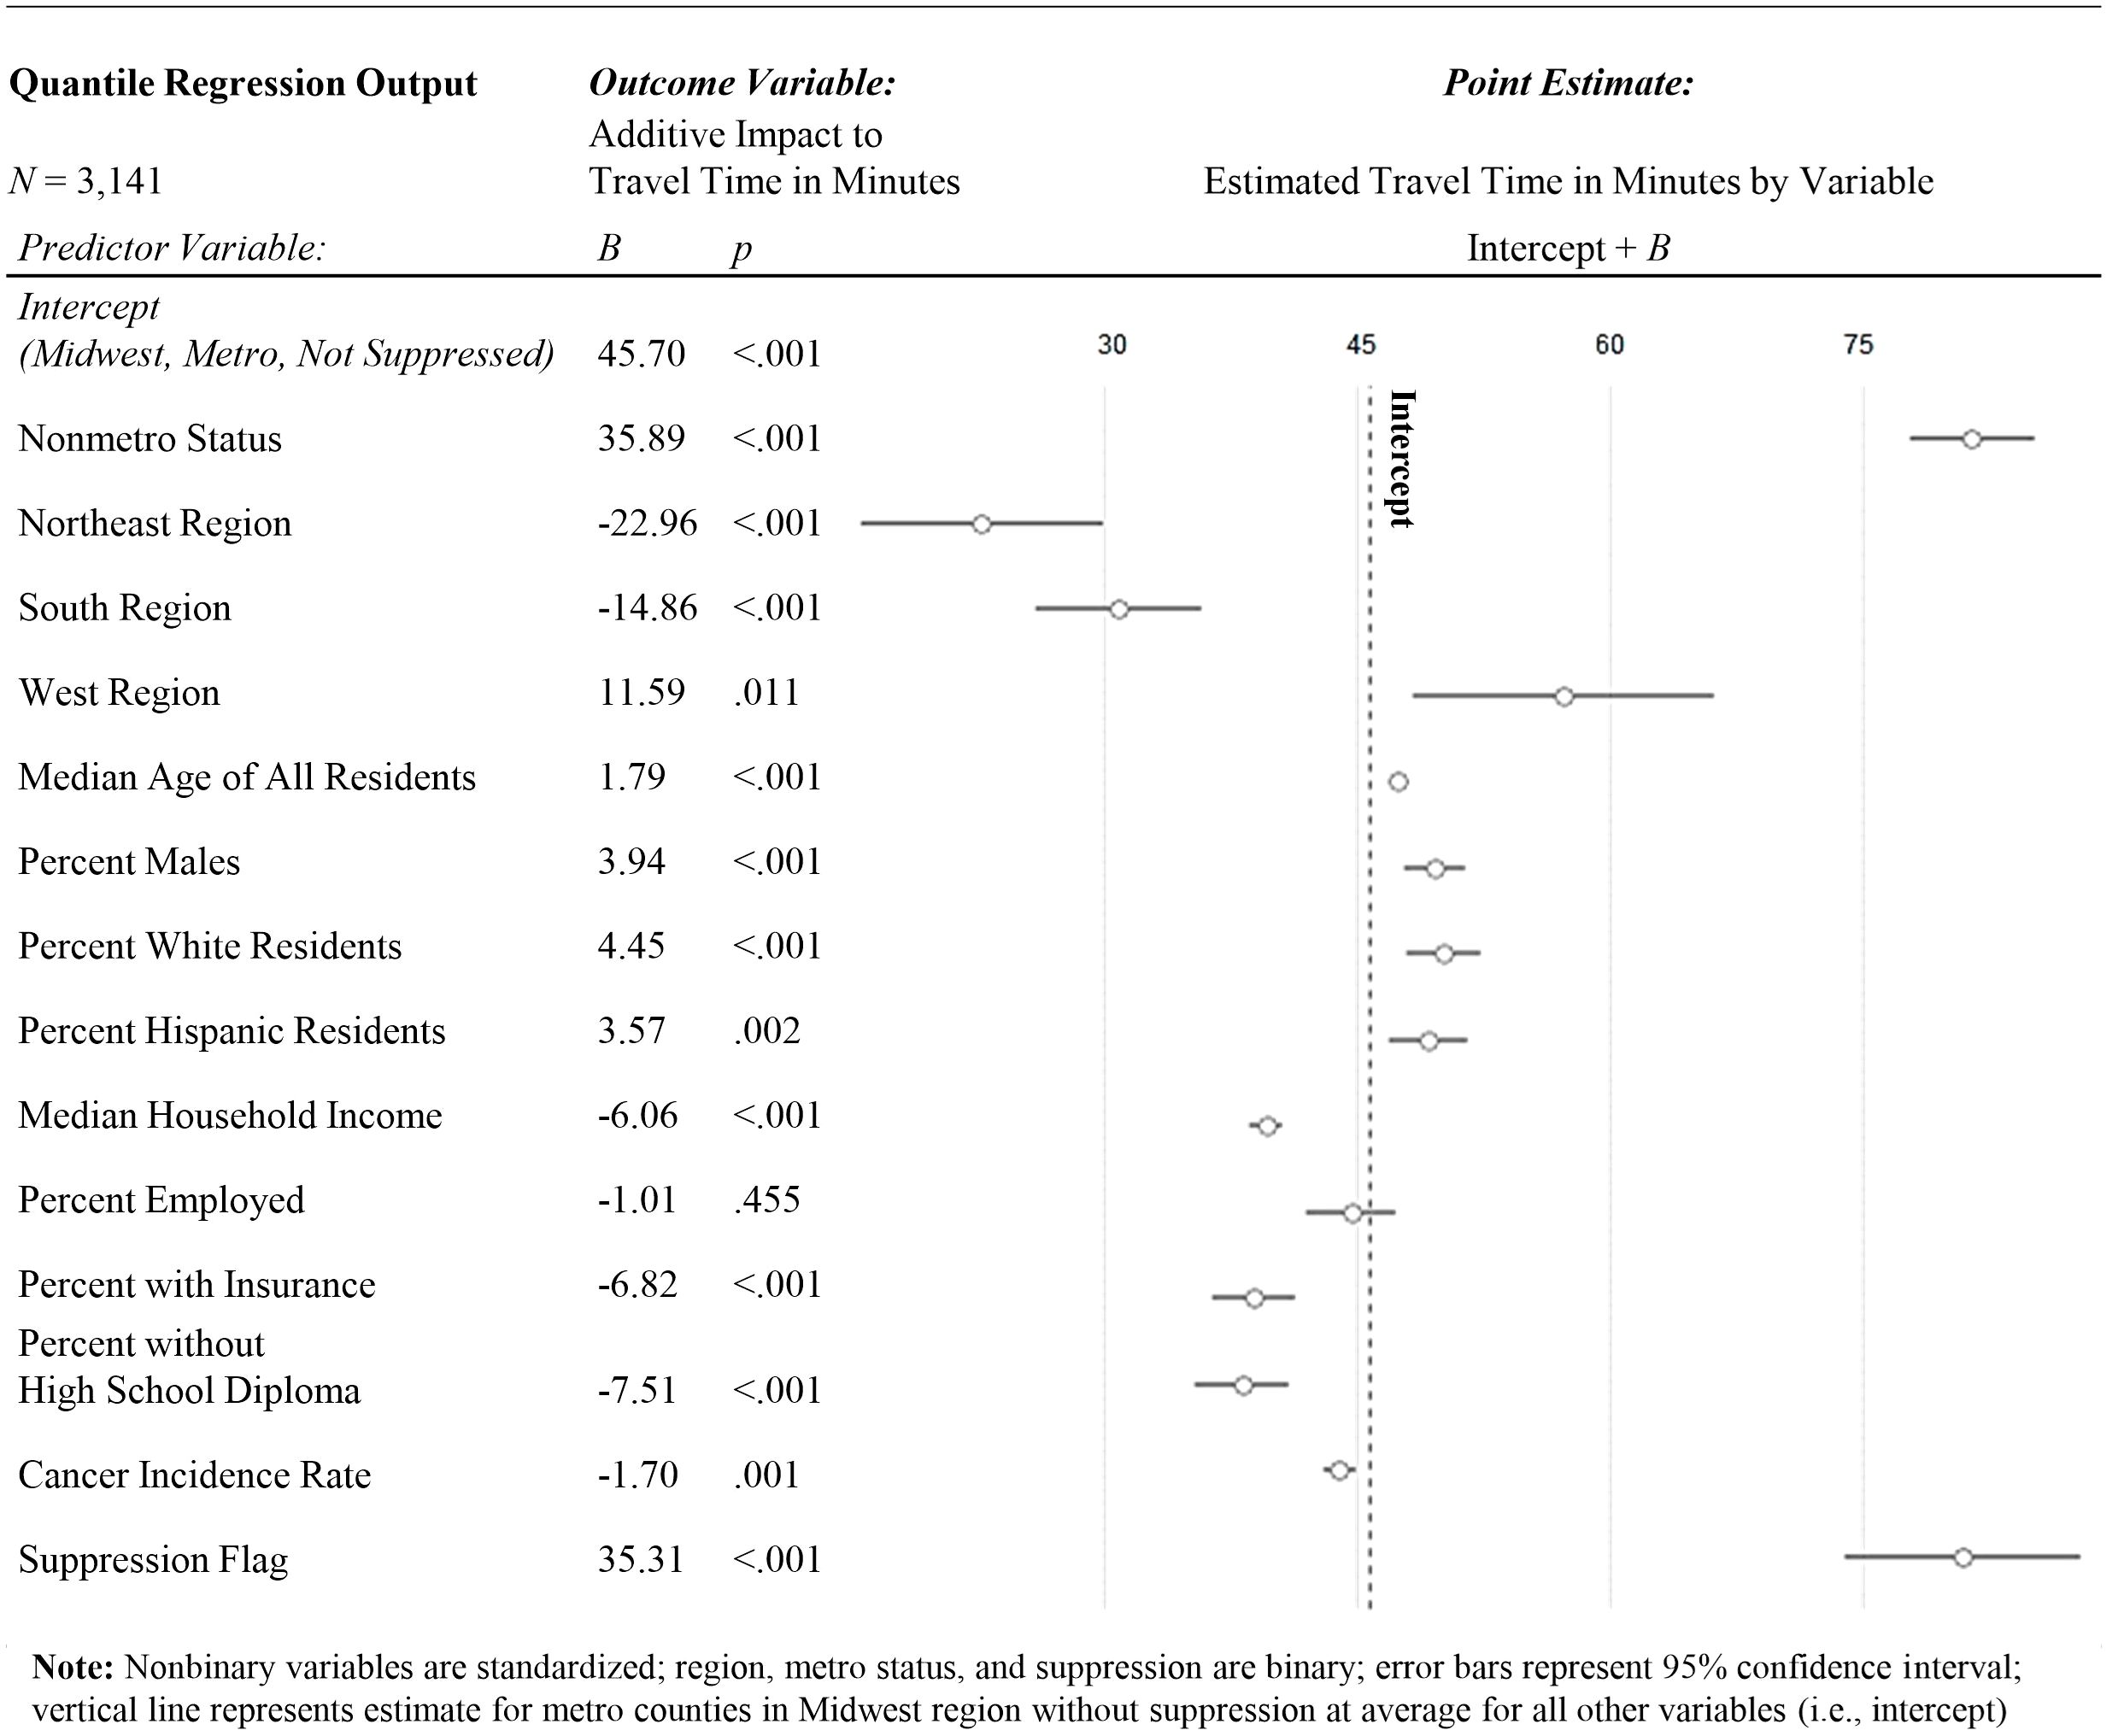
Figure 4. Quantile regression for factors associated with travel time to the nearest H&N specialist.
Among county-level demographic characteristics, age (B = 1.79, p <.001), percent male (B = 3.94, p <.001), percent white (B = 4.45, p <.001), and percent hispanic (B = 3.57, p = .002) all statistically significantly positively predicted travel time. Median household income (B = -6.06, p <.001), percent insured (B = -6.82, p <.001), percent without a high-school diploma (B = -7.51, p <.001), and cancer incidence (B = -1.7, p = .001) all statistically significantly negatively predicted travel time. Percent employed did not statistically significantly predict travel time. Counties with suppressed cancer incidence also differed statistically significantly positively from the comparison group (B = 35.31, p <.001). County-level demographics for counties with and without H&N specialists can be found in Table 5, and county-level SDOH probability density plots by provider coverage can be found in Figure 5.
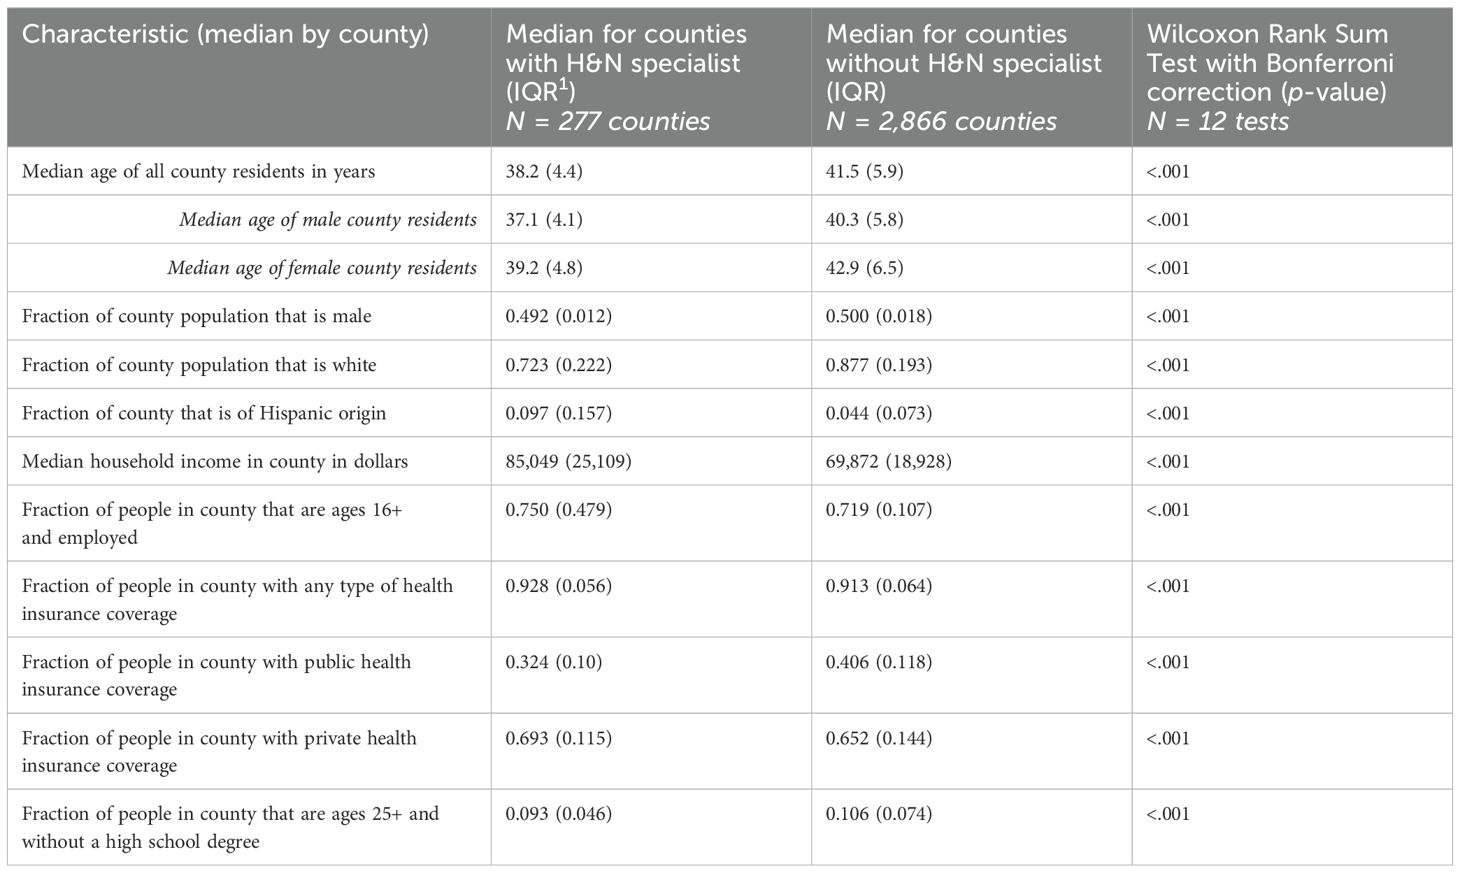
Table 5. County demographics for counties with and without H&N specialists.
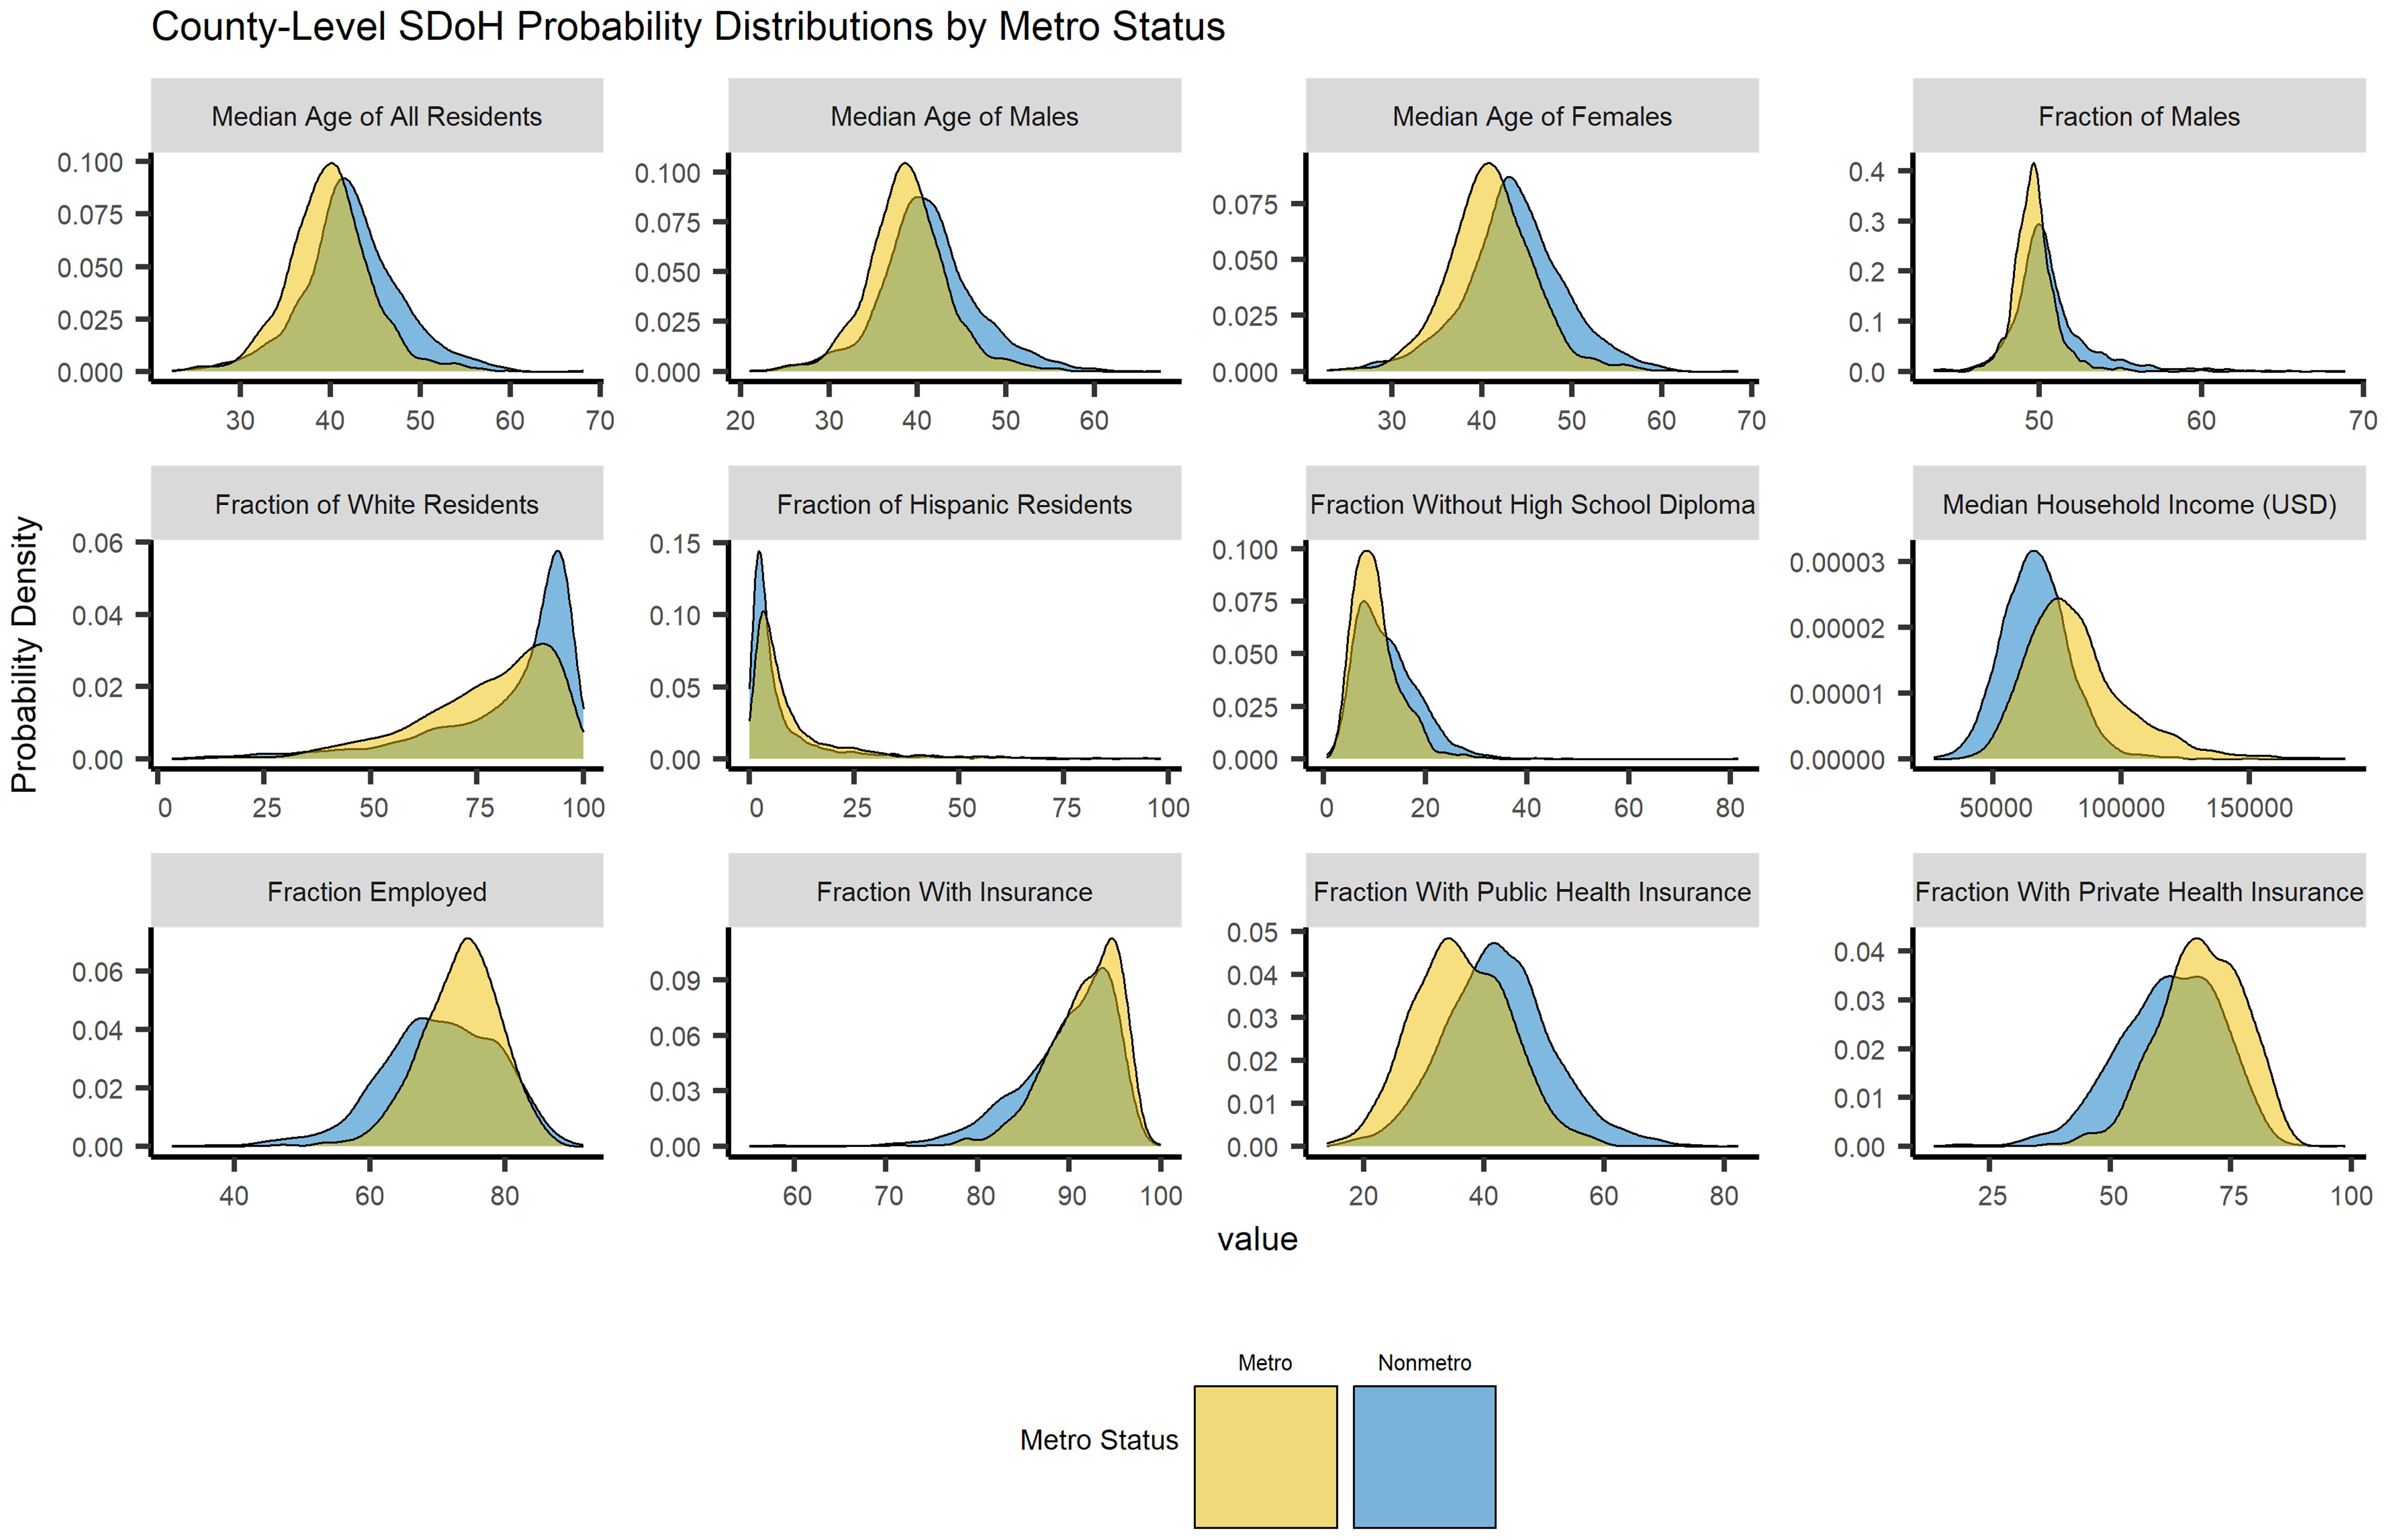
Figure 5. Social determinants of health by head and neck cancer specialist availability.
The predicted travel time for the Midwest Metro reference group was about 46 minutes, whereas travel times for non-metro regions were predicted to be over half an hour longer compared to metro regions (B = 35.89). Travel times in the Northeast and South regions were 22.96 minutes and 14.86 minutes shorter, respectively, compared to the Midwest. Older populations were statistically significantly further from care, with each year increase of median age for the county predicting 1.79 minutes of increased travel time. Counties with higher incomes and greater access to insurance were both found to be be statisticaly significantly closer to care. In terms of racial and ethnic demographics, counties with a higher percentage of males, white residents, hispanic residents and high school graduates were statistically significantly further from care, and counties with a higher cancer incidence rate tended to be closer to care.
3.3 Disparity index
A disparity index (Figure 6) was computed using a linear combination of the county-level percentile rank of travel-time, cancer incidence, and social vulnerability (SVI). The calculated alpha-reliability for the index was 0.74.
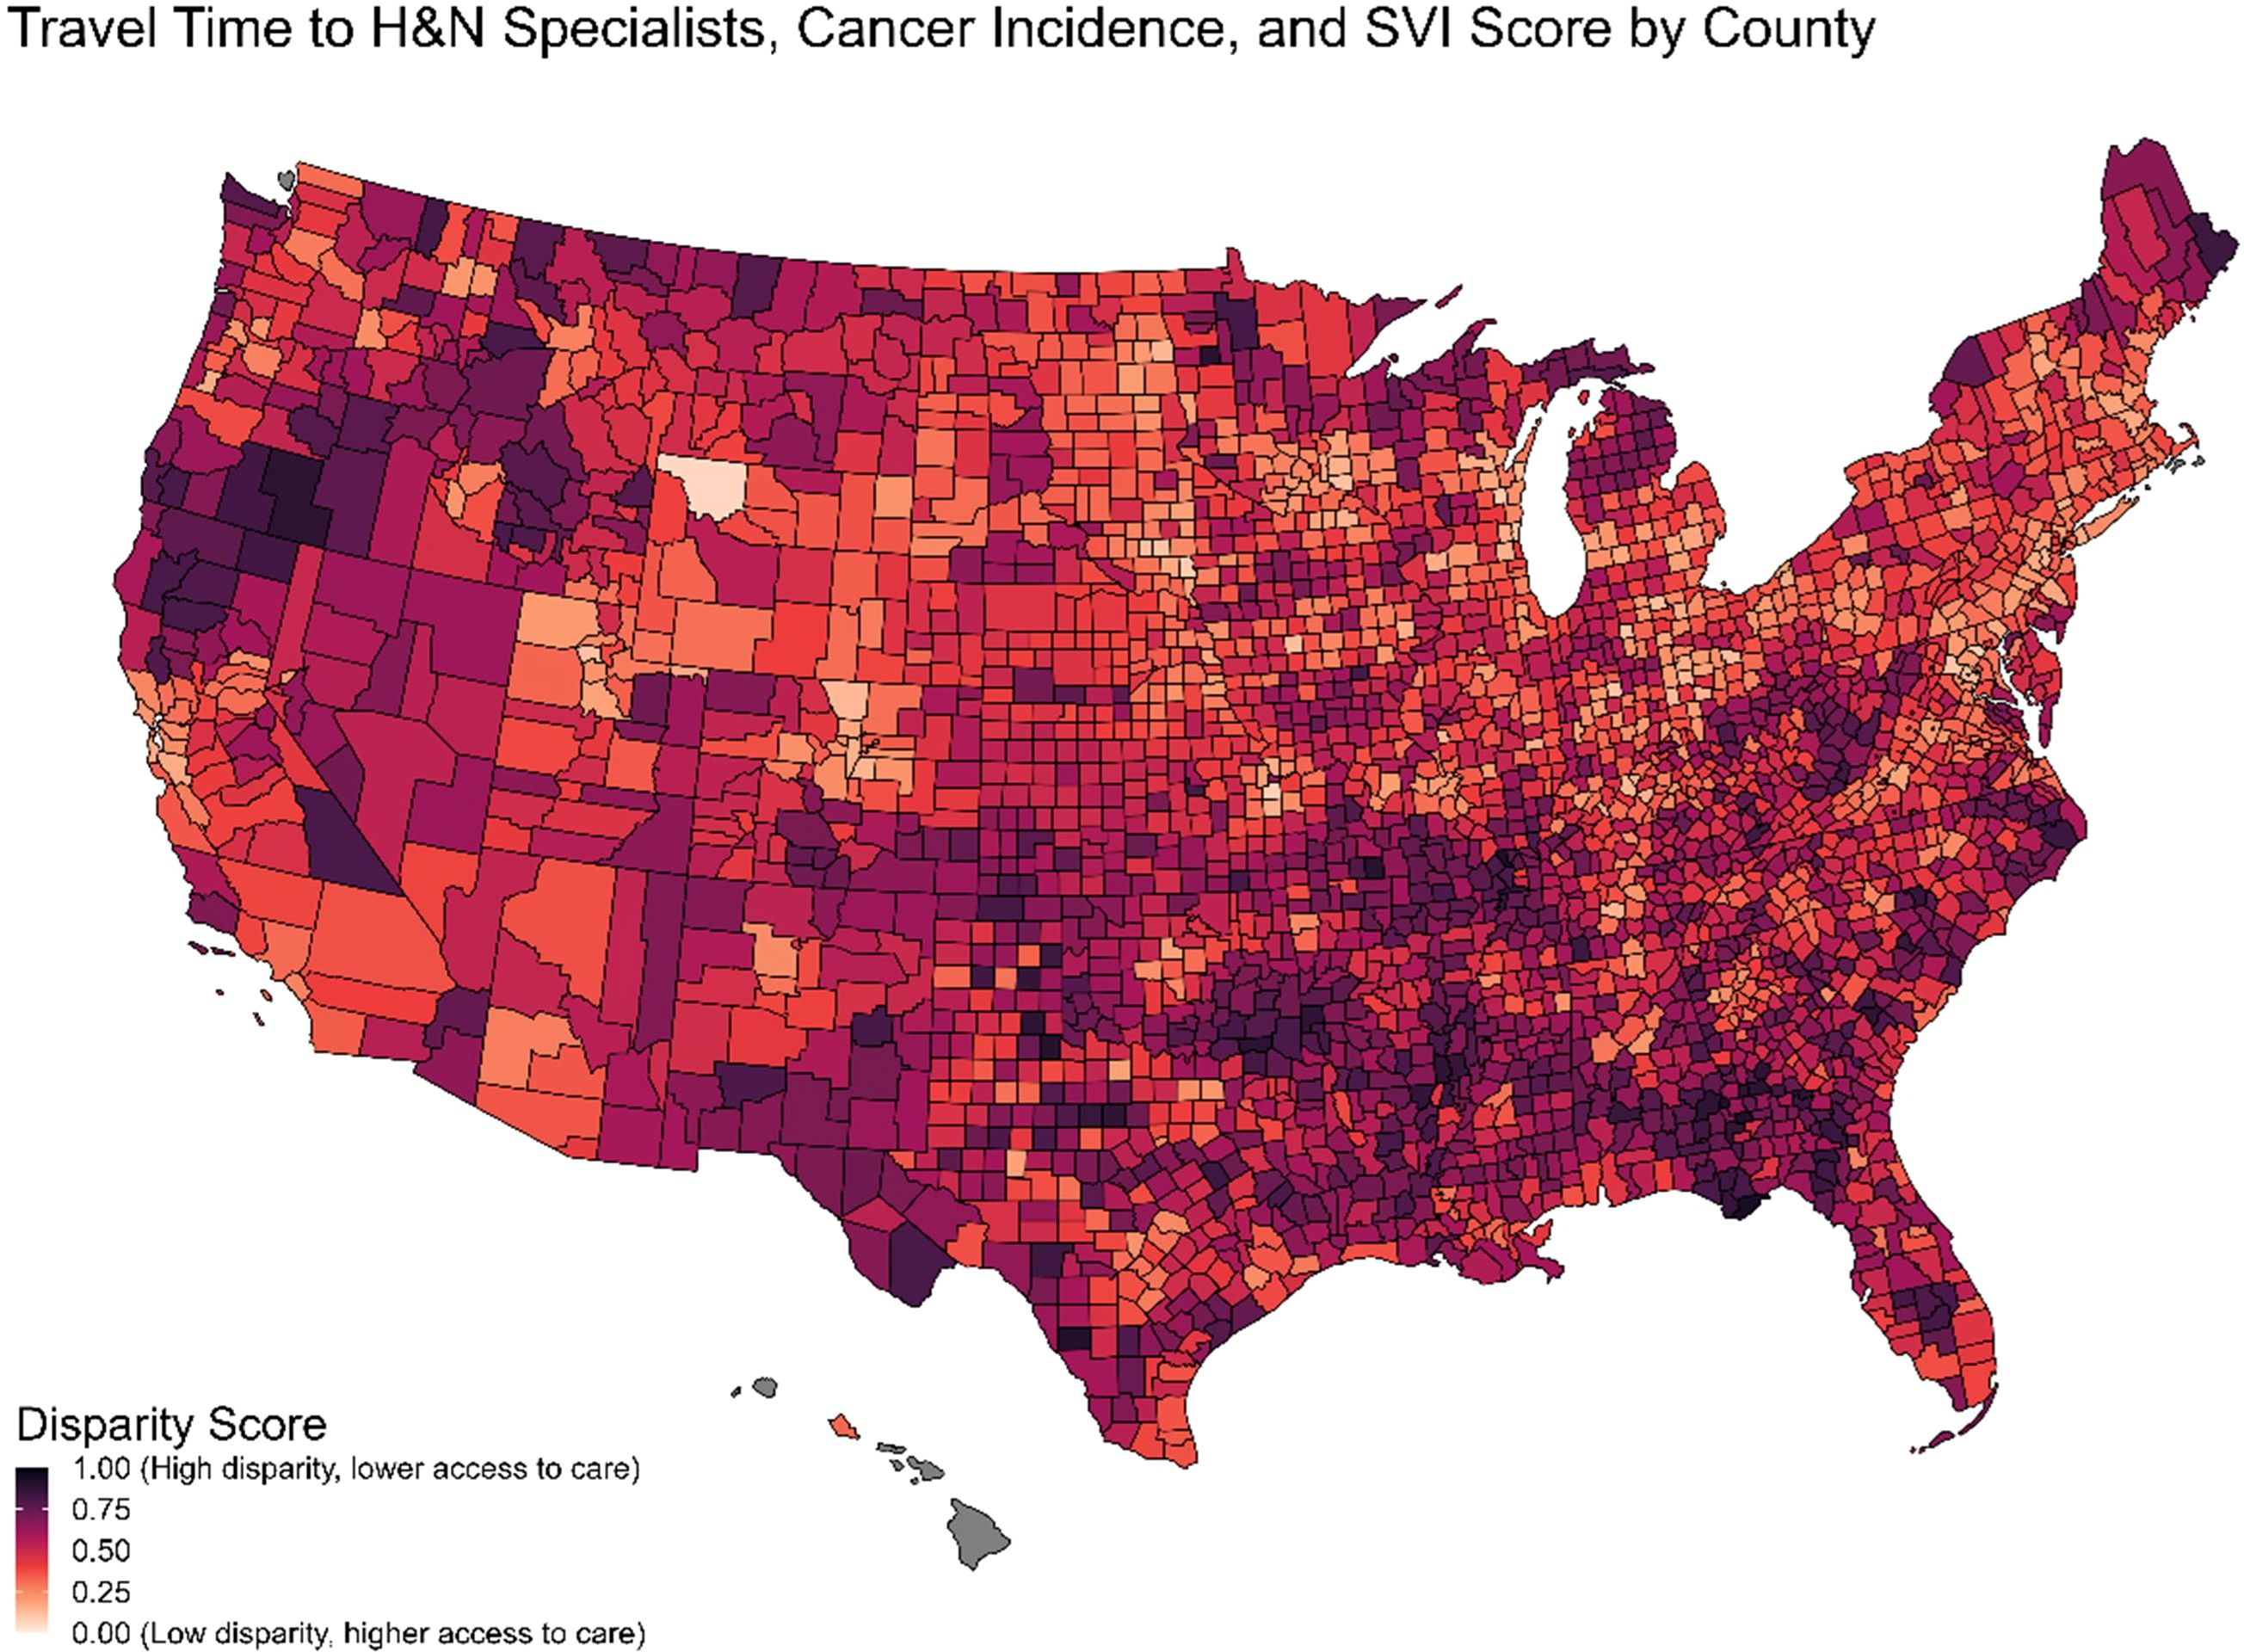
Figure 6. Disparity index from travel time, cancer incidence & social vulnerability index.
Table 4 displays the five highest and five lowest metro counties, and the five highest and five lowest nonmetro counties, by disparity index score. The states with the highest disparity index scores tend to be in the Southern region, whereas the states with the lowest disparity index scores tend to be in the Midwest region.
4 Discussion
Our study illustrates the differences in access to H&N specialist care throughout the US which, as predicted, is linked to socioeconomic status, racial and ethnic background, and healthcare infrastructure (20–24). Our research expands on prior reports by demonstrating the relative contributions of multiple county-level demographics and SDOH in access to specialized care, and by providing a tool in the form of the disparity index to highlight the areas of the US with the highest burden relative to their degree of access. Long travel times are known to impact the continuum of patient care, causing delayed diagnosis, reduced compliance, and limiting adherence to treatment, all of which are known to contribute to individual patient outcomes, reduced survival rates, and decreased quality of life (25, 29).
The analysis revealed significant regional disparities in healthcare access, with notably shorter travel time to H&N specialists in the Northeast compared to other regions. This discrepancy likely stems from higher urban density in the Northeast, leading to more concentrated healthcare facilities and more specialized cancer centers and academic hospitals, resulting in shorter travel distances for specialized care seekers. Infrastructure, such as transportation networks, may also contribute to this difference. Interventions to improve access in regions outside the Northeast could involve initiatives like mobile clinics and targeted outreach programs, as proposed by Moore et al. (27).
As expected, county-level analyses showed significant disparities between metro and non-metro areas in H&N specialist cancer care access, persisting after accounting for region and SDOH. Metro status consistently emerged as a prominent predictor of access disparity, explaining a substantial portion of outcome differences, aligning with existing literature (14, 25, 27).
Key SDOH indicators, such as family income, education, and transportation access, vary even within metro areas, underscoring the complexity of healthcare accessibility beyond urban-rural distinctions. These results show that median age and other county-level demographic characteristics, including the proportion of male, white, and Hispanic residents, all predicted longer travel times to the nearest H&N specialist, after controlling for metro status and geographic region. One potential explanation is that older populations may reside in areas with fewer specialized medical facilities, leading to increased travel times (32, 33). Similarly, counties with higher percentages of males and white residents might reflect demographic patterns associated with more rural or underserved areas, where specialist care is less accessible (14, 34). The higher travel times for counties with larger Hispanic populations could be linked to socio-economic disparities and potential geographic clustering in regions with limited healthcare infrastructure (24, 25, 34).
Results also showed that counties with higher household income, percent insured, and higher cancer incidence were associated with shorter travel times to the nearest head and neck cancer specialist. The positive impact of income and insurance coverage are intuitive as wealthier and insured populations are better equipped to access and afford specialist care and are therefore likely to have better healthcare infrastructure and more specialists, reducing the need for long travel (24, 33, 35, 36). Additionally, regions with higher cancer incidence rates may have more oncologists and specialized care facilities due to the increased demand for such services, thereby reducing travel distances for patients (37).
Counties with higher proportions of individuals lacking a high school diploma showed shorter travel times, aligning with existing research indicating that populations with no high school diploma often reside in urban areas with greater healthcare access, resulting in shorter travel times (32, 38). Potential additional explanations could also be that areas with lower educational attainment have invested in healthcare accessibility as a compensatory measure, there may be local community health initiatives aimed at improving access in these populations, or education might not uniformly influence healthcare accessibility across different regions, highlighting the need for further research to understand these complex dynamics (32, 37).
The Disparity Index, a novel metric, quantifies healthcare access gaps across US counties by considering geographical, socioeconomic, and epidemiological factors. These scores highlight areas where vulnerable populations face disproportionate challenges, which can potentially aid in decision-making about locations to establish additional H&N specialists fellowship programs. For example, a comparison between Alexander, Illinois and Scott, Illinois underscores significant differences in specialized care access despite similar geographic characteristics. The index identifies priority regions for policymakers and practitioners, guiding targeted resource allocation and advocating for interventions like mobile clinics. Strategic interventions, including incentivizing providers to serve underserved areas, can address high-disparity counties with limited specialist availability.
4.1 Limitations
The study's limitations, such as reliance on self-reported cancer specialization data and incomplete coverage including potentially outdated NPI records, suggest opportunities for future refinements, including supplementing sources with municipal or NGO data. Expanding into other cancer sites could improve estimation of specialist providers.
County-level data for SDOH has limitations; using more granular data like census tract or neighborhood level could provide better differentiation, especially in dense urban areas. Future investigations might benefit from exploring neighborhood-level data sourced from municipal databases, NGOs, or cancer registries to capture intricate urban variations accurately. Caution is warranted in assuming causation due to the observational nature of the analysis.
The Travel Time API could not provide estimated travel times greater than twelve hours, and so results for counties with an estimated travel time greater than twelve hours could not be included in the analysis. This limits the generalizability of the results, which may not be representative for counties above this threshold due to this technical limitation.
The unavailability of robust and geographically detailed treatment and mortality data is a limitation of this study. Future studies should incorporate geographically detailed cancer treatment and mortality data to enhance analysis. However, challenges such as variability in coroner and death certificate reporting practices may limit direct geographic comparisons of mortality data (39, 40).
4.2 Conclusions
The demonstrated disparities are known to contribute to health inequities (25–28), illustrating the pressing need for policy interventions to address health care access disparities, suggesting strategies such as incentivizing providers to work in underserved areas to promote equitable resource distribution. Advocacy groups could leverage these findings to promote policies, such as extending existing transportation programs or allocating resources. Clinicians and medical technology companies can utilize the disparity index to identify high-need areas, target outreach efforts, inform resource allocation decisions, improve patient education, and to design inclusive clinical studies, which may help mitigate the impact of the observed disparities (21, 27, 29).
The role of distance in accessing healthcare is critical, impacting patient decisions (25, 26). While this analysis assumed preference for the nearest care facility, future studies should explore distance's role in healthcare-seeking behaviors further and should also consider the role of telehealth in cancer care. Future studies should also explore disparities in care provided by generalists as opposed to specialists to understand its implications on healthcare access, as limited access to H&N specialists does not necessarily equate to limited access to cancer care overall.
In summary, this study highlights significant disparities in healthcare access, driven by geographical factors, metropolitan status, and social determinants of health. Urgent interventions are needed, urging policymakers to incentivize healthcare providers in underserved areas, clinicians to engage in patient education, and advocacy groups to raise awareness and advocate for equitable policies. Addressing these disparities will not only enhance access but also promote equitable healthcare provision for all individuals, irrespective of geographic or sociodemographic factors.
Data availability statement
Publicly available datasets were analyzed in this study. This data can be found here: ASCO (https://asco.org/), US News (https://health.usnews.com/doctors/), NPPES (https://download.cms.gov/nppes), SEER (https://seer.cancer.gov), USCS (https://www.cdc.gov/cancer/uscs), the US Census (https://www.census.gov/data.html), and the CDC (https://www.atsdr.cdc.gov/placeandhealth/svi/). Additional cancer incidence epidemiology data that were unavailable in SEER and USCS were obtained directly from state cancer registries in Nevada, Minnesota, Virginia, and Kansas.
Ethics statement
The studies involving humans were approved by Merck CORE (Center for Observational and Real-world Evidence) Document Review Committee (DRC). The studies were conducted in accordance with the local legislation and institutional requirements. Written informed consent for participation was not required from the participants or the participants' legal guardians/next of kin in accordance with the national legislation and institutional requirements.
Author contributions
BG: Writing – original draft, Writing – review & editing, Conceptualization, Data curation, Formal analysis, Supervision. GH: Writing – original draft, Writing – review & editing, Project administration. DZ: Writing – original draft, Writing – review & editing, Conceptualization, Project administration. MH: Writing – original draft, Writing – review & editing, Conceptualization, Project administration. MC: Writing – original draft, Writing – review & editing, Conceptualization, Project administration, Supervision. AF: Writing – original draft, Writing – review & editing, Data curation, Project administration. HW: Writing – original draft, Writing – review & editing, Conceptualization, Project administration. FS: Writing – original draft, Writing – review & editing, Conceptualization, Project administration, Supervision. CB: Writing – original draft, Writing – review & editing, Conceptualization, Project administration, Supervision.
Funding
The author(s) declare that financial support was received for the research, authorship, and/or publication of this article. The study was funded by Merck Sharp & Dohme LLC, a subsidiary of Merck & Co., Inc., Rahway, NJ, USA.
Acknowledgments
The authors would like to acknowledge Sanjay Merchant, Zach Houghtaling, and Peter Fiduccia for their advice and guidance on this project and manuscript.
Conflict of interest
Authors BG, MC, AF, HW, and FS were employed by the company Guidehouse, Inc. Authors DZ, MH, and CB were employed by the company Merck Sharp & Dohme LLC, a subsidiary of Merck & Co., Inc., Rahway, NJ, USA and DZ, MH, and CB were shareholders in Merck & Co., Inc., Rahway, NJ, USA. BG, MC, HW, AF, HW, FS, and GH have received consulting fees from Merck Sharp & Dohme LLC, a subsidiary of Merck & Co., Inc., Rahway, NJ, USA.
The authors declare that this study received funding from Merck Sharp & Dohme LLC, a subsidiary of Merck & Co., Inc., Rahway, NJ, USA. The funder had the following involvement in the study: all aspects of the study were conducted by employees of Merck & Co., Inc,. and consultants paid by Merck Sharp & Dohme LLC.
Generative AI statement
The author(s) declare that no Generative AI was used in the creation of this manuscript.
Publisher’s note
All claims expressed in this article are solely those of the authors and do not necessarily represent those of their affiliated organizations, or those of the publisher, the editors and the reviewers. Any product that may be evaluated in this article, or claim that may be made by its manufacturer, is not guaranteed or endorsed by the publisher.
References
1. Cramer JD, Burtness B, Le QT, and Ferris RL. The changing therapeutic landscape of head and neck cancer. Nat Rev Clin Oncol. (2019) 16:669–83. doi: 10.1038/s41571-019-0227-z
2. Licitra L, Keilholz U, Tahara M, Lin JC, Chomette P, Ceruse P, et al. Evaluation of the benefit and use of multidisciplinary teams in the treatment of head and neck cancer. Oral Oncol. (2016) 59:73–9. doi: 10.1016/j.oraloncology.2016.06.002
3. Marur S and Forastiere AA. Head and neck cancer: changing epidemiology, diagnosis, and treatment. Mayo Clinic Proc. (2008) 83:489–501. doi: 10.4065/83.4.489
4. Oosting SF and Haddad RI. Best practice in systemic therapy for head and neck squamous cell carcinoma. Front Oncol. (2019) 9:815. doi: 10.3389/fonc.2019.00815
5. Mody MD, Rocco JW, Yom SS, Haddad RI, and Saba NF. Head and neck cancer. Lancet. (2021) 398:2289–99. doi: 10.1016/S0140-6736(21)01550-6
6. Mahal BA, Catalano PJ, Haddad RI, Hanna GJ, Kass JI, Schoenfeld JD, et al. Incidence and demographic burden of HPV-associated oropharyngeal head and neck cancers in the United States. Cancer Epidemiol Biomarkers Prev. (2019) 28:1660–7. doi: 10.1158/1055-9965.EPI-19-0038
7. Gibson MK and Forastiere AA. Multidisciplinary approaches in the management of advanced head and neck tumors: state of the art. Curr Opin Oncol. (2004) 16:220. doi: 10.1097/00001622-200405000-00005
8. Dittrich C, Kosty M, Jezdic S, Pyle D, Berardi R, Bergh J, et al. ESMO / ASCO recommendations for a global curriculum in medical oncology edition 2016. ESMO Open. (2016) 1:e000097. doi: 10.1136/esmoopen-2016-000097
9. Grégoire V, Lefebvre JL, Licitra L, and Felip E. Squamous cell carcinoma of the head and neck: EHNS–ESMO–ESTRO Clinical Practice Guidelines for diagnosis, treatment and follow-up. Ann Oncol. (2010) 21:v184–6. doi: 10.1093/annonc/mdq185
10. Mesía R, Pastor M, Grau JJ, and Del Barco E. SEOM clinical guidelines for the treatment of head and neck cancer (HNC) 2013. Clin Transl Oncol. (2013) 15:1018–24. doi: 10.1007/s12094-013-1096-z
11. Referenced with permission from the NCCN clinical practice guidelines in oncology (NCCN guidelines®) for head and neck cancers. Version 4.2024. National Comprehensive Cancer Network, Inc (2024).
12. Hanna GJ, Adkins DR, Zolkind P, and Uppaluri R. Rationale for neoadjuvant immunotherapy in head and neck squamous cell carcinoma. Oral Oncol. (2017) 73:65–9. doi: 10.1016/j.oraloncology.2017.08.008
13. Uppaluri R, Campbell KM, Egloff AM, Zolkind P, Skidmore ZL, Nussenbaum B, et al. Neoadjuvant and adjuvant pembrolizumab in resectable locally advanced, human papillomavirus–unrelated head and neck cancer: A multicenter, phase II trial. Clin Cancer Res. (2020) 26:5140–52. doi: 10.1158/1078-0432.CCR-20-1695
14. Clarke JA, Despotis AM, Ramirez RJ, Zevallos JP, and Mazul AL. Head and neck cancer survival disparities by race and rural–urban context. Cancer Epidemiol Biomarkers Prev. (2020) 29:1955–61. doi: 10.1158/1055-9965.EPI-20-0376
15. Zhang H, Dziegielewski PT, Nguyen TJ, Jeffery CC, O’Connell DA, Harris JR, et al. The effects of geography on survival in patients with oral cavity squamous cell carcinoma. Oral Oncol. (2015) 51:578–85. doi: 10.1016/j.oraloncology.2015.03.012
16. Cohen EEW, LaMonte SJ, Erb NL, Beckman KL, Sadeghi N, Hutcheson KA, et al. American cancer society head and neck cancer survivorship care guideline. CA A Cancer J Clin. (2016) 66:203–39. doi: 10.3322/caac.21343
17. Argiris A, Karamouzis MV, Raben D, and Ferris RL. Head and neck cancer. Lancet. (2008) 371:1695–709. doi: 10.1016/S0140-6736(08)60728-X
18. Bellaiche MMJ, Fan W, Walbert HJ, McClave EH, Goodnight BL, Sieling FH, et al. Disparity in access to oncology precision care: A geospatial analysis of driving distances to genetic counselors in the U.S. Front Oncol. (2021) 11:689927. doi: 10.3389/fonc.2021.689927
19. Global Burden of Disease Cancer Collaboration. The global burden of cancer 2013. JAMA Oncol. (2015) 1:505–27. doi: 10.1001/jamaoncol.2015.0735
20. Adler NE, Boyce T, Chesney MA, Cohen S, Folkman S, Kahn RL, et al. Socioeconomic status and health: The challenge of the gradient. Am Psychol. (1994) 49:15–24. doi: 10.1037/0003-066X.49.1.15
21. Andermann A. Taking action on the social determinants of health in clinical practice: a framework for health professionals. CMAJ. (2016) 188:E474–83. doi: 10.1503/cmaj.160177
22. Braveman P and Gottlieb L. The social determinants of health: it’s time to consider the causes of the causes. Public Health Rep. (2014) 129:19–31. doi: 10.1177/00333549141291S206
23. Krieger N. Geocoding and monitoring of US socioeconomic inequalities in mortality and cancer incidence: does the choice of area-based measure and geographic level matter?: the public health disparities geocoding project. Am J Epidemiol. (2002) 156:471–82. doi: 10.1093/aje/kwf068
24. Krieger N, Chen JT, Waterman PD, Rehkopf DH, and Subramanian SV. Painting a truer picture of US socioeconomic and racial/ethnic health inequalities: the public health disparities geocoding project. Am J Public Health. (2005) 95:312–23. doi: 10.2105/AJPH.2003.032482
25. Massa ST, Liebendorfer AP, Zevallos JP, and Mazul AL. Distance traveled to head and neck cancer provider: A measure of socioeconomic status and access. Otolaryngol–head Neck Surg. (2020) 162:193–203. doi: 10.1177/0194599819892015
26. Massa ST, Mazul AL, Puram SV, Pipkorn P, Zevallos JP, and Piccirillo JF. Association of demographic and geospatial factors with treatment selection for laryngeal cancer. JAMA Otolaryngol Head Neck Surg. (2021) 147:590. doi: 10.1001/jamaoto.2021.0453
27. Moore CE, Warren R, and Maclin SD. Head and neck cancer disparity in underserved communities: probable causes and the ethics involved. J Health Care Poor Underserved. (2012) 23:88–103. doi: 10.1353/hpu.2012.0165
28. Steuer CE, El-Deiry M, Parks JR, Higgins KA, and Saba NF. An update on larynx cancer. CA A Cancer J Clin. (2017) 67:31–50. doi: 10.3322/caac.21386
29. Zavala VA, Bracci PM, Carethers JM, Carvajal-Carmona L, Coggins NB, Cruz-Correa MR, et al. Cancer health disparities in racial/ethnic minorities in the United States. Br J Cancer. (2021) 124:315–32. doi: 10.1038/s41416-020-01038-6
30. Centers for Disease Control and Prevention/ Agency for Toxic Substances and Disease Registry/ Geospatial Research, Analysis, and Services Program. CDC/ATSDR Social Vulnerability Index 2020 Database US. Available online at: https://www.atsdr.cdc.gov/placeandhealth/svi (Accessed October 19, 2024).
31. TravelTime. TravelTime API. Available online at: https://docs.traveltime.com/api/ (Accessed August 15, 2024).
32. Mandelblatt JS, Yabroff KR, and Kerner JF. Equitable access to cancer services: A review of barriers to quality care. Cancer. (1999) 86:2378–90. doi: 10.1002/(SICI)1097-0142(19991201)86:11<2378::AID-CNCR28>3.0.CO;2-L
33. Salehi O, Vega EA, Lathan C, James D, Kozyreva O, Alarcon SV, et al. Race, age, gender, and insurance status: A comparative analysis of access to and quality of gastrointestinal cancer care. J Gastrointest Surge. (2021) 25:2152–62. doi: 10.1007/s11605-021-05038-6
34. Mollica MA, Weaver KE, McNeel TS, and Kent EE. Examining urban and rural differences in perceived timeliness of care among cancer patients: A SEER-CAHPS study. Cancer. (2018) 124:3257–65. doi: 10.1002/cncr.31541
35. Ward E, Halpern M, Schrag N, Cokkinides V, DeSantis C, Bandi P, et al. Association of insurance with cancer care utilization and outcomes. CA: A Cancer J Clin. (2008) 58:9–31. doi: 10.3322/CA.2007.0011
36. Abdelsattar ZM, Hendren S, and Wong SL. The impact of health insurance on cancer care in disadvantaged communities. Cancer. (2017) 123:1219–27. doi: 10.1002/cncr.30431
37. Adams SA, Choi SK, Khang LA, Campbell D, Friedman DB, Eberth JM, et al. Decreased cancer mortality-to-incidence ratios with increased accessibility of federally qualified health centers. J Community Health. (2015) 40:633–41. doi: 10.1007/s10900-014-9978-8
38. Onega T, Duell EJ, Shi X, Wang D, Demidenko E, and Goodman D. Geographic access to cancer care in the U.S. Cancer. (2008) 112:909–18. doi: 10.1002/cncr.23229
39. National Academies of Sciences, Engineering, and Medicine, Division of Behavioral and Social Sciences and Education, Committee on National Statistics, Committee on Population, and Committee on Rising Midlife Mortality Rates and Socioeconomic Disparities. High and Rising Mortality Rates Among Working-Age Adults. Harris KM, Majmundar MK, and Becker T, editors. Washington (DC): National Academies Press (US) (2021). p. 25976. doi: 10.17226/25976
Keywords: geographic disparities, head and neck cancer, health equity, social determinants of health, access to care, disparity index, travel time analysis
Citation: Goodnight BL, Hanna GJ, Zheng D, Habila M, Cassese M, Fortman A, Walbert H, Sieling F and Black CM (2025) Access to head and neck cancer specialists: a geospatial analysis of U.S. travel time. Front. Oncol. 15:1521370. doi: 10.3389/fonc.2025.1521370
Received: 01 November 2024; Accepted: 03 February 2025;
Published: 31 July 2025.
Edited by:
Oreste Iocca, University of Turin, ItalyReviewed by:
Vishal Gupta, University at Buffalo, United StatesJerry Liu, Icahn School of Medicine at Mount Sinai, United States
Copyright © This work is authored by Goodnight, Hanna, Zheng, Habila, Cassese, Fortman, Walbert, Sieling, Black © 2025 Merck & Co Inc., Rahway, NJ, USA and its affiliates and Hanna. This is an open-access article distributed under the terms of the Creative Commons Attribution License (CC BY). The use, distribution or reproduction in other forums is permitted, provided the original author(s) and the copyright owner(s) are credited and that the original publication in this journal is cited, in accordance with accepted academic practice. No use, distribution or reproduction is permitted which does not comply with these terms.
*Correspondence: Christopher M. Black, Y2hyaXN0b3BoZXIuYmxhY2syQG1lcmNrLmNvbQ==