 Qing Wang1,2†
 Xiao Han3†Jun Zhang1,2Mengying Hu1,2Jiaojiao Xu1Qiongqiong Ai1Hequn Wei1Jiao Yu1
 Haiping Ma1*
- 1The Second Affiliated Hospital of Nanchang University, Nanchang, Jiangxi, China
- 2School of Nursing, Jiangxi Medical College, Nanchang University, Nanchang, Jiangxi, China
- 3The Affiliated Stomatological Hospital of Nanchang University, Nanchang, Jiangxi, China
Background: To explore the risk factors associated with falls in elderly lung cancer patients with sarcopenia, construct a predictive model, and validate its performance.
Methods: This cross-sectional study involved 316 lung cancer patients with sarcopenia who were hospitalized in the oncology, thoracic surgery, and respiratory medicine departments of a tertiary hospital in Jiangxi Province between January 2023 and December 2023. Data were collected through questionnaires and physical measurements. A logistic regression predictive model was developed on the basis of independent risk factors.
Results: The incidence of falls among elderly lung cancer patients with sarcopenia was 19.94%. Multivariate logistic regression analysis identified multiple metastases, nocturia (≥3 times per night), sleep disorders, frailty, and malnutrition as independent risk factors for falls. The Hosmer - Lemeshow test indicated good model fit (X2 = 5.353, P=0.719), with an overall predictive accuracy of 83.7%. The area under the ROC curve (AUC) was 0.832, and the Youden index reached a maximum of 0.577, corresponding to a sensitivity of 74.7%, specificity of 83.0%, and an optimal cut-off value of 0.221.
Conclusion: The risk prediction model for falls in elderly lung cancer patients with sarcopenia, which is based on independent predictors, demonstrated good predictive performance. This model facilitates the timely identification of high-risk patients, providing scientific evidence to support the development of precise clinical management strategies.
1 Introduce
According to the 2020 report by the International Agency for Research on Cancer (IARC), lung cancer ranks second in global cancer incidence. It is the leading cause of cancer-related mortality worldwide, accounting for 11.4% of all diagnosed cancers and 18% of cancer deaths (1). Notably, age is a critical factor in the onset of lung cancer, with approximately 60% of patients being over 65 years old at the time of diagnosis (2). This trend is particularly alarming against the backdrop of the aging of the global population,55 to 79 years old is the high incidence rate of lung cancer age group, accounting for more than 70% of all cases (3).Sarcopenia, also known as muscle wasting syndrome, is a geriatric syndrome closely associated with aging. Its primary characteristics include the progressive loss of skeletal muscle mass, reduced muscle strength, and impaired muscle function (4). Of particular concern is the high prevalence of sarcopenia among lung cancer patients, who are often prone to nutritional and metabolic disorders (5). Studies indicate that the incidence of skeletal muscle loss in lung cancer patients ranges from 46.8% to 55.8% (6, 7). Falls are defined as sudden, involuntary, and unintentional postural changes that result in an individual landing on the ground or a lower plane (8). According to data from the World Health Organization (WHO) (9), approximately 684,000 individuals die each year due to falls, making falls the second leading cause of death from unintentional injuries worldwide, adults aged 60 years and older experience the highest number of fatal falls. Sarcopenia, which affects skeletal muscle mass and strength, weakens the physical condition and function of the elderly. This decline in function leads to a significant reduction in mobility and balance, which is a key factor contributing to falls. Moreover, among fall patients, cancer was the most prevalent underlying disease, with lung cancer accounting for 30.8% of cases (10, 11).Fall risk assessment tools are crucial for identifying and predicting patients at risk of falling. These tools currently encompass four main categories: the fall risk comprehensive assessment scale, the fall-related psychological assessment scale, the balance function scale, and the fall prevention questionnaire (12). The Morse Fall Risk Assessment Scale is commonly used in clinical settings to evaluate patients’ risk of falling and determine their fall risk levels (13). While these scales are widely used in general or elderly patients, they may not accurately assess the fall risk in elderly patients with specific disease backgrounds. In light of these findings, the present study aimed to identify potential risk factors for falls in elderly lung cancer patients with sarcopenia and develop a risk prediction model. The model is visualized via a nomogram to facilitate its application in clinical practice, providing an efficient and user-friendly assessment tool. This tool is intended to assist healthcare professionals in rapidly and accurately identifying high-risk patients, implementing targeted management strategies, reducing the occurrence of falls, and ultimately improving the quality of life of lung cancer patients.
2 Participants and methods
2.1 Study participants
This study adopted a cross-sectional design and strictly met the inclusion and exclusion criteria. Participants were selected from inpatients admitted to the oncology, thoracic surgery, and respiratory medicine departments of a tertiary hospital in Jiangxi Province between January 2023 and December 2023. The inclusion criteria were as follows: (1) aged ≥60 years (14); (2) diagnosed with primary lung cancer on the basis of histopathology or cytology; (3) positive results (score >10) on the Chinese version of the five-item Sarcopenia SARC-CALF scale (15); and (4) willing to complete physical measurements and questionnaire assessments. The exclusion criteria were as follows: ① severe cognitive impairment preventing effective communication; ② bedridden for extended periods; and ③ edema.
Through a systematic review of relevant literature and discussions within the research group, supplemented by two rounds of expert consultations conducted via letters, the researchers developed a questionnaire to assess fall risk factors in elderly lung cancer patients with sarcopenia. The questionnaire comprises 38 items. In accordance with the Kendall Sample Size criteria, the sample size should be 5 to 10 times the number of variables to ensure the accuracy and reliability of the study (16).A total of 38 study variables were identified on the basis of prior literature reviews and expert consultations. The required minimum sample size was calculated to be at least 190 participants. To account for potential nonresponse during data collection and to ensure sample representativeness and study accuracy, the sample size was increased by 20%, resulting in a minimum of 228 participants. According to the EPV (Events Per Variable) principle for logistic regression (17), at least 10 events per variable are required for robust results. Given that 4–6 predictors were estimated for the final model, a minimum of 40–60 participants with fall events was necessary for the analysis. Ultimately, 316 elderly lung cancer patients with sarcopenia were included in the study, 63 of whom experienced falls. The sample size met all the statistical requirements.
2.2 Survey tools
2.2.1 Fall risk factor questionnaire for elderly lung cancer patients with sarcopenia
The survey questionnaire primarily covers six key domains: sociodemographic characteristics, disease - related factors, physical health, medication use, functional and activity status, and laboratory indicators. The following section provides explanations for some of the assessment methods used:
1. The visual analogue scale (VAS) (18) was used to evaluate cancer pain. This scale quantifies patients’ pain perception via a 10 cm horizontal line. The left endpoint is marked as 0, representing “no pain,” and the right endpoint is marked as 10, representing “severe pain.” Patients pinpoint their perceived pain level on the line. Scores range from 0 to 10, with 0 indicating no pain, 1–3 indicating mild pain, 4–6 indicating moderate pain, and 7–10 indicating severe pain.
2. The Barthel Index (BI) (19), developed by Mahoney and Barthel in 1965 and translated into Chinese by Hou Dongzhe in 2012 (Cronbach’s α=0.916), was used to assess activities of daily living (ADL). It includes 10 core items covering eating, grooming, dressing, toileting, and mobility. The total scores range from 0 to 100, with lower scores indicating greater dependency. Dependency levels are categorized as severe (≤40), moderate (41–60), mild (61–99), and complete independence (100).
3. The Mini Nutritional Assessment Short Form (MNA-SF) (20), originally developed by Guigoz et al., evaluates the nutritional status of elderly individuals across six dimensions: food intake, weight change, mobility, psychological stress and acute illness, and body mass index (BMI). The scores for each dimension range from 0–3, with a total score ranging from 0–14. Nutritional status is categorized as normal (12–14), at risk of malnutrition (8–11), or malnourished (0–7).
4. Frailty status was assessed via the FRAIL scale (21), which was proposed in 2008 by an international group of experts on nutrition, health, and aging. This scale is designed to screen frailty in the clinical population of elderly individuals. It consists of five items: self-reported fatigue, reduced physical activity, unintentional weight loss of ≥5% within one year, diminished endurance or increased resistance, and the presence of five or more chronic diseases. Scores of 0–2 indicate no frailty or prefrailty, whereas scores of 3–5 indicate frailty. (Cronbach’s α=0.705).
5. Gait speed was assessed via the 6-meter walk test recommended by the Asian Working Group for Sarcopenia (AWGS) (22). A 12-meter straight line was marked on a flat surface, with clear indicators at the starting point, 3 m, 9 m, and the endpoint. The participants walked along the line; timing began at 3 m and ended at 9 m. The test was repeated three times, with the fastest time recorded. A gait speed <1.0 m/s was considered reduced, whereas a speed ≥1.0 m/s was considered normal.
6. Grip strength was measured via an EH101 digital dynamometer from Xiangshan Weighing Equipment Group, with measurements in kilograms (kg). For safety and accuracy, particularly for patients with peripherally inserted central catheters (PICCs), only the dominant hand was tested without exerting pressure on the catheter. The participants squeezed the dynamometer with maximum strength for 3 seconds, with two trials separated by a 30-second rest. The highest value was recorded. According to the AWGS standards, a grip strength <28 kg in men and <18 kg in women indicates reduced strength (22).
7. Stride length, defined as the vertical distance between consecutive heel contacts of the same foot, was measured in centimeters. The participants were instructed to walk naturally, and measurements were recorded.
2.2.2 Modified sarcopenia screening questionnaire
The SARC-CalF is a sarcopenia screening tool recommended by the Asian Working Group for Sarcopenia. Developed by Barbosa-Silva in 2016 (23) as an extension of the SARC-F scale, it incorporates calf circumference (CC) as a critical objective measure. The CC cut-off is set at 34 cm for men and 33 cm for women. In the SARC-CalF scale, CCs ≤34 cm for men or ≤33 cm for women score 10 points, whereas larger circumferences score 0 points. A total score ≥11 indicates sarcopenia screening positivity. A Chinese version of the SARC-CalF was applied to cancer patients by Fu et al. (24) The area under the receiver operating characteristic (ROC) curve was 0.75, indicating high screening efficiency. In this study, trained researchers used nonelastic measuring tapes to measure the circumference at the widest point of the nondominant calf.
2.3 Data collection methods
After approval was obtained from the data collection institution, elderly lung cancer patients with sarcopenia hospitalized in the oncology, thoracic surgery, and respiratory medicine departments of a tertiary hospital in Jiangxi Province were conveniently sampled according to the inclusion and exclusion criteria. Two nursing graduate students were selected as investigators and received standardized training to ensure measurement consistency. A total of 327 questionnaires were distributed and returned, yielding a 100% response rate. After excluding 11 invalid questionnaires due to incomplete answers or evident uniformity in responses, 316 valid questionnaires were obtained, with an effective response rate of 96.64%.
2.4 Statistical methods
The collected data were sequentially numbered and preliminarily organized via Excel 2003. After dual-person verification, the data were entered into an SPSS database. Statistical description and univariate and multivariate analyses were conducted via SPSS 27.0. A fall risk prediction model was constructed and validated via R language version 4.3.2. Statistical tests were performed via two-sided tests, with a significance level of α=0.05. A P value <0.05 was considered to indicate statistical significance.
3 Results
3.1 General characteristics of the participants and fall incidence
The study ultimately included 316 elderly lung cancer patients with sarcopenia who met the inclusion and exclusion criteria. Among them, 63 patients experienced falls, resulting in a fall rate of 19.94%. The training set included 221 patients, with 47 experiencing falls (fall rate: 21.27%), whereas the validation set included 95 patients, with 16 experiencing falls (fall rate: 16.84%) See Table 1.
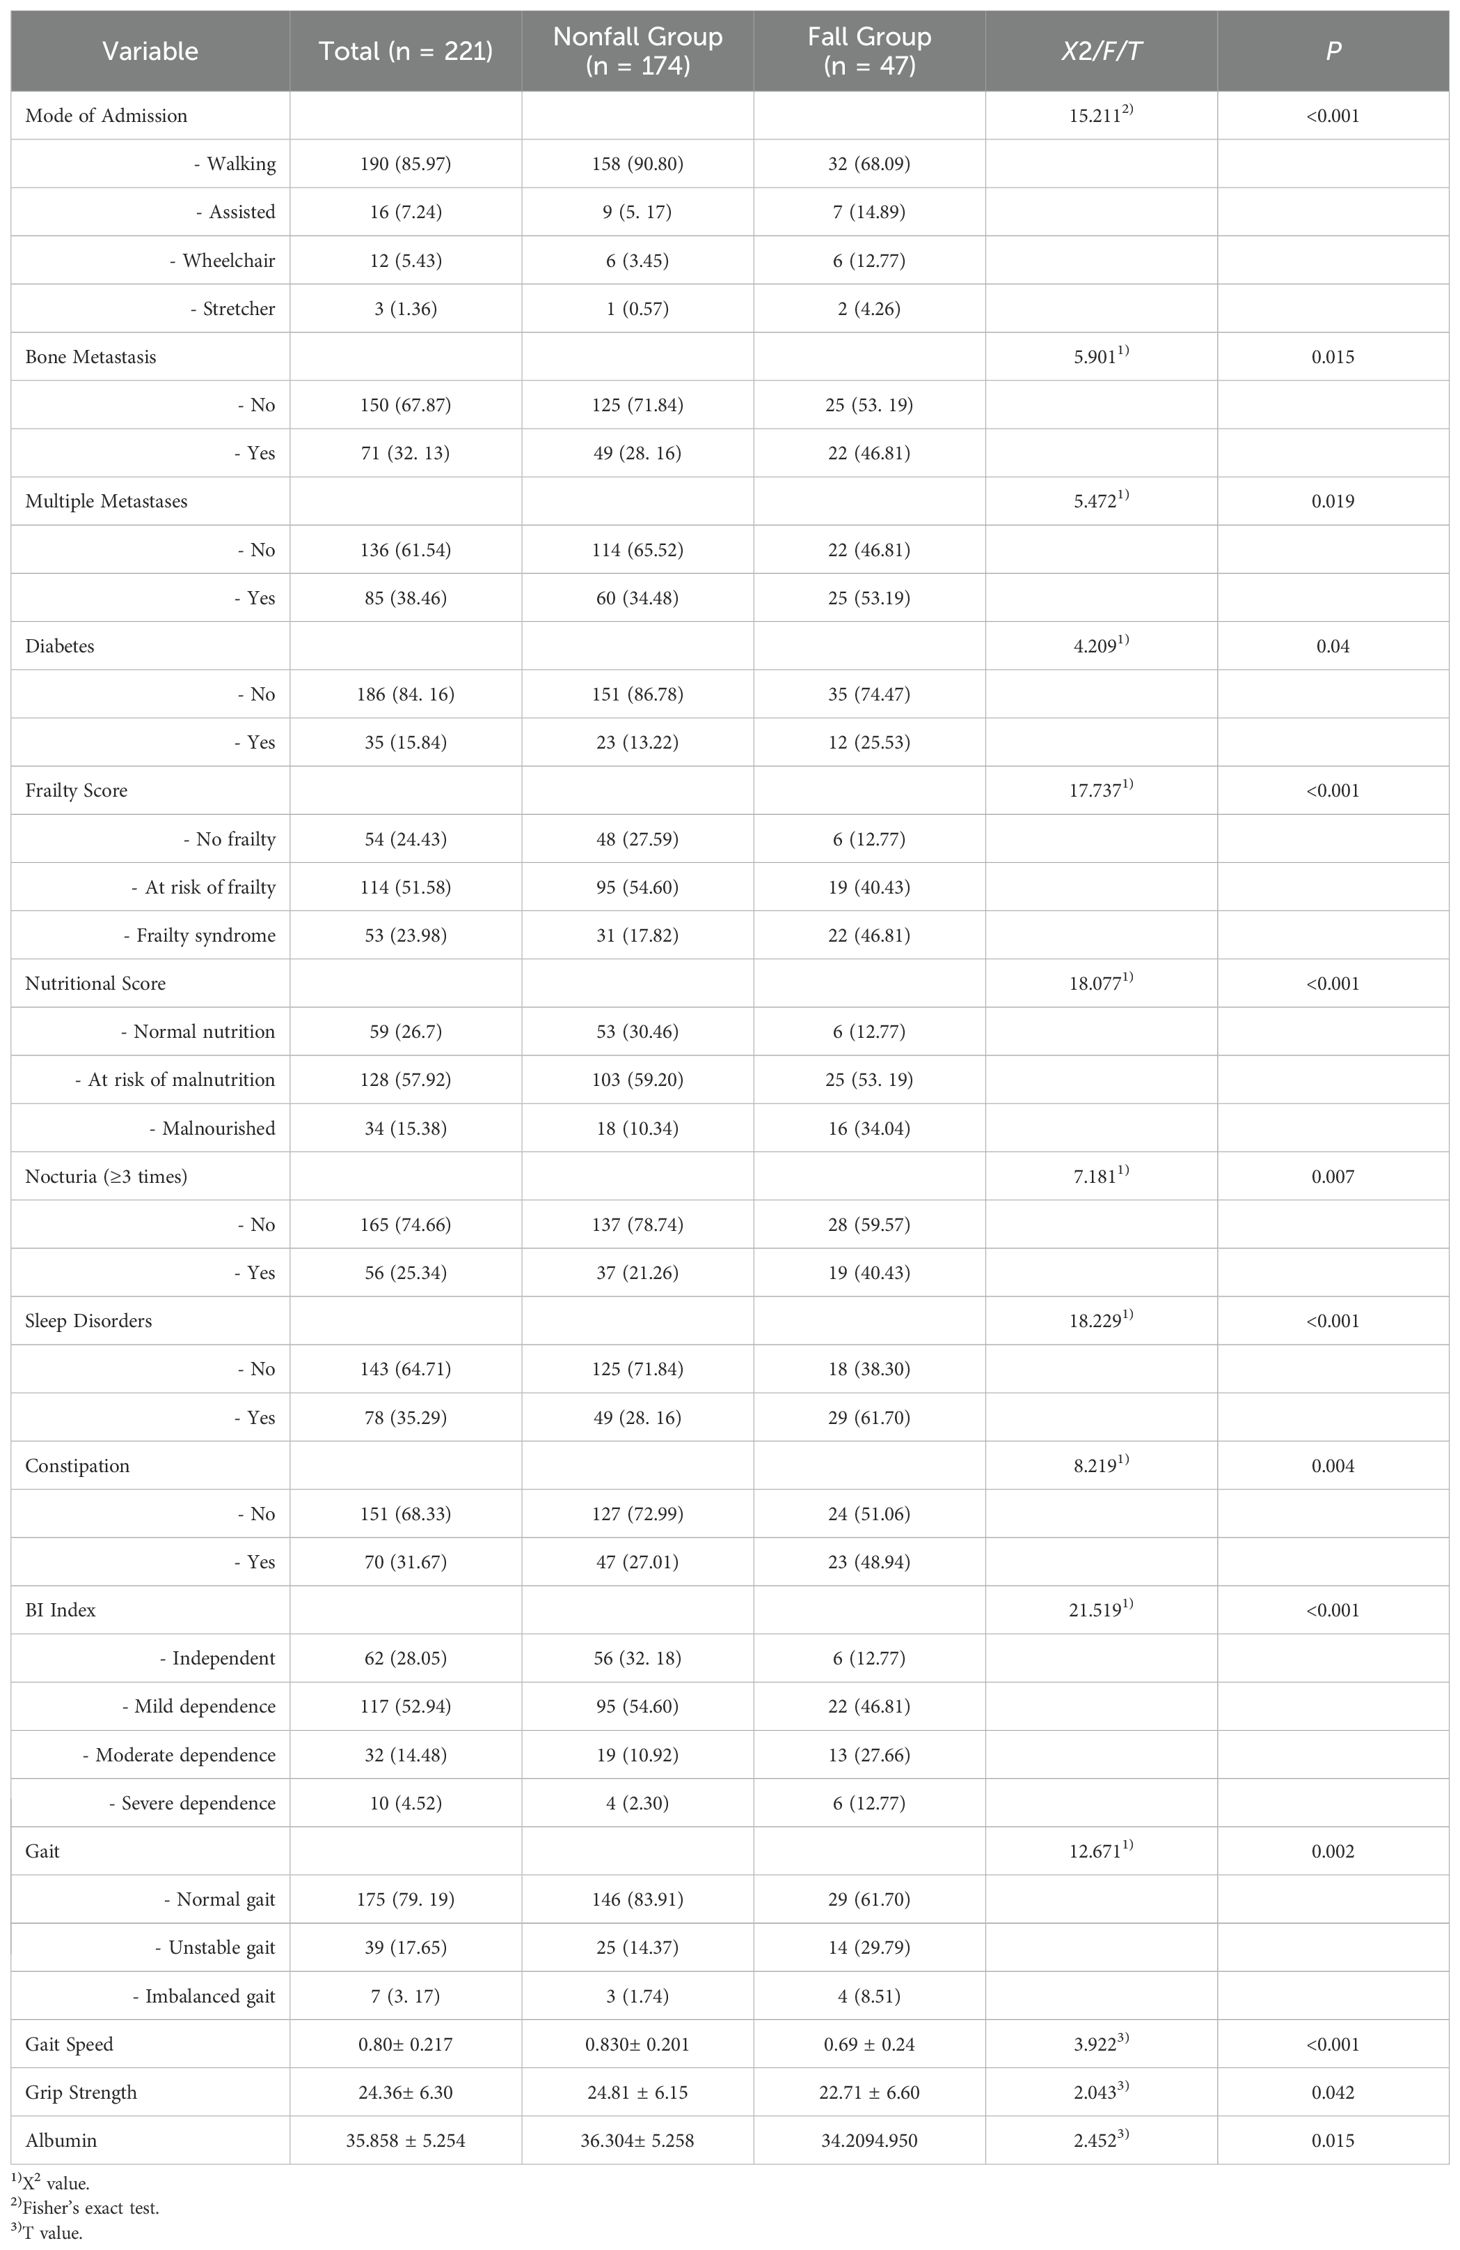
Table 1. Univariate analysis of fall risk factors in the training set (n = 221).
3.2 Univariate analysis results
Univariate analysis of the training set revealed statistically significant differences between the fall group and nonfall group in 14 variables: admission type, bone metastasis, multiple metastases, diabetes, nocturia frequency ≥3 times, sleep disorders, constipation, activities of daily living (ADL) score, frailty score, nutritional score, grip strength, gait, gait speed, and albumin levels.
3.3 Multicollinearity analysis of fall-related factors in the training set
Examination of the variables revealed no significant multicollinearity issues, allowing further multivariate logistic regression analysis. The coding methods are shown in Table 2. Multivariate logistic regression analysis revealed that multiple metastases (OR=2.628, 95% CI: 1.174–5.883), nocturia frequency ≥3 times (OR=2.651, 95% CI: 1.180–5.955), sleep disorders (OR=3.328, 95% CI: 1.474–7.513), frailty (OR=6.372, 95% CI: 1.788–22.708), and malnutrition (OR=5.244, 95% CI: 1.531–17.961) were independent risk factors for falls in elderly lung cancer patients with sarcopenia (P<0.05). See Table 3.
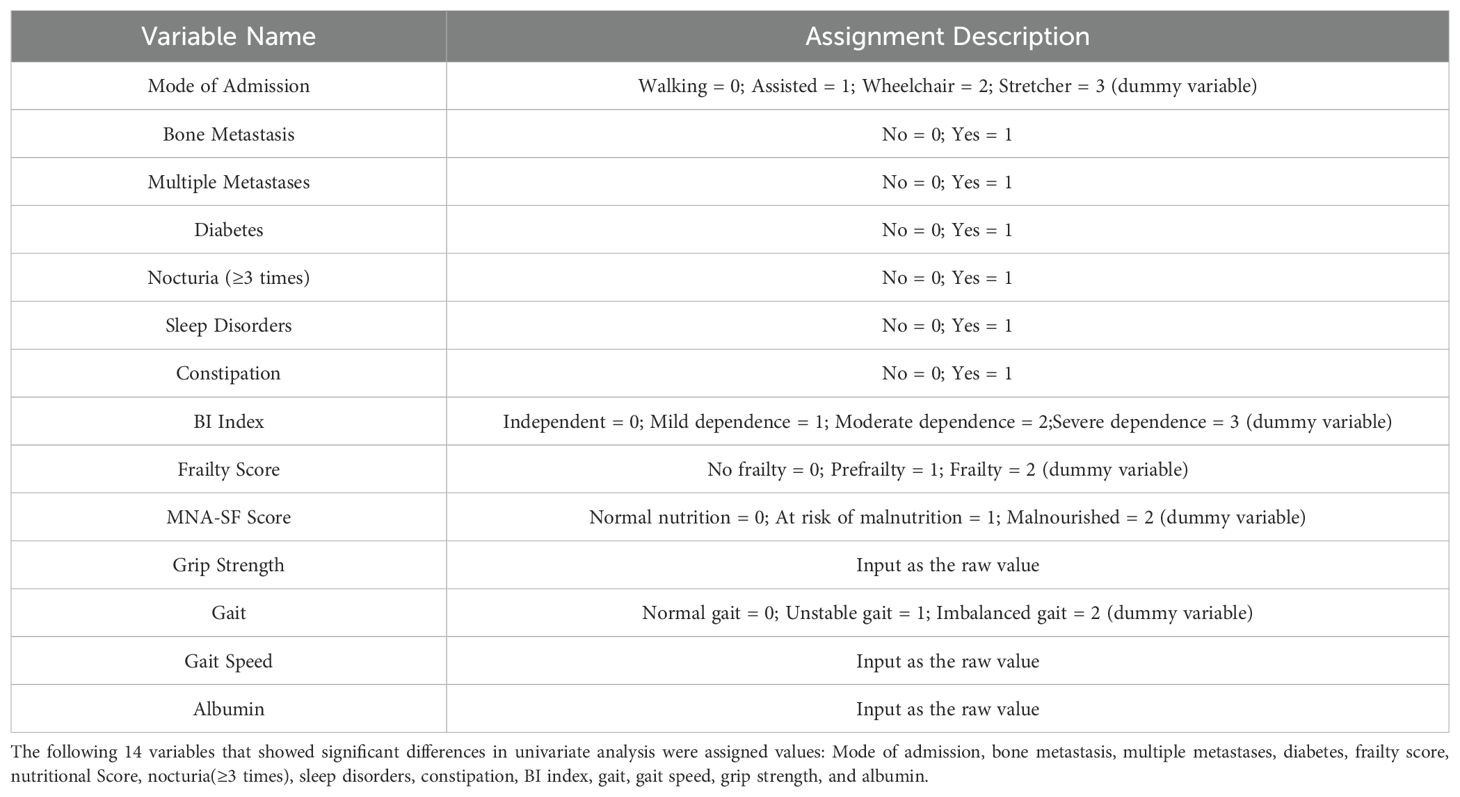
Table 2. Variable assignment.
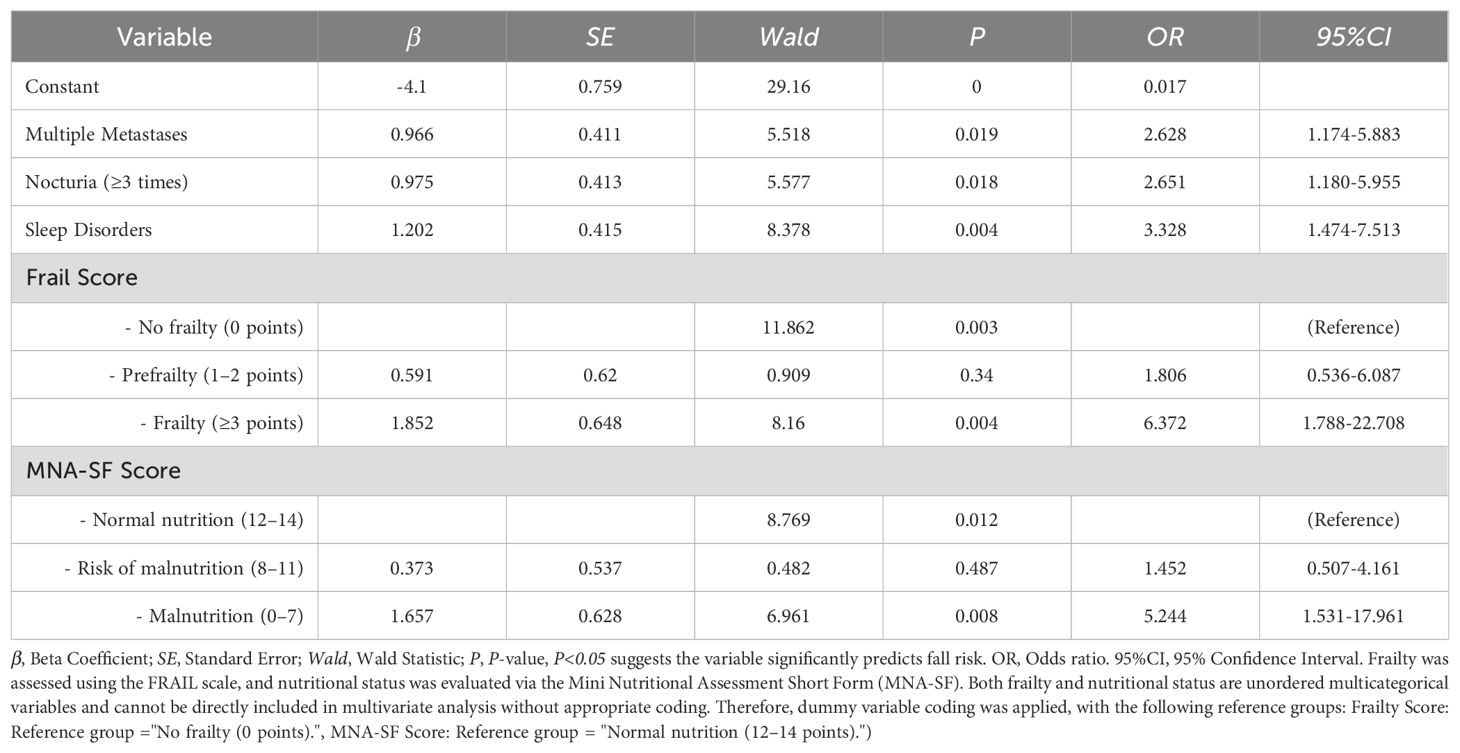
Table 3. Multivariate analysis results in the training set.
3.4 Construction of the fall risk prediction model for elderly lung cancer patients with sarcopenia
On the basis of the multivariate logistic regression results, five risk factors—multiple metastases, nocturia frequency ≥3 times, sleep disorders, frailty score, and malnutrition score—were included in the fall risk prediction model. The model was visualized via a nomogram generated in R software, as shown in Figure 1.
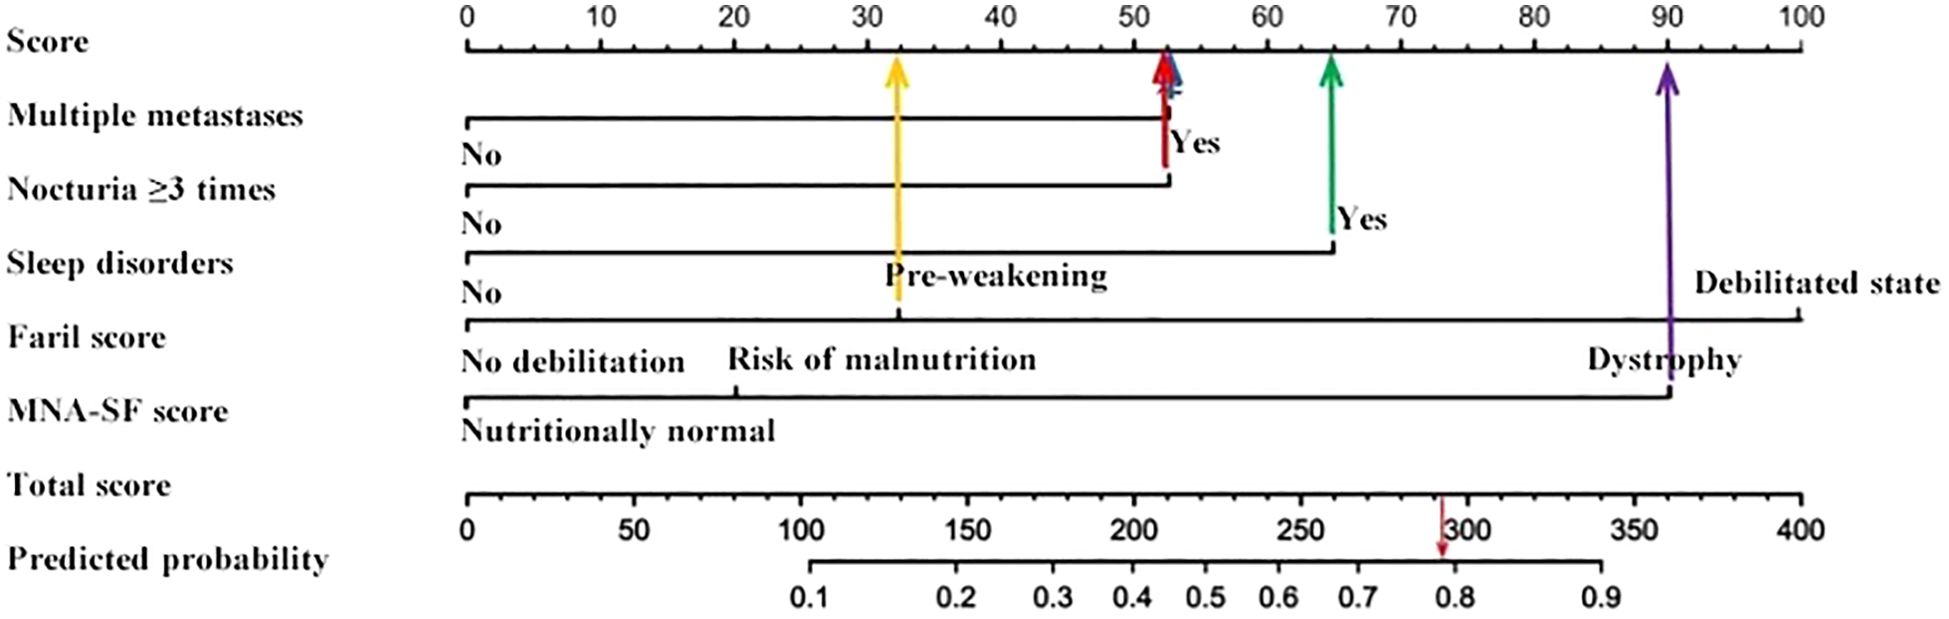
Figure 1. Column line diagram.
3.5 Validation and evaluation of the fall risk prediction model
Sensitivity measures the model’s ability to accurately identify patients who actually experienced falls, reflecting the proportion of true positive cases correctly classified. Specificity represents the model’s capacity to distinguish patients without falls, indicating the proportion of true negative cases correctly identified. The Youden Index, an indicator evaluating the model’s overall ability to differentiate true patients from non-patients, is calculated as: Youden Index = (Sensitivity + Specificity) − 1. The optimal cutoff value is the threshold that maximizes the Youden Index, meaning it selects the point with the highest sum of sensitivity and specificity among all possible classification thresholds. In the training set, the Hosmer–Lemeshow test indicated good model fit (χ²=5.353, P=0.719), with a predictive accuracy of 83.7%. The area under the ROC Curve (AUC) was 0.832, and the maximum Youden index was 0.577, corresponding to a sensitivity of 74.7%, specificity of 83.0%, and an optimal cutoff value of 0.221. In the validation set, the model also demonstrated a good fit (χ²=5.678, P=0.128), with a predictive accuracy of 82.1%. The AUC was 0.793, with a maximum Youden index of 0.495, a sensitivity of 62.0%, a specificity of 87.5%, and an optimal cutoff value of 0.130. See Figure 2. The calibration curves further verified the model’s predictive accuracy and reliability. See Figure 3. Decision Curve Analysis (DCA) was drawn using R software to assess the clinical utility of the fall risk prediction model in elderly lung cancer patients with sarcopenia. In this study, the actual DCA decision curve was higher than the two extreme lines in most of the threshold probability range, indicating that our predictive model has some practical value in clinical decision making. See Figure 4.
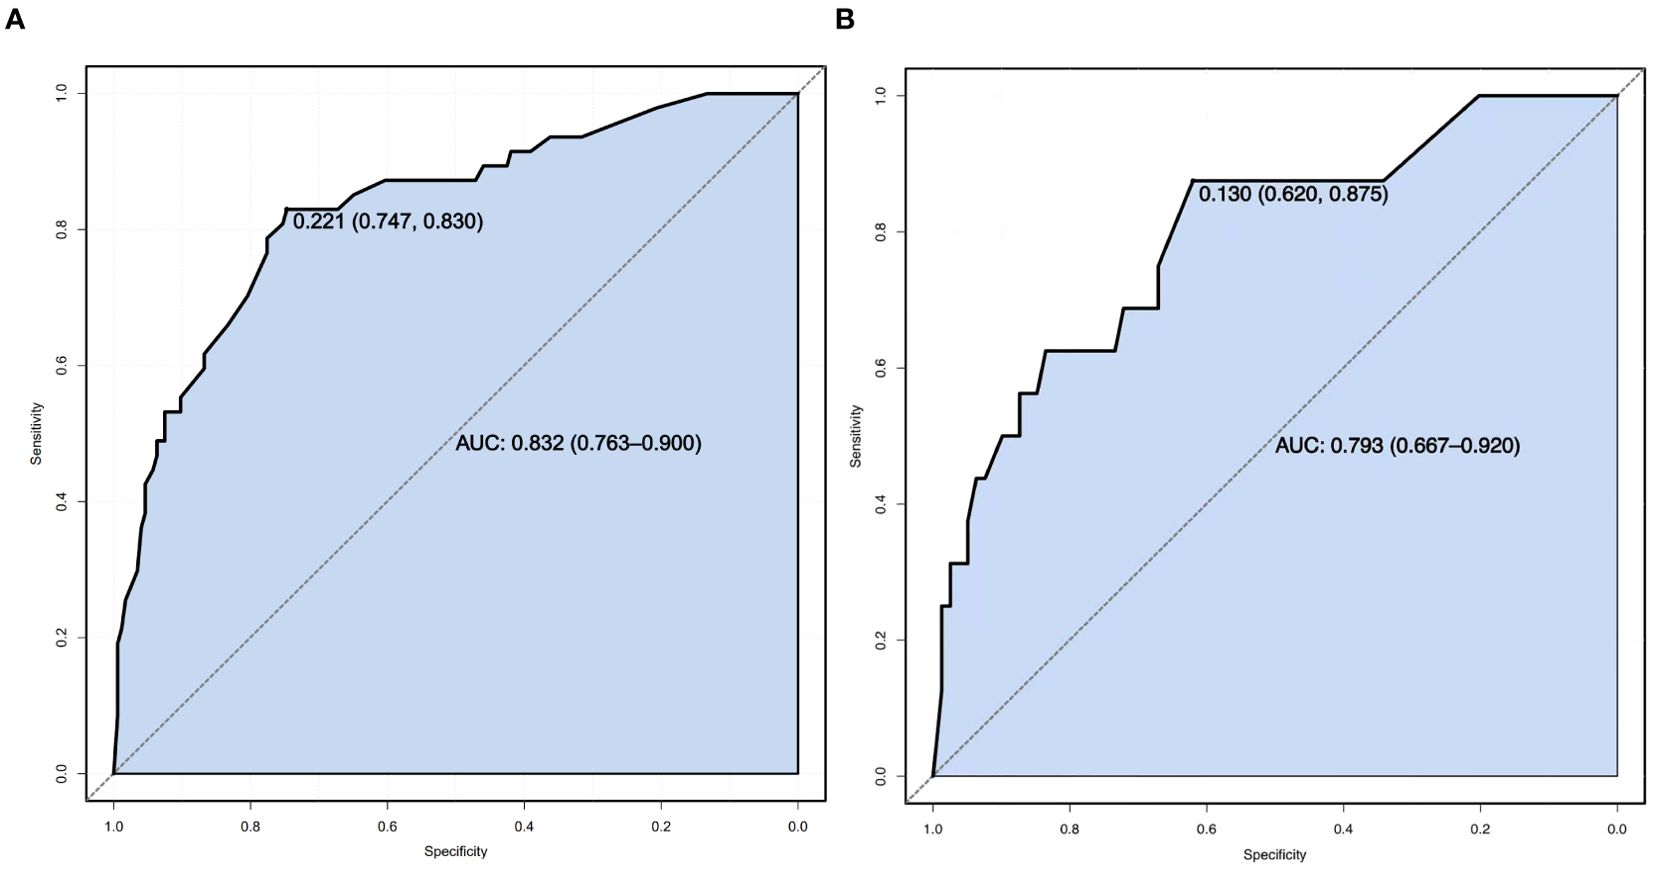
Figure 2. (A) Training set ROC Curve. (B) ROC Curve of the validation set.ROC Curve (Receiver Operating Characteristic Curve): A graphical tool used to evaluate the performance of a binary classification model. It plots the relationship between the True Positive Rate (TPR) and the False Positive Rate (FPR) across varying classification thresholds, reflecting the model’s ability to distinguish between positive and negative samples. The closer the curve is to the top-left corner, the better the model’s performance. The x-axis represents the False Positive Rate (FPR, calculated as 1−Specificity), and the y-axis represents the True Positive Rate (TPR, equivalent to Sensitivity).
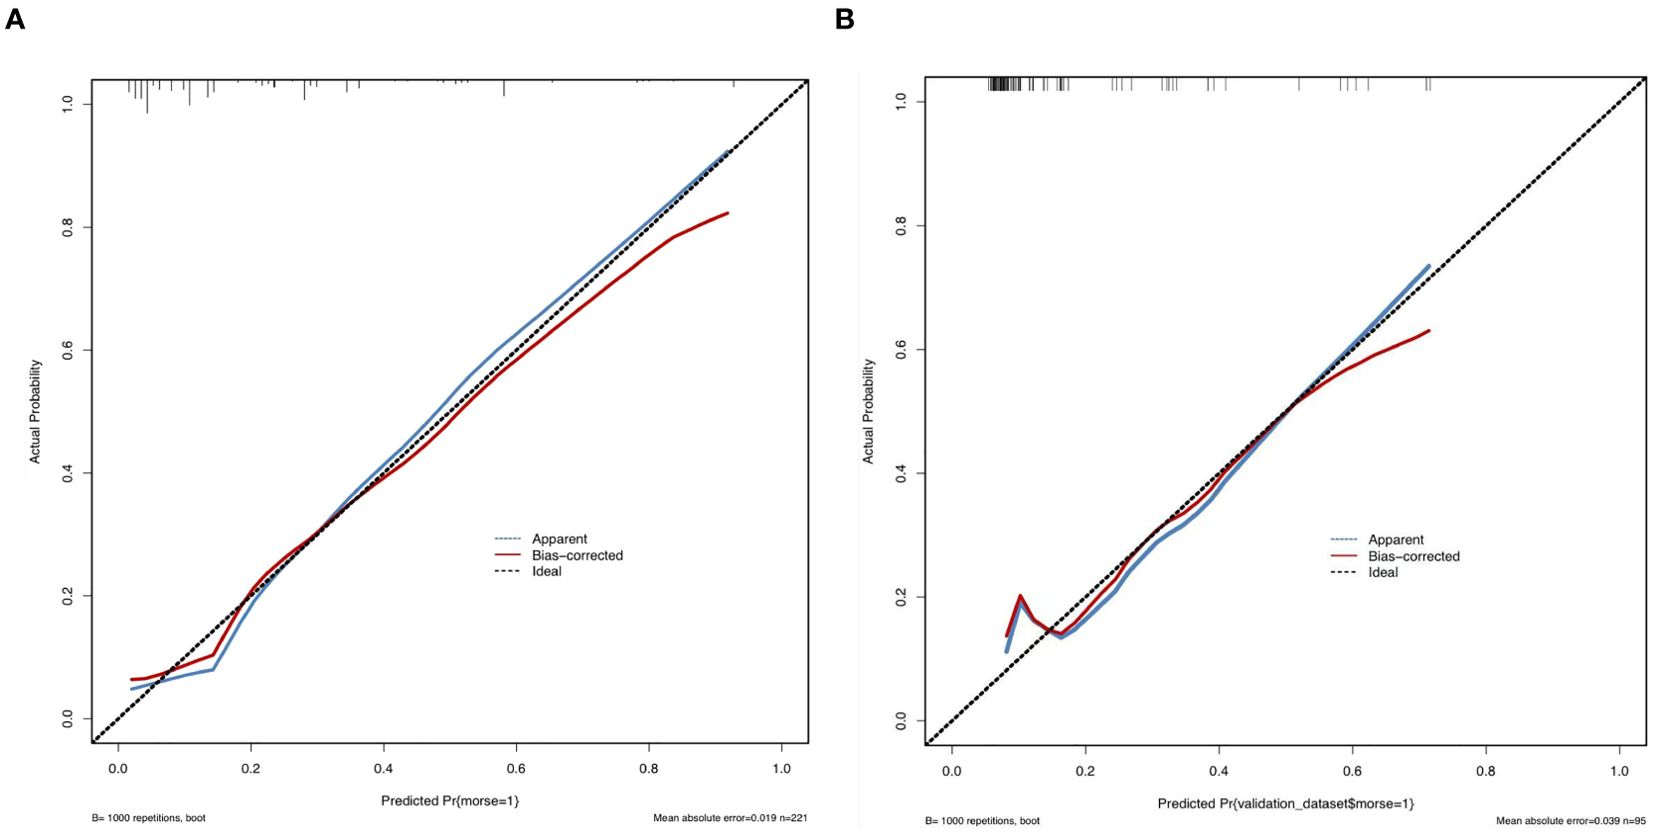
Figure 3. (A) Calibration of the training set. (B) Calibration of the validation set. Calibration refers to the consistency between the predicted probabilities of a model and the actual observed frequencies of outcomes. It reflects the reliability of the model’s predicted probabilities. As illustrated in the figure, the calibration curve closely follows the ideal diagonal reference line, indicating strong agreement between the predicted probabilities and the observed frequencies. This further validates the model’s predictive accuracy and reliability. The x-axis represents the model’s predicted probabilities (ranging from 0% to 100%), while the y-axis represents the actual observed event frequencies.
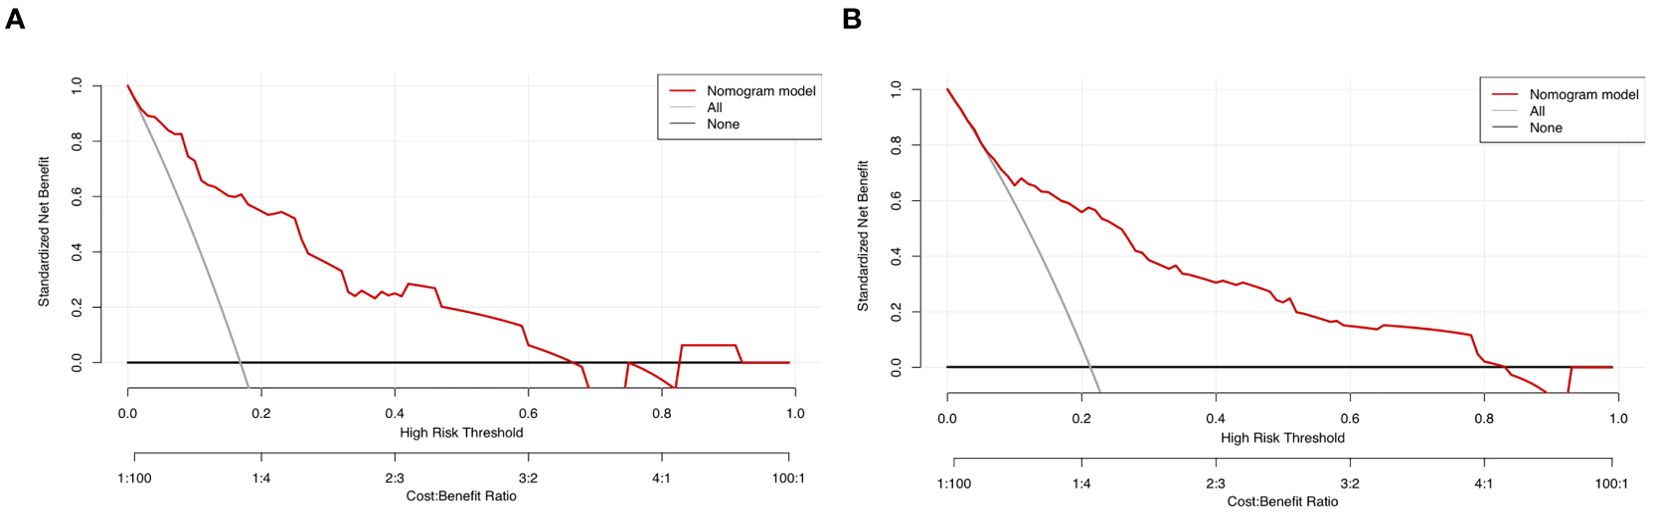
Figure 4. (A) Training set decision curve. (B) Validation set Decision Curve. Decision Curve Analysis (DCA): A graphical evaluation tool used to quantify the clinical utility of predictive models. It visually demonstrates the clinical net benefit across varying threshold probabilities, aiding decision-makers in selecting optimal intervention strategies. In the figure: The black horizontal line represents an extreme scenario (“Treat None” strategy), where the clinical net benefit is zero. The gray diagonal line represents another extreme scenario (“Treat All” strategy), where the clinical net benefit decreases gradually as the threshold probability increases, exhibiting a negative slope. The red curve depicts the actual DCA decision curve. The red curve lies above both extreme lines across most threshold probability ranges, indicating that our predictive model offers meaningful clinical utility for decision-making.
4 Discussion
4.1 Analysis of fall risk factors in elderly lung cancer patients with sarcopenia
4.1.1 Multiple metastases
Multiple metastases refer to the simultaneous formation of new tumors in multiple body sites by cancer cells. Compared with single-site metastasis, multiple metastases have more profound and widespread impacts on patients. Brain metastases may impair the nervous system, particularly the areas responsible for balance control, causing instability during walking or standing and increasing the risk of falls (25) below. Bone metastases often result in severe pain due to periosteal traction, soft tissue invasion, and nerve compression, which adversely affect sleep quality, daily living activities, and mobility, thus reducing walking ability (26, 27). Liver metastases may compromise metabolic and detoxification functions, leading to fatigue and reduced physical strength, making it difficult for patients to maintain balance during daily activities (28).
4.1.2 Increased nocturia
This study revealed a strong correlation between nocturia and fall risk in elderly lung cancer patients with sarcopenia. Patients who experienced nocturia three or more times per night were six times more likely to fall than those with a normal frequency of nocturia. Several studies have also confirmed the significant association between nocturnal polyuria and falls (29–31).
4.1.3 Sleep disorders
Symptoms of lung cancer, such as coughing, dyspnea, and chest pain, disrupt normal sleep patterns, causing frequent nighttime awakenings. Chronic sleep disturbances weaken patients’ physical strength and balance, increasing their susceptibility to falls during daily activities (32). Moreover, the psychological stress from a lung cancer diagnosis and treatment often induces anxiety and depression, further impairing sleep quality and contributing to daytime fatigue and helplessness, which heighten the risk of falls (33). Additionally, sleep disorders may negatively affect cognitive functions, including attention, memory, and judgment, making it difficult for patients to perceive environmental changes and respond appropriately while walking, thereby increasing the likelihood of falls (34, 35). Interventions to improve sleep quality, such as enhancing the sleep environment, providing psychological support, optimizing medication regimens, and strengthening health education, should be implemented to reduce fall risk.
4.1.4 Frailty
This study identified frailty as a significant factor associated with falls in elderly individuals, which is consistent with findings from domestic and international studies (36–38). Sarcopenia, characterized by a progressive reduction in muscle fiber quantity and volume, leads to notable decreases in muscle strength, endurance, and coordination. These deficits severely impair walking and standing abilities, disrupt physical balance, and increase the risk of falls during daily activities (39). Healthcare providers must recognize the comprehensive threat frailty poses to patients’ overall health and quality of life. Comprehensive assessments of muscle strength, balance, and gait are crucial. Additionally, optimizing medication regimens, minimizing the use of fall-inducing drugs, and educating patients and their families about potential medication side effects are essential for preventing falls.
4.1.5 Malnutrition
Malnutrition is a major risk factor for adverse clinical outcomes in cancer patients. It is one of the most common complications and persists throughout the disease course (40). Studies suggest that lung cancer patients often experience worse nutritional status than those with other cancers do (41). Li et al. reported a malnutrition incidence of 45.9% in lung cancer patients, with the incidence being three times greater in patients with sarcopenia (42). Furthermore, treatments for lung cancer, such as chemotherapy and radiotherapy, significantly impact the digestive system, causing symptoms such as anorexia, nausea, vomiting, and malabsorption, which exacerbate malnutrition (43). Combined with the metabolic abnormalities in glucose, fat, and protein often observed in lung cancer patients, these factors further weaken physical strength and balance (44).
4.2 Clinical application value of the fall risk prediction model for elderly patients with lung cancer and sarcopenia
This study focused on the prediction of falls, a common adverse clinical event, among lung cancer patients with sarcopenia. Using univariate and multivariate logistic regression analyses, the study systematically examined factors influencing fall risk. Five independent predictors were identified: multiple metastases, nocturia frequency ≥3 times, sleep disorders, frailty score, and malnutrition score. On the basis of these factors, a clinical prediction model was constructed and visualized via a nomogram. To ensure accuracy and reliability, the model was internally evaluated and validated. The results revealed that the areas under the ROC curve (AUCs) for the training and validation sets were 0.832 and 0.793, respectively, and the Hosmer–Lemeshow (HL) test results were 0.719 and 0.128, indicating excellent discriminative ability, calibration, and clinical utility. These findings suggest that the model offers robust predictive performance, providing scientific support for clinical predictions and improving fall risk management for patients. This study employed logistic regression to develop a risk prediction model, a method widely used in medical research due to its high computational efficiency and strong interpretability. However, its applicability may be limited when handling complex nonlinear features and high-dimensional interactions. Machine learning offers unique advantages in processing large-scale, high-dimensional medical data and has demonstrated significant potential in constructing disease risk prediction models (45). Future research could integrate AI/machine learning algorithms (e.g., random forests, neural networks) to further enhance predictive accuracy. Nevertheless, machine learning algorithms typically require larger sample sizes and computational resources, which exceed the scope of this single-center study with a small sample size. Additionally, this model did not incorporate biological indicators or image-based information.
5 Conclusion
The fall risk prediction model developed in this study, which is based on independent predictors, demonstrated strong predictive performance and is beneficial for healthcare providers in identifying high-risk patients. This study provides a scientific basis for formulating precise clinical management strategies. However, as a single-center study, the sample was drawn from a single hospital, limiting its representativeness and potentially affecting the generalizability of the findings. Future research should expand the sample size to increase model robustness and conduct external validations to ensure broader applicability and reliability.
Data availability statement
The original contributions presented in the study are included in the article/supplementary material. Further inquiries can be directed to the corresponding author.
Ethics statement
The studies involving humans were approved by The Medical Ethics Committee of the Second Affiliated Hospital of Nanchang University. The studies were conducted in accordance with the local legislation and institutional requirements. Written informed consent for participation was not required from the participants or the participants’ legal guardians/next of kin in accordance with the national legislation and institutional requirements.
Author contributions
QW: Investigation, Writing – original draft, Writing – review & editing. XH: Visualization, Writing – original draft, Writing – review & editing. JZ: Investigation, Methodology, Writing – review & editing. MH: Investigation, Methodology, Writing – review & editing. JX: Investigation, Methodology, Writing – review & editing. QA: Data curation, Investigation, Writing – review & editing. HW: Investigation, Supervision, Writing – review & editing. JY: Resources, Supervision, Writing – review & editing. HM: Supervision, Writing – original draft, Writing – review & editing.
Funding
The author(s) declare that financial support was received for the research and/or publication of this article. The study was jointly supported by the Jiangxi Provincial Education Department (GJJ2200) and the Second Affiliated Hospital of Nanchang University in Jiangxi Province(2023efyN13).
Conflict of interest
The authors declare that the research was conducted in the absence of any commercial or financial relationships that could be construed as a potential conflict of interest.
Generative AI statement
The author(s) declare that no Generative AI was used in the creation of this manuscript.
Publisher’s note
All claims expressed in this article are solely those of the authors and do not necessarily represent those of their affiliated organizations, or those of the publisher, the editors and the reviewers. Any product that may be evaluated in this article, or claim that may be made by its manufacturer, is not guaranteed or endorsed by the publisher.
References
1. Sung H, Ferlay J, Siegel R L, Laversanne M, Soerjomataram I, Jemal A, et al. Global cancer statistics 2020: GLOBOCAN estimates of incidence and mortality worldwide for 36 cancers in 185 countries. CA Cancer J Clin. (2021) 71:209–49. doi: 10.3322/caac.21660
2. Cao W, Chen H D, Yu Y W, Li N, and Chen W Q. Changing profiles of cancer burden worldwide and in China: A secondary analysis of the global cancer statistics 2020. Chin Med J (Engl). (2021) 134:783–91. doi: 10.1097/CM9.0000000000001474
3. Liang X, Liu M, Zhang L, Gao T, Yang J, and Qiu T. Global trends of incidence of lung cancer. Bull Chin Cancer. (2022) 31:683–92. doi: 10.11735/j.issn.1004-0242.2022.09.A002
4. Juan L, Qingqing D, Baiyu Z, Yang L, Jingmin L, Yongming L, et al. Chinese consensus on diagnosis and treatment of sarcopenia in the elderly (2021). Chin J Geriatr. (2021) 40:943–52. doi: 10.3760/cma.j.issn.0254-9026.2021.08.001
5. Jain R, Coss C, Whooley P, Phelps M, and Owen D H. The role of malnutrition and muscle wasting in advanced lung cancer. Curr Oncol Rep. (2020) 22:54. doi: 10.1007/s11912-020-00916-9
6. Nakamura R, Inage Y, Tobita R, Yoneyama S, Numata T, Ota K, et al. Sarcopenia in resected NSCLC: effect on postoperative outcomes. J Thorac Oncol. (2018) 13:895–903. doi: 10.1016/j.jtho.2018.04.035
7. Baracos V E, Reiman T, Mourtzakis M, Gioulbasanis I, and Antoun S. Body composition in patients with non-small cell lung cancer: A contemporary view of cancer cachexia with the use of computed tomography image analysis. Am J Clin Nutr. (2010) 91:1133S–7S. doi: 10.3945/ajcn.2010.28608C
8. Huaguo Z, Mi S, Yue X, and Hongying P. Research progress of fall-related psychological concerns among older adults. Chin J Nurs. (2021) 56:458–63. doi: 10.3761/j.issn.0254-1769.2020.03.025
9. World Health Organization. Falls. Available online at: https://www.who.int/news-room/fact-sheets/detail/falls/2021-4-26/2025-2-15. (Accessed February 15, 2025).
10. Yanyan W, Yanmian L, Xiaoping L, Xiaojing L, Jingjing K, Qiulu X, et al. Causes of falls of senile inpatients and its countermeasures: A 113-case study. J Nursing(China). (2017) 24:68–71. doi: 10.16460/j.issn1008-9969.2017.17.068
11. Cuie G, Yuanping P, Ling T, Benmin D, and Guobi W. Analysis of fall causes of hospitalized tumor patients and countermeasures. Lab Med Clin. (2016) 13:138–40. doi: 10.3969/j.issn.1672-9455.2016.01.063
12. Yuexue Y, Yuling J, and Xiuhong W. Research progress of fall risk prediction models for the elderly. Chin Nurs Res. (2022) 36:2944–8. doi: 10.12102/j.issn.1009-6493
13. Zhou J, Li Y, and Fan J. Research on the reliability and validity of Chinese version Morse fall assessment scale in elderly in patients. Chin J Rehabil Med. (2012) 27:244–247,284. doi: 10.3969/j.issn.1001-1242.2012.03.012
14. World Health Organization. World health statistics (2015). Available online at: https://www.who.int/news-room/fact-sheets/detail/falls/2015-5-8. (Accessed May 8, 2015).
15. Zhou J, Li Y, and Fan J. Reliability and validity of the Chinese version of the Morse Fall Scale among hospitalized elderly patients. Chin J Rehabil Med. (2012) 27:244–247 + 284. doi: 10.3969/j.issn.1001-1242.2012.03.012
17. Yongcxiang G and Jinxin Z. Determining sample size in logistic regression analysis. Chin J Evid-Based Med. (2018) 18:122–4. doi: 10.12019/j.issn.1671-5144.2018.02.015
18. Wewers ME and Lowe NK. A critical review of visual analogue scales in the measurement of clinical phenomena. Res Nurs Health. (1990) 13:227–36. doi: 10.1002/nur.4770130405
19. Mahoney FI and Barthel D. Functional evaluation: the barthel index. Md State Med J. (1965) 14:56–61. doi: 10.1007/springerreference_184464
20. Guigoz Y, Lauque S, and Vellas BJ. Identifying the elderly at risk for malnutrition: The Mini Nutritional Assessment. Clin Geriatr Med. (2002) 18:737–57. doi: 10.1016/S0749-0690(02)00059-9
21. Zhang Q. Development of a continuity care model for patients referred from tertiary hospitals in Shandong province. Shandong University (2019).
22. Chen L K, Woo J, Assantachai P, Auyeung T W, Chou M Y, Iijima K, et al. Asian working group for sarcopenia: 2019 consensus update on sarcopenia diagnosis and treatment. J Am Med Dir Assoc. (2020) 21:300–7. doi: 10.1016/j.jamda.2019.12.012
23. Barbosa-Silva T G, Menezes A M, Bielemann R M, Malmstrom T K, and Gonzalez M C. Enhancing SARC-F: improving sarcopenia screening in clinical practice. J Am Med Dir Assoc. (2016) 17:1136–41. doi: 10.1016/j.jamda.2016.08.004
24. Fu X, Tian Z, Thapa S, Sun H, Wen S, Xiong H, et al. Comparing SARC-F with SARC-CalF for screening sarcopenia in advanced cancer patients. Clin Nutr. (2020) 39:3337–45. doi: 10.1016/j.clnu.2020.02.020
25. Yuankai S, Yan S, Jinming Y, Cuimin D, Zhiyong M, Ping P, et al. Expert consensus on the diagnosis and treatment of brain metastases from lung cancer in China (2017 edition). Chin J Lung Cancer. (2017) 20:1–12. doi: 10.3779/j.issn.1009-3419.2017.01.01
26. Beijing Medical Award Foundation Lung Cancer Young Expert Committee. Expert consensus on the diagnosis and treatment of bone metastases from lung cancer (2019 edition). Chin J Lung Cancer. (2019) 22:187–207.
27. Han W, Hui C, and Yuanchnag X. Advances in pain management for bone metastases from cancer. Chin J Pain Med. (2019) 25:859–62. doi: 10.3969/j.issn.1006-9852.2019.11.011
28. Xu T and Liu B. Advances in comprehensive treatment of liver metastases from advanced lung cancer. Modern Oncol. (2019) 27:2200–3. doi: 10.3969/j.issn.1672-4992.2019.12.042
29. Zhou H. Development of a fall risk prediction model for cancer inpatients. Zhejiang Chinese Medical University (2022).
30. Decalf V, Bower W, Rose G, Petrovic M, Pieters R, Eeckloo K, et al. Prevalence and characteristics of incident falls related to nocturnal toileting in hospitalized patients. Acta Clin Belg. (2021) 76:85–90. doi: 10.1080/17843286.2019.1660022
31. Kim S Y, Bang W, Kim M S, Park B, Kim J H, and Choi H G. Nocturia is associated with slipping and falling. PloS One. (2017) 12:e0169690. doi: 10.1371/journal.pone.0169690
32. Li X, Hong Y, and Yan Q. Research progress on sleep disorders in postoperative lung cancer patients. Gen Nurs. (2020) 18:2074–7. doi: 10.12104/ji.ssn.1674-4748.2020.17.006
33. Yunjia X, Biyun S, Yongtao Z, Ting C, Peace C I, Mengjiao N, et al. Risk factors and prediction model for long-term bedridden states due to falls in the very elderly based on competing risk models. Chin Gen Pract. (2024) 1-7:2192–7. doi: 10.12114/j.issn.1007-9572.2023.0757
34. Cauley J A, Hovey K M, Stone K L, Andrews C A, Barbour K E, Hale L, et al. Characteristics of self-reported sleep and the risk of falls and fractures: the women’s health initiative (WHI). J Bone Miner Res. (2019) 34:464–74. doi: 10.1002/jbmr.3619
35. Xueqi G, Fan G Y, Jiao Y, Huiju H, Huiyuan L, Jianhui W, et al. Risk factors for fall in elderly residents with sleep disorders in nursing homes. J Nurs. (2022) 29:11–4. doi: 10.16460/j.issn1008-9969.2022.22.011
36. Zhou X, Ning W, and Li X. Development of a fall prediction model for elderly maintenance hemodialysis patients. Nurs Res. (2023) 37:2114–21. doi: 10.12102/j.issn.1009-6493.2023.12.007
37. Zhang Q, Zhao X, Liu H, and Ding H. Frailty as a predictor of future falls and disability: A four-year follow-up study of Chinese older adults. BMC Geriatr. (2020) 20:388. doi: 10.1186/s12877-020-01798-z
38. Bartosch P S, Kristensson J, McGuigan F E, and Akesson K E. Frailty and prediction of recurrent falls over 10 years in a community cohort of 75-year-old women. Aging Clin Exp Res. (2020) 32:2241–50. doi: 10.1007/s40520-019-01467-1
39. Qi H, Huiying Q, Jinmei T, Daohong L, and Lugeon Ao Z. Correlation between body composition and fall risk in hospitalized patients. J Nanjing Med Univ (Nat Sci). (2022) 42:1588–92. doi: 10.7655/nydxbns20221114
40. Steenhagen E, van Vulpen J K, van Hillegersberg R, May A M, and Siersema P D. Nutrition in peri-operative esophageal cancer management. Expert Rev Gastroenterol Hepatol. (2017) 11:663–72. doi: 10.1080/17474124.2017.1325320
41. Chunhua S, Kunhua W, Zengqing G, Fu Z, Chang W, Min W, et al. Nutritional status survey of patients with common Malignant tumors in China. Sci China Life Sci. (2020) 50:1437–52. doi: 10.1360/ssv-2020-0297
42. Zhouhua L, Shuang J, Xianwei H, Qinghai Y, and Guanghe F. Risk factors and clinical outcomes of sarcopenia in lung cancer patients. Chin Gen Pract. (2021) 24:3310–5. doi: 10.12114/j.issn.1007-9572.2021.00.599
43. Aidan X, Kaiquan Z, and Miaoyong Z. Factors influencing moderate to severe malnutrition during chemotherapy in elderly lung cancer patients. Chin J Gerontol. (2022) 42:2896–9. doi: 10.3969/j.issn.1005-9202.2022.12.013
44. Ryan A M, Power D G, Daly L, Cushen S J, Ní Bhuachalla Ē, Prado C M, et al. Cancer-associated malnutrition, cachexia, and sarcopenia: the skeleton in the hospital closet 40 years later. Proc Nutr Soc. (2016) 75:199–211. doi: 10.1017/S002966511500419X
Keywords: elderly, lung cancer, sarcopenia, falls, predictive model
Citation: Wang Q, Han X, Zhang J, Hu M, Xu J, Ai Q, Wei H, Yu J and Ma H (2025) Construction of a risk prediction model for falls in elderly lung cancer patients with sarcopenia. Front. Oncol. 15:1533368. doi: 10.3389/fonc.2025.1533368
Received: 23 November 2024; Accepted: 03 June 2025;
Published: 20 June 2025.
Edited by:
George Pappas-Gogos, Democritus University of Thrace, GreeceReviewed by:
Chang Won Jeong, Wonkwang University, Republic of KoreaSilvia Giovannini, Catholic University of the Sacred Heart, Italy
Copyright © 2025 Wang, Han, Zhang, Hu, Xu, Ai, Wei, Yu and Ma. This is an open-access article distributed under the terms of the Creative Commons Attribution License (CC BY). The use, distribution or reproduction in other forums is permitted, provided the original author(s) and the copyright owner(s) are credited and that the original publication in this journal is cited, in accordance with accepted academic practice. No use, distribution or reproduction is permitted which does not comply with these terms.
*Correspondence: Haiping Ma, NjU3NzQ1NjA4QHFxLmNvbQ==
†These authors have contributed equally to this work