 Xiang Liu1
 Cheng Xiang
- 1Department of Breast and Thyroid Surgery, The Quzhou Affiliated Hospital of Wenzhou Medical University, Quzhou People’s Hospital, Quzhou, Zhejiang, China
- 2Department of Thyroid Surgery, The Second Affiliated Hospital of Zhejiang University College of Medicine, Hangzhou, Zhejiang, China
Objective: We initially found that the thyroid differentiation score (TDS) was associated with the prognosis of papillary thyroid carcinoma (PTC) patients. Therefore, this study aimed to investigate the influencing factors and construct a discriminative model of high-risk dedifferentiation, and to explore the possible mechanisms.
Methods: Data were sourced from the TCGA database. The influences of the TDS, tumor mutation burden, and immune score on the progression-free interval (PFI) were assessed by the Kaplan-Meier method and multivariable Cox regression. Then, logistic regression analyses were utilized to explore the factors of dedifferentiation and a nomogram model was conducted. Additionally, differentially expressed genes (DEGs) were identified using RNA sequencing data, while their regulatory pathways were determined by the Kyoto Encyclopedia of Genes and Genomes (KEGG) analysis. Finally, the differential expression of key genes of major pathways was explored.
Results: This study included 391 PTC patients. After analyzing the influences of the three indicators on survival, only TDS showed an association with PFI. Multivariable logistic analysis revealed that the disease duration and PTC subtypes influenced dedifferentiation. The nomogram model based on these two variables showed improved discriminative capability. The study identified 17 overlapping DEGs associated with the dedifferentiation and three primary enrichment pathways, with complement and coagulation cascade pathways being the most significant (P<0.001). The central gene was CD55, which showed high expression in high-risk dedifferentiated and tall cell PTC, and the expression level increased as the disease progressed.
Conclusion: This research may contribute to promising identifying high-risk dedifferentiated PTC and also provide a potential therapeutic target.
1 Introduction
Thyroid cancer (THCA) is the most prevalent endocrine system malignancy, with 821,000 new cases worldwide in 2022, accounting for 4.1% of all new cancer cases globally and ranking 7th among malignant tumors (1, 2). Papillary thyroid carcinoma (PTC) is the most common subtype of THCA, accounting for approximately 80%-90% of all cases (3). PTC originates from follicular epithelium (4). It includes more than ten subtypes, such as classical/usual PTC, infiltrating follicular PTC, tall cell PTC (TCPTC), and columnar cell PTC (5). PTC is highly differentiated and prone to regional lymph node metastasis at an early stage, with low local infiltration and recurrence rate, resulting in a better prognosis. The 5-year survival rates of PTC range from 83% to 98%, while well-differentiated classic PTC has a 10-year survival rate of up to 97% (6, 7). However, some PTC subtypes may undergo dedifferentiation, making the tumor cells more aggressive and losing iodide uptake capacity, then leading to increased disease progression and mortality (8–10). Compared to identifying dedifferentiation through histopathology alone, the thyroid differentiation score (TDS) integrates the mRNA expression levels of 16 genes associated with thyroid metabolism and function, providing a more consistent method for identifying dedifferentiation (11, 12).
With the advancements in immuno-oncology, immune checkpoint inhibitor (ICI) therapies have revolutionized cancer treatment. However, these groundbreaking therapies also have side effects (13). Tumor mutation burden (TMB), as an emerging biomarker, is considered to be a promising predictor of response to ICI therapy (14). Research has demonstrated that elevated TMB is associated with the response to ICI in several types of tumors. For example, in non-small cell lung cancer, high TMB is linked to significantly improved progression-free interval (PFI) in patients receiving combined Nivolumab and Ipilimumab treatment (15). Similarly, increased TMB is associated with improved survival rates in head and neck cancer and bladder cancer patients undergoing ICI therapy (16).
The tumor immune microenvironment (TIME) plays a crucial role in cancer progression and influences treatment outcomes and prognosis (17). In TIME, the key cluster cells that are most likely to influence clinical outcomes of THCA may be immune cells (18). Currently, immune scores can be obtained using multiple computer algorithms such as Cibersort, Timer, and ImmuCellAI, which can assess immune cell infiltration by RNA-seq expression data (19–21). PTC immune infiltrating cells such as dendritic cells, biased M2 phenotype tumor-associated macrophages, and mast cells are associated with tumor differentiation or anti-tumor immune responses (22–24). Several studies have investigated the relationship between known differentially expressed genes (DEGs) in PTC, TIME, and prognosis (25–27). However, these studies did not include currently unproven immune-related genes or prognostic genes that were not differentially expressed in the analysis. In addition, models that incorporate multiple genes limit the feasibility of their clinical application. To address these limitations, this study employed the ESTIMATE algorithm to calculate immune scores for PTC cases.
Dedifferentiation, gene mutation, and immune microenvironment significantly impact the biological behavior and clinical prognosis of PTC. In this study, we initially explored the effects of these three markers on PFI in PTC patients, revealing that only TDS influenced prognosis. Subsequently, the influencing factors and mechanisms were explored for TDS to guide intervention strategies.
2 Materials and methods
2.1 Data acquisition and preprocessing
The transcriptome data and clinical information data of the PTC patients were from the Cancer Genome Atlas (TCGA) genome database (https://portal.gdc.cancer.gov/). PTC samples in the TCGA database were collected and sequenced primarily between 2010 and 2015. We obtained 507 PTC patients’ data, and 391 of them with complete TDS, TMB, and immune scores data were analyzed. Perl version 5.24.3 software was utilized to transform original RNA sequencing data into an RNA expression matrix.
2.2 Calculation of immune score, TDS, and TMB in PTC patients
ESTIMATE, a computerized algorithm, can infer the level of stromal and immune cell infiltration in tumor tissue based on expression profiles (28). The immune score of the immune microenvironment in PTC patients was calculated by the ESTIMATE algorithm.
TDS encompasses the expression levels of 16 thyroid metabolic and functional mRNAs (12). The log2 normalized RSEM values were first centered on the median of each sample to derive the log2 (fold-change) (FC), and then the TDS of each tumor tissue was obtained by summing the 16 genes of each sample. The calculation formula was as follows: TDS = log2 (FC) average of 16 genes (29, 30). The genes involved were DIO1, DIO2, DUOX1, DUOX2, FOXE1, GLIS3, NKX2-1, PAX8, SLC26A4, SLC5A5, SLC5A8, TG, THRA, THRB, TPO, and TSHR.
TMB was defined as the number of somatic, coding, base substitution, and insertion-deletion variants per megabase (Mb) of the examined target genomic region (14). The formula was calculated as follows: sample TMB = number of mutations/exon region size (31). The TMB distribution for patients was directly acquired from the TCGA database.
2.3 Key indicators identification
We first explored the influence of immune score, TDS, and TMB on the survival outcome of PTC patients by Kaplan-Meier (KM) method and log-rank test. Due to the long overall survival and tumor-specific survival of PTC patients, this study collected limited mortality data. PFI was used as the survival indicator. PFI is defined as the time interval between the date of diagnosis of the disease and the occurrence of a new tumor event, including disease progression, local recurrence, distant metastasis, the new primary tumor, or death from a tumor (32). In the KM analysis, all the patients were divided into high and low groups according to the optimal cut-off value and median of TDS, TMB, and immune scores. The optimal cut-off value is the minimum P-value cut-off for univariable Cox analysis when PFI is the primary endpoint and is obtained from the R software package “survminer”. We then performed a Cox regression analysis to assess their association with PFI. The factor of PFI was regarded as the key indicator.
2.4 Definition of high/low-risk dedifferentiation
In this study, only TDS showed an association with PFI, thus becoming the research topic in the subsequent analysis. The 391 PTC patients were grouped by the optimal cut-off value (-0.303) of the TDS score. The low-differentiation score group (TDS≤-0.303) was defined as high-risk dedifferentiation, while the high-differentiation score group (TDS>-0.303) was designated as low-risk dedifferentiation. We then compared the baseline data between high and low-risk dedifferentiation groups.
2.5 Collected baseline variables
Relevant variables collected in this study were related to: demographic characteristics (age, sex, race), tumor-related clinical variables (disease duration, tumor size, TNM stage, PTC subtypes, stage, site, and focus type of primary lesions, lymph node preoperative assessment diagnostic imaging type, medical history of the thyroid gland disorder, radiation therapy and response to therapy, postoperative tumor residue after resection) and follow-up (follow-up after radiation treatment, PTC status after initial treatment).
The disease duration was defined as the time interval between initial diagnosis and completion of the TCGA program. Tumors with ≥99% of follicular structures were considered to be follicular variant PTC, and those with tall cells content ≥50% were defined as TCPTC. It has been noted that stage 1 and 2 tumors remain confined to the thyroid gland and have not yet spread to the central compartment of the lymph nodes; in stages 3 and 4, the cancer spreads to the lymph nodes, including other organs (33). Therefore, we combined stage 1 and 2 samples as early-stage samples and stage 3 and 4 samples as advanced-stage samples. Preoperative lymph node imaging was categorized as ultrasound-only or other. The other included computed tomography (CT)-only, magnetic resonance imaging (MRI)-only, or combinations. Response to radiotherapy was classified as complete response or other, with other conditions including partial response, stable disease, and radiographic progressive disease. Residual tumors after resection were categorized as absent or present. Complete resection of the tumor was defined as no tumor residue, resection with residue under a microscope and residue visible to the naked eye was classified as having residue. In the follow-up results, the status of PTC after initial treatment included both no imaging evidence of disease and disease persistence. Disease persistence included persistent locoregional disease and persistent distant metastases. In spite some samples had missing data, which are clinically valuable and worth analyzing, they were retained for baseline and/or subsequent analyses.
2.6 Influencing factors and model construction of high-risk dedifferentiation
After baseline comparison, we conducted a logistic regression analysis to explore the key factors and established a nomogram model for predicting the high-risk dedifferentiation. The performance of the nomogram model was then evaluated by several analyses. The detailed information is shown in the following Statistical analysis section.
2.7 Potential mechanism exploration associated with dedifferentiation
The RNA-seq expression data of PTC patients were normalized using the log2 (X+1) method. Supplementary Table S1 displays the normalized data of 16 TDS-related genes and CD55. The “Limma” package in R software was used to detect the differentially expressed genes (DEGs) between the high-risk dedifferentiation group and the low-risk differentiation group (DEG1), as well as high and low nomogram score groups (DEG2), based on the threshold of adjusted P-value < 0.05 and |log2 (FC)| > 1. Gene expression volcano plots were created with Graphpad Prism 8. Overlapping genes between DEG1 and DEG2 were identified using Venn diagrams (bioinformatics.psb.ugent.be/webtools/Venn/). Kyoto Encyclopedia of Genes and Genomes (KEGG) enrichment analysis was performed to determine the pathways associated with the overlapping genes and identify genes in major pathways. Finally, the expression levels of key genes involved in the major pathways were analyzed for differences between PTC subtypes and dedifferentiation risk groups, and the correlation between gene expression level and disease duration was also assessed.
2.8 Statistical analysis
Continuous variables with non-normal distribution were characterized by medians and quartiles (P25, P75), and the differences between high and low-risk dedifferentiation groups were compared using the Wilcoxon-Mann-Whitney test. Categorical variables were presented as frequencies (n) and proportions (%) and then compared by the Chi-square test/Fisher exact test. Variables that were statistically different from baseline comparisons were included in logistic regression analyses to explore the factors influencing high-risk dedifferentiation in PTC patients. Collinearity analysis was performed due to the joint confirmation of tumor staging by T, N, and M staging indicators, and the potential for interactions among other indicators. Collinearity was considered present when the variance inflation factor (VIF) exceeded 10.
Based on the results of multivariable logistic regression, a model for high-risk dedifferentiation was constructed using the nomogram method. Receiver operating characteristic analysis (ROC) was used to evaluate the performance of the key factors in predicting high-risk dedifferentiation using “pROC” packages, while decision curve analysis (DCA) based on “rmda” packages was used to assess the net clinical benefit of the model. In addition, based on the “dplyr” and “Hmisc” packages in the R software, integrated discrimination improvement (IDI) analysis and net reclassification improvement (NRI) analysis were conducted to explore the improvement in the performance of the models compared to the individual influences. Restricted cubic spline (RCS) analysis via “rms” packages was utilized to explore the association of nomogram score and dedifferentiation. These analyses were performed using R software (version 4.4.1), with statistical significance set at P < 0.05.
3 Results
3.1 The influence of three biomarkers on PFI
The influence of three tumor biomarkers including TDS, TMB, and immune scores on PFI was analyzed in 391 PTC patients. All patients were divided into high and low-score groups according to the optimal cut-off value and median of TDS, TMB, and immune scores. For the TDS score, the high-differentiated group had a better prognosis compared to the low-differentiated group (P<0.05) (Figures 1A, B). Regarding TMB, groups with high mutation burden showed worse prognosis compared to the low mutation burden group (P<0.001) (Figures 1C, D). Immune score showed no significant influence on prognosis (P>0.05) (Figures 1E, F). The results of multivariable Cox regression analysis revealed that on both continuous and dichotomous TDS, TMB, and immune scores categorized by the optimal cut-off value, only TDS remained an influencing factor of PFI after adjusted age, sex, and race (Table 1). Due to the association between TDS and PFI, therefore the differentiation status of PTC patients became the topic of our next analysis.
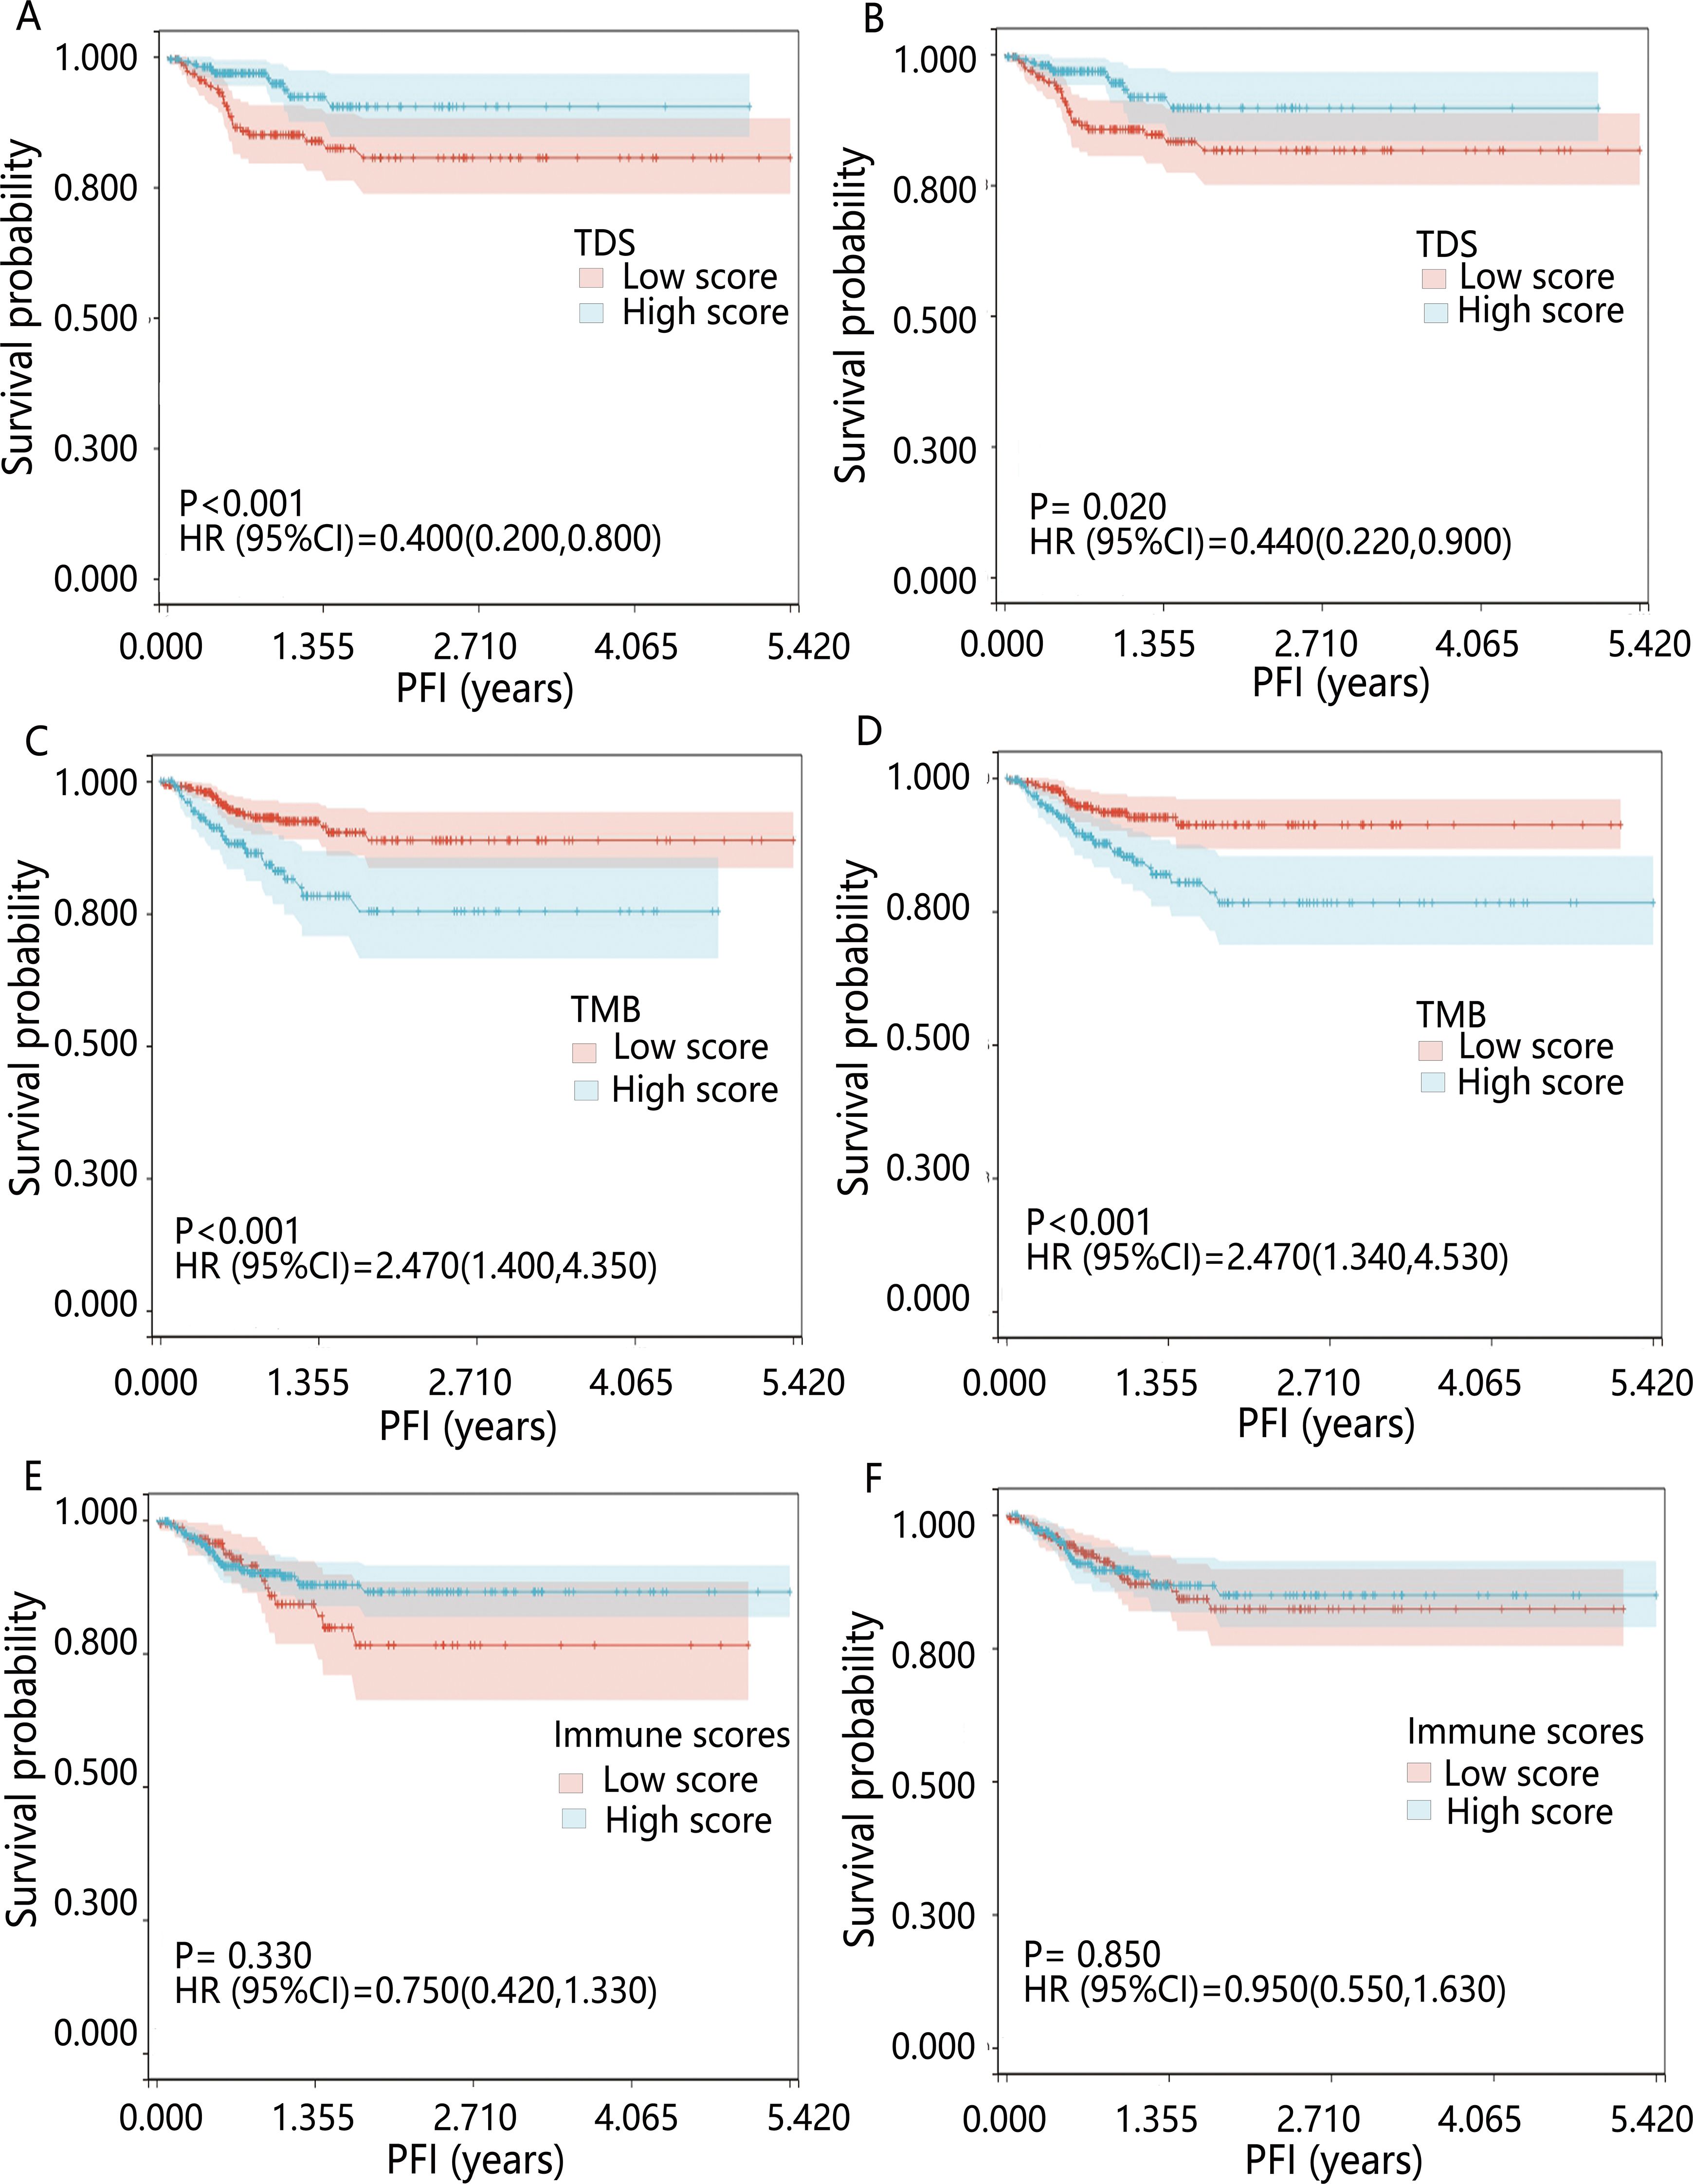
Figure 1. Kaplan-Meier survival curves for PFI across various biomarkers. Patients were grouped by (A) optimal cut-off value of TDS; (B) median TDS; (C) optimal cut-off value of TMB; (D) median TMB; (E) optimal cut-off value of immune scores; (F) median immune scores. HR was derived from the results of the univariable Cox regression analysis.
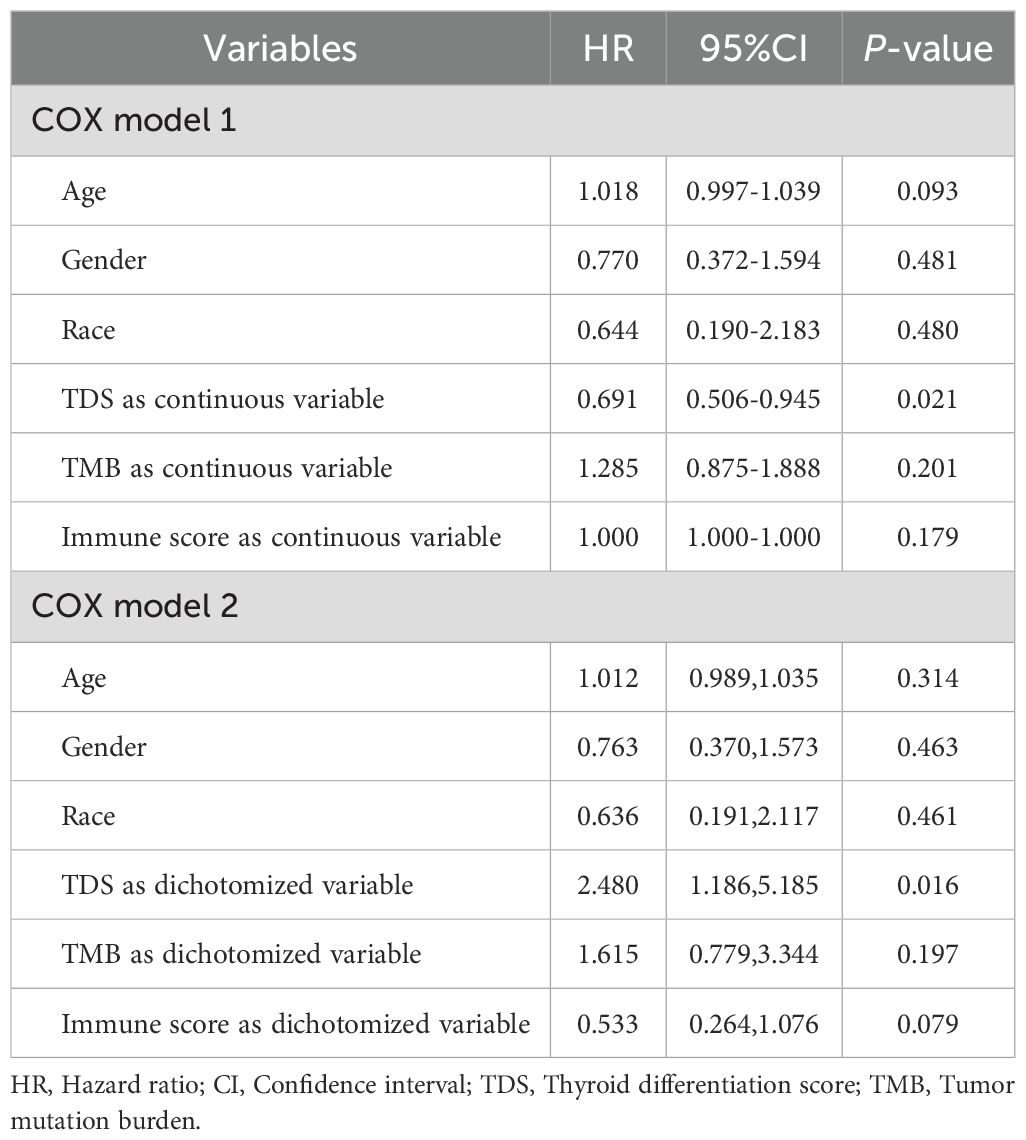
Table 1. Results of multivariable Cox analysis of the influences of TDS, TMB and immune scores on PFI in PTC patients.
3.2 Baseline characteristics of high/low-risk dedifferentiation groups
Table 2 demonstrates the differences in baseline data between the high/low-risk dedifferentiation groups. The median age of 391 PTC patients was 46.000 (34.000,58.000). The majority were non-Hispanic (90.064%), with a lower proportion in the high-risk group compared to the low-risk group (86.250% vs. 94.079%, P=0.021). Among the continuous variables, disease duration, tumor length, tumor width, number of examined lymph nodes, and number of positive lymph nodes were higher in the high-risk group than the low-risk group (all P<0.05). Among the categorical variables, 28.302% of patients in the high-risk group had a medical history of thyroid gland disorder, lower than the low-risk group (44.643%) (P=0.006). The percentage of patients with classic/usual PTC was higher in the high-risk group than in the low-risk group (82.065% vs 60.099%) (P<0.001). T3 stage, T4 stage, N1 stage, advanced stage, follow-up after radiation treatment, and residual tumor were more prevalent in the high-risk group than in the low-risk group (all P<0.05).
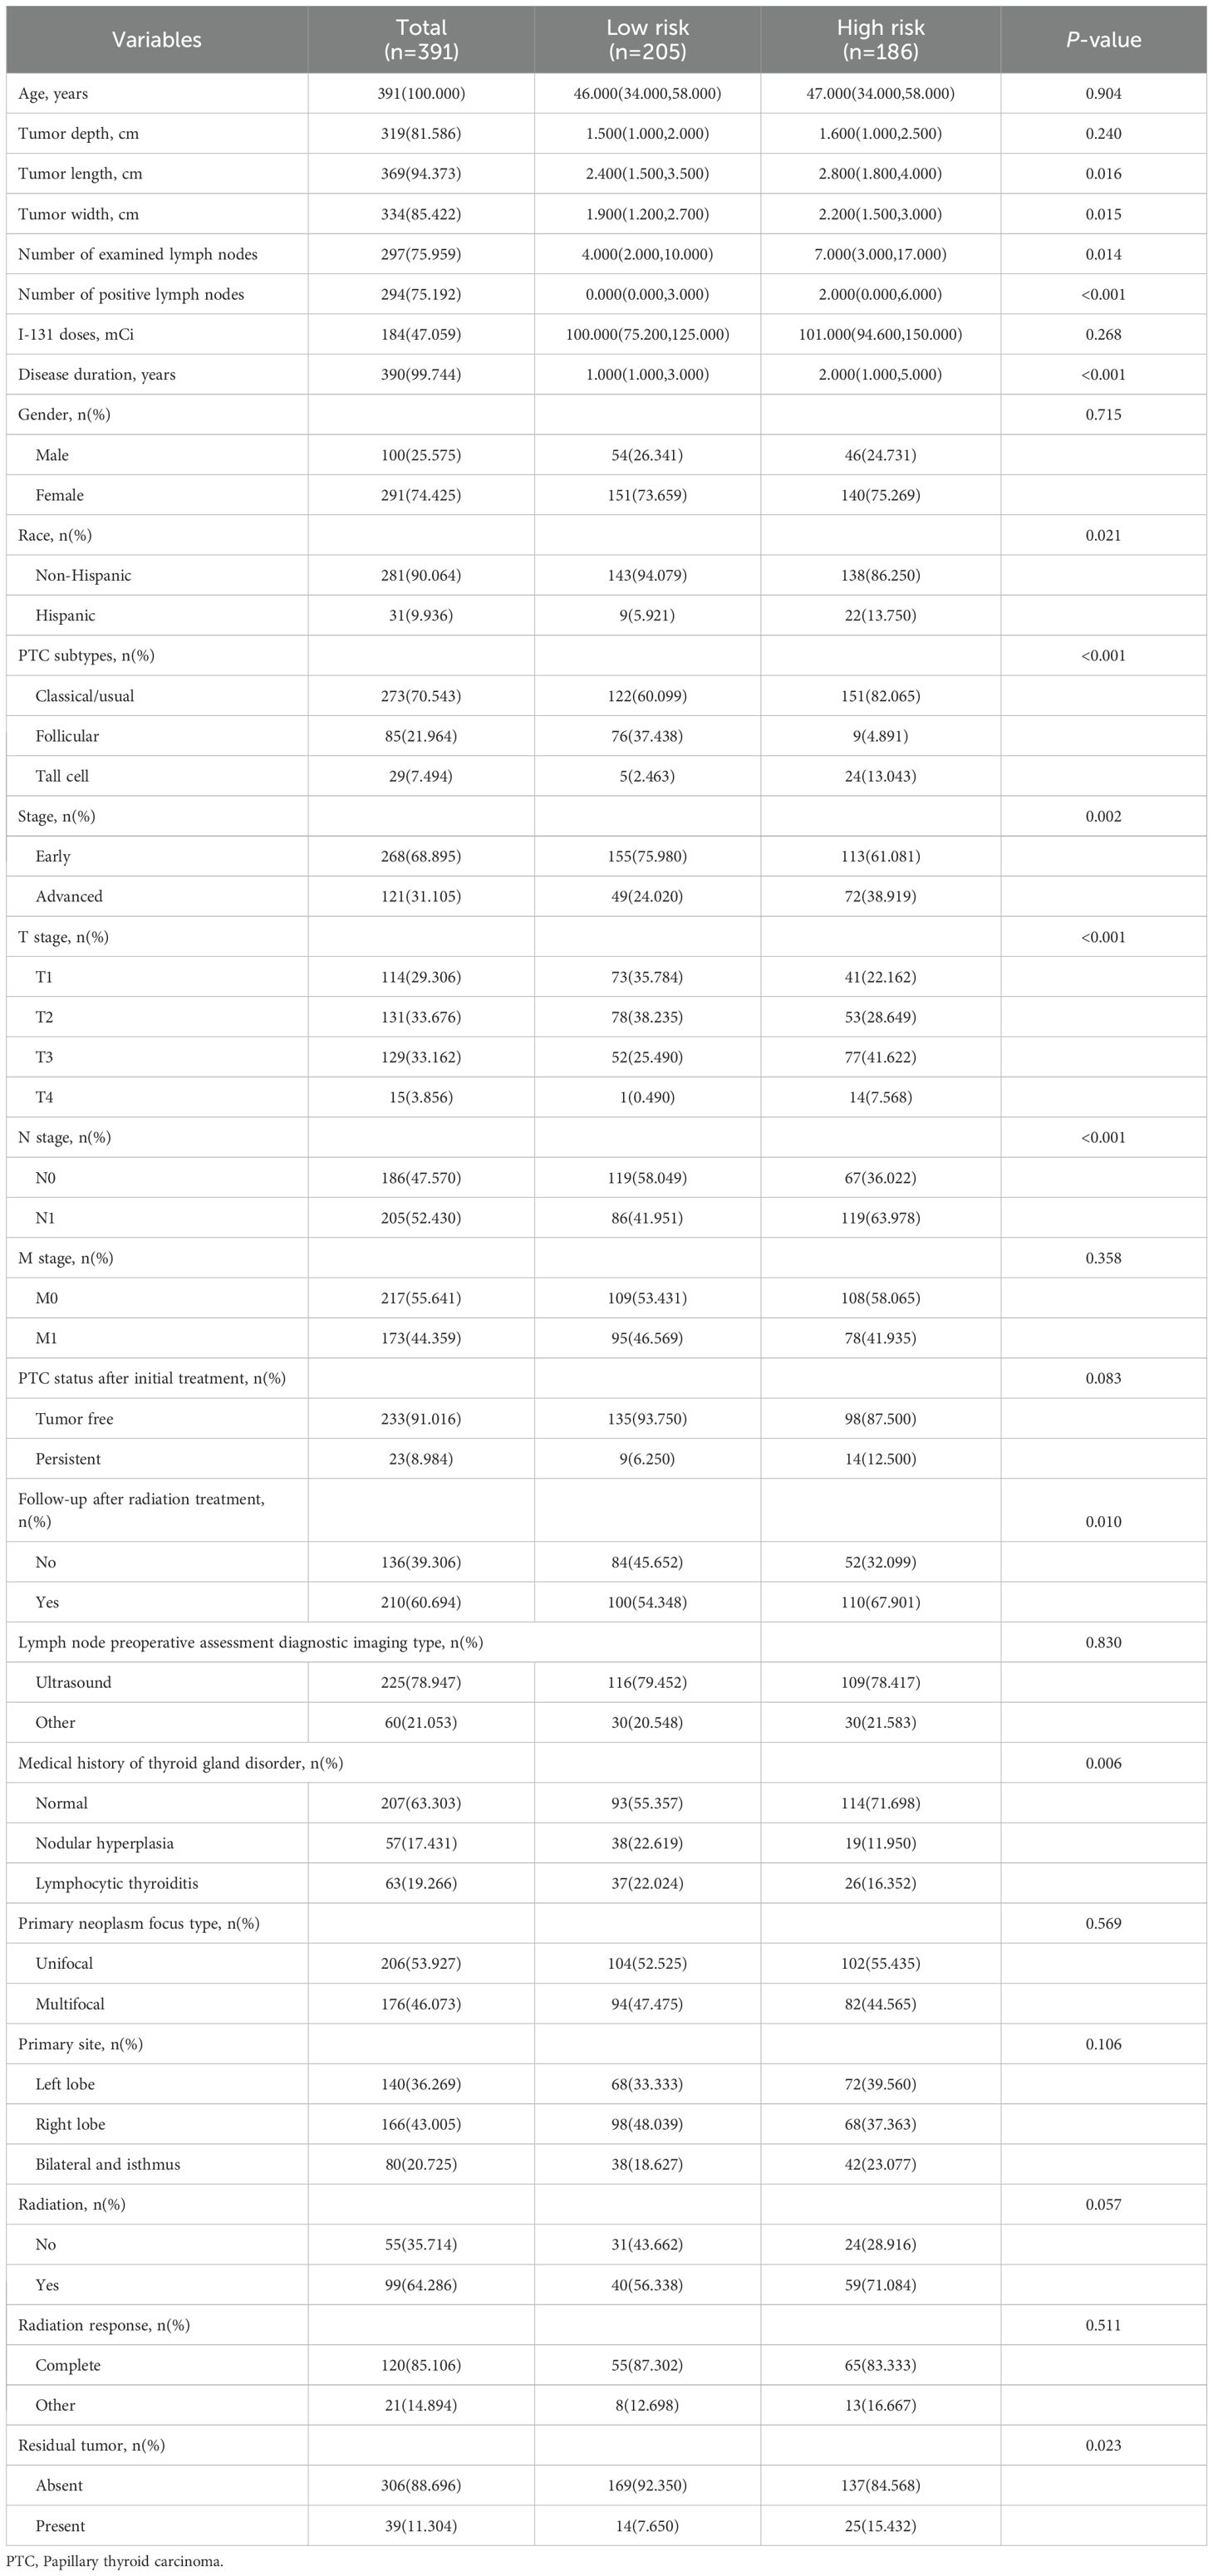
Table 2. The baseline information of participants grouped by the risk of dedifferentiation.
3.3 The influencing factors of high-risk dedifferentiation
Collinearity analysis of the 13 significantly different variables revealed no collinearity (all VIF<10) (Supplementary Table S2). The 13 variables were included in the logistic regression analysis. The results of univariable logistic regression showed that except for the number of examined lymph nodes, the other 12 variables were related to dedifferentiation (all P<0.05). Further multivariable logistic analysis containing all variables showed that only disease duration and PTC subtypes were influential factors for high-risk dedifferentiated PTC. Follicular variant PTC was a protective factor for high-risk dedifferentiation (OR=0.207, 95%CI: 0.035-0.872) and tall cell PTC was a risk factor for it (OR=8.035, 95%CI: 1.389-72.04). Longer disease duration increased the likelihood of dedifferentiation (OR=1.192, 95%CI: 1.018-1.427) (all P<0.05) (Table 3). Further analysis revealed that TCPTC had the lowest TDS, and TDS decreased with increasing disease duration (Figures 2A, B).
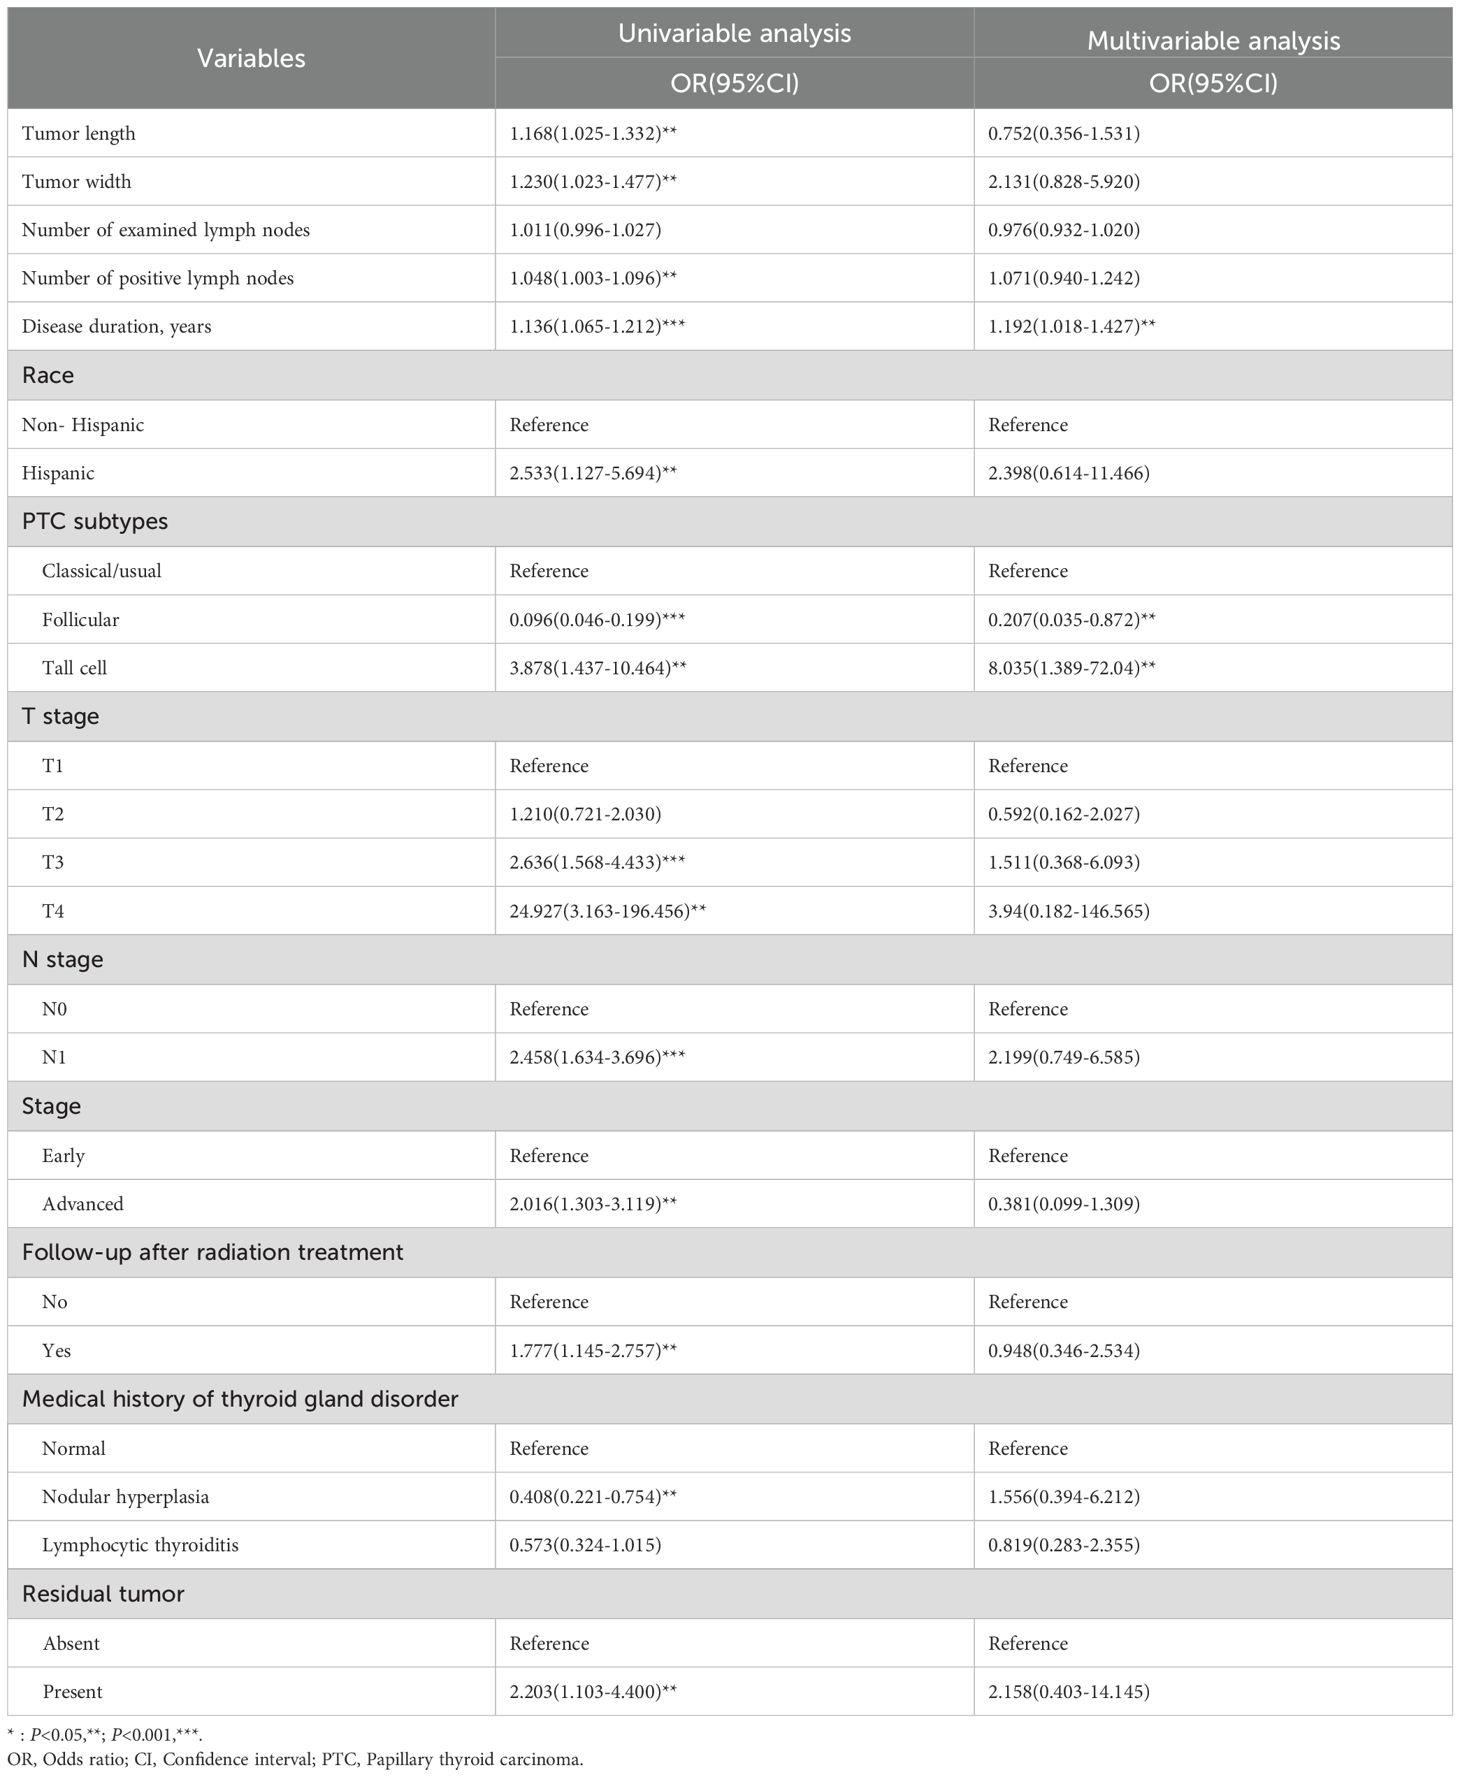
Table 3. Results of logistic regression analysis of factors associating with high-risk of dedifferentiation.
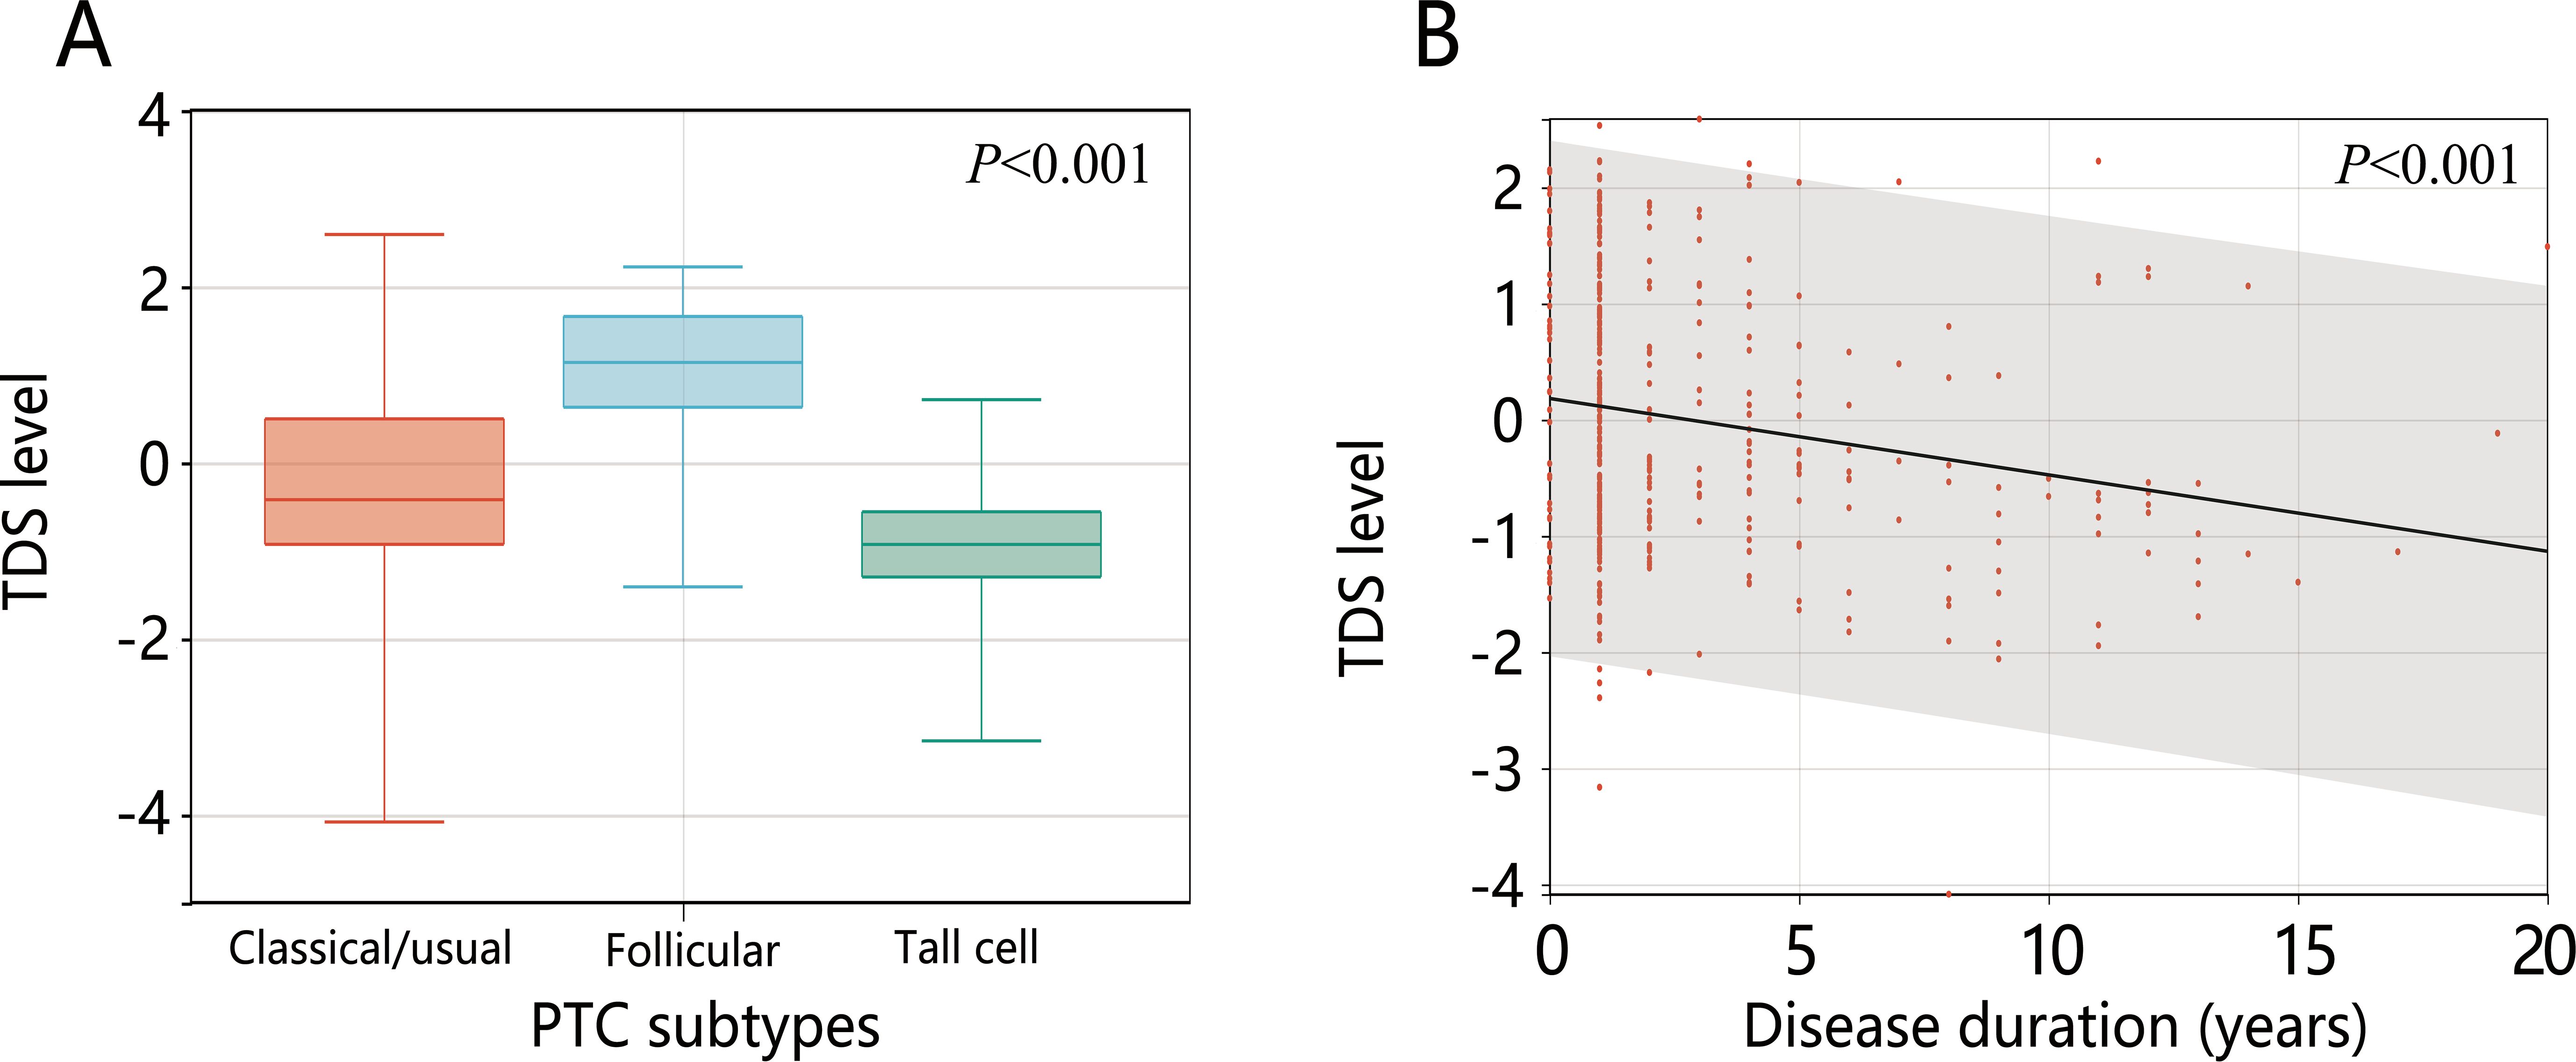
Figure 2. The levels of TDS in (A) different PTC subtypes and (B) disease duration.
3.4 Nomogram model construction and performance evaluation
Based on the multivariable logistic regression results, the nomogram model was constructed based on disease duration and PTC subtypes. Meanwhile, the calibration curve of the nomogram model was plotted, demonstrating good calibration (Figures 3A, B). The performance of disease duration and PTC subtypes as well as the nomogram model in predicting high-risk dedifferentiation was further evaluated by ROC analysis (Table 4, Figure 3C). Results indicated that PTC subtypes had the highest specificity (0.821), while the nomogram model exhibited the highest AUC (0.740), sensitivity (0.957), Youden index (0.328), and accuracy (0.524). The Delong test revealed that the AUC value of the nomogram model was significantly higher than the AUC values for disease duration alone and PTC subtypes alone (all P<0.001). DCA confirmed that the nomogram model could provide a net clinical benefit, with a risk interval of 0.40-0.76 (Figure 3D). IDI analysis showed that the performance of the nomogram model was improved by 15.3% compared to single disease duration (IDI=0.153, 95%CI: 0.118-0.188, P<0.001) and 18.8% improvement compared to PTC subtypes (IDI=0.188, 95%CI: 0.149-0.228, P<0.001). NRI analysis suggested that nomogram model discriminative performance improved by 25.8% and 5.7% compared to PTC subtypes (NRI=0.258, 95%CI: 0.180-0.337) and disease duration (NRI=0.057, 95%CI: -0.039-0.169), respectively. These results indicated that the constructed nomogram model possessed good discriminative capability.
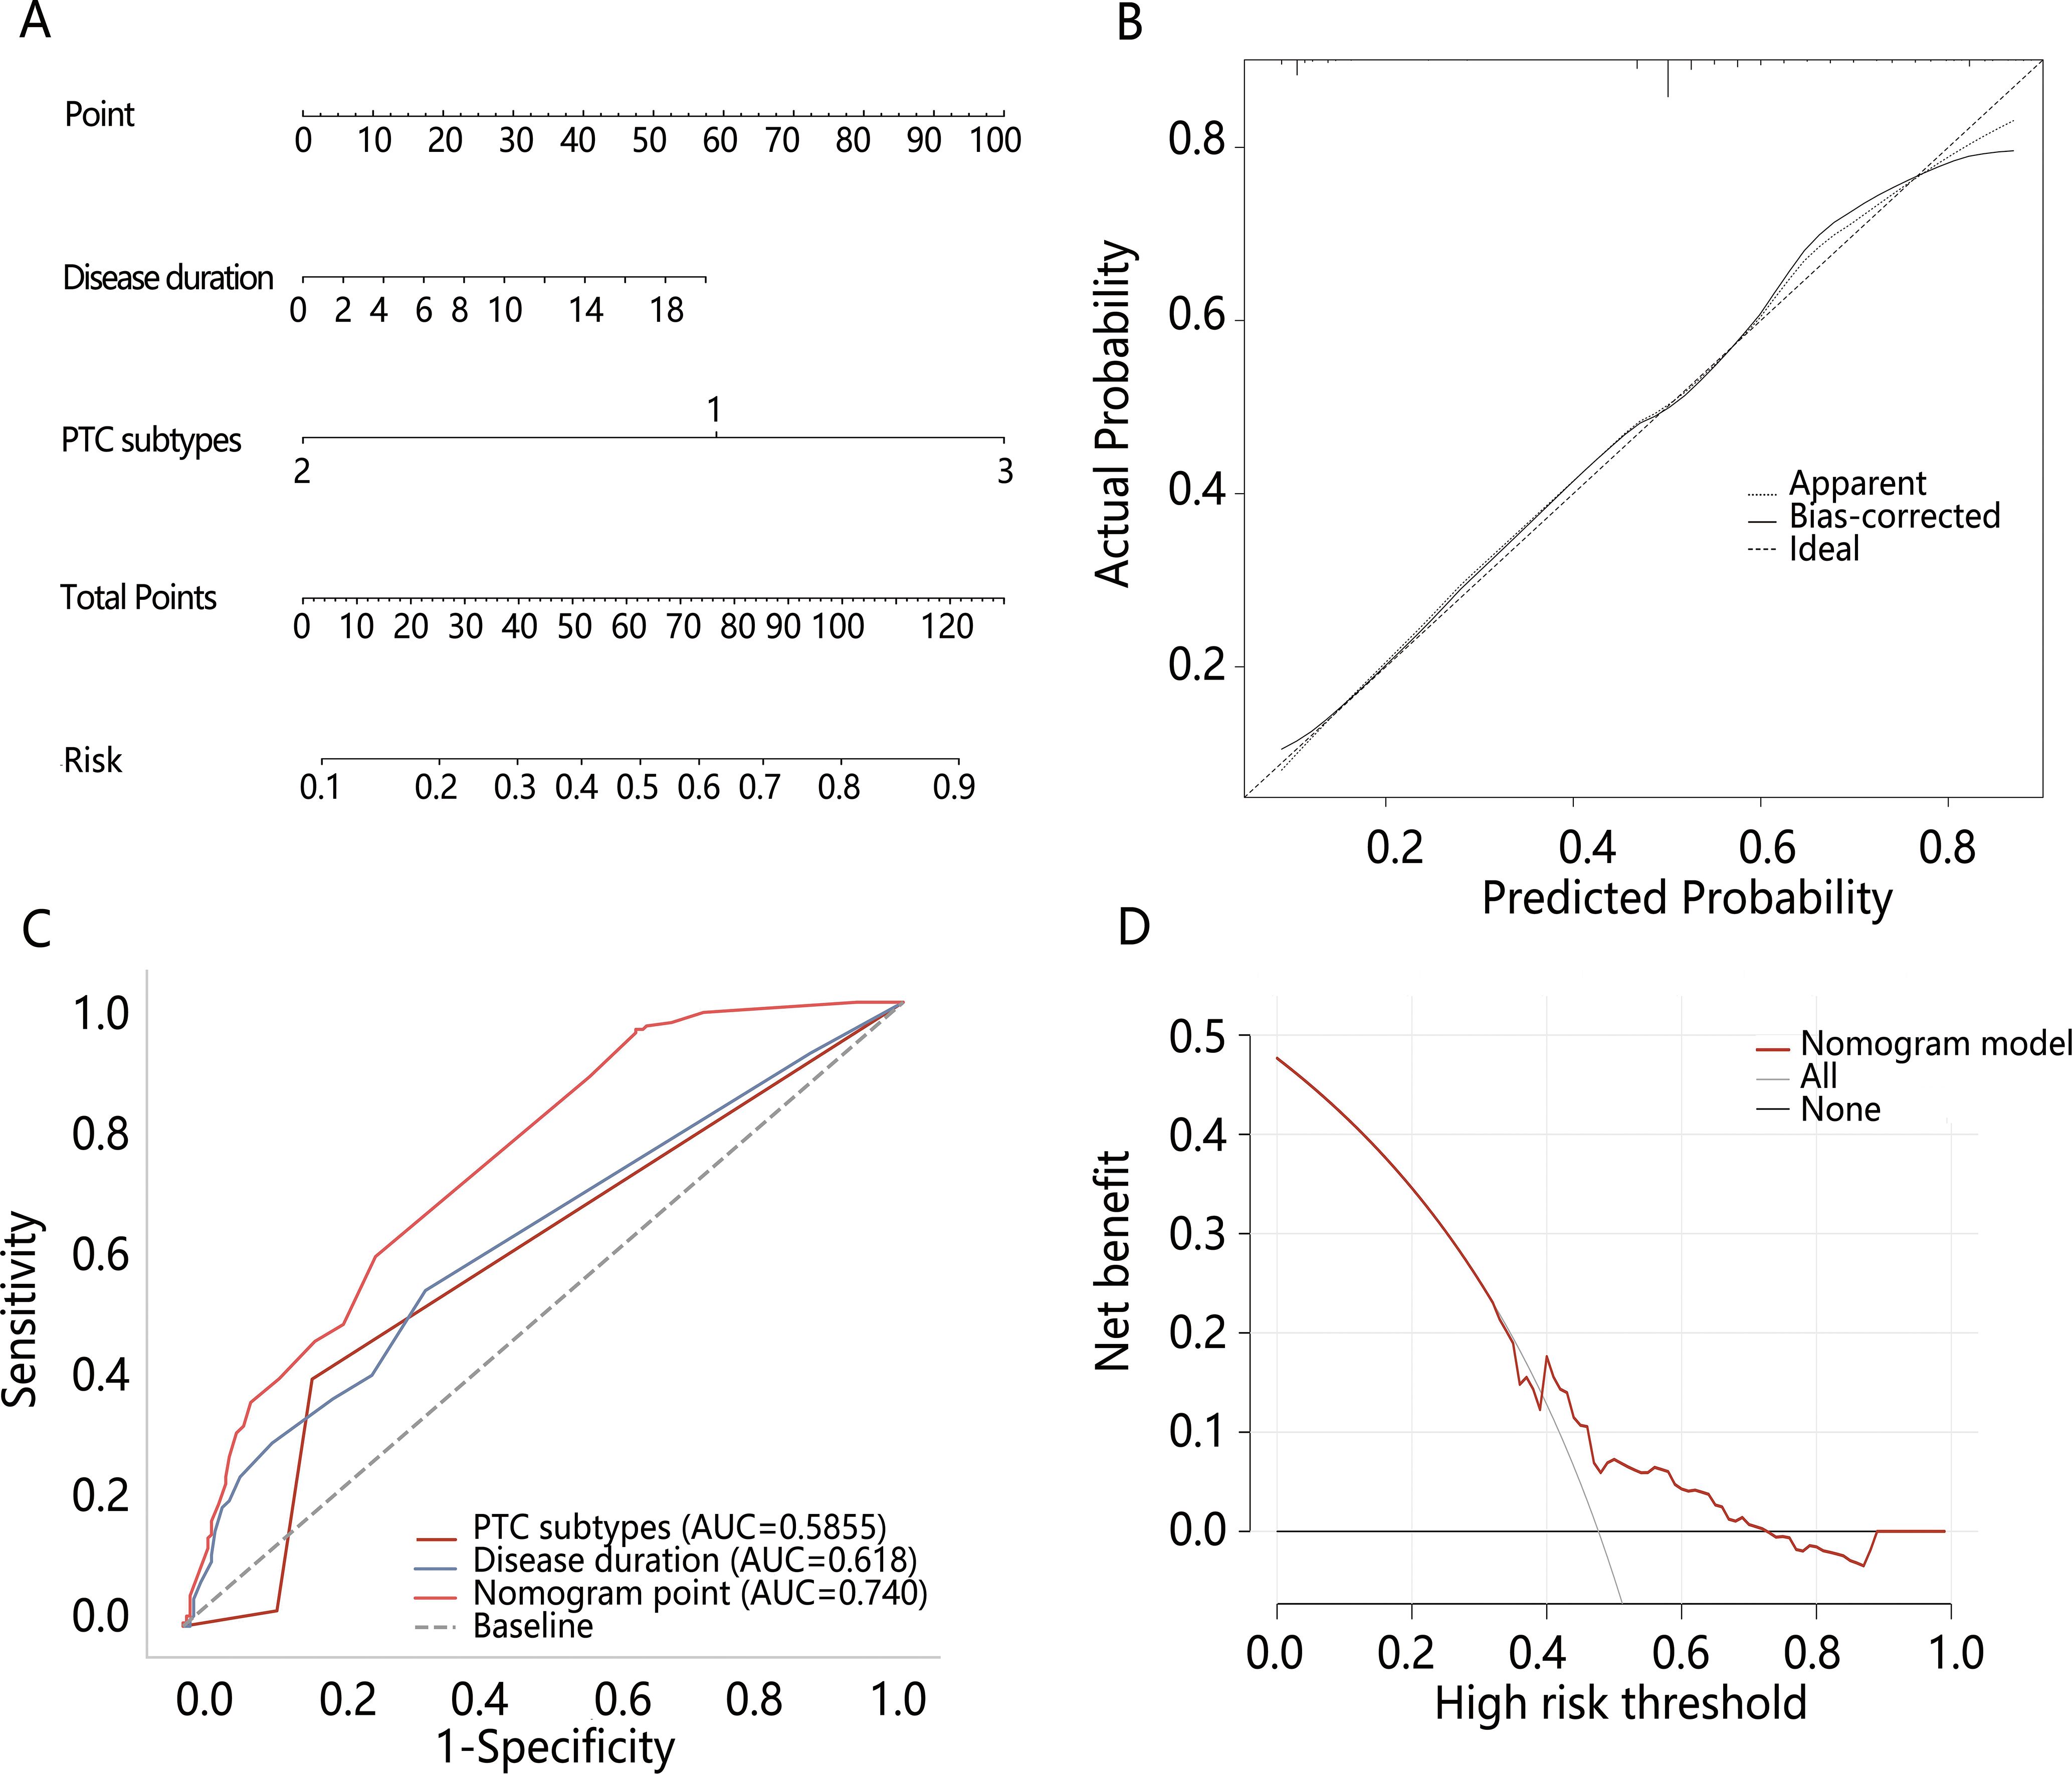
Figure 3. The construction and evaluation of the nomogram model. (A) The nomogram model of high-risk dedifferentiation; (B) The calibration curve of the nomogram model; (C) Comparison of ROC between the nomogram model and different variables; (D) The DCA of the nomogram model.
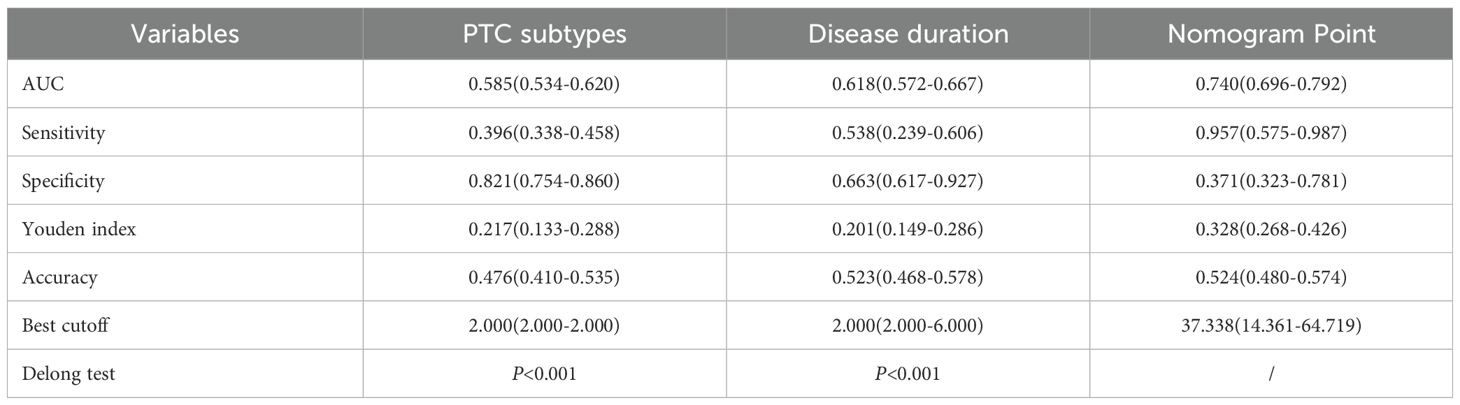
Table 4. The results of ROC analysis of factors associated with high-risk dedifferentiation.
3.5 Potential mechanism associated with dedifferentiation
We next explored the potential mechanism associated with the PTC dedifferentiation. RCS analysis initially indicated a linear positive relationship between nomogram score and dedifferentiation risk (P for overall<0.001, P for nonlinear=0.841), suggesting the involvement of common biomarkers between them (Figure 4A). Therefore, we then explored the DEGs between high and low-risk dedifferentiation groups, as well as between high and low-nomogram score groups who were divided by their optimal cut-off value. According to the criteria of |log2 FC)|>1 and adjusted P-value<0.05 (Figures 4B, C), there were 290 DEGs obtained in the different dedifferentiation groups (Supplementary Table S3) and 32 DEGs obtained in the different nomogram score groups (Supplementary Table S4), with 17 overlapping genes between the two groups (Supplementary Table S5; Figure 4D). Among the 17 overlapping genes, we found 11 up-regulated genes and 6 down-regulated genes. KEGG enrichment analysis revealed three significant pathways: complement and coagulation cascades, proteoglycans in cancer, and aldosterone-regulated sodium reabsorption (all P<0.05) (Figure 5A). Among these, the complement and the coagulation cascades pathway were the main pathway, with CD55 identified as a key factor (Figure 5B).
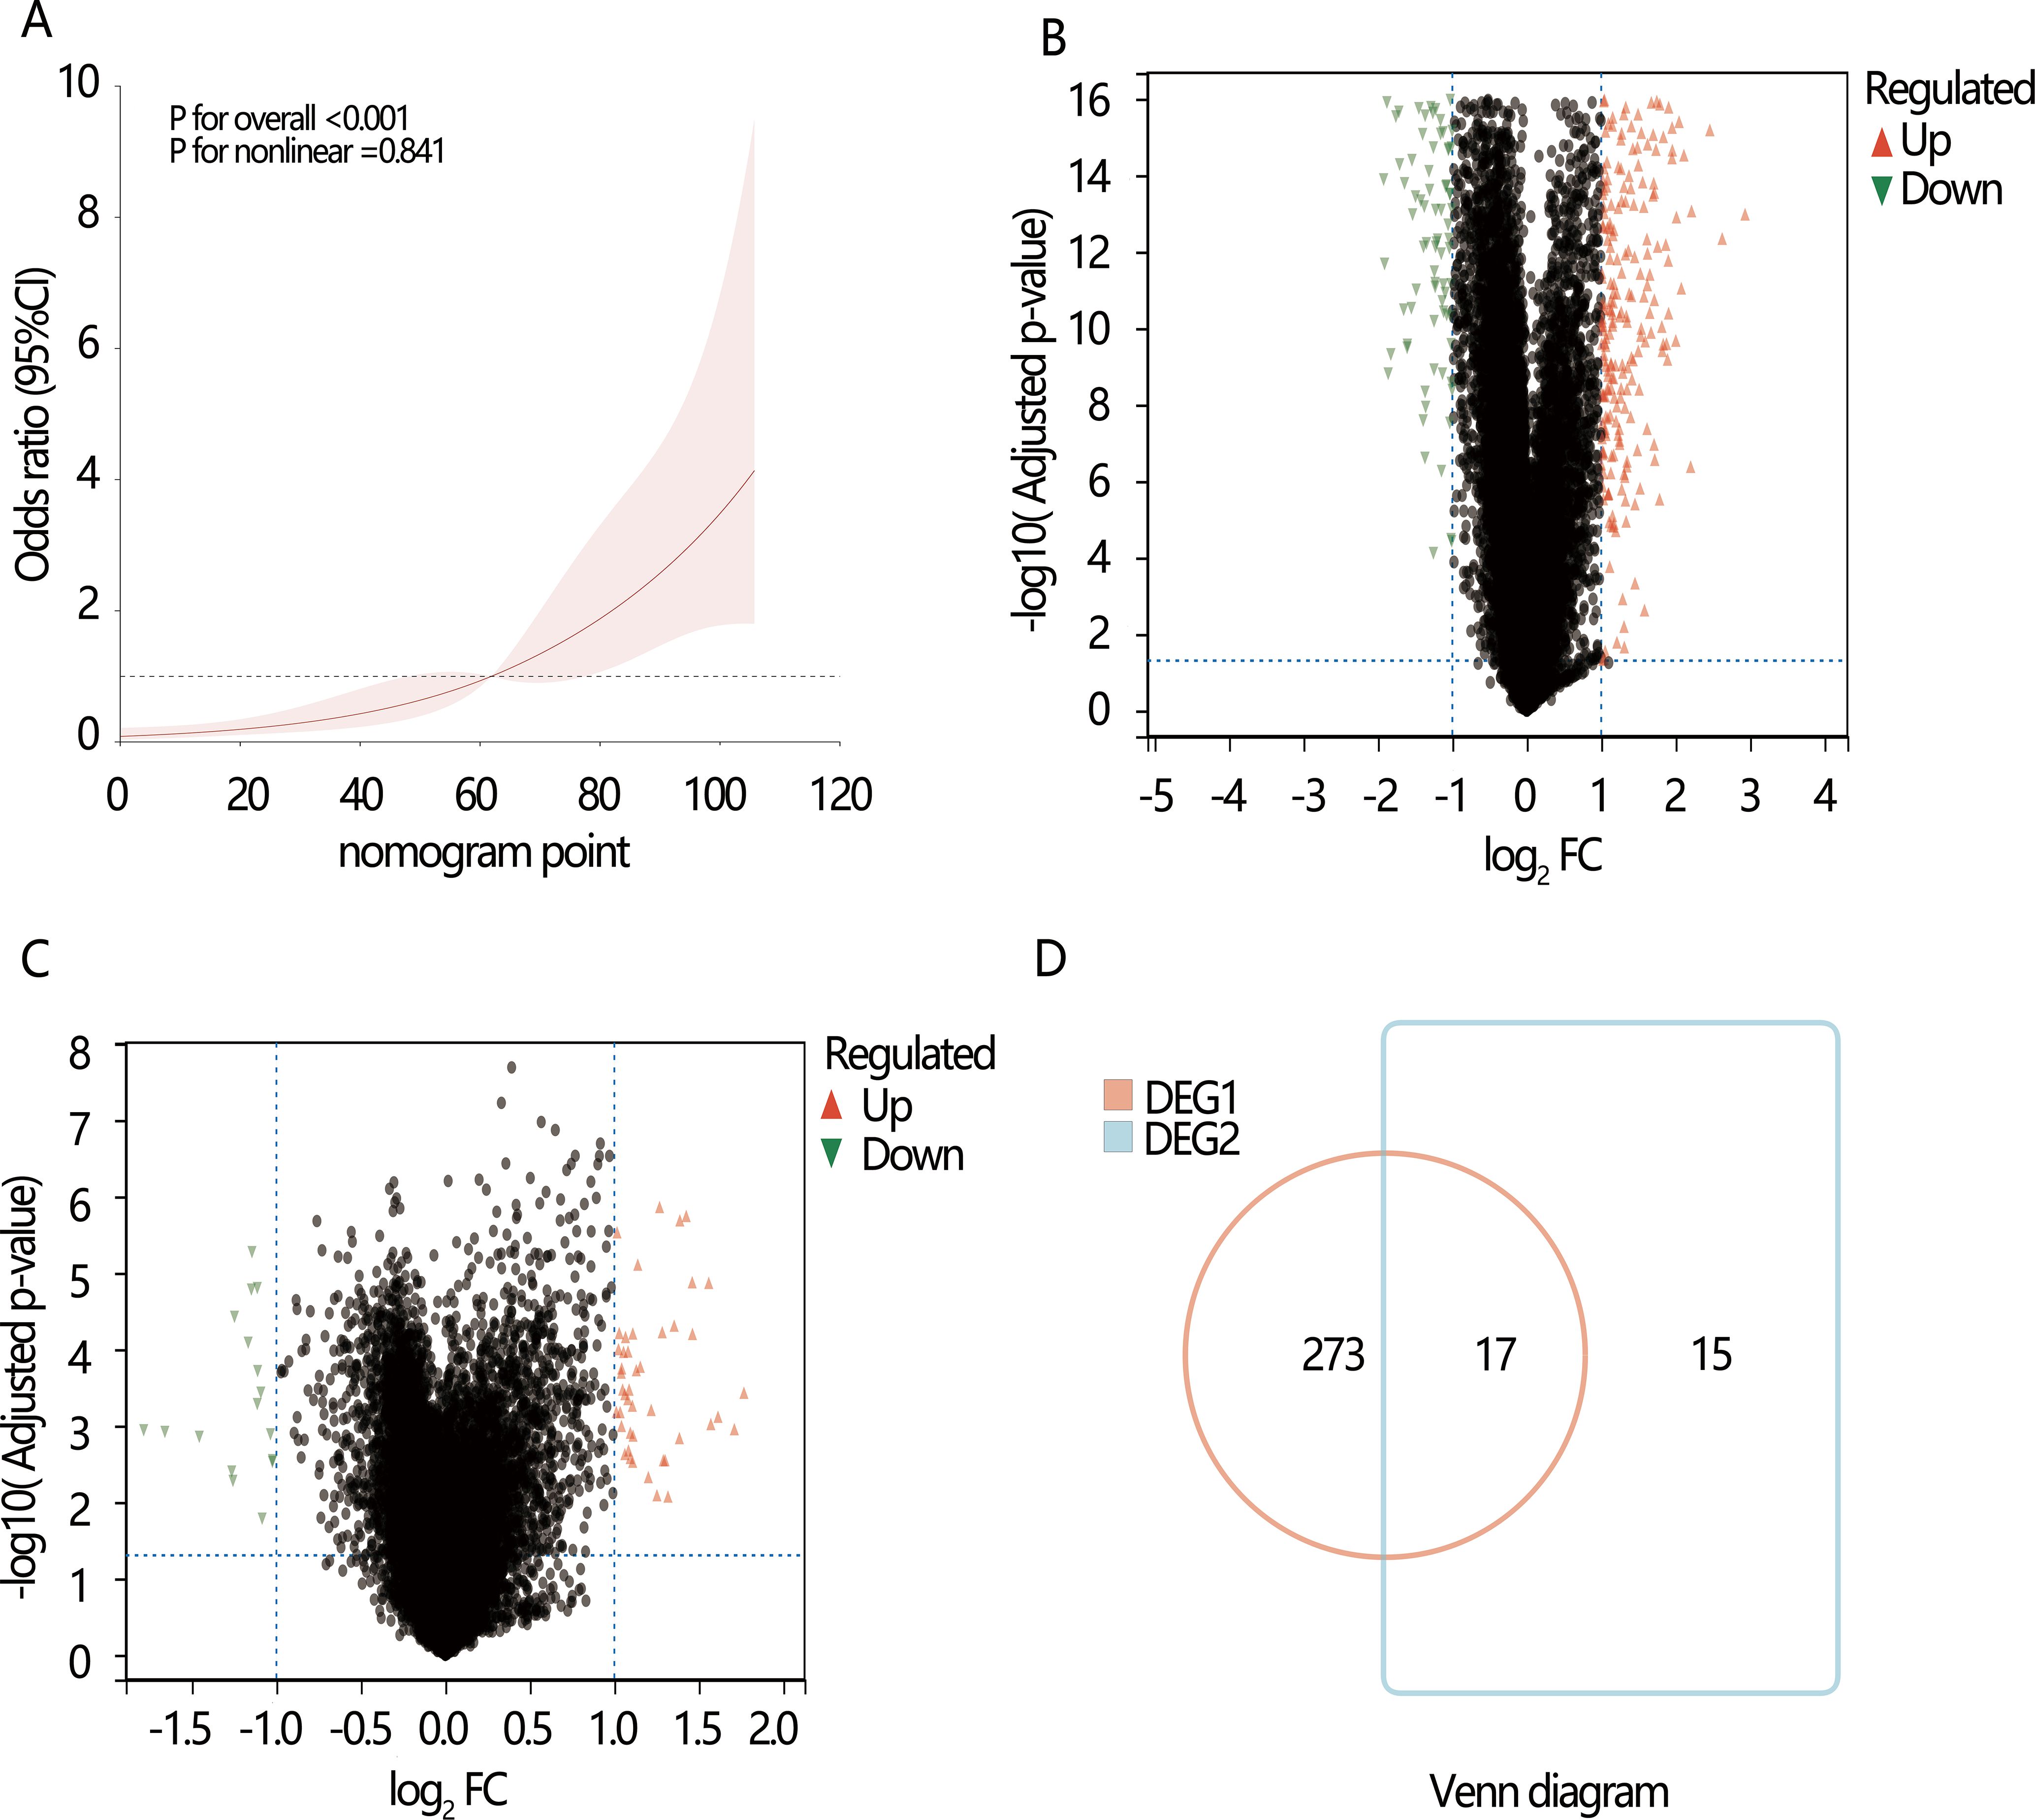
Figure 4. The potential genes and pathways exploration associated with the dedifferentiation. Volcano plots show the differentially expressed genes (DEGs). (A) The restricted cubic spline (RCS) analysis between nomogram point and dedifferentiation; (B) DGE1: DEGs between the high and low-risk dedifferentiation samples; (C) DGE2: DEGs between the high and low nomogram point samples; (D) Venn diagram shows the overlapping DEGs in DGE1 and DGE2.
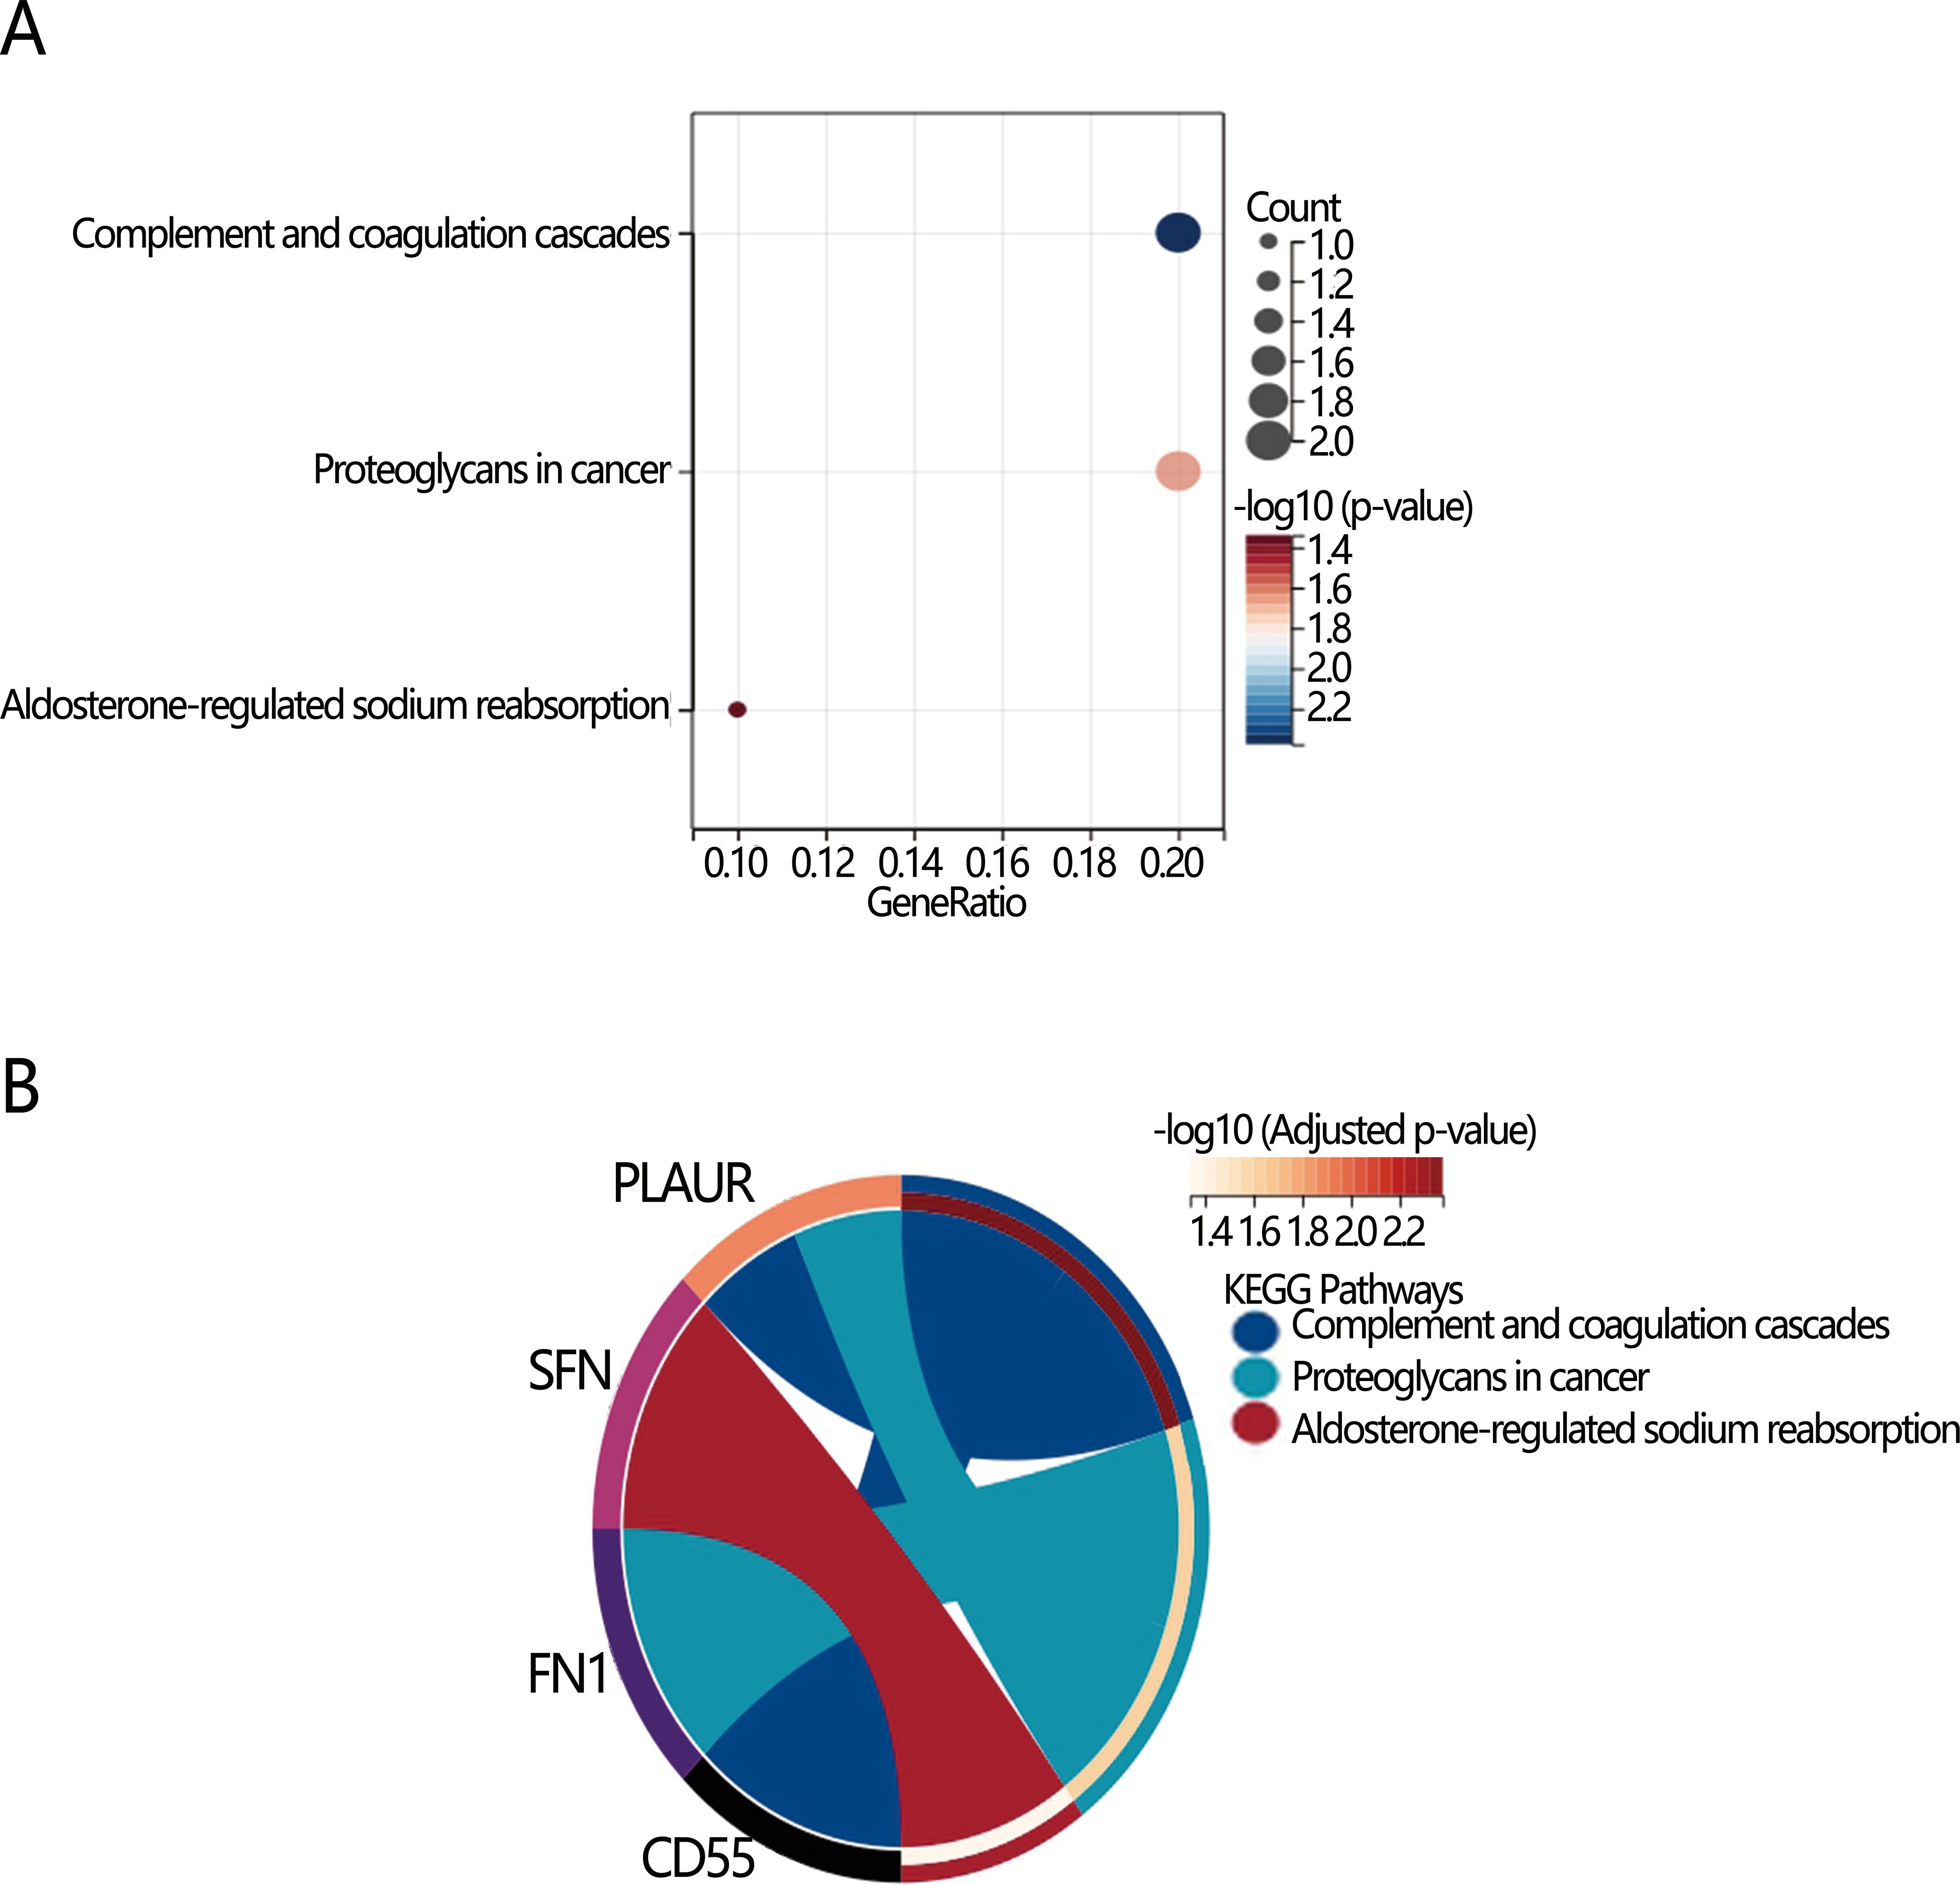
Figure 5. Visualization of KEGG enrichment analysis of 17 overlapping DEGs differential pathways. (A) Bubble diagram; (B) Chord diagram.
We further analyzed the expression level of CD55 between groups with different PTC subtypes, disease duration, and dedifferentiation (Figures 6A–C). The results showed significant upregulation of CD55 expression in the high-risk dedifferentiation group. Tall cell PTC exhibited higher CD55 expression levels compared to follicular PTC. Additionally, CD55 expression levels demonstrated an increasing trend with prolonged disease duration.
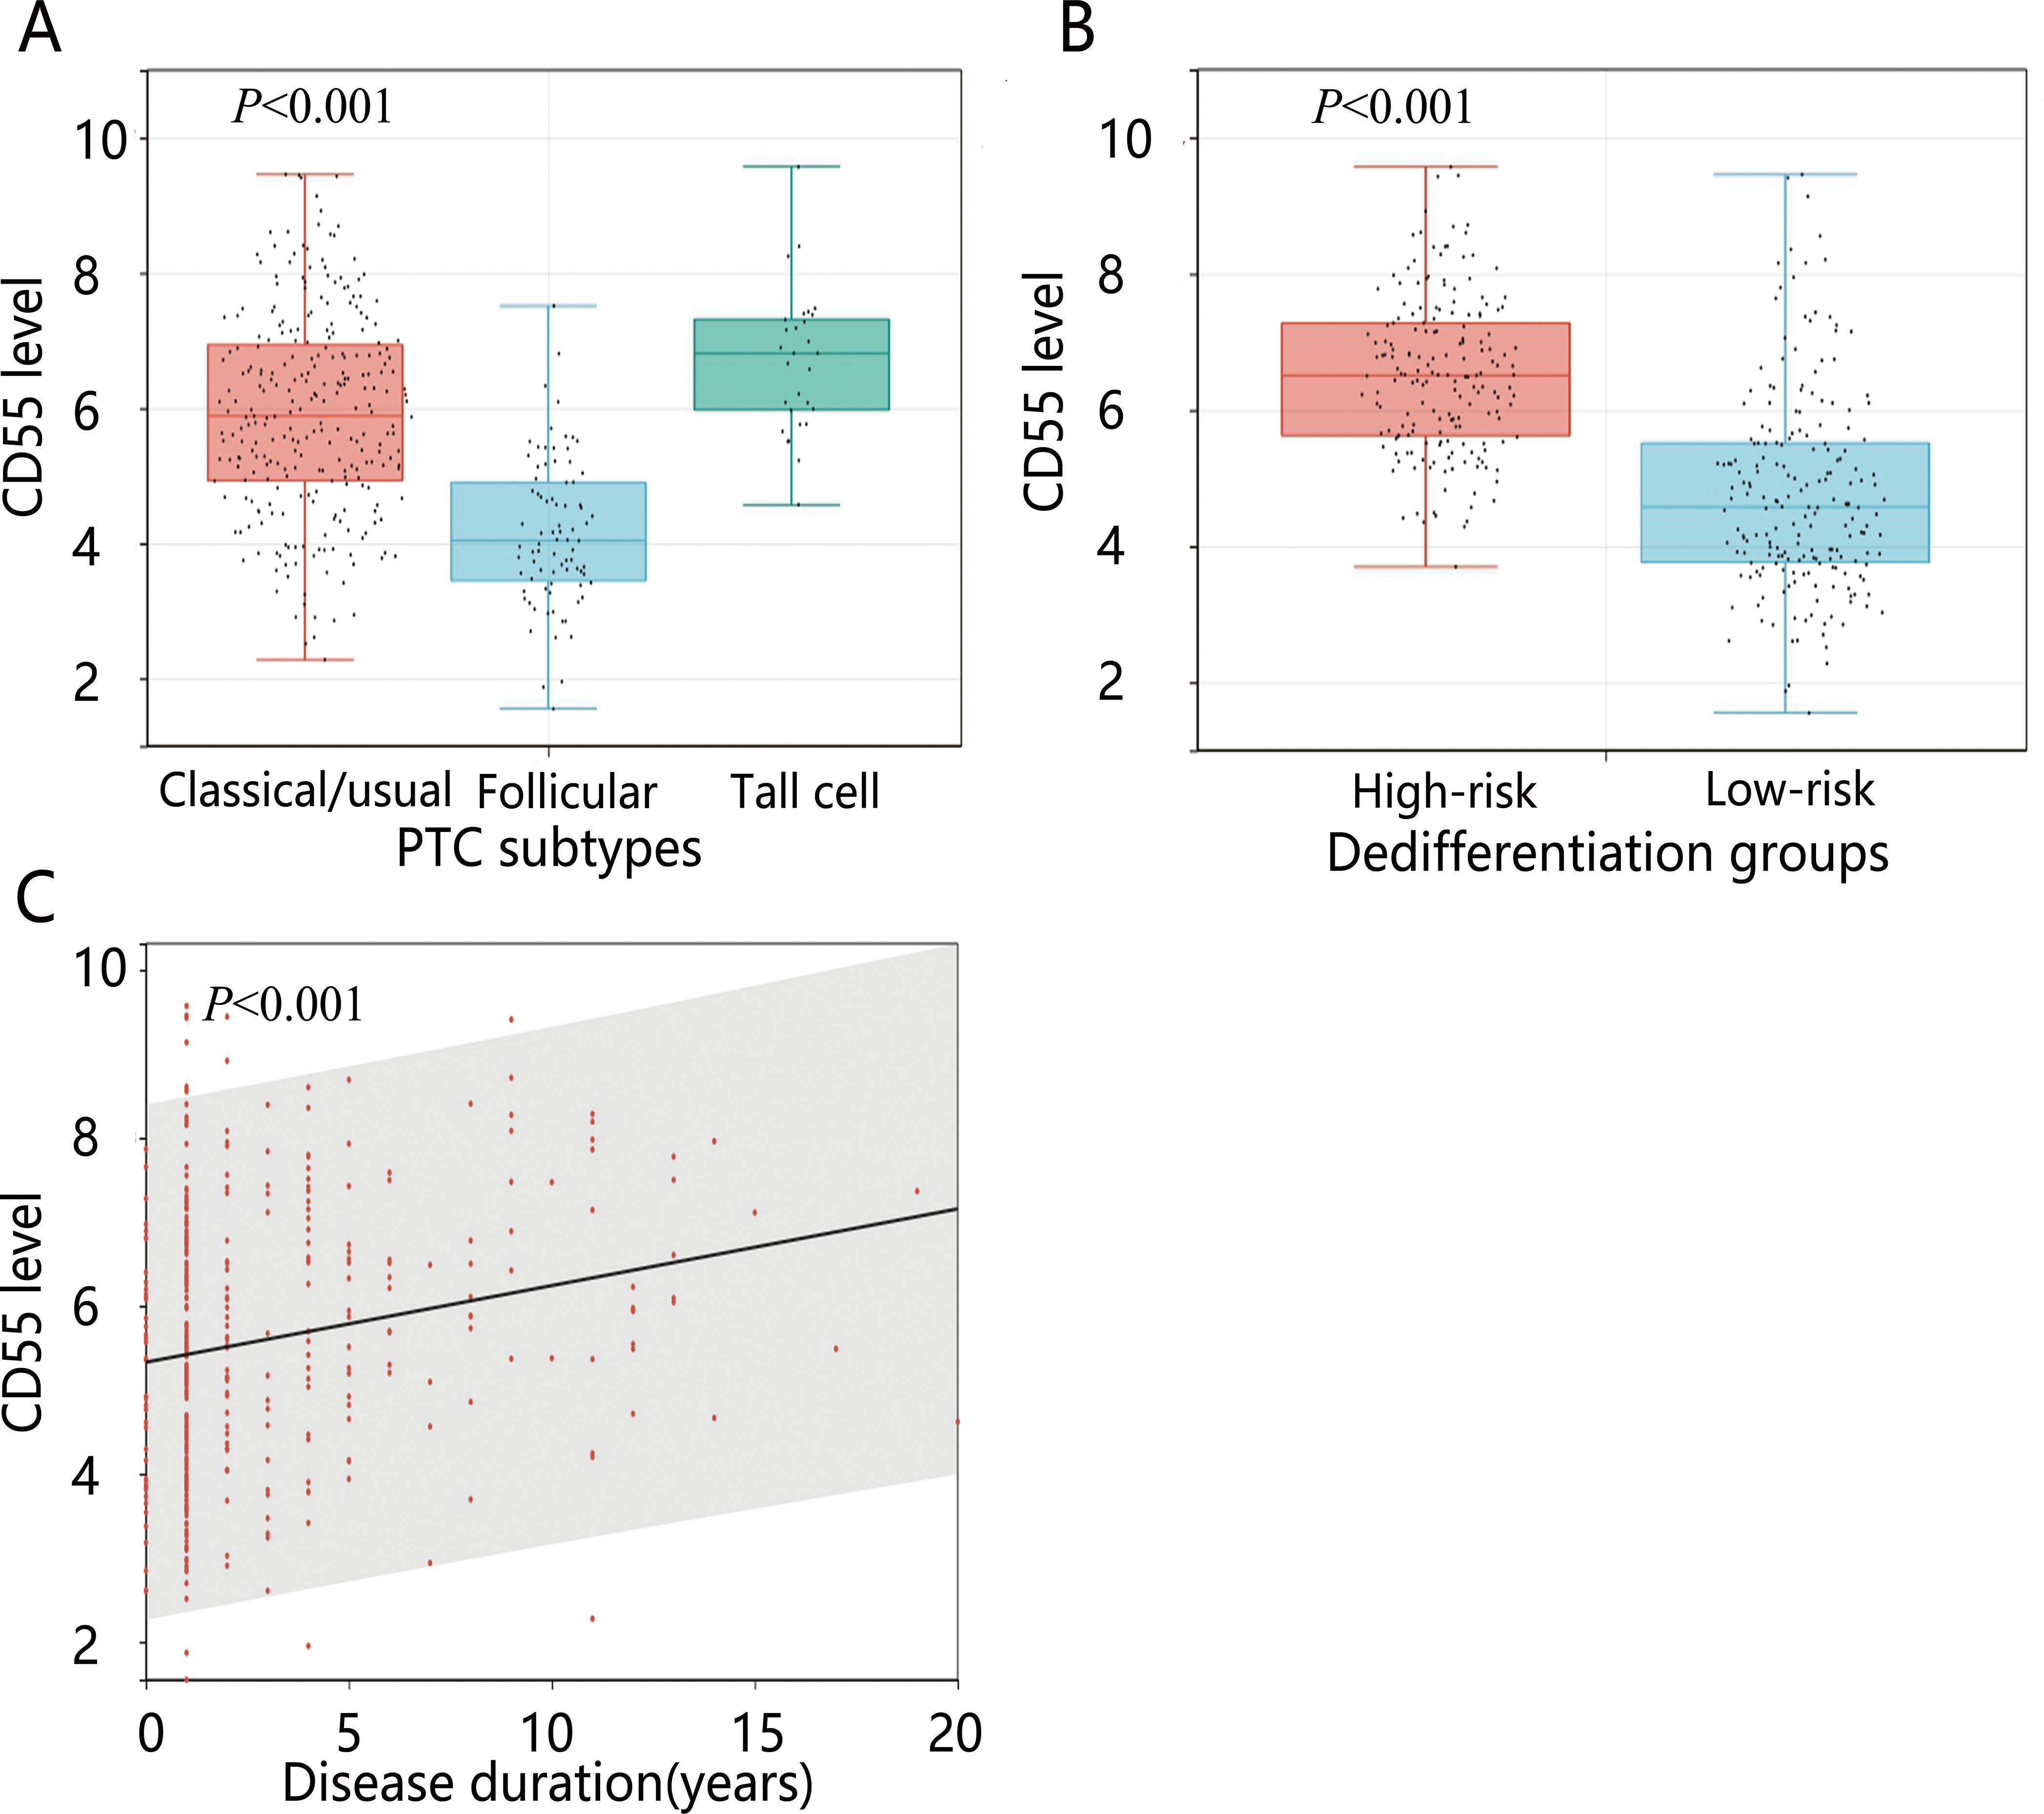
Figure 6. The expression levels of CD55 in different variables. (A) PTC subtypes; (B) Dedifferentiation; (C) Disease duration.
4 Discussion
Clinical treatment response and prognosis in PTC patients can be evaluated using dedifferentiation, TMB, and immune scores. Our research utilized high-throughput sequencing data from the TCGA database to calculate TDS, TMB, and immune scores for PTC tumor samples. The influences of the three tumor biomarkers on PFI in PTC patients were further examined. Multivariable Cox analysis revealed that only TDS was an influence factor of PFI, highlighting the crucial role of cellular differentiation levels in patient prognosis. Therefore, investigating the high-risk clinical features and molecular mechanisms of high-risk dedifferentiated populations could facilitate early detection, enabling appropriate therapeutic interventions and potentially improving patient outcomes.
Multivariable logistic regression analysis of high-risk dedifferentiation indicated that PTC subtypes and disease duration were significant risk factors for dedifferentiation. The nomogram model combining PTC subtypes and disease duration demonstrated good discriminative ability and can be clinically beneficial. PTC exhibits various variant subtypes (34). The American Thyroid Association classifies PTC subtypes such as tall cell, diffuse sclerosing, and hobnail as intermediate risk based on their aggressiveness, with TCPTC being the most common aggressive PTC subtype. These subtypes are less differentiated than classic PTC (35–37). Our results also revealed that TCPTC had the highest risk of dedifferentiation compared with classic/usual PTC and follicular variant PTC. In KEGG pathway analysis, we found that FN1 as a marker of epithelial-mesenchymal transition (EMT) was involved in PTC dedifferentiation. EMT plays a key role in PTC invasion and anaplastic transformation (38, 39). It has been suggested that as the disease progresses, some PTCs may undergo dedifferentiation, transforming into anaplastic thyroid cancer (ATC) and poorly differentiated thyroid cancer, accompanied by more aggressive pathological and clinical behaviors (8). A median disease duration transforming PTC into ATC has been reported as 6 years (40). Furthermore, in terms of molecular classification, PTC can be categorized into BRAF-like and RAS-like PTC (41). Different oncogenic drivers may cause PTC to exhibit different degrees of differentiation (or TDS) (42). TDS is a comprehensive indicator related to the expression and function of genes involved in iodine metabolism (43). Low TDS may cause patients to develop radioactive iodine resistance, leading to poor prognosis and high mortality (44).
Further, our study identified 17 genes associated with PTC dedifferentiation. Enrichment analysis of these DEGs revealed core pathways and hub genes, potentially offering new insights into dedifferentiation mechanisms. KEGG analysis demonstrated that the PLAUR gene was involved in the proteoglycans in cancer. Research has shown that the PLAUR gene plays a role in PTC differentiation and HER2-positive breast cancer metastasis (45, 46). Evidence suggests that the PLAUR gene activates the urokinase fibrinogen activator receptor (uPAR). uPAR promotes the activation of fibrinogen, which breaks down the peri-tumor stroma and basement membrane (e.g., fibronectin, proteoglycans), creating conditions for tumor invasion and metastasis (47).
Our analysis revealed that the most important pathways in the KEGG enrichment analysis were the complement and coagulation cascades. The complement system is crucial for eliminating foreign microorganisms and regulating both innate and adaptive immunity (48). Research has demonstrated that the coagulation and complement cascade pathway has multiple positive and negative effects on the incidence, progression, and prognosis of tumors, as well as influencing tumor microenvironment components (49–51). Activation of the complement pathway leads to the formation of membrane attack complexes that induce cellular activity under target cell lysis or shedding. Inappropriate complement activation or altered expression of complement regulatory proteins inhibits the elimination of tumor cells by immune cells, which is associated with a variety of tumors (52, 53) Coagulation begins after complement activation, subsequently triggering platelet activity (54). Activated platelets can influence immune cell function, leading to inflammation (55). The previous study has confirmed thrombocytosis accompanying inflammation-related colorectal cancer and highlighted the crucial role of interleukin-6 (IL-6) in this process (56). Research has shown that IL-6, activin-A, and granulocyte colony-stimulating factor (G-CSF) in the tumor microenvironment promote the dedifferentiation of hepatocellular carcinoma cells as well as thyroid cancer cells (57, 58). In the present study, CD55 was identified as a key gene in the coagulation and complement cascade pathway. Known as a complement decay accelerator, CD55 is involved in tumor dedifferentiation, proliferation, invasion, and migration and its upregulation may be associated with tumor progression (59–61). Previous studies have shown that the complement system is activated in PTC and regulated through CD46, CD55, and CD59 (62). CD55 protects thyroid cancer cells from complement-mediated attack and promotes carcinogenesis by allowing tumor cells to escape from cytolysis (63). The results of our analysis suggested that CD55 expression in patients was up-regulated with increasing disease duration (or in TCPTC), potentially activating complement and coagulation cascade pathway, thus promoting cancer cell dedifferentiation. Based on these results we propose the following clinical recommendations: first, CD55 can be used as a potential prognostic marker for identifying patients at high risk of dedifferentiation, and it is recommended that CD55 immunohistochemical evaluation can be added to postoperative pathology testing and follow-up monitoring should be intensified (e.g., by shortening the interval between follow-ups or by increasing the number of imaging studies) for patients at high risk. Second, more aggressive treatment strategies should be considered for patients with high CD55 expression, such as expanding the extent of surgery or consideration of adjuvant therapies targeting CD55-related pathways (e.g., complement signaling or EMT pathway). In addition, future studies should further validate the predictive value of CD55 and explore its molecular mechanisms to develop possible targeted interventions, such as immunotherapy combined with complement-modulating therapies. Ultimately, the clinical application of CD55 needs to be optimized through multicenter prospective studies to optimize detection criteria and integrate other molecular markers to improve the accuracy of risk stratification.
The innovation of this study is to combine clinical and genetic data to achieve individualized prognostic assessment of PTC patients, providing a more accurate tool for clinical practice and facilitating personalized treatment and management of PTC patients. Nevertheless, there are some limitations of this study: (1) No external validation was performed; (2) There were no clear boundaries for TDS subgroups. In this study, TDS was grouped by the optimal cut-off value, while some studies were grouped by median or 0 (43, 64). Therefore, future research should investigate optimal TDS grouping thresholds; (3) Data were only obtained from the TGCA database, which limited the extrapolation of results due to the influences of region and ethnicity.
5 Conclusion
In terms of clinical features, our findings revealed that disease duration and PTC subtypes were risk factors for high-risk dedifferentiation. At the molecular level, we identified 17 DEGs linked to high-risk dedifferentiation, potentially playing crucial roles in regulating PTC dedifferentiation. The complement coagulation cascade pathway may play a dominant role in PTC dedifferentiation, and the CD55 could be the critical gene for PTC dedifferentiation, but further studies are needed to validate the results of these findings.
Data availability statement
The raw data supporting the conclusions of this article will be made available by the authors, without undue reservation.
Ethics statement
Ethical approval was not required for the study involving humans in accordance with the local legislation and institutional requirements. Written informed consent to participate in this study was not required from the participants or the participants’ legal guardians/next of kin in accordance with the national legislation and the institutional requirements.
Author contributions
XL: Conceptualization, Data curation, Writing – original draft. QZ: Formal Analysis, Writing – original draft. ZH: Methodology, Writing – original draft. JS: Investigation, Writing – original draft. CX: Conceptualization, Data curation, Supervision, Writing – original draft.
Funding
The author(s) declare that no financial support was received for the research and/or publication of this article.
Conflict of interest
The authors declare that the research was conducted in the absence of any commercial or financial relationships that could be construed as a potential conflict of interest.
Generative AI statement
The author(s) declare that no Generative AI was used in the creation of this manuscript.
Publisher’s note
All claims expressed in this article are solely those of the authors and do not necessarily represent those of their affiliated organizations, or those of the publisher, the editors and the reviewers. Any product that may be evaluated in this article, or claim that may be made by its manufacturer, is not guaranteed or endorsed by the publisher.
Supplementary material
The Supplementary Material for this article can be found online at: https://www.frontiersin.org/articles/10.3389/fonc.2025.1535966/full#supplementary-material
References
1. Carling T and Udelsman R. Thyroid cancer. Annu Rev Med. (2014) 65:125–37. doi: 10.1146/annurev-med-061512-105739
2. Bray F, Laversanne M, Sung H, Ferlay J, Siegel RL, Soerjomataram I, et al. Global cancer statistics 2022: GLOBOCAN estimates of incidence and mortality worldwide for 36 cancers in 185 countries. CA Cancer J Clin. (2024) 74:229–63. doi: 10.3322/caac.21834
3. Laetitia G, Sven S, and Fabrice J. Combinatorial therapies in thyroid cancer: an overview of preclinical and clinical progresses. Cells. (2020) 9:830. doi: 10.3390/cells9040830
4. Xing M. Molecular pathogenesis and mechanisms of thyroid cancer. Nat Rev Cancer. (2013) 13:184–99. doi: 10.1038/nrc3431
5. Rindi G, Mete O, Uccella S, Basturk O, La Rosa S, Brosens LAA, et al. Overview of the 2022 WHO classification of neuroendocrine neoplasms. Endocr Pathol. (2022) 33:115–54. doi: 10.1007/s12022-022-09708-2
6. Axelsson TA, Hrafnkelsson J, Olafsdottir EJ, and Jonasson JG. Tall cell variant of papillary thyroid carcinoma: a population-based study in Iceland. Thyroid. (2015) 25:216–20. doi: 10.1089/thy.2014.0075
7. Ito Y, Miyauchi A, Kihara M, Fukushima M, Higashiyama T, and Miya A. Overall survival of papillary thyroid carcinoma patients: A single-institution long-term follow-up of 5897 patients. World J Surg. (2018) 42:615–22. doi: 10.1007/s00268-018-4479-z
8. Volante M, Lam AK, Papotti M, and Tallini G. Molecular pathology of poorly differentiated and anaplastic thyroid cancer: what do pathologists need to know? Endocr Pathol. (2021) 32:63–76. doi: 10.1007/s12022-021-09665-2
9. Fagin JA and Wells SA Jr. Biologic and clinical perspectives on thyroid cancer. N Engl J Med. (2016) 375:1054–67. doi: 10.1056/NEJMra1501993
10. Antonelli A, Fallahi P, Ferrari SM, Carpi A, Berti P, Materazzi G, et al. Dedifferentiated thyroid cancer: a therapeutic challenge. BioMed Pharmacother. (2008) 62:559–63. doi: 10.1016/j.biopha.2008.07.056
11. Papp S and Asa SL. When thyroid carcinoma goes bad: a morphological and molecular analysis. Head Neck Pathol. (2015) 9:16–23. doi: 10.1007/s12105-015-0619-z
12. Cancer Genome Atlas Research N. Integrated genomic characterization of papillary thyroid carcinoma. Cell. (2014) 159:676–90. doi: 10.1016/j.cell.2014.09.050
13. Ritterhouse LL. Tumor mutational burden. Cancer Cytopathol. (2019) 127:735–6. doi: 10.1002/cncy.22174
14. Chalmers ZR, Connelly CF, Fabrizio D, Gay L, Ali SM, Ennis R, et al. Analysis of 100,000 human cancer genomes reveals the landscape of tumor mutational burden. Genome Med. (2017) 9:34. doi: 10.1186/s13073-017-0424-2
15. Hellmann MD, Ciuleanu TE, Pluzanski A, Lee JS, Otterson GA, Audigier-Valette C, et al. Nivolumab plus ipilimumab in lung cancer with a high tumor mutational burden. N Engl J Med. (2018) 378:2093–104. doi: 10.1056/NEJMoa1801946
16. Samstein RM, Lee CH, Shoushtari AN, Hellmann MD, Shen R, Janjigian YY, et al. Tumor mutational load predicts survival after immunotherapy across multiple cancer types. Nat Genet. (2019) 51:202–6. doi: 10.1038/s41588-018-0312-8
17. Nieto P, Elosua-Bayes M, Trincado JL, Marchese D, Massoni-Badosa R, Salvany M, et al. A single-cell tumor immune atlas for precision oncology. Genome Res. (2021) 31:1913–26. doi: 10.1101/gr.273300.120
18. Ferrari SM, Fallahi P, Galdiero MR, Ruffilli I, Elia G, Ragusa F, et al. Immune and inflammatory cells in thyroid cancer microenvironment. Int J Mol Sci. (2019) 20:4413. doi: 10.3390/ijms20184413
19. Newman AM, Liu CL, Green MR, Gentles AJ, Feng W, Xu Y, et al. Robust enumeration of cell subsets from tissue expression profiles. Nat Methods. (2015) 12:453–7. doi: 10.1038/nmeth.3337
20. Li T, Fan J, Wang B, Traugh N, Chen Q, Liu JS, et al. TIMER: A web server for comprehensive analysis of tumor-infiltrating immune cells. Cancer Res. (2017) 77:e108–e10. doi: 10.1158/0008-5472.CAN-17-0307
21. Miao YR, Zhang Q, Lei Q, Luo M, Xie GY, Wang H, et al. ImmuCellAI: A unique method for comprehensive T-cell subsets abundance prediction and its application in cancer immunotherapy. Adv Sci (Weinh). (2020) 7:1902880. doi: 10.1002/advs.201902880
22. Na KJ and Choi H. Immune landscape of papillary thyroid cancer and immunotherapeutic implications. Endocr Relat Cancer. (2018) 25:523–31. doi: 10.1530/ERC-17-0532
23. Caillou B, Talbot M, Weyemi U, Pioche-Durieu C, Al Ghuzlan A, Bidart JM, et al. Tumor-associated macrophages (TAMs) form an interconnected cellular supportive network in anaplastic thyroid carcinoma. PloS One. (2011) 6:e22567. doi: 10.1371/journal.pone.0022567
24. Melillo RM, Guarino V, Avilla E, Galdiero MR, Liotti F, Prevete N, et al. Mast cells have a protumorigenic role in human thyroid cancer. Oncogene. (2010) 29:6203–15. doi: 10.1038/onc.2010.348
25. He W, Sun Y, Ge J, Wang X, Lin B, Yu S, et al. STRA6 regulates tumor immune microenvironment and is a prognostic marker in BRAF-mutant papillary thyroid carcinoma. Front Endocrinol (Lausanne). (2023) 14:1076640. doi: 10.3389/fendo.2023.1076640
26. Su Y, Xu B, Li J, Shen Q, Lei Z, Ma M, et al. Identification of m6A-associated LncRNAs as predict factors for the immune infiltration and prognosis of thyroid cancer. Ann Med. (2023) 55:1298–316. doi: 10.1080/07853890.2023.2192049
27. Wang L, Yao B, Yang J, Tian Z, and He J. Construction of a novel cuproptosis-related gene signature for predicting prognosis and estimating tumor immune microenvironment status in papillary thyroid carcinoma. BMC Cancer. (2022) 22:1131. doi: 10.1186/s12885-022-10175-5
28. Yoshihara K, Shahmoradgoli M, Martinez E, Vegesna R, Kim H, Torres-Garcia W, et al. Inferring tumour purity and stromal and immune cell admixture from expression data. Nat Commun. (2013) 4:2612. doi: 10.1038/ncomms3612
29. Liu Y, Wang X, Sun X, Li H, and Wang L. Nomogram for predicting the risk of cervical lymph node metastases and recurrence in papillary thyroid carcinoma based on the thyroid differentiation score system and clinical characteristics. BMC Endocr Disord. (2025) 25:39. doi: 10.1186/s12902-025-01867-7
30. Zhang QY, Wang Y, Zhang Q, Huo DW, Li Y, Gao D, et al. Construction of thyroid cancer classification and iodine metabolism related diagnostic model using thyroid differentiation score and bioinformation. Med (Baltimore). (2024) 103:e39464. doi: 10.1097/MD.0000000000039464
31. Wang Y, He Y, Cao L, Peng X, Gu Z, and Yan J. Exploring the correlation analysis of immune microenvironment, mutation burden and prognosis of papillary thyroid carcinoma based on Estimate algorithm. Gland Surg. (2022) 11:860–7. doi: 10.21037/gs-22-211
32. Lin B, Wang K, Yuan Y, Wang Y, Liu Q, Wang Y, et al. A novel approach to the analysis of Overall Survival (OS) as response with Progression-Free Interval (PFI) as condition based on the RNA-seq expression data in The Cancer Genome Atlas (TCGA). BMC Bioinf. (2024) 25:300. doi: 10.1186/s12859-024-05897-1
33. Bhalla S, Kaur H, Kaur R, Sharma S, and Raghava GPS. Expression based biomarkers and models to classify early and late-stage samples of Papillary Thyroid Carcinoma. PloS One. (2020) 15:e0231629. doi: 10.1371/journal.pone.0231629
34. Sak SD. Variants of Papillary Thyroid Carcinoma: Multiple Faces of a Familiar Tumor. Turk Patoloji Derg. (2015) 31(Suppl 1):34–47. doi: 10.5146/tjpath.2015.01313
35. Haugen BR, Alexander EK, Bible KC, Doherty GM, Mandel SJ, Nikiforov YE, et al. 2015 American thyroid association management guidelines for adult patients with thyroid nodules and differentiated thyroid cancer: the american thyroid association guidelines task force on thyroid nodules and differentiated thyroid cancer. Thyroid. (2016) 26:1–133. doi: 10.1089/thy.2015.0020
36. Ghossein R and Livolsi VA. Papillary thyroid carcinoma tall cell variant. Thyroid. (2008) 18:1179–81. doi: 10.1089/thy.2008.0164
37. Haddad RI, Nasr C, Bischoff L, Busaidy NL, Byrd D, Callender G, et al. NCCN guidelines insights: thyroid carcinoma, version 2.2018. J Natl Compr Canc Netw. (2018) 16:1429–40. doi: 10.6004/jnccn.2018.0089
38. Liao Y, Hua Y, Li Y, Zhang C, Yu W, Guo P, et al. CRSP8 promotes thyroid cancer progression by antagonizing IKKalpha-induced cell differentiation. Cell Death Differ. (2021) 28:1347–63. doi: 10.1038/s41418-020-00656-0
39. Zhou Q, Chen J, Feng J, Xu Y, Zheng W, and Wang J. SOSTDC1 inhibits follicular thyroid cancer cell proliferation, migration, and EMT via suppressing PI3K/Akt and MAPK/Erk signaling pathways. Mol Cell Biochem. (2017) 435:87–95. doi: 10.1007/s11010-017-3059-0
40. Yau T, Lo CY, Epstein RJ, Lam AK, Wan KY, and Lang BH. Treatment outcomes in anaplastic thyroid carcinoma: survival improvement in young patients with localized disease treated by combination of surgery and radiotherapy. Ann Surg Oncol. (2008) 15:2500–5. doi: 10.1245/s10434-008-0005-0
41. Baloch ZW, Asa SL, Barletta JA, Ghossein RA, Juhlin CC, Jung CK, et al. Overview of the 2022 WHO classification of thyroid neoplasms. Endocr Pathol. (2022) 33:27–63. doi: 10.1007/s12022-022-09707-3
42. Landa I, Ibrahimpasic T, Boucai L, Sinha R, Knauf JA, Shah RH, et al. Genomic and transcriptomic hallmarks of poorly differentiated and anaplastic thyroid cancers. J Clin Invest. (2016) 126:1052–66. doi: 10.1172/JCI85271
43. Boucai L, Seshan V, Williams M, Knauf JA, Saqcena M, Ghossein RA, et al. Characterization of subtypes of BRAF-mutant papillary thyroid cancer defined by their thyroid differentiation score. J Clin Endocrinol Metab. (2022) 107:1030–9. doi: 10.1210/clinem/dgab851
44. Syed AR, Gorana A, Nohr E, Yuan XK, Amin MP, Ghaznavi S, et al. Predictors of radioiodine (RAI)-avidity restoration for NTRK fusion-positive RAI-resistant metastatic thyroid cancers. Eur Thyroid J. (2024) 13:e230227. doi: 10.1530/ETJ-23-0227
45. Li CW, Shi X, Ma B, Wang YL, Lu ZW, Liao T, et al. A 4 gene-based immune signature predicts dedifferentiation and immune exhaustion in thyroid cancer. J Clin Endocrinol Metab. (2021) 106:e3208–e20. doi: 10.1210/clinem/dgab132
46. Indira Chandran V, Eppenberger-Castori S, Venkatesh T, Vine KL, and Ranson M. HER2 and uPAR cooperativity contribute to metastatic phenotype of HER2-positive breast cancer. Oncoscience. (2015) 2:207–24. doi: 10.18632/oncoscience.146
47. Schmitt M, Janicke F, Moniwa N, Chucholowski N, Pache L, and Graeff H. Tumor-associated urokinase-type plasminogen activator: biological and clinical significance. Biol Chem Hoppe Seyler. (1992) 373:611–22. doi: 10.1515/bchm3.1992.373.2.611
48. Defendi F, Thielens NM, Clavarino G, Cesbron JY, and Dumestre-Perard C. The immunopathology of complement proteins and innate immunity in autoimmune disease. Clin Rev Allergy Immunol. (2020) 58:229–51. doi: 10.1007/s12016-019-08774-5
49. Gong Z, He Y, Mi X, Li C, Sun X, Wang G, et al. Complement and coagulation cascades pathway-related signature as a predictor of immunotherapy in metastatic urothelial cancer. Aging (Albany NY). (2023) 15:9479–98. doi: 10.18632/aging.205022
50. Su H, Chen Y, and Wang W. Novel prognostic model of complement and coagulation cascade-related genes correlates with immune environment and drug sensitivity in hepatocellular carcinoma. Heliyon. (2024) 10:e38230. doi: 10.1016/j.heliyon.2024.e38230
51. Liu Y, Xiong S, Liu S, Chen J, Yang H, Liu G, et al. Analysis of gene expression in bladder cancer: possible involvement of mitosis and complement and coagulation cascades signaling pathway. J Comput Biol. (2020) 27:987–98. doi: 10.1089/cmb.2019.0237
52. Revel M, Daugan MV, Sautes-Fridman C, Fridman WH, and Roumenina LT. Complement system: promoter or suppressor of cancer progression? Antibodies (Basel). (2020) 9:57. doi: 10.3390/antib9040057
53. Noris M and Remuzzi G. Overview of complement activation and regulation. Semin Nephrol. (2013) 33:479–92. doi: 10.1016/j.semnephrol.2013.08.001
54. Heemskerk JW, Bevers EM, and Lindhout T. Platelet activation and blood coagulation. Thromb Haemost. (2002) 88:186–93. doi: 10.1055/s-0037-1613209
55. Schlesinger M. Role of platelets and platelet receptors in cancer metastasis. J Hematol Oncol. (2018) 11:125. doi: 10.1186/s13045-018-0669-2
56. Josa V, Ferenczi S, Szalai R, Fuder E, Kuti D, Horvath K, et al. Thrombocytosis and effects of IL-6 knock-out in a colitis-associated cancer model. Int J Mol Sci. (2020) 21:6218. doi: 10.3390/ijms21176218
57. Rodrigues CFD, Serrano E, Patricio MI, Val MM, Albuquerque P, Fonseca J, et al. Stroma-derived IL-6, G-CSF and Activin-A mediated dedifferentiation of lung carcinoma cells into cancer stem cells. Sci Rep. (2018) 8:11573. doi: 10.1038/s41598-018-29947-w
58. Zhang L, Xu S, Cheng X, Wu J, Wang Y, Gao W, et al. Inflammatory tumor microenvironment of thyroid cancer promotes cellular dedifferentiation and silencing of iodide-handling genes expression. Pathol Res Pract. (2023) 246:154495. doi: 10.1016/j.prp.2023.154495
59. Yin X, Shen C, Yin Y, Cai Z, Wang J, Zhao Z, et al. Overexpression of CD55 correlates with tumor progression and poor prognosis in gastric stromal tumors. Onco Targets Ther. (2019) 12:4703–12. doi: 10.2147/OTT.S195182
60. Chan CKF, Gulati GS, Sinha R, Tompkins JV, Lopez M, Carter AC, et al. Identification of the human skeletal stem cell. Cell. (2018) 175:43–56 e21. doi: 10.1016/j.cell.2018.07.029
61. Dho SH, Cho EH, Lee JY, Lee SY, Jung SH, Kim LK, et al. A novel therapeutic anti−CD55 monoclonal antibody inhibits the proliferation and metastasis of colorectal cancer cells. Oncol Rep. (2019) 42:2686–93. doi: 10.3892/or.2019.7337
62. Yamakawa M, Yamada K, Tsuge T, Ohrui H, Ogata T, Dobashi M, et al. Protection of thyroid cancer cells by complement-regulatory factors. Cancer. (1994) 73:2808–17. doi: 10.1002/1097-0142(19940601)73:11<2808::aid-cncr2820731125>3.0.co;2-p
63. Lucas SD, Karlsson-Parra A, Nilsson B, Grimelius L, Akerstrom G, Rastad J, et al. Tumor-specific deposition of immunoglobulin G and complement in papillary thyroid carcinoma. Hum Pathol. (1996) 27:1329–35. doi: 10.1016/s0046-8177(96)90346-9
Keywords: thyroid differentiation score, papillary thyroid carcinoma, dedifferentiation, differentially expressed genes, CD55
Citation: Liu X, Zhu Q-l, He Z-y, Shu J-d and Xiang C (2025) Identification of risk factors for high-risk dedifferentiation in papillary thyroid carcinoma and construction of discriminative model. Front. Oncol. 15:1535966. doi: 10.3389/fonc.2025.1535966
Received: 28 November 2024; Accepted: 20 May 2025;
Published: 04 June 2025.
Edited by:
Cesar Seigi Fuziwara, University of São Paulo, BrazilReviewed by:
Vladimir A. Saenko, Nagasaki University, JapanFernando Di Fermo, Sanatorio Otamendi, Argentina
Fernando Carrizo, Instituto de Oncología Ángel H. Roffo, Argentina
Copyright © 2025 Liu, Zhu, He, Shu and Xiang. This is an open-access article distributed under the terms of the Creative Commons Attribution License (CC BY). The use, distribution or reproduction in other forums is permitted, provided the original author(s) and the copyright owner(s) are credited and that the original publication in this journal is cited, in accordance with accepted academic practice. No use, distribution or reproduction is permitted which does not comply with these terms.
*Correspondence: Cheng Xiang, Y2hlbmd4aWFuZ0B6anUuZWR1LmNu