 Bushra Alnwisser1
 Salman Alshehri1,2
 Amal Qattan1
 Minjing Zou1
 Abdelilah Aboussekhra1
 Ali S. Alzahrani1,3
 Yufei Shi1*
- 1Department of Molecular Oncology, King Faisal Specialist Hospital and Research Centre, Riyadh, Saudi Arabia
- 2King Abdulaziz and His Companions Foundation for Giftedness and Creativity, Riyadh, Saudi Arabia
- 3Department of Medicine, King Faisal Specialist Hospital and Research Centre, Riyadh, Saudi Arabia
Introduction: Distant metastasis (DM) is the most important prognostic factor affecting the overall survival (OS) of thyroid cancer. The current study aimed to discover prognostic biomarkers to predict thyroid cancer survival, particularly papillary thyroid carcinoma (PTC), the most common subtype of thyroid cancer.
Methods: Four RNA sequencing (RNA-Seq) datasets of experimental lung metastasis from four transgenic mouse models of PTC, follicular thyroid cancer (FTC), poorly differentiated thyroid cancer (PDTC), and anaplastic thyroid cancer (ATC) were integrated to screen for candidate genes involved in DM. The Cancer Genome Atlas-Thyroid Cancer (TCGA-THCA) dataset was used to validate the candidate genes.
Results: A total of 105 upregulated and 25 downregulated differentially expressed genes (DEGs) were identified to be present in all four datasets. Regulation of cytokine production, inflammation, immune checkpoint regulation, and MAPK/ERK cascade were major enriched pathways in metastatic tumor cells. Seven genes were identified whose overexpression was present in 63 of 498 PTC patients (13%) and was associated with poor OS (p < 0.01). Clinically, the seven-gene expression signature was associated with older age at the diagnosis, late stage of tumor, tall cell variant, and higher aneuploidy and hypoxia score. Mutation load was increased in patients with seven-gene expression signature: 26 samples had more than one driver mutation (47%, 26/55). Deep deletions in other chromosomal loci were frequently found in patients with BRAFV600E mutations. In contrast, only 7% of patients without a seven-gene expression signature had more than one driver mutation (24/243). Increased chromosomal instability was also observed in patients with a seven gene expression signature.
Conclusion: The seven-gene expression signature is associated with poor prognosis and chromosomal instability. These genes may be useful biomarkers for risk stratification for DM and help decision-making in initial surgical recommendations.
Introduction
Thyroid cancer is the most common malignancy in the endocrine system and is commonly classified into papillary thyroid carcinoma (PTC), follicular thyroid cancer (FTC), poorly differentiated thyroid cancer (PDTC), and anaplastic thyroid cancer (ATC) based on the histological type. PTC is the most predominant type of thyroid cancer, accounting for more than 85% of the cases followed by FTC (5%–10%), PDTC (4%–7%), and ATC (approximately 2%) (1, 2). PTC and FTC have excellent prognoses with a 10-year survival of up to 90%; PDTC has poorer prognosis with a 5-year survival at 66%; ATC is highly virulent with a mean survival of less than 8 months (2–4).
The main drivers in thyroid cancer pathogenesis are single-point mutations and gene fusions in components of MAPK and PI3K/Akt pathways such as point mutations of BRAF, RAS, PIK3CA, and AKT1 or gene fusions of BRAF, RET, ALK, and NTRK. Other important genetic alterations in the more advanced types of thyroid cancer include mutations in the TERT promoter, EIF1AX, MED12, RBM10, CTNNB1, and TP53 (5, 6). The BRAFV600E mutation is the most frequent genetic alteration in PTC with an overall rate of 60% (7).
Metastasis is the leading cause of thyroid cancer mortality and morbidity (8, 9). Distant metastasis (DM) occurs in approximately 10% of PTC and up to 25% of FTC patients. The lungs (~80%) and bones (~25%) are the most common sites for distant metastasis with overall survival (OS) of approximately 10 months in patients with metastases to the lung and 23 months in patients with metastases to the bone (10–13). Early identification and proper treatment of these patients would improve their OS. Recently, molecular testing has been used for risk stratification for DM in patients with differentiated thyroid cancer (PTC and FTC) (14). The study found that most patients with DM had late‐hit mutations in TERT, TP53, or PIK3CA. Gene expression signature for risk stratification has not been investigated in patients with PTC. There may be other molecular markers yet to be discovered for risk stratification for DM in patients without TERT, TP53, or PIK3CA mutations.
In the present study, we characterized the gene expression profile associated with thyroid cancer metastasis using cell lines derived from genetically engineered mouse models of PTC, FTC, PDTC, and ATC. We identified seven genes whose overexpression was associated with poor OS.
Materials and methods
Experimental animals
Athymic BALB/c-nu/nu (nude mice) were acquired from Jackson Laboratory. Mice were provided with autoclaved food and water ad libitum. The study was approved by the Animal Care and Use Committee of the institution and was conducted in compliance with the Public Health Service Guidelines for the Care and Use of Animals in Research.
Thyroid cancer cell lines
Four murine thyroid cancer cell lines derived from genetically engineered mouse models of PTC, FTC, PDTC, and ATC were established from primary tumors: PTC with BrafV600E mutation (PTC), FTC with KrasG12D mutation (FTC), PDTC with both KrasG12D and Cdkn2anull mutations (PDTC), and ATC with both BrafV600E and Trp53null mutations (ATC). The establishment of PTC, FTC, and ATC strains was described previously (15–18). PDTC strain was established by cross-breeding among KrasG12D, TPO-Cre, and Cdkn2anull (strain 01XE4 obtained from The NCI Mouse Repository, https://frederick.cancer.gov/Resources/Repositories/nci-mouse-repository/MouseModels/AvailableStrains#/StrainDetails/79). PDTC was developed from a 13-month-old mouse with both KrasG12D and Cdkn2anull mutations. The PDTC cell line was established from the tumor. Thyroid origin was confirmed by genotyping. The cell lines were maintained in DMEM/F12 growth medium containing 10% fetal bovine serum, 100 units/mL penicillin, and 100 μg/mL streptomycin.
Metastatic thyroid cancer cell lines
To establish pulmonary metastatic thyroid cancer cell lines, 1 × 10⁶ PTC, FTC, PDTC, or ATC cells were injected into the tail vein of five nude mice for each group. Six weeks after injection, pulmonary metastatic tumors were collected aseptically from the mice using blunt dissection, then mechanically dissociated by mincing and passing through a 40-μM mesh sterile screen, and suspended in DMEM/F12 growth medium for 3 months with a total of six passages to eliminate contaminated stromal fibroblasts, lymphocytes, and microphages present in the tumor cell culture. The primary cells were considered permanent cell lines after six passages. The established metastatic cell lines were named PTC-Met1, FTC-Met1, PDTC-Met1, and ATC-Met1. They were re-injected (1 × 10⁶ cells) to a new group of nude mice (n = 5 for each group) via tail vein for enrichment of cells with high metastatic potential. Three weeks following injection, lung metastatic tumors were harvested and propagated in DMEM/Ham’s F12 growth medium for 3 months with at least six passages. The metastatic cell lines were named PTC-Met2, FTC-Met2, PDTC-Met2, and ATC-Met2. The experimental procedures are summarized in Figure 1.
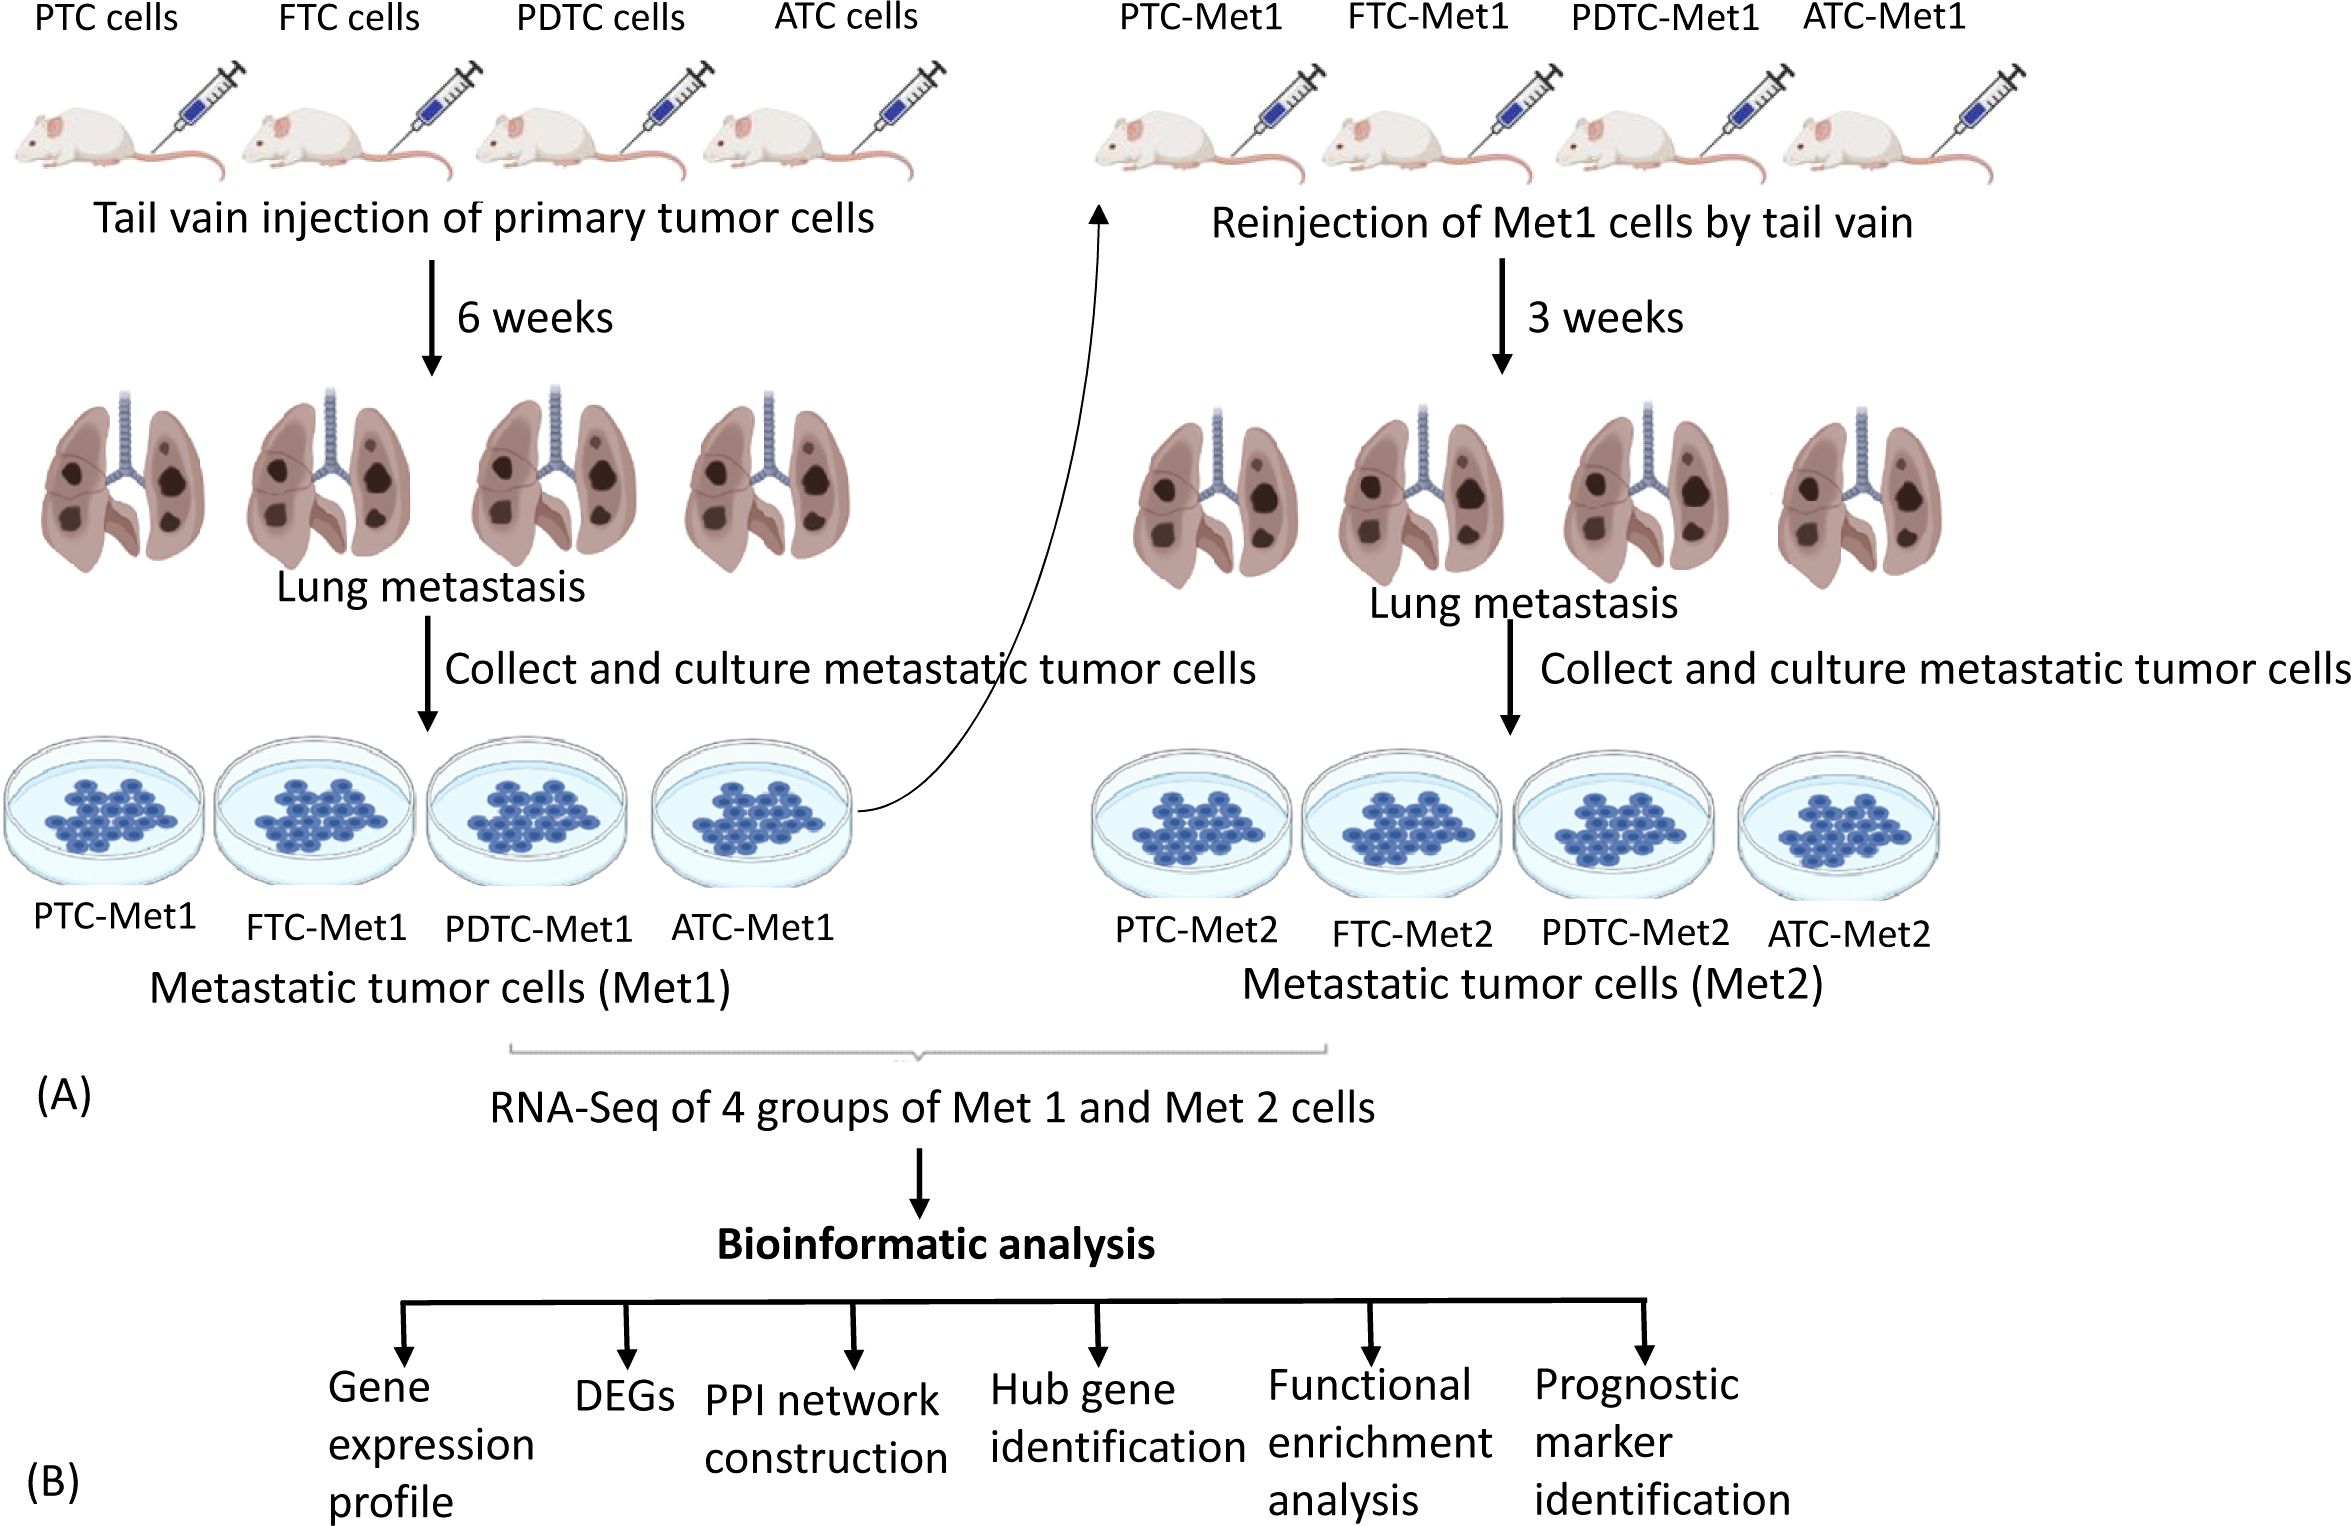
Figure 1. Experimental lung metastasis. (A) Schematic diagram summarizing experimental lung metastasis procedure. PTC-Prim, FTC-Prim, PDTC-Prim, or ATC-Prim cells (1 × 10⁶ cells) were injected into the tail vein of five nude mice for each group. Six weeks after injection, lung metastatic tumors were collected to establish Met1 cell lines. The established Met1 cells (PTC-Met1, FTC-Met1, PDTC-Met1, or ATC-Met1) were re-injected (1 × 10⁶ cells) to a new group of nude mice (n = 5 for each group) via tail vein for enrichment of cells with high metastatic potential. Lung metastatic tumors were harvested 3 weeks following injection to establish Met2 cell lines (PTC-Met2, FTC-Met2, PDTC-Met2, or ATC-Met2). Primary, Met1, and Met2 tumor cells were subject to RNA sequencing to identify differentially expressed genes (DEGs). (B) Flowchart showing the workflow for the integrated bioinformatic analysis DEGs. PTC, papillary thyroid carcinoma; FTC, follicular thyroid cancer; PDTC, poorly differentiated thyroid cancer; ATC, anaplastic thyroid cancer.
RNA sequencing analysis
RNA sequencing (RNA-Seq) was used for quantification of differentially expressed genes (DEGs) between primary (PTC, FTC, PDTC, or ATC) and metastatic thyroid cancer cell lines: PTC-Met1, FTC-Met1, PDTC-Met1, and ATC-Met1, or PTC-Met2, FTC-Met2, PDTC-Met2, and ATC-Met2 cell lines. Total RNA from cell lines was isolated, and libraries were constructed using an Illumina (San Diego, CA, USA) TruSeq RNA Library Prep kit according to the manufacturer’s procedure. Sequencing was performed on Illumina HiSeq 4000 with at least 20 million clean reads. The significant DEGs were selected based on the following criteria: Log2 fold change >2, false discovery rate (FDR) <0.001, and p-value from difference test <0.01. Gene list annotation and enrichment of biological pathways were performed using Metascape (https://metascape.org/gp/index.html#/main/step1).
The protein–protein interaction network construction and hub gene identification
The common DEGs were analyzed using the Search Tool for the Retrieval of Interacting Genes (STRING; ver.12.0, https://string-db.org/) database for the construction of a protein–protein interaction (PPI) network with a confidence score of ≥0.4. The PPI network was then analyzed and visualized using Cytoscape software (ver.3.10.2, https://cytoscape.org). For the hub gene identification, CytoHubba, a plug-in of Cytoscape, was used. Genes with the degree of a node >10 (with more than 10 interacting genes) were considered hub genes.
Identification of genes associated with poor prognosis
The association of metastasis-related genes with OS was performed by the Kaplan–Meier analysis using TCGA-THCA mRNA expression dataset (n = 498) and cBioPortal For Cancer Genomics (https://www.cbioportal.org/).
Statistical analysis
Prism was used in statistical analysis. Chi-squared test was used when the data were not normally distributed, and the t-test was used when the data were normally distributed. p-Value <0.05 was considered significant. Time-to-event endpoints were visualized using the Kaplan–Meier curves, and differences in OS were compared using Cox’s proportional hazards model.
Results
Identification of common DEGs
Significant DEGs were identified from RNA-Seq results. A total of 4,269 DEGs were found in the PTC (PTC vs. PTC-Met2), 4,219 DEGs in FTC (FTC vs. FTC-Met2), 1,897 in PDTC (PDTC vs. PDTC-Met2), and 3,301 in ATC (ATC vs. ATC-Met2) datasets (Figure 2A). A total of 130 common DEGs were found after the integration of four datasets, including 105 upregulated and 25 downregulated genes (Log2 fold change >2) present in all four Met2 cell lines (Figure 2B; Supplementary Table 1). The expression levels of most DEGs were increased in Met2 as compared to Met1 cells. Many DEGs not detected in Met1 cells also appeared in Met2 cells (Supplementary Table 1). These data indicate the enrichment of DEGs in Met2 cells and suggest that these DEGs may be involved in DM. For example, “don’t eat me” signal expression was either no change or mildly increased in Met1 cells but significantly increased in Met2 cells such as Cd274 (PD-L1), Cd52, and Tbxas1 (Table 1), indicating that these genes may play a significant role in immune evasion of metastatic cancer cells. Strictly speaking, Tbxas1 is not a “don’t eat me’ signal”, but it indirectly helps cancer cells evade immune elimination via platelet activation and aggregation (19). Met2 cells also took 3 weeks less than Met1 cells (3 vs. 6 weeks) to form lung metastasis, indicating enrichment of tumor cells with high metastatic potential.
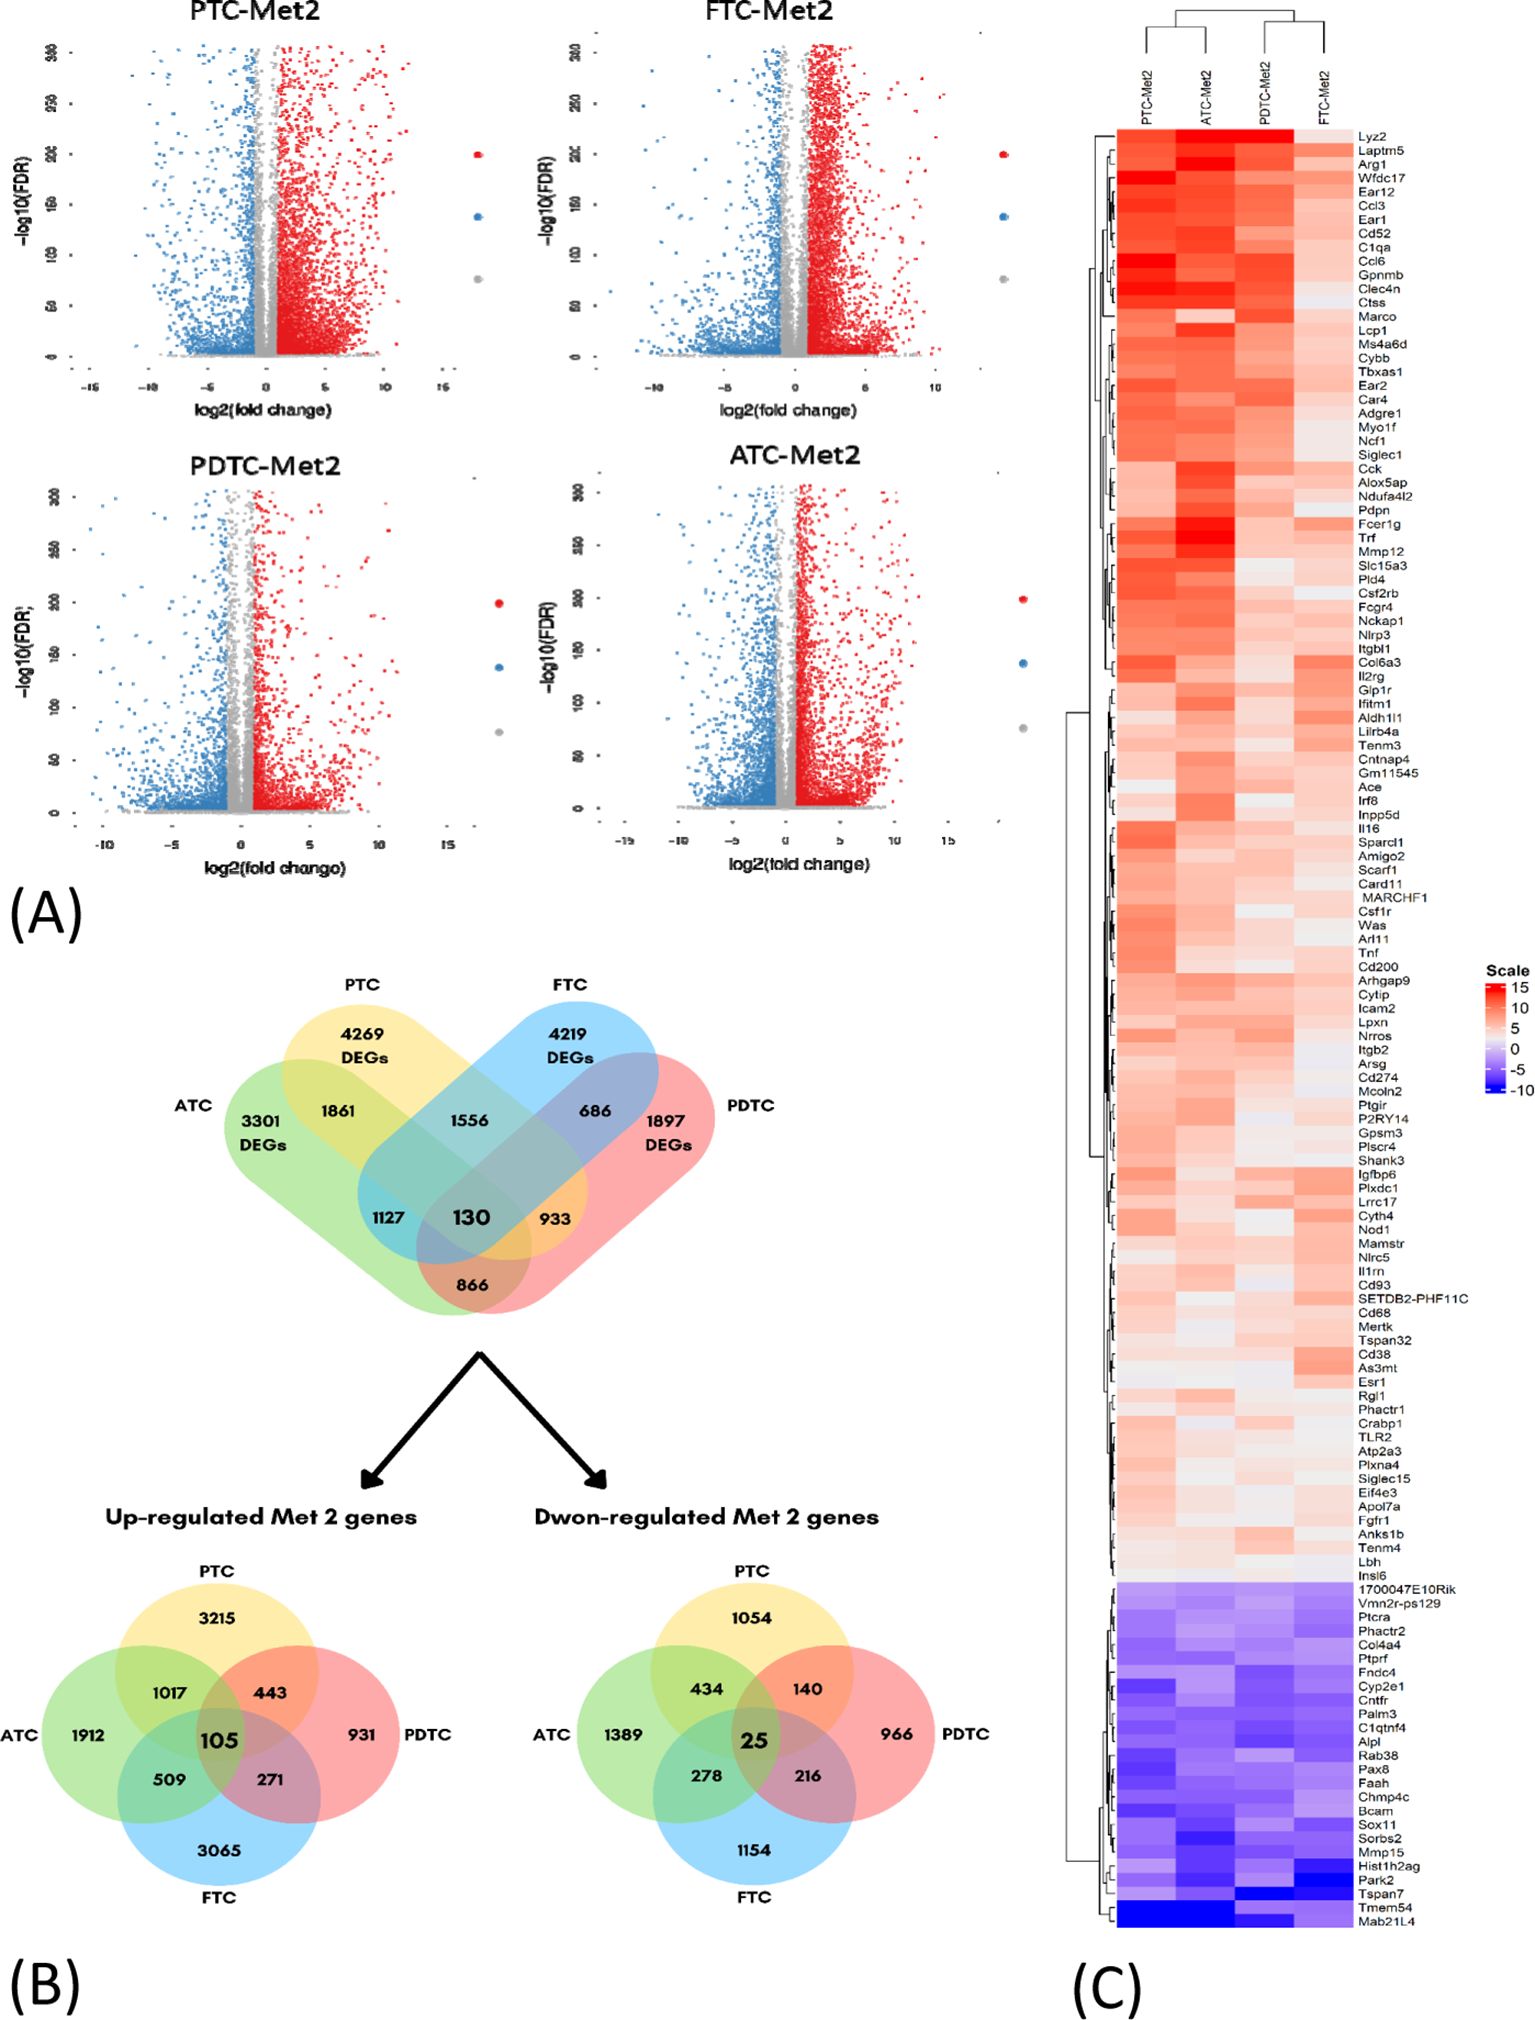
Figure 2. Identification of differentially expressed genes (DEGs) in four datasets of thyroid cancer cell lines. (A) Volcano plots of DEGs in the four indicated datasets (PTC-Met2, FTC-Met2, PDTC-Met2, and ATC-Met2). Genes with false discovery rate (FDR) < 0.05 and FC > 1.0 or < −1.0 are considered DEGs for each dataset. Red, upregulated genes; blue, downregulated genes; gray, no DEGs. (B) The Venn diagram of DEGs showing the intersection of PTC-Met2, FTC-Met2, PDTC-Met2, and ATC-Met2 cell lines. A total of 130 DEGs are present in all four cell lines including 105 up- and 25 downregulated DEGS. (C) Heatmaps of common DEGs. Log2 mRNA intensities were scaled and clustered using hierarchical clustering. PTC, papillary thyroid carcinoma; FTC, follicular thyroid cancer; PDTC, poorly differentiated thyroid cancer; ATC, anaplastic thyroid cancer.
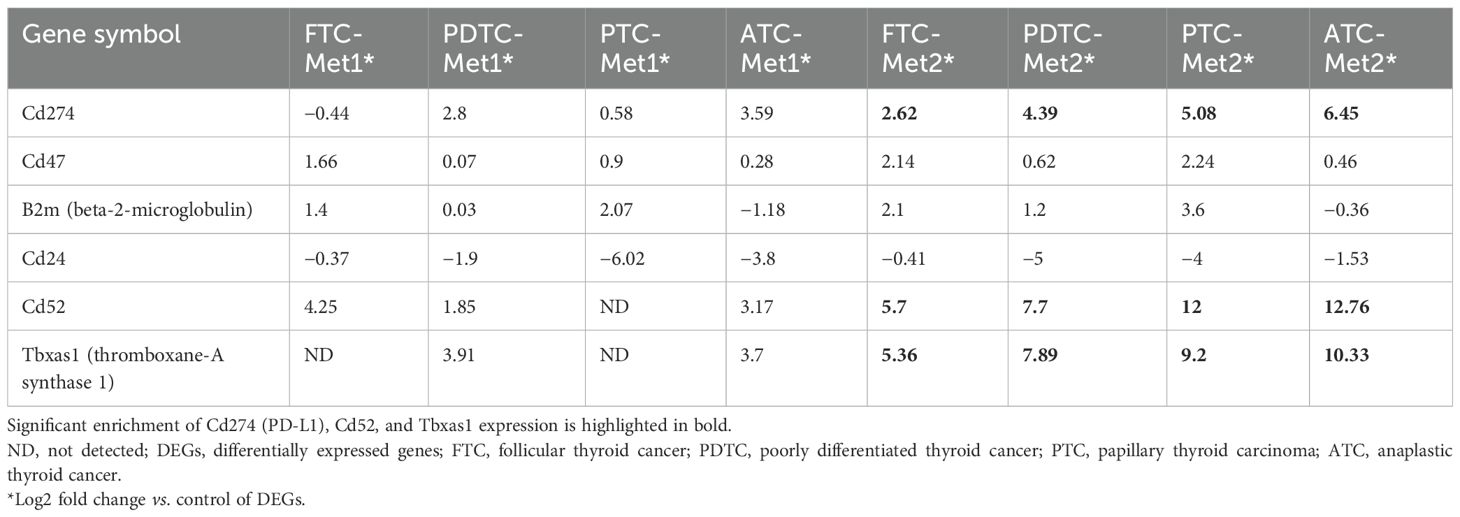
Table 1. “Don’t eat me” signal expression in Met1 and Met 2 cells.
Protein–protein interaction network construction and biological function analysis
The PPI network for the 130 DEGs was constructed after they were imported to STRING (Figure 3A). According to the ranking generated by the Degree algorithm, 32 hub genes were identified (Figure 3B). Their full names and related functions are shown in Supplementary Table 2. Many of them have been reported to be involved in metastasis in different cancer types. Gene ontology and pathway enrichment analysis revealed the top 20 gene clusters in the regulation of cytokine production, inflammatory and negative regulation of immune response, neutrophil migration and phagocytosis, and MAPK cascade (Figure 4A). Visualization of these gene clusters by the PPI network demonstrated significant cross interactions among different pathways (Figure 4B). The gene list of enriched clusters and their involvement in multiple signaling pathways are shown in Supplementary Table 3.
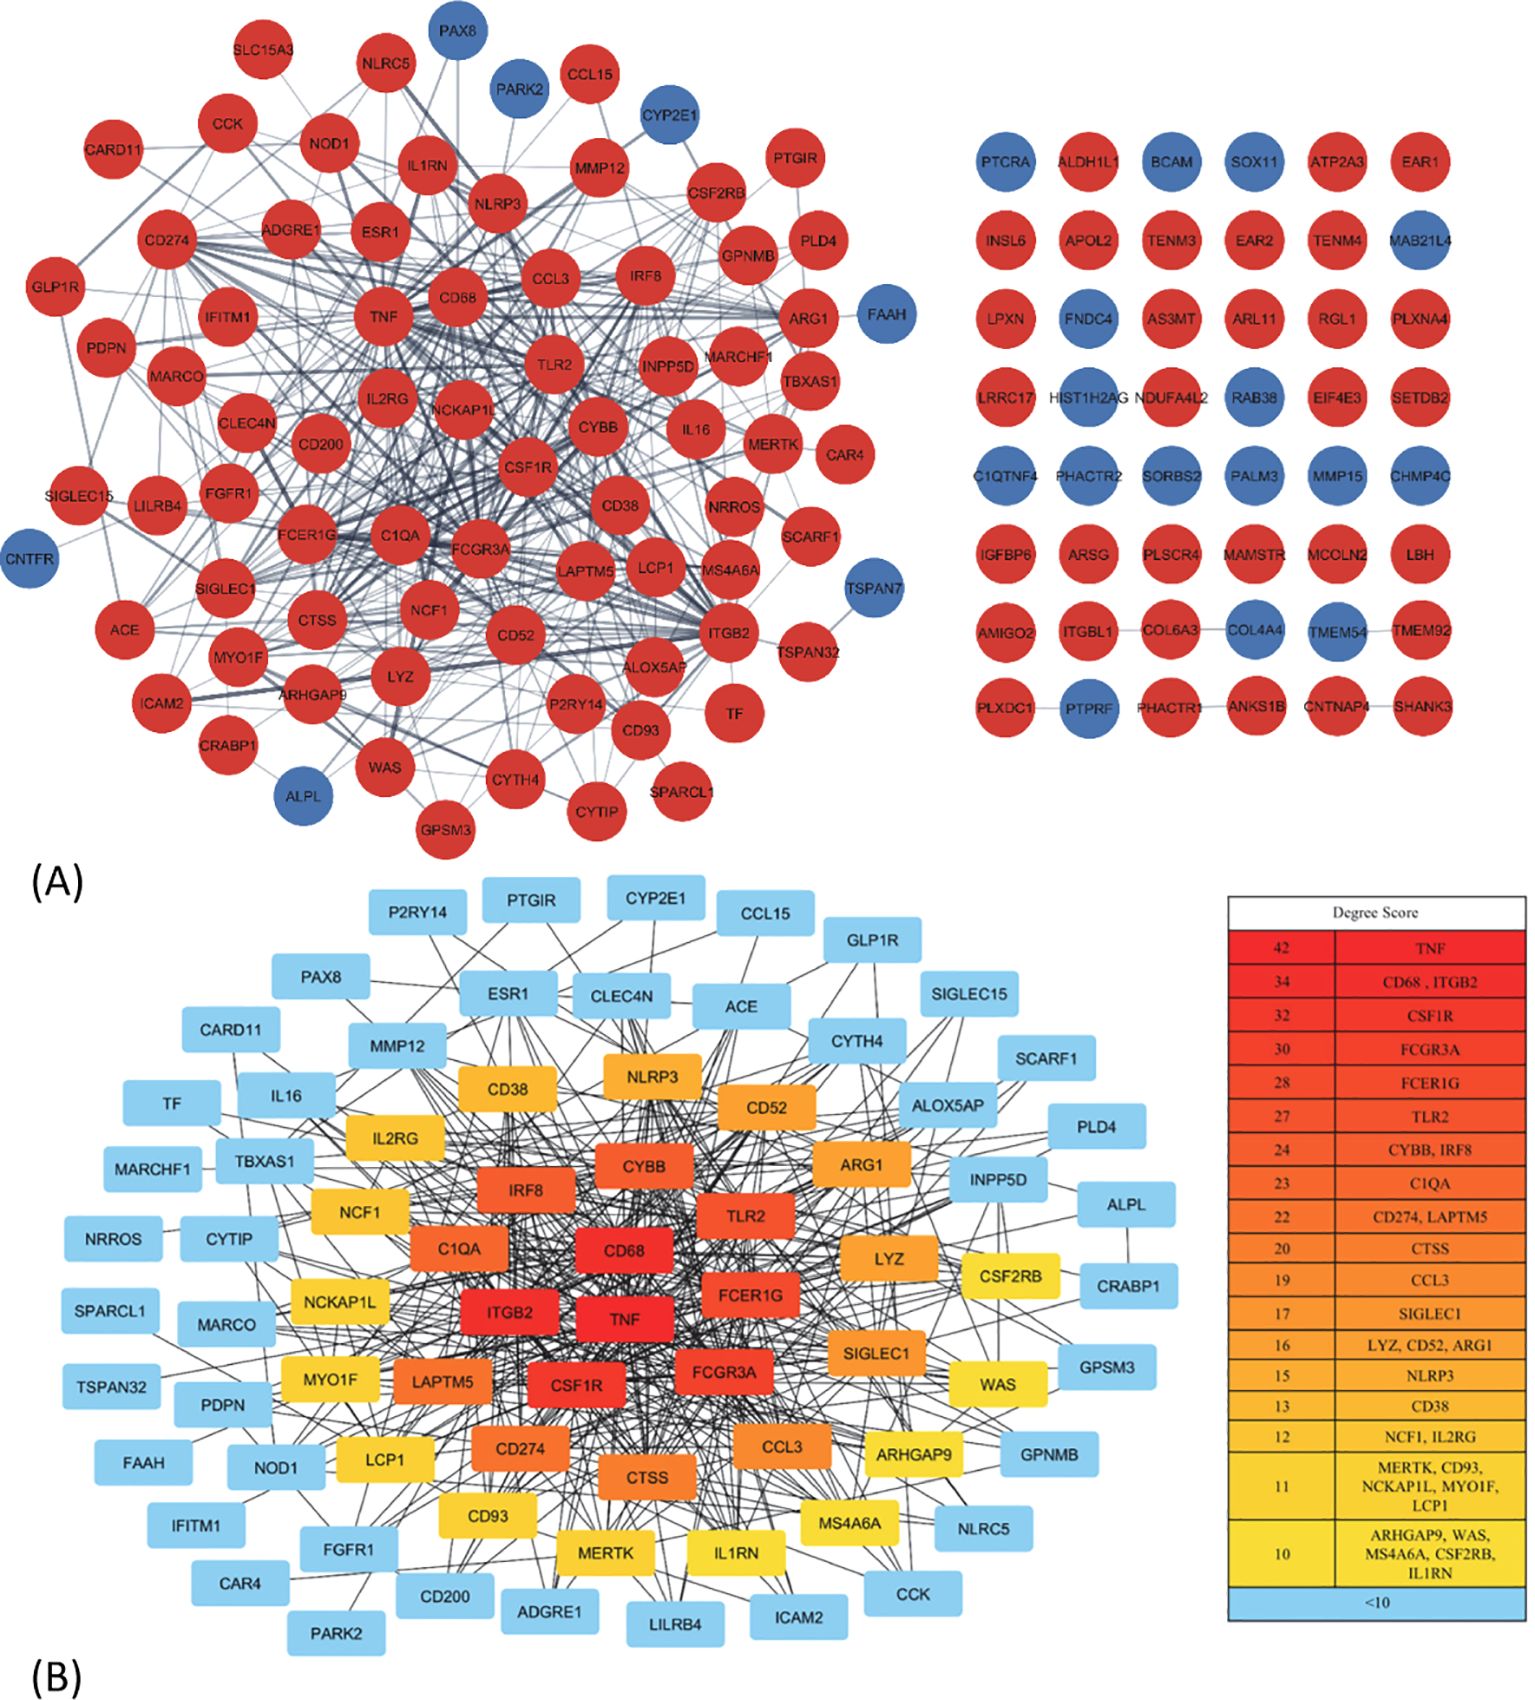
Figure 3. The protein–protein interaction (PPI) network construction and hub gene identification. (A) The PPI network of 130 common DEGs. The network was constructed by STRING and analyzed using Cytoscape. Some of them (48 genes) were not able to be incorporated into the PPI network. The red and blue nodes represent the up- and downregulated genes, respectively. (B) The interaction and ranking of 32 hub genes. The hub genes were visualized using the degree algorithm of the CytoHubba plugin. The color gradient from red to yellow corresponds to the degree score, with red indicating higher scores and yellow indicating lower scores; the genes with <10 connections are represented by blue. DEGs, differentially expressed genes.
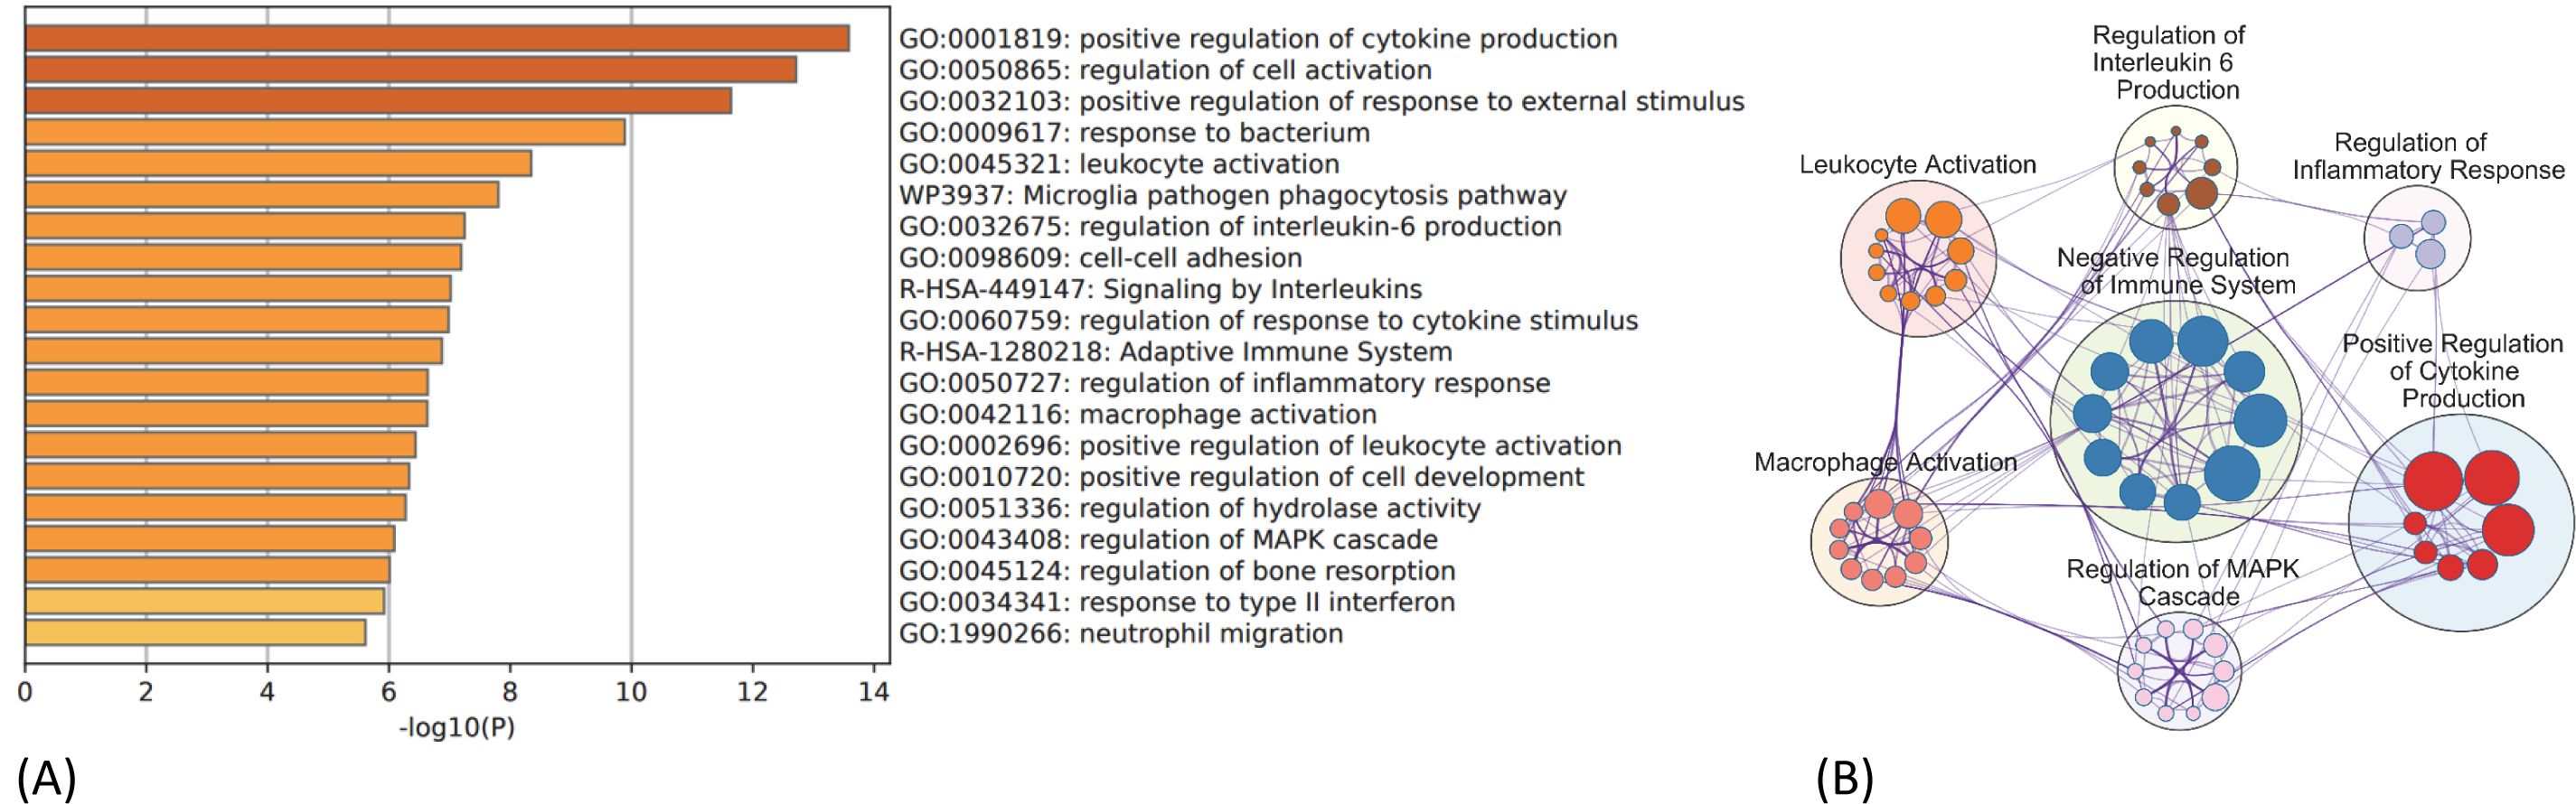
Figure 4. GO and KEGG pathway enrichment analysis of 130 common DEGs. (A) Top 20 enriched ontology clusters of DEGs are shown. (B) Visualization of meta-analysis results of key enriched ontology clusters of DEGs. The network shows significant interactions among key signaling pathways involved in thyroid cancer metastasis such as regulation of cytokine production, inflammation, immune checkpoint regulation, MAPK/ERK cascade, and leukocyte/macrophage activation process. The big circle represents main gene cluster. The small node indicates each biological process within the main gene cluster and is ranked by logP value (bigger node indicates smaller p-value). The gene list and their involvement in multiple signaling pathways are shown in Supplementary Table 3. GO, Gene Ontology; KEGG, Kyoto Encyclopedia of Genes and Genomes; DEGs, differentially expressed genes.
Identification of gene expression signature associated with poor survival
The association of common DEGs with OS of PTC patients was analyzed using TCGA-THCA dataset (n = 498). Seven genes were identified, and their overexpression was associated with poor OS (ARG1, TF, CD52, ITGBL1, PTGIR, TENM3, and AS3MT) (Figure 5A). The distribution of seven-gene expression signature among PTC samples is shown in Figure 5B. As shown in Table 2, the expression of this group of genes was higher in Met2 cells than in Met1 cells, indicating that they may participate in DM. Since most of these genes were overexpressed in less than 2% of samples except for ITGBL1 (Figure 5B), we analyzed them as a group (13% samples, 63/498) for prognosis prediction and clinical attributes. The seven-gene expression signature was significantly associated with poor OS (p < 0.0001, Figure 5C). The patients with seven-gene expression signature were associated with old age at diagnosis [56 vs. 45 years of median age (p < 0.0001)], late disease stage [38% (24/63) vs. 20% (85/435) in stage III and 24% (15/63) vs. 9% (39/435) in stage IV tumors (p < 0.0001)], tall cell variant [18% (11/63) vs. 6% (24/435) (p < 0.01)], and higher hypoxia score [−34 vs.− 38 of medium (p < 0.0001)] (Figure 5D). The overexpression of ITGBL1 was found in 8% of samples (40/498). Its overexpression was also associated with old age at diagnosis [7 vs. 46 years of median age (p < 0.0001)], late disease stage [43% (17/40) vs. 20% (92/458) in stage III and 30% (12/40) vs. 9% (42/458) in stage IV tumors (p < 0.0001)], tall cell variant [23% (9/40) vs. 6% (26/458) (p < 0.0001)], and higher hypoxia score [−35 vs. −42 of median value (p < 0.01)] (Figure 5E). Thus, ITGBL1 overexpression may be the most useful single gene marker for poor prognosis prediction.
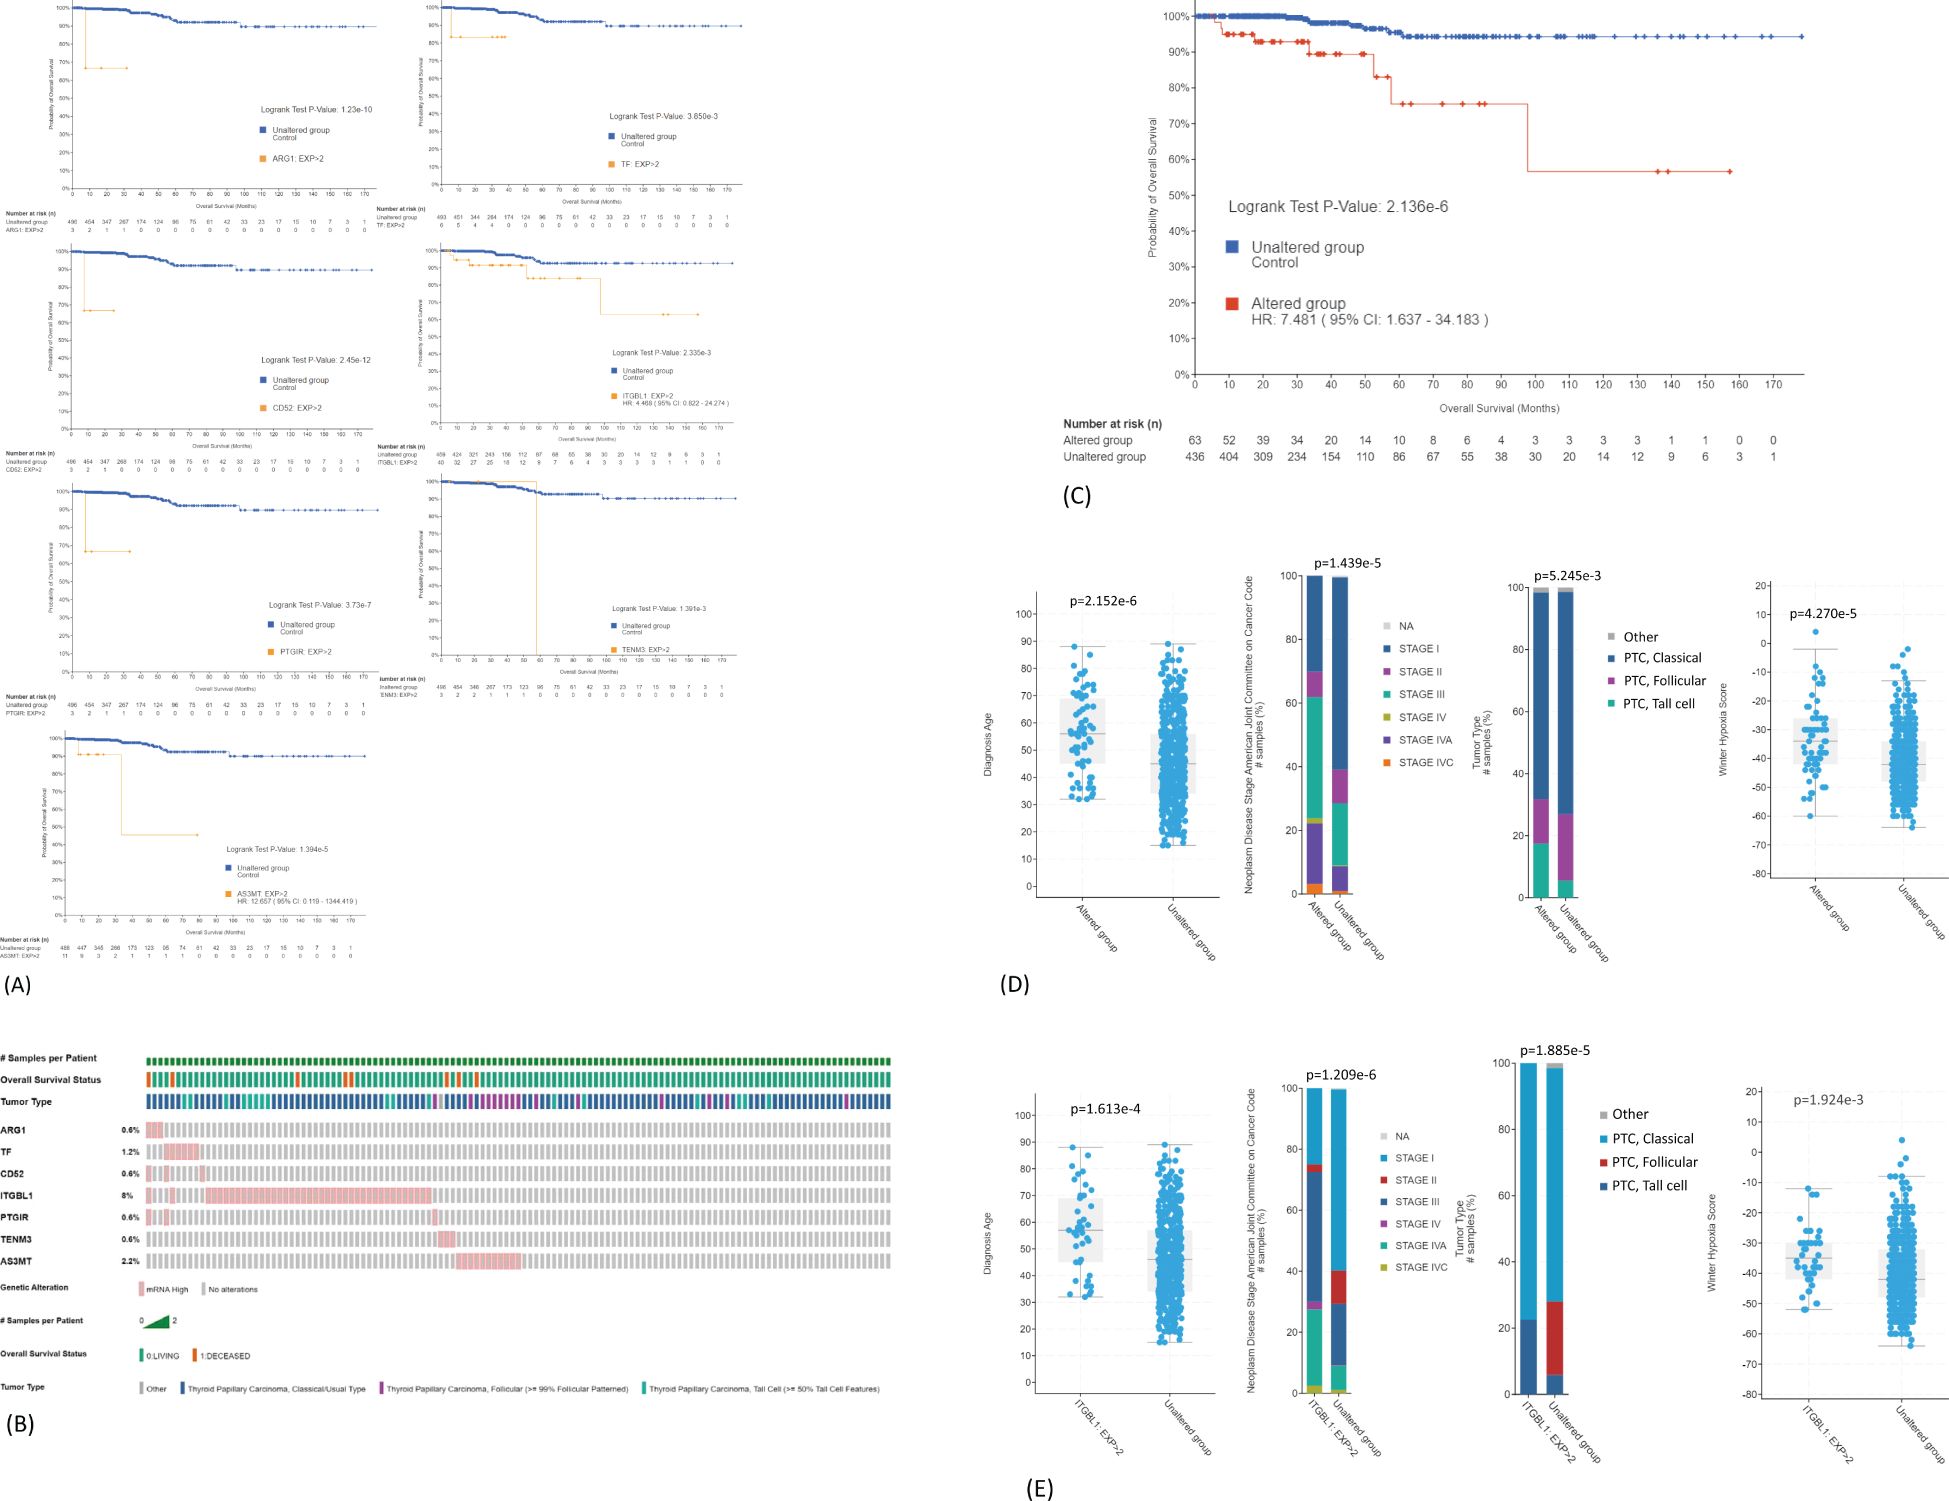
Figure 5. Prediction of DEGs on OS of PTC patients. (A) Association of ARG1, TF, CD52, ITGBL1, PTGIR, TENM3, or AS3MT overexpression with poor OS. TCGA-THCA mRNA dataset (n = 498) was used for Kaplan–Meier analyses: mRNA expression z-scores relative to normal samples (log RNA Seq V2 RSEM). (B) Distribution of seven-gene expression signature among PTC samples. Overexpression is present in 63 samples (13%, 63/498). (C) Association of seven-gene expression signature as a group with poor OS. (D) Correlation of seven-gene expression signature with clinical features of PTC. The overexpression is significantly associated with old age at diagnosis, late disease stage, tall cell variant, and higher hypoxia score. (E) Correlation of ITGBL1 overexpression with clinical features of PTC. DEGs, differentially expressed genes; OS, overall survival; PTC, papillary thyroid carcinoma.
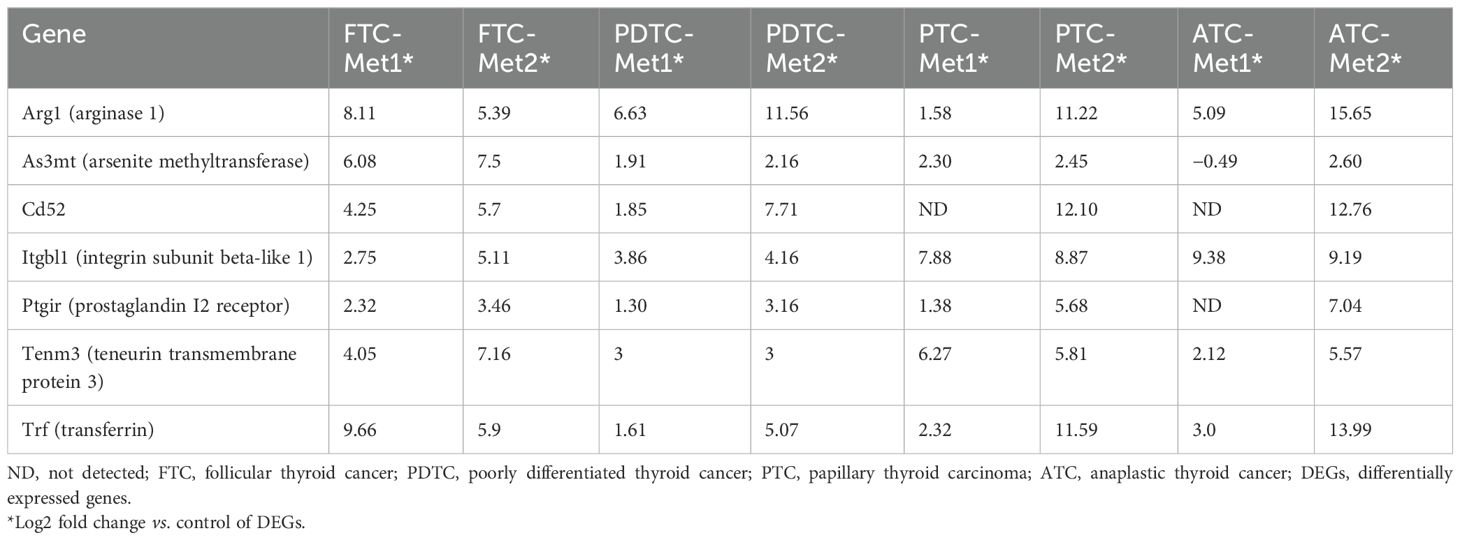
Table 2. Differential expression of seven prognostic marker genes in Met1 and Met 2 cells.
Mutation load in samples with seven-gene expression signature
We next compared mutational load between samples with or without seven-gene expression signature using TCGA-THCA dataset. We chose 38 genes whose mutations have been reported to be involved in carcinogenesis including genes known to be driver mutations in thyroid carcinogenesis. Among samples with seven-gene expression signature, 26 samples had more than one driver mutation (47%, 26/55) (Figure 6A). Deep homozygous deletions were frequently found in samples with BRAFV600E mutation (Figure 6A). Among patients without seven-gene expression signature, only 24 patients had more than one driver mutations (7%, 24/343) (Figure 6B). The difference is highly statistically significant (p < 0.00001). These data suggest that the seven-gene expression signature may reflect underlying increased chromosomal instability. Indeed, as shown in Figure 6C, patients with seven-gene expression signature had a higher rate of fraction of genome altered (FGA; the percentage of genome that has been affected by copy number gains or losses) than those without: 0.0399 ± 0.012 (mean ± SEM, n = 62) vs. 0.0153 ± 0.003 (n = 434, p < 0.01). Aneuploidy score was also increased in patients with seven-gene expression signature than those without: 1.60 ± 0.57 (mean ± SEM, n = 60) vs. 0.77 ± 0.14 (n = 405). These genetic changes may drive the metastatic transformation of tumor cells, resulting in distant metastasis.
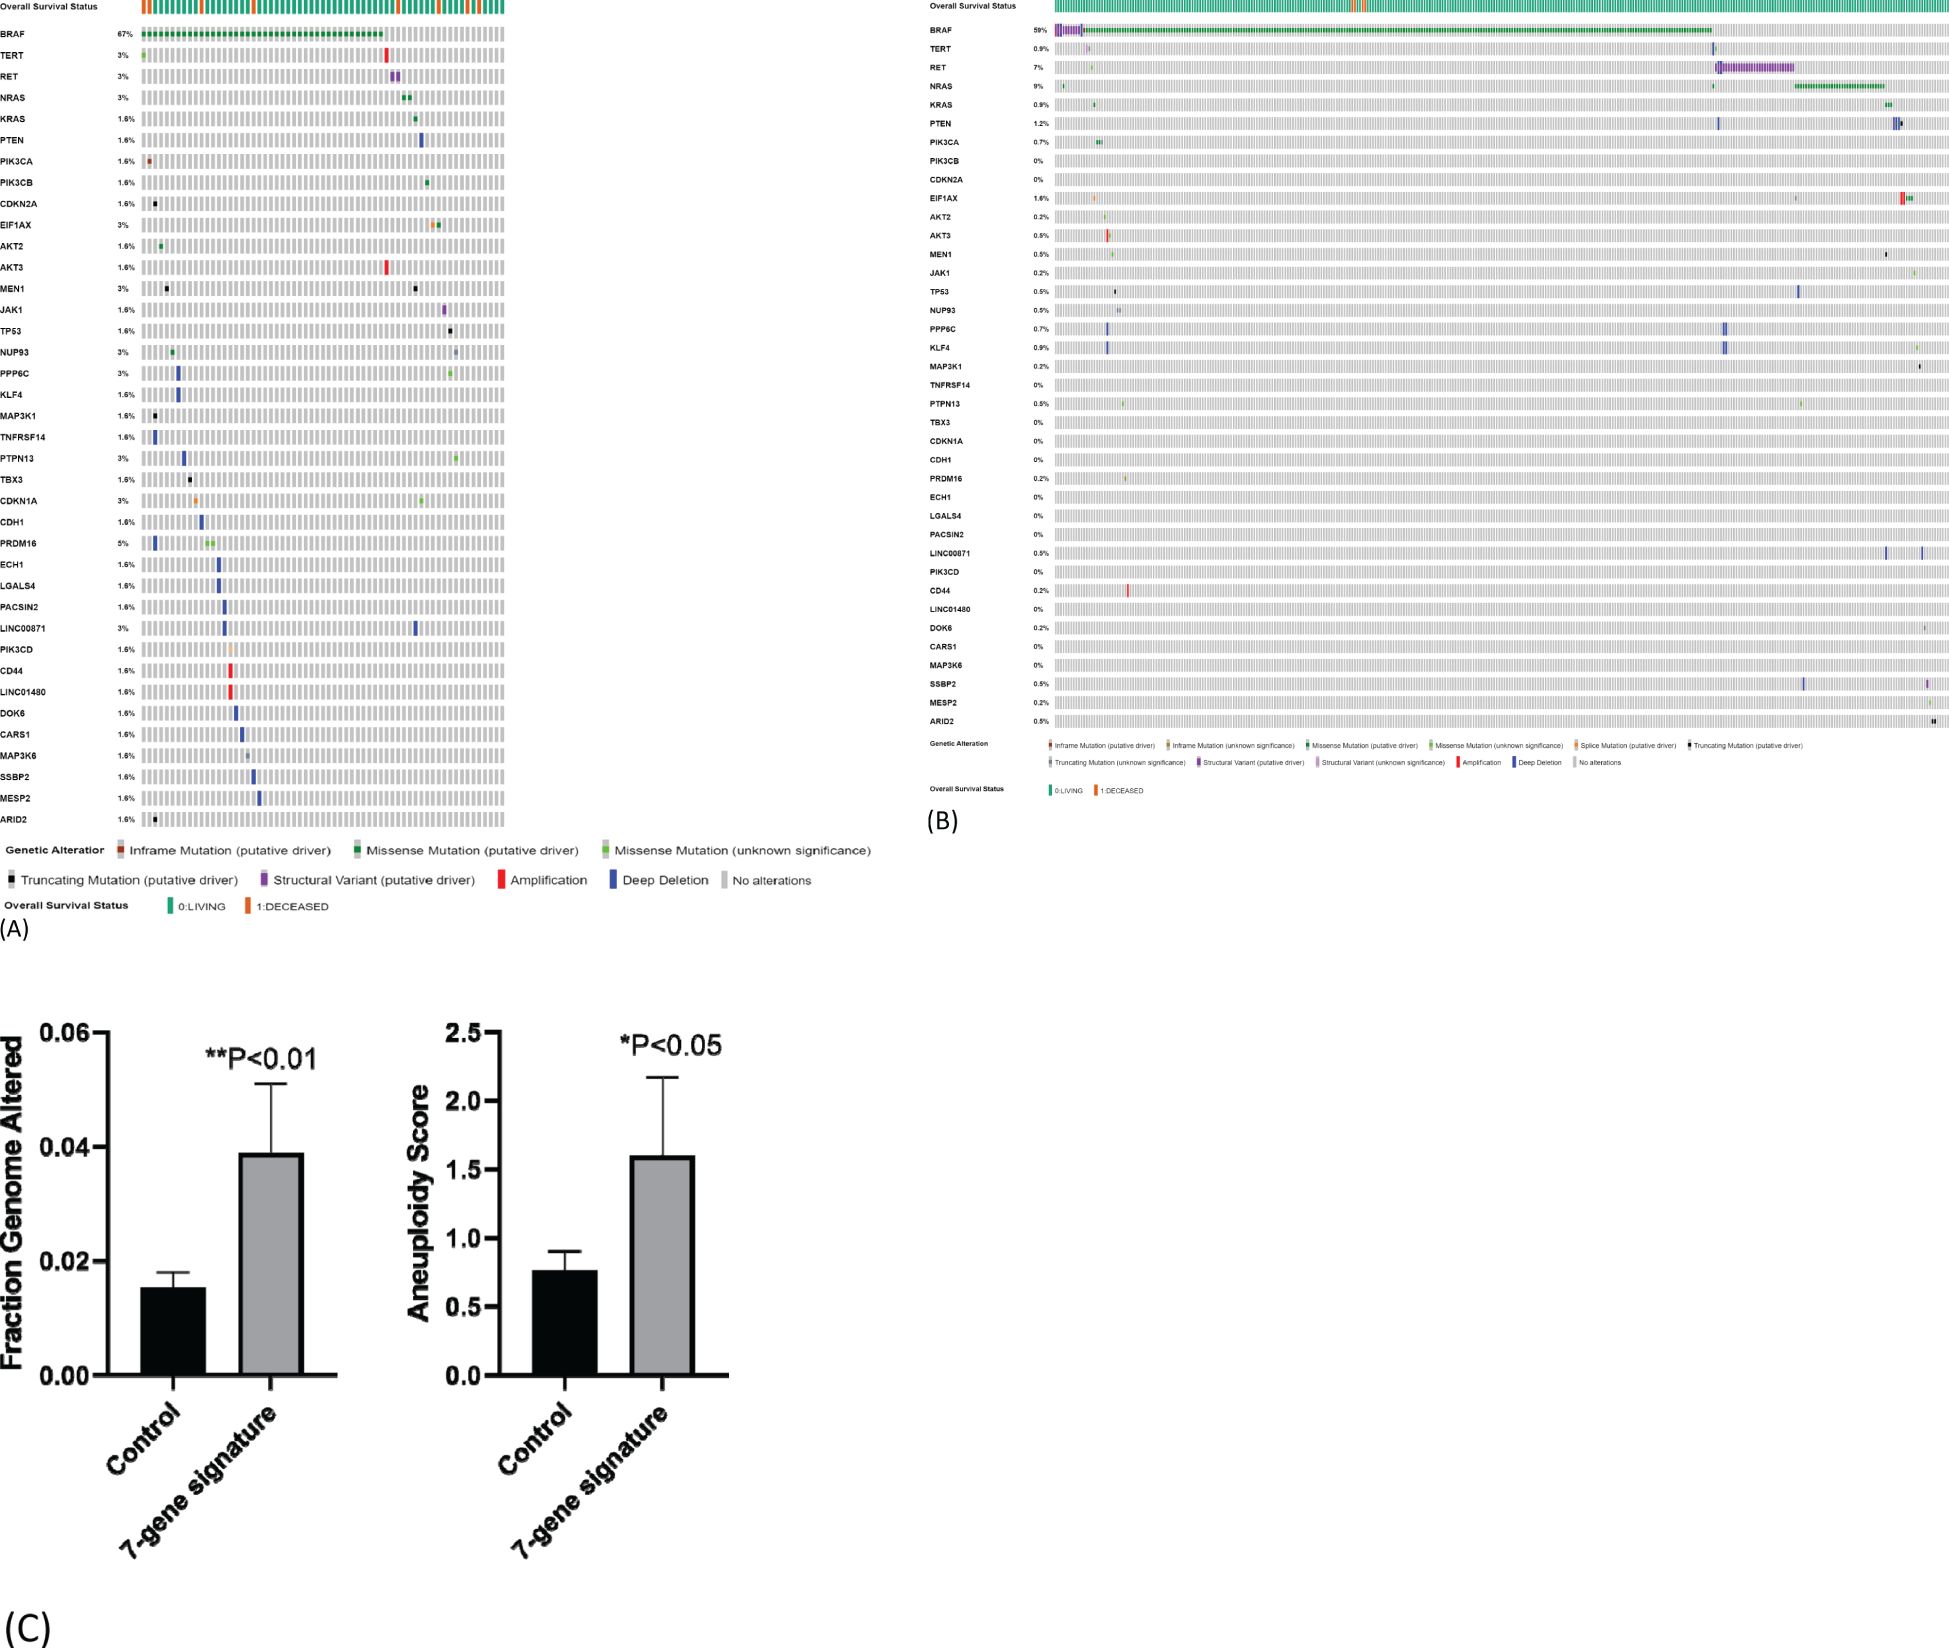
Figure 6. Mutation load in samples with seven-gene expression signature. (A) Mutational load in samples with seven-gene expression signature. TCGA-THCA data were used for analysis. Higher frequency of gene mutations is observed in 55 PTC samples with seven-gene expression signature. (B) Mutational load in samples without seven-gene expression signature. Lower frequency of gene mutations in 343 PTC samples without seven-gene expression signature. (C) Fraction genome altered and aneuploidy score in patients with or without seven-gene expression signature. PTC, papillary thyroid carcinoma.
Discussion
The main purpose of the study was to identify common DEGs involved in DM of thyroid cancer for prognosis prediction and revelation of potential mechanisms. We used four cell lines derived from four different thyroid cancer transgenic mouse models ranging from well-differentiated (PTC and FTC) to PDTC and ATC. This would help us find common DEGs relevant to all four tumor types. We validated the common DEGs using TCGA-THCA dataset and identified a seven-gene expression signature whose overexpression was associated with poor OS of PTC patients.
Hub gene identification is commonly used as an initial step in searching for prognostic biomarkers in many studies (20–22). While this approach is valuable, it has limitations, as not all candidate genes may be identified as hub genes. In the current study, among the seven candidate genes for prognostic prediction (ARG1, CD52, ITGBL1, TF, PTGIR, TENM3, and AS3MT), only ARG1 and CD52 were identified as hub genes. For instance, ITGBL1, an integrin subunit beta-like 1 protein, was not classified as a hub gene, but its overexpression was significantly associated with poor overall survival and advanced stages of thyroid cancer. Functionally, ITGBL1 promotes metastatic tumor growth by fostering a fibroblast niche through the secretion of pro-inflammatory cytokines such as IL-6 and IL-8 (23). Therefore, expanding the search beyond hub genes may help identify additional candidate genes that could serve as valuable biomarkers.
Thyroid cancer patients typically have high rates of early diagnosis and treatment. As a result, most patients do not develop distant metastases. Therefore, the current findings may be more relevant for predicting high-risk lymph node metastasis and guiding surgical lymph node removal. Notably, the seven-gene expression signature is significantly associated with advanced stages of thyroid cancer, particularly the tall cell variant, which is often linked to lymph node metastasis.
We have also explored potential pathways driving thyroid cancer metastasis. Gene Ontology (GO) and Kyoto Encyclopedia of Genes and Genomes (KEGG) pathway enrichment analyses of common DEGs revealed significant enrichment in pathways related to cytokine production, negative regulation of immune responses, neutrophil migration, phagocytosis, cell–cell adhesion, and MAPK signaling. Many of these pathways have been implicated in thyroid cancer progression (24, 25). Our findings suggest that inflammation, immune checkpoint regulation, and platelet aggregation play critical roles in thyroid cancer metastasis. Elevated expression of inflammatory cytokines/chemokines such as IL-6, Ccl3, Irf8, and Tnf was observed in Met2 cells, with Ccl3, Irf8, and Tnf identified as hub genes. Notably, a significant proportion of these hub genes are involved in endoplasmic reticulum (ER) stress and inflammation (Ccl3, Irf8, Tnf, Cybb, Nlrp3, Ncf1, Il2rg, Il1rn, and Tlr2) or immune checkpoint regulation (Cd274, Cd52, Cd38, Arg1, Csf2rb, and Fcer1g). Inflammation, typically a host response to pathogens, can be triggered by endogenous mediators (cytokines/chemokines) through tall-like receptors like Tlr2 to promote tumor progression and metastasis (26). Inhibition of Tlr2 has been shown to reduce pulmonary metastases in melanoma (27). Elevated expression of Cd274 (PD-L1), Cd38, and Cd52 was found in all Met2 cells. Cd274 is a well-established immune checkpoint molecule involved in immune escape, while less-studied molecules such as Cd38, Cd52, and CD200 may also contribute to immune suppression and potentially play a more significant role in resistance to PD-L1 inhibition. Overexpression of CD38 in the tumor microenvironment (TME) fosters immune suppression by reducing cytotoxic T-cell activity (28). CD52, found in higher levels in metastatic breast cancer cells [both triple-negative breast cancer (TNBC) and non-TNBC], suppresses T-cell immunity by binding to the inhibitory ligand SIGLEC10, suggesting the potential for CD52-targeting therapies like alemtuzumab to reactivate T-cell immunity in metastatic thyroid or breast cancer (29, 30). The CD200–CD200R signaling axis, involved in immune suppression, plays a key role in the survival and spread of various cancers (31). Given the overexpression of these immune checkpoint molecules in metastatic thyroid cancer cells, they likely contribute to immune evasion during metastasis (30, 32, 33). Additionally, CD68, a pan-macrophage marker, is often expressed by metastatic tumor cells to escape macrophage-mediated phagocytosis and the cytotoxic effects of CD8+ T cells. Indeed, elevated macrophage antigen expression in tumor tissue may signal a prometastatic state, correlating with poor prognosis (34, 35). Arginase (Arg1) is well-known for regulating cancer cell immune escape within the TME (36), and Fcer1g is a key gene involved in cancer immune infiltration (37). Collectively, these genes likely cooperate to enable metastatic tumor cells to survive in circulation and colonize distant organs. The present study identifies inflammation and immune checkpoint dysregulation as pivotal pathways in thyroid cancer metastasis.
A significant increase in mutational load was observed in patients with the seven-gene expression signature. High tumor mutational burden has been proposed as a potential biomarker for predicting immunotherapy response, as it may lead to the generation of immunogenic neoantigens in certain cancer types (38, 39). Two common measures of tumor mutational burden are the tumor aneuploidy score and the fraction of the genome containing single-nucleotide polymorphisms affected by copy number alterations (39). Given that thyroid cancer patients with the seven-gene expression signature exhibit both an increased aneuploidy score and high PD-L1 expression, this signature may have potential as a predictive biomarker for immunotherapy response.
Chromosomal instability is known to drive metastasis through the activation of a cytosolic DNA response (40). When genomic DNA spills into the cytosol, it triggers the cGAS (cyclic GMP-AMP synthase) and STING (Stimulator of interferon genes) pathways, which are key to sensing cytosolic DNA (41), and subsequently activate downstream noncanonical NF-κB signaling. Tumor cells with chromosomal instability often rely on the chronic activation of innate immune pathways to facilitate metastasis to distant organs (40). The major outcomes of chromosomal instability include ER stress and immune suppression (42). The enrichment of inflammation and innate immune pathways observed in the seven-gene expression signature further supports the involvement of chromosomal instability in thyroid cancer metastasis.
The limitation of this study is that the seven-gene expression signature was validated using a single TCGA dataset. Further validations in larger datasets and more diverse datasets would strengthen the study.
In summary, we have identified a seven-gene expression signature associated with poor prognosis and chromosomal instability. These genes may serve as valuable biomarkers for risk stratification of distant metastasis and/or high-risk lymph node metastasis, potentially aiding in decision-making for initial surgical recommendations.
Data availability statement
The datasets presented in this study can be found in online repositories. The names of the repository/repositories and accession number(s) can be found in the article/Supplementary Material. All data are included in the manuscript and supplementary data including the Gene Expression Omnibus (GEO) repository (GSE284225).
Ethics statement
The animal study was approved by Animal Care and Use Committee of King Faisal Specialist Hospital and Research Centre. The study was conducted in accordance with the local legislation and institutional requirements.
Author contributions
BA: Conceptualization, Formal analysis, Investigation, Methodology, Supervision, Writing – original draft, Writing – review & editing. SA: Formal analysis, Methodology, Writing – original draft, Writing – review & editing, Data curation, Investigation, Software. AQ: Data curation, Formal analysis, Investigation, Methodology, Software, Writing – original draft, Writing – review & editing. MZ: Formal Analysis, Investigation, Methodology, Writing – original draft, Writing – review & editing. AA: Resources, Supervision, Visualization, Writing – original draft, Writing – review & editing. ASA: Resources, Supervision, Visualization, Writing – original draft, Writing – review & editing. YS: Conceptualization, Data curation, Formal analysis, Funding acquisition, Investigation, Methodology, Project administration, Resources, Software, Supervision, Validation, Visualization, Writing – original draft, Writing – review & editing.
Funding
The author(s) declare financial support was received for the research, authorship, and/or publication of this article. This study was supported by an institutional research fund.
Acknowledgments
We would like to thank Dr. Shioko Kimura from the National Cancer Institute and Dr. Catrin Pritchard from Leicester Cancer Research Centre at the University of Leicester for their generous gifts of TPO-Cre and LSL-BrafV600E mice, respectively.
Conflict of interest
The authors declare that the research was conducted in the absence of any commercial or financial relationships that could be construed as a potential conflict of interest.
Generative AI statement
The author(s) declare that no Generative AI was used in the creation of this manuscript.
Publisher’s note
All claims expressed in this article are solely those of the authors and do not necessarily represent those of their affiliated organizations, or those of the publisher, the editors and the reviewers. Any product that may be evaluated in this article, or claim that may be made by its manufacturer, is not guaranteed or endorsed by the publisher.
Supplementary material
The Supplementary Material for this article can be found online at: https://www.frontiersin.org/articles/10.3389/fonc.2025.1536270/full#supplementary-material
References
1. Kakudo K, Bychkov A, Bai Y, Li Y, Liu Z, Jung CK. The new 4th edition World Health Organization classification for thyroid tumors, Asian perspectives. Pathol Int. (2018) 68:641–64. doi: 10.1111/pin.v68.12
2. Ibrahimpasic T, Ghossein R, Shah JP, Ganly I. Poorly differentiated carcinoma of the thyroid gland: current status and future prospects. Thyroid: Off J Am Thyroid Assoc. (2019) 29:311–21. doi: 10.1089/thy.2018.0509
3. Lang BH, Lo CY, Chan WF, Lam KY, Wan KY. Prognostic factors in papillary and follicular thyroid carcinoma: their implications for cancer staging. Ann Surg Oncol. (2007) 14:730–8. doi: 10.1245/s10434-006-9207-5
4. Hundahl SA, Fleming ID, Fremgen AM. Menck HR. A National Cancer Data Base report on 53,856 cases of thyroid carcinoma treated in the U.S., 1985-1995 [see commetns. Cancer. (1998) 83:2638–48. doi: 10.1002/(SICI)1097-0142(19981215)83:12<2638::AID-CNCR31>3.0.CO;2-1
5. Landa I, Ibrahimpasic T, Boucai L, Sinha R, Knauf JA, Shah RH, et al. Genomic and transcriptomic hallmarks of poorly differentiated and anaplastic thyroid cancers. J Clin Invest. (2016) 126:1052–66. doi: 10.1172/JCI85271
6. Kunstman JW, Juhlin CC, Goh G, Brown TC, Stenman A, Healy JM, et al. Characterization of the mutational landscape of anaplastic thyroid cancer via whole-exome sequencing. Hum Mol Genet. (2015) 24:2318–29. doi: 10.1093/hmg/ddu749
7. Agrawal N, Akbani R, Aksoy BA, Ally A, Arachchi H, Asa SL, et al. Integrated genomic characterization of papillary thyroid carcinoma. Cell. (2014) 159:676–90. doi: 10.1016/j.cell.2014.09.050
8. Goffredo P, Sosa JA, Roman SA. Differentiated thyroid cancer presenting with distant metastases: a population analysis over two decades. World J surgery. (2013) 37:1599–605. doi: 10.1007/s00268-013-2006-9
9. Tuttle RM, Ball DW, Byrd D, Dilawari RA, Doherty GM, Duh QY, et al. Thyroid carcinoma. J Natl Compr Cancer Network: JNCCN. (2010) 8:1228–74. doi: 10.6004/jnccn.2010.0093
10. Toraih EA, Hussein MH, Zerfaoui M, Attia AS, Marzouk Ellythy A, Mostafa A, et al. Site-specific metastasis and survival in papillary thyroid cancer: the importance of brain and multi-organ disease. Cancers. (2021) 13:1625–38. doi: 10.3390/cancers13071625
11. Wang LY, Palmer FL, Nixon IJ, Thomas D, Patel SG, Shaha AR, et al. Multi-organ distant metastases confer worse disease-specific survival in differentiated thyroid cancer. Thyroid: Off J Am Thyroid Assoc. (2014) 24:1594–9. doi: 10.1089/thy.2014.0173
12. Tuttle RM, Leboeuf R, Martorella AJ. Papillary thyroid cancer: monitoring and therapy. Endocrinol Metab Clinics North America. (2007) 36:753–78. doi: 10.1016/j.ecl.2007.04.004
13. Hugen N, Sloot YJE, Netea-Maier RT, van de Water C, Smit JWA, Nagtegaal ID, et al. Divergent metastatic patterns between subtypes of thyroid carcinoma results from the nationwide dutch pathology registry. J Clin Endocrinol Metab. (2020) 105:e299–306. doi: 10.1210/clinem/dgz078
14. Yip L, Gooding WE, Nikitski A, Wald AI, Carty SE, Karslioglu-French E, et al. Risk assessment for distant metastasis in differentiated thyroid cancer using molecular profiling: A matched case-control study. Cancer. (2021) 127:1779–87. doi: 10.1002/cncr.v127.11
15. Parhar RS, Zou M, Al-Mohanna FA, Baitei EY, Assiri AM, Meyer BF, et al. IL-12 immunotherapy of Braf(V600E)-induced papillary thyroid cancer in a mouse model. Lab investigation; J Tech Methods pathology. (2016) 96:89–97. doi: 10.1038/labinvest.2015.126
16. Zou M, Baitei EY, Al-Rijjal RA, Parhar RS, Al-Mohanna FA, Kimura S, et al. KRAS(G12D)-mediated oncogenic transformation of thyroid follicular cells requires long-term TSH stimulation and is regulated by SPRY1. Lab investigation; J Tech Methods pathology. (2015) 95:1269–77. doi: 10.1038/labinvest.2015.90
17. Zou M, Baitei EY, Al-Rijjal RA, Parhar RS, Al-Mohanna FA, Kimura S, et al. TSH overcomes Braf(V600E)-induced senescence to promote tumor progression via downregulation of p53 expression in papillary thyroid cancer. Oncogene. (2016) 35:1909–18. doi: 10.1038/onc.2015.253
18. Zou M, Baitei EY, BinEssa HA, Al-Mohanna FA, Parhar RS, St-Arnaud R, et al. Cyp24a1 attenuation limits progression of braf(V600E) -induced papillary thyroid cancer cells and sensitizes them to BRAF(V600E) inhibitor PLX4720. Cancer Res. (2017) 77:2161–72. doi: 10.1158/0008-5472.CAN-16-2066
19. Lucotti S, Cerutti C, Soyer M, Gil-Bernabé AM, Gomes AL, Allen PD, et al. Aspirin blocks formation of metastatic intravascular niches by inhibiting platelet-derived COX-1/thromboxane A2. J Clin Invest. (2019) 129:1845–62. doi: 10.1172/JCI121985
20. Zu L, He J, Zhou N, Tang Q, Liang M, Xu S. Identification of multiple organ metastasis-associated hub mRNA/miRNA signatures in non-small cell lung cancer. Cell Death disease. (2023) 14:798. doi: 10.1038/s41419-023-06286-x
21. Ren H, Liu X, Li F, He X, Zhao N. Identification of a six gene prognosis signature for papillary thyroid cancer using multi-omics methods and bioinformatics analysis. Front Oncol. (2021) 11:624421. doi: 10.3389/fonc.2021.624421
22. Zhao H, Li H. Network-based meta-analysis in the identification of biomarkers for papillary thyroid cancer. Gene. (2018) 661:160–8. doi: 10.1016/j.gene.2018.03.096
23. Ji Q, Zhou L, Sui H, Yang L, Wu X, Song Q, et al. Primary tumors release ITGBL1-rich extracellular vesicles to promote distal metastatic tumor growth through fibroblast-niche formation. Nat Commun. (2020) 11:1211. doi: 10.1038/s41467-020-14869-x
24. Lu L, Wang JR, Henderson YC, Bai S, Yang J, Hu M, et al. Anaplastic transformation in thyroid cancer revealed by single-cell transcriptomics. J Clin Invest. (2023) 133:169653–71. doi: 10.1172/JCI169653
25. Leandro-García LJ, Landa I. Mechanistic insights of thyroid cancer progression. Endocrinology. (2023) 164:1–11. doi: 10.1210/endocr/bqad118
26. Kim S, Takahashi H, Lin WW, Descargues P, Grivennikov S, Kim Y, et al. Carcinoma-produced factors activate myeloid cells through TLR2 to stimulate metastasis. Nature. (2009) 457:102–6. doi: 10.1038/nature07623
27. Yang HZ, Cui B, Liu HZ, Mi S, Yan J, Yan HM, et al. Blocking TLR2 activity attenuates pulmonary metastases of tumor. PloS One. (2009) 4:e6520. doi: 10.1371/journal.pone.0006520
28. Dwivedi S, Rendón-Huerta EP, Ortiz-Navarrete V, Montaño LF. CD38 and regulation of the immune response cells in cancer. J Oncol. (2021) 2021:6630295. doi: 10.1155/2021/6630295
29. Xu K, Wang R, Xie H, Hu L, Wang C, Xu J, et al. Single-cell RNA sequencing reveals cell heterogeneity and transcriptome profile of breast cancer lymph node metastasis. Oncogenesis. (2021) 10:66. doi: 10.1038/s41389-021-00355-6
30. Bandala-Sanchez E, Gb N, Goddard-Borger ED, Ngui K, Naselli G, Stone NL, et al. CD52 glycan binds the proinflammatory B box of HMGB1 to engage the Siglec-10 receptor and suppress human T cell function. Proc Natl Acad Sci United States America. (2018) 115:7783–8. doi: 10.1073/pnas.1722056115
31. Khan IZ, Del Guzzo CA, Shao A, Cho J, Du R, Cohen AO, et al. The CD200-CD200R axis promotes squamous cell carcinoma metastasis via regulation of cathepsin K. Cancer Res. (2021) 81:5021–32. doi: 10.1158/0008-5472.CAN-20-3251
32. Han Y, Liu D, Li L. PD-1/PD-L1 pathway: current researches in cancer. Am J Cancer Res. (2020) 10:727–42.
33. Chen L, Diao L, Yang Y, Yi X, Rodriguez BL, Li Y, et al. CD38-mediated immunosuppression as a mechanism of tumor cell escape from PD-1/PD-L1 blockade. Cancer discovery. (2018) 8:1156–75. doi: 10.1158/2159-8290.CD-17-1033
34. Chistiakov DA, Killingsworth MC, Myasoedova VA, Orekhov AN, Bobryshev YV. CD68/macrosialin: not just a histochemical marker. Lab investigation; J Tech Methods Pathol. (2017) 97:4–13. doi: 10.1038/labinvest.2016.116
35. Zhang J, Li S, Liu F, Yang K. Role of CD68 in tumor immunity and prognosis prediction in pan-cancer. Sci Rep. (2022) 12:7844. doi: 10.1038/s41598-022-11503-2
36. Niu F, Yu Y, Li Z, Ren Y, Li Z, Ye Q, et al. Arginase: An emerging and promising therapeutic target for cancer treatment. Biomedicine pharmacotherapy = Biomedecine pharmacotherapie. (2022) 149:112840. doi: 10.1016/j.biopha.2022.112840
37. Yang R, Chen Z, Liang L, Ao S, Zhang J, Chang Z, et al. Fc Fragment of IgE Receptor Ig (FCER1G) acts as a key gene involved in cancer immune infiltration and tumour microenvironment. Immunology. (2023) 168:302–19. doi: 10.1111/imm.v168.2
38. Samstein RM, Lee CH, Shoushtari AN, Hellmann MD, Shen R, Janjigian YY, et al. Tumor mutational load predicts survival after immunotherapy across multiple cancer types. Nat Genet. (2019) 51:202–6. doi: 10.1038/s41588-018-0312-8
39. Chang TG, Cao Y, Shulman ED, Ben-David U, Schäffer AA, Ruppin E. Optimizing cancer immunotherapy response prediction by tumor aneuploidy score and fraction of copy number alterations. NPJ Precis Oncol. (2023) 7:54. doi: 10.1038/s41698-023-00408-6
40. Bakhoum SF, Ngo B, Laughney AM, Cavallo JA, Murphy CJ, Ly P, et al. Chromosomal instability drives metastasis through a cytosolic DNA response. Nature. (2018) 553:467–72. doi: 10.1038/nature25432
41. Chauvin SD, Stinson WA, Platt DJ, Poddar S, Miner JJ. Regulation of cGAS and STING signaling during inflammation and infection. J Biol Chem. (2023) 299:104866. doi: 10.1016/j.jbc.2023.104866
Keywords: metastasis-associated gene, prognosis, biomarker, metastasis, thyroid cancer
Citation: Alnwisser B, Alshehri S, Qattan A, Zou M, Aboussekhra A, Alzahrani AS and Shi Y (2025) Identification of novel prognostic biomarkers for thyroid cancer by integrated transcriptome analysis of metastasis-associated genes. Front. Oncol. 15:1536270. doi: 10.3389/fonc.2025.1536270
Received: 28 November 2024; Accepted: 13 January 2025;
Published: 19 May 2025.
Edited by:
Rengyun Liu, The First Affiliated Hospital of Sun Yat-sen University, ChinaReviewed by:
Dakai Zhang, University of Texas Health Science Center at Houston, United StatesPingping Xiang, Icahn School of Medicine at Mount Sinai, United States
Copyright © 2025 Alnwisser, Alshehri, Qattan, Zou, Aboussekhra, Alzahrani and Shi. This is an open-access article distributed under the terms of the Creative Commons Attribution License (CC BY). The use, distribution or reproduction in other forums is permitted, provided the original author(s) and the copyright owner(s) are credited and that the original publication in this journal is cited, in accordance with accepted academic practice. No use, distribution or reproduction is permitted which does not comply with these terms.
*Correspondence: Yufei Shi, eXVmZWlAa2ZzaHJjLmVkdS5zYQ==