 Ning Meng
 Zhiqiang Wang1
 Yaqi Peng
 Jingxia Lv
- 1Department of General Surgery, Shijiazhuang People’s Hospital, Shijiazhuang, Hebei, China
- 2Basic College, Hebei Medical University, Shijiazhuang, Hebei, China
- 3The Third Department of Surgery, The Fourth Hospital of Hebei Medical University, Shijiazhuang, China
- 4Hebei Key Laboratory of Precision Diagnosis and Comprehensive Treatment of Gastric Cancer, The Fourth Hospital of Hebei Medical University, Shijiazhuang, Hebei, China
- 5Big Data Analysis and Mining Application for Precise Diagnosis and Treatment of Gastric Cancer, Hebei Provincial Engineering Research Center, Shijiazhuang, China
- 6Department of Endoscopy, The Fourth Hospital of Hebei Medical University, Shijiazhuang, China
Background: Postoperative recurrence remains a major challenge in patients with locally advanced gastric cancer (LAGC). Identifying reliable biomarkers for predicting recurrence can guide clinical decision-making and improve patient outcomes. This study aimed to investigate the association between four peripheral blood metabolic markers and postoperative recurrence in LAGC patients, and to develop a predictive model based on these markers.
Methods: This retrospective cohort study analyzed data from 1,040 patients with LAGC who underwent radical surgical resection between January 2010 and December 2019. Peripheral blood metabolic indicators, including low-density lipoprotein/high-density lipoprotein (LHR), cholesterol/high-density lipoprotein (TCHR), triglycerides/high-density lipoprotein (TGHR), and triglycerides × fasting blood glucose (TyG), were used to assess metabolic status. Multivariable regression and survival analysis were performed to assess the prognostic value of these markers. A nomogram combining metabolic markers and clinical factors was developed and validated for predicting postoperative recurrence.
Results: High levels of LHR, TCHR, TGHR, and TyG were significantly associated with increased risk of postoperative recurrence in LAGC patients (P < 0.001). Multivariable analysis identified TNM stage, pathological type, systemic immune inflammation index (SII), and metabolic score as independent predictors of recurrence. A predictive model incorporating these factors demonstrated superior performance compared to clinical features alone, with an area under the curve (AUC) of 0.867 (95% CI: 0.836-0.897) in the training set, 0.887 (95% CI: 0.844-0.929) in internal validation set, 0.859 (95% CI: 0.817-0.899) in the external validation set. Patients with high metabolic scores had significantly worse overall survival (OS) and disease-free survival (DFS), further supporting the model’s prognostic value.
Conclusions: Peripheral blood metabolic markers, particularly LHR, TCHR, TGHR, and TyG, are valuable predictors of postoperative recurrence in LAGC patients. The combined predictive model, integrating metabolic markers and clinical features, provides an effective tool for personalized risk stratification and may assist in optimizing postoperative management in LAGC.
Introduction
Locally advanced gastric cancer (LAGC) is associated with a high risk of postoperative recurrence, which significantly impacts patient survival (1, 2). Despite advancements in surgical techniques and adjuvant therapies, predicting recurrence in LAGC patients remains a significant challenge (3). Current methods of recurrence prediction mainly rely on clinical staging and conventional biomarkers, such as tumor size, lymph node involvement, and serum markers (e.g., carcinoembryonic antigen, CEA) (4, 5). While these tools provide valuable information, they often lack sufficient sensitivity and specificity to accurately identify high-risk patients, particularly in the early postoperative period when timely intervention can have the most significant impact on outcomes.
Recent research has increasingly focused on the role of metabolic dysregulation in cancer progression (6–8). Several studies have shown that alterations in metabolic pathways, such as lipid metabolism, glucose homeostasis, and insulin resistance, are associated with tumor progression and recurrence in various cancers, including gastric cancer (9–11). These metabolic changes reflect the underlying pathophysiological processes that support tumor growth and metastasis. As a result, metabolic biomarkers have gained attention as potential prognostic indicators for cancer recurrence. However, most studies have investigated individual metabolic markers, such as the lipid profile or the triglyceride-glucose index (TyG) in isolation (12–14). Previous studies have shown that LHR is associated with poor prognosis in colorectal cancer and gastric cancer (15, 16). While these markers have demonstrated some predictive value, they may not provide a complete picture of a patient’s metabolic status and its relationship with tumor behavior.
To address this gap, recent approaches have explored the integration of multiple metabolic indicators into a composite score, aiming to enhance the accuracy and reliability of recurrence prediction. By combining several metabolic markers, a composite score can more comprehensively reflect the complex metabolic changes that occur in cancer patients (17–20). This approach not only strengthens the predictive value but also offers the advantage of being based on widely accessible and routinely measured biomarkers, making it a practical tool for clinical use. Previous studies have highlighted the potential of combining lipid ratios with glucose-related indices to improve risk stratification in cancer patients.
This study aims to address the gap in current recurrence prediction methods by exploring the potential of a peripheral blood metabolic composite score to predict postoperative recurrence in LAGC patients. By combining several established metabolic markers, such as the Low-Density Lipoprotein/High-Density Lipoprotein Ratio (LHR), Total Cholesterol/High-Density Lipoprotein Ratio (TCHR), Triglyceride/High-Density Lipoprotein Ratio (TGHR), and the Triglyceride-Glucose Index (TyG) into a single score, we seek to develop a more robust and reliable tool for assessing recurrence risk. This approach offers the potential for more accurate risk stratification, allowing clinicians to identify high-risk patients and tailor postoperative surveillance and adjuvant treatment accordingly.
The novelty and significance of this study lie in its focus on integrating multiple metabolic markers into a single, composite score, which could offer a more accessible, cost-effective, and clinically applicable method for recurrence prediction. By leveraging commonly measured peripheral blood markers, our study aims to provide a practical solution for improving personalized care and outcomes in LAGC patients. Ultimately, we hope that this approach will lead to earlier interventions, better treatment planning, and improved survival rates in this challenging patient population.
Methods
Study population
This retrospective cohort study used data from the Hebei Gastric Cancer Collaborative Network database (http://hbss.suvalue.com/), which prospectively collects data on the diagnosis and treatment of gastric cancer (21, 22). The study included patients with LAGC who underwent radical surgical resection between January 2010 and December 2019. All patients were aged ≥18 years, had a diagnosis of adenocarcinoma confirmed by gastric biopsy, and had not received preoperative chemotherapy, radiotherapy, or other anticancer treatments. Inclusion was limited to patients with a hospital stay >48 hours. Exclusion criteria included patients with active infections or autoimmune diseases, as well as those with missing data (e.g., age, height, TNM staging, fasting blood glucose, LDL cholesterol, HDL cholesterol, total cholesterol, triglycerides [TG], neutrophil count, or lymphocyte count). The study adhered to the principles of the Declaration of Helsinki and was approved by the local ethics committee. Informed consent was obtained from all patients, either in writing or orally, with the understanding that their clinical data would be used without disclosing personal information.
A total of 1040 LAGC patients were classified into training and validation cohorts based on the medical center where they were treated. Patients were from the Fourth Hospital of Hebei Medical University(FHHM), and this group was randomly divided into a training cohort (n=515) and an internal validation (n=221) cohort in a 7:3 ratio via the “caret” package in R software. Patients from Shijiazhuang People’s Hospital(SJZPH) were assigned to the external validation cohort (n=304).
Data collection
Patient data, including age, gender, tumor type, stage, and smoking and alcohol history, CEA, CA19-9 were obtained from the electronic medical records. Clinical staging was performed according to the AJCC TNM staging system (8th edition). After overnight fasting, serum biomarkers, such as albumin, total cholesterol, TG, low-density lipoprotein (LDL), high-density lipoprotein (HDL), neutrophil count, lymphocyte count, and blood glucose levels were collected within 24 hours of admission. All measurements were standardized to minimize variations due to laboratory equipment.
Definition of peripheral blood metabolic indicators
Four peripheral blood metabolic indicators were used to assess metabolic status: LHR (low-density lipoprotein cholesterol/high-density lipoprotein cholesterol), TCHR (cholesterol/high-density lipoprotein cholesterol), TGHR (triglycerides/high-density lipoprotein cholesterol), and TyG (Ln [TG (mg/dL) ×mg/(mg/dL)]/2) (23, 24). The optimal cutoff values for each indicator were determined using the maximum rank statistics method.
Study observation endpoint
The primary endpoint of this study was postoperative recurrence. Overall survival (OS) was measured in months, defined as the time from admission to death or the last follow-up. Disease-free survival (DFS) was defined as the time from randomization to disease recurrence or death due to disease progression. Clinical outcome data were collected through regular follow-ups or via telephone.
Statistical analysis
Continuous variables are presented as means eantandard deviation or medians with interquartile range (IQR), while categorical variables are expressed as counts and percentages (n, %). The comparison of continuous variables was performed using independent t-tests or non-parametric tests, and categorical variables were compared using chi-square tests or Fisher’s exact test. Covariates and potential confounders were selected based on prior studies. Univariate and multivariable Cox regression analyses were used to assess hazard ratios (HRs) and 95% confidence intervals (CIs) for key prognostic factors affecting overall survival. Subgroup and sensitivity analyses were also conducted. Kaplan-Meier curves and log-rank tests were employed to depict survival trends and compare survival rates between groups. The predictive value of different models for recurrence in LAGC patients was assessed using receiver operating characteristic (ROC) curves. A two-sided p-value < 0.05 was considered statistically significant. All statistical analyses were performed using R software version 4.1.1 (https://www.r-project.org/).
Result
Association between four peripheral blood metabolic markers and clinical-pathological features in patients with LAGC
This retrospective study analyzed data from 3799 patients diagnosed with LAGC at two medical centers between 2010 and 2019. After applying inclusion and exclusion criteria, 1040 patients were included in the final analysis (detailed screening process shown in Figure 1). Table 1 illustrates the relationships between clinical characteristics and different metabolic marker groups (LHR, P, TCHR, and TyG). Regarding gender, 66.6% of males were in the LHR high group, and 66.7% of females were in the TyG low group. The proportion of females was higher in both the LHR low and TyG high groups (43.2% and 42.7%, respectively). Age distribution was similar between patients ≤65 years and >65 years, with no significant differences across groups (P > 0.05). In the TNM staging, most patients were classified as stage III (61.0%), with a higher concentration of stage III patients in the LHR high (51.9%) and TyG low (78.6%) groups.
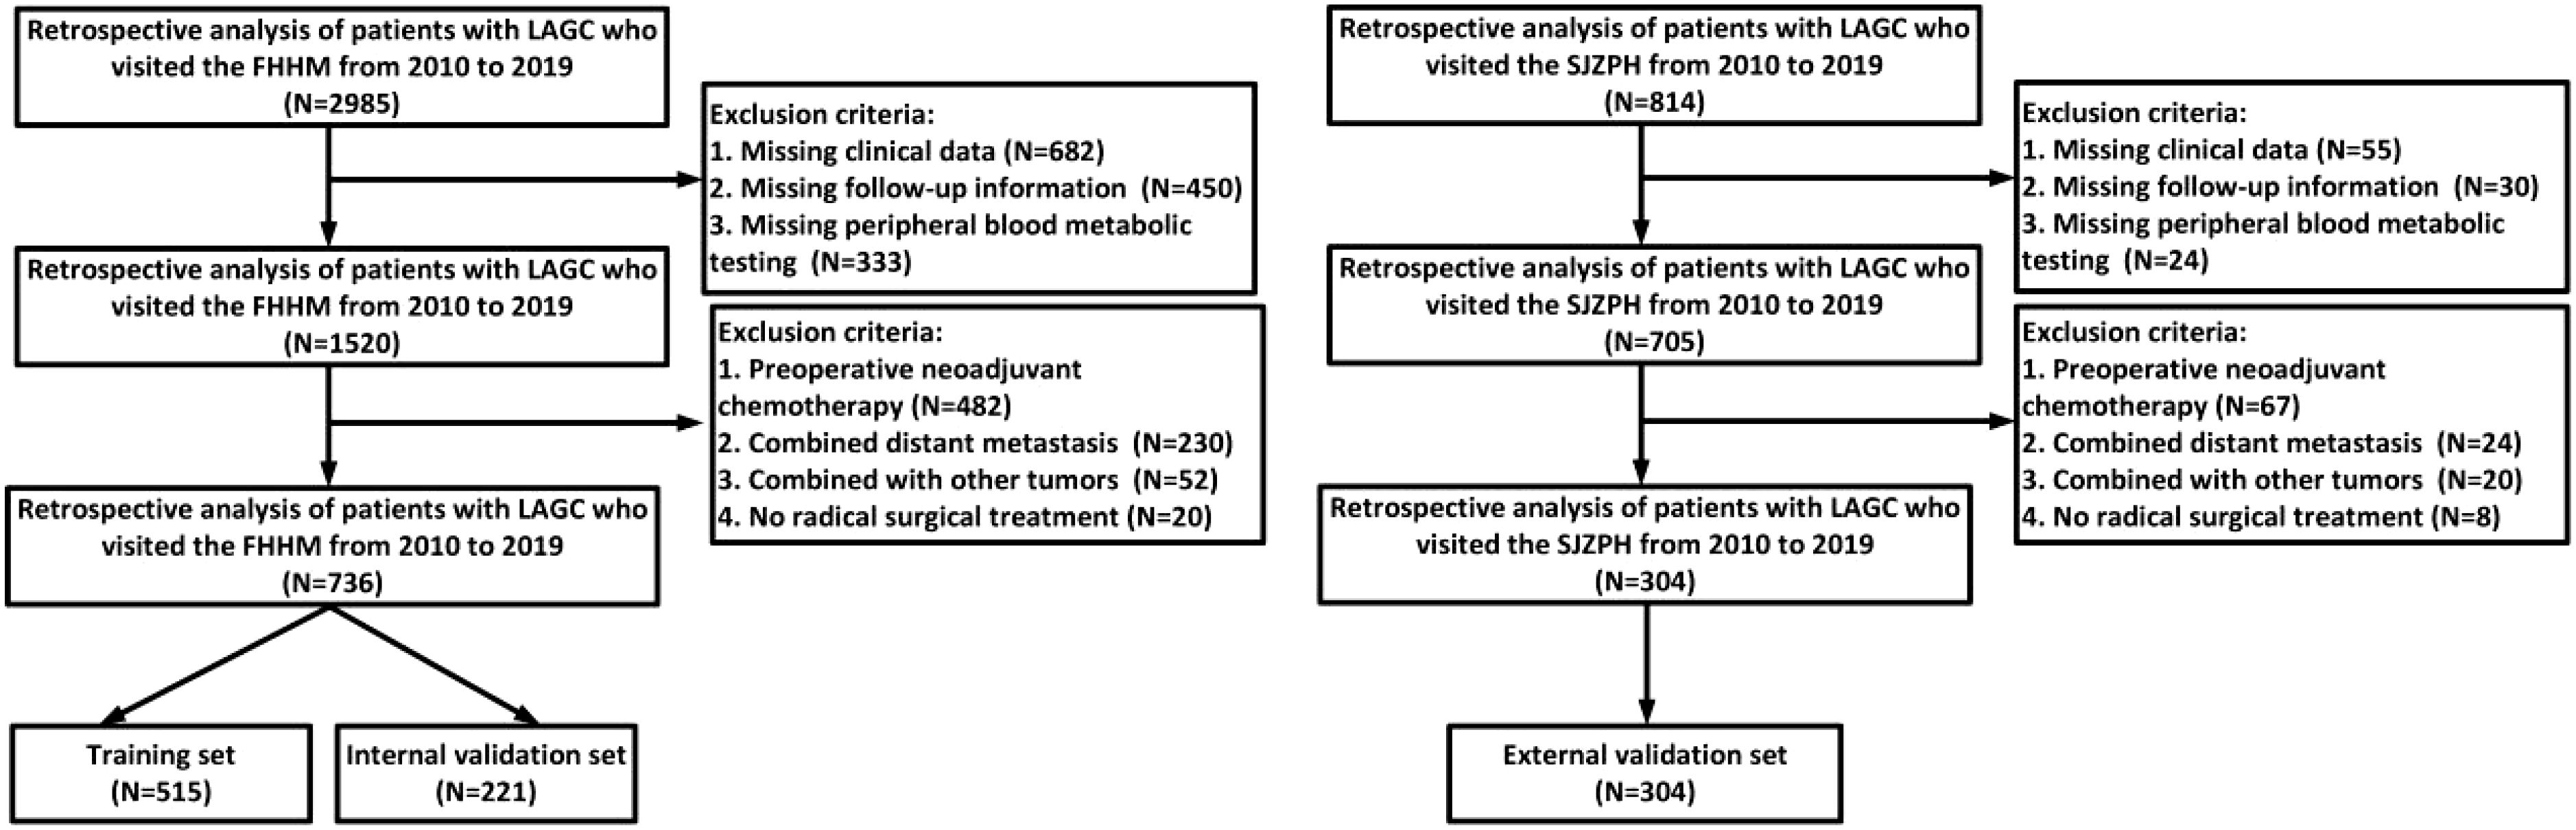
Figure 1. Flowchart of inclusion and exclusion of LAGC patients in this study.
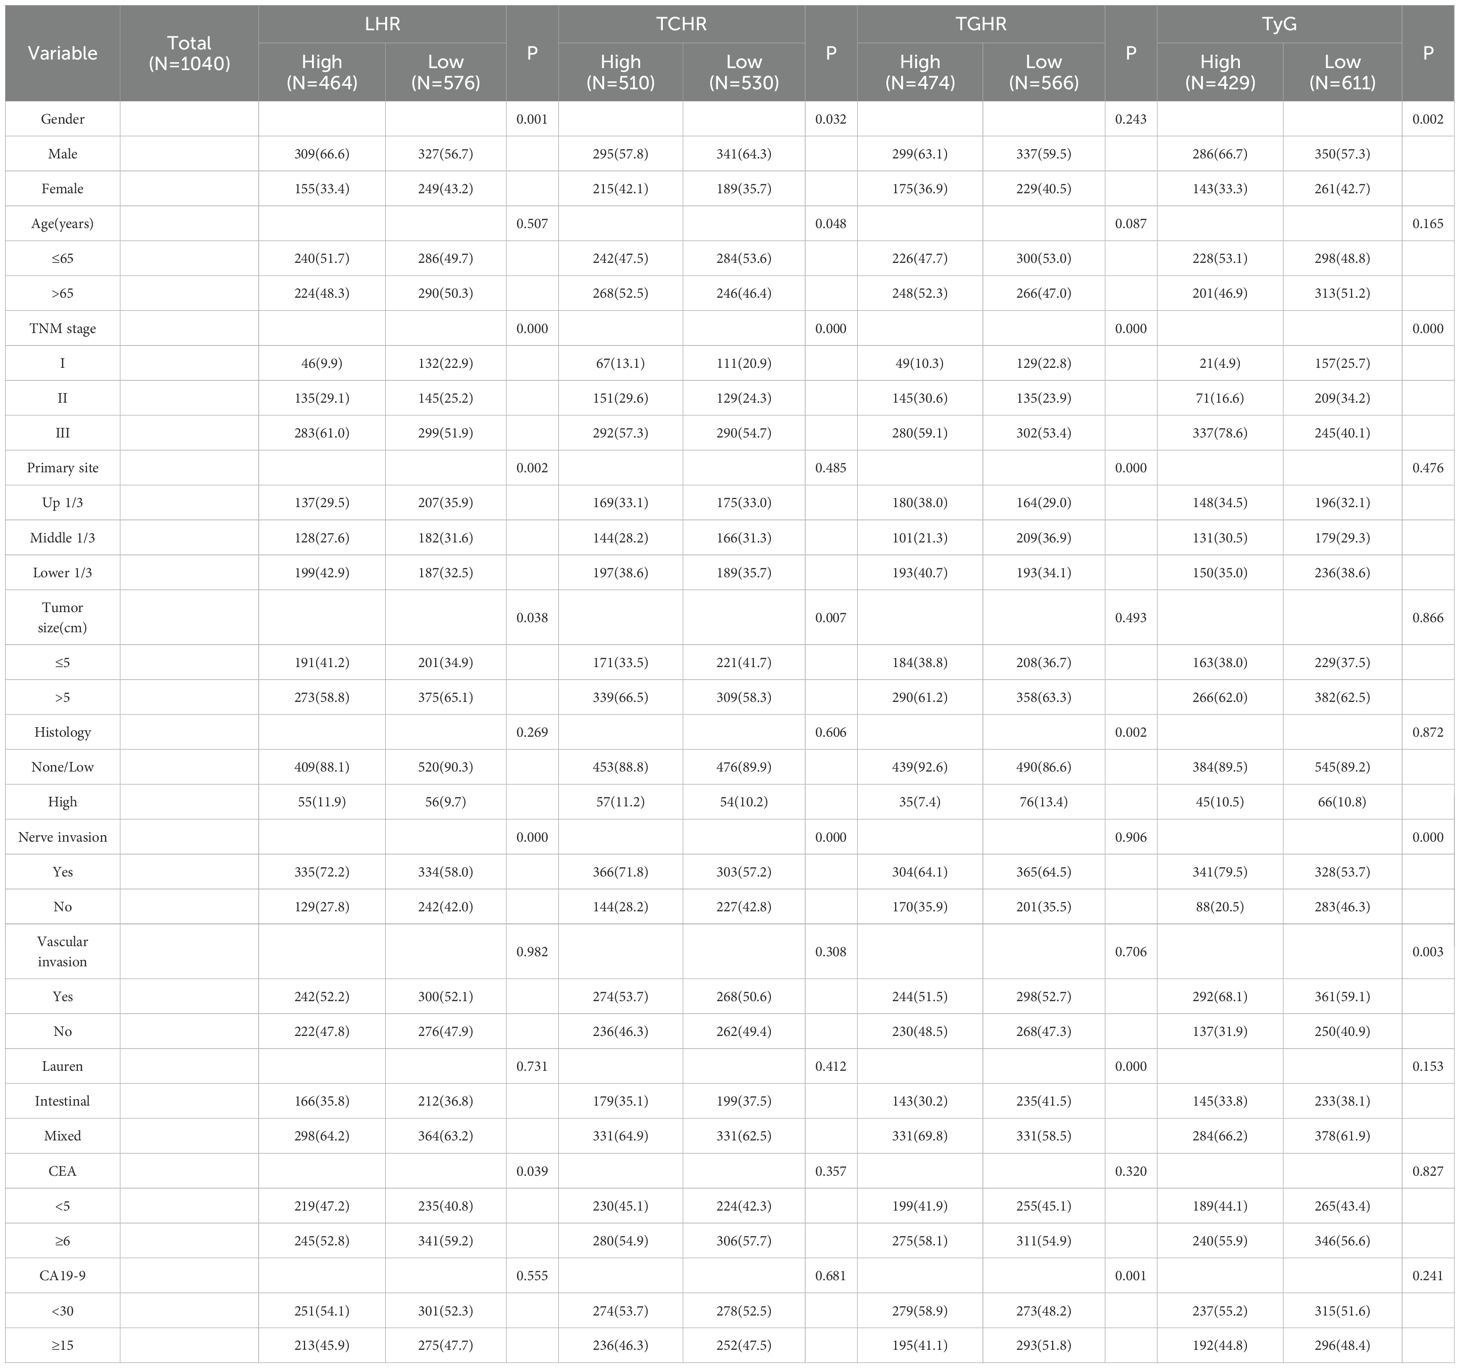
Table 1. Relationship between peripheral blood metabolic indexes and clinicopathological characteristics of patients with gastric cancer.
For tumor location, the proportion of tumors located in the lower third was higher in the LHR low (38.6%) and TCHR high (38.6%) groups. Regarding tumor size, 58.8% of patients had tumors larger than 5 cm, with 65.1% of patients in the LHR high group having tumors larger than 5 cm. The incidence of nerve infiltration was higher overall (72.2%), with higher rates in the LHR high (58.0%) and TyG low (79.5%) groups. While no significant difference was found for vascular infiltration (P > 0.05), the proportion of vascular infiltration was higher in the TyG high group (68.1%). Regarding Lauren classification, 64.2% of patients had the mixed type, with similar proportions observed across the LHR and TyG groups. Overall, the metabolic markers LHR, P, TCHR, and TyG were associated with clinical features such as gender, TNM stage, tumor size, and infiltration, which may influence the clinical presentation and prognosis of patients.
Comparison of clinical features across different datasets
There were no significant differences in clinical characteristics, including gender, age, TNM stage, tumor location, tumor size, histological type, and the presence of nerve or vascular invasionicalic the three datasets (training, internal validation, and external validation) (P > 0.05). Gender distribution was relatively balanced across the groups, with males comprising approximately 60% and females 40%. The proportion of patients aged 65 years or younger was similar across all groups. Most patients were classified as stage III in TNM staging, with similar proportions across the groups. Additionally, there were no significant differences in tumor location, size, histological type, or Lauren classification. The incidence of nerve and vascular invasion showed minimal variation between the datasets. Overall, the clinical features across the different datasets were consistent, with no significant differences observed. Table 2 provides a detailed comparison of clinical and pathological features across the different datasets.
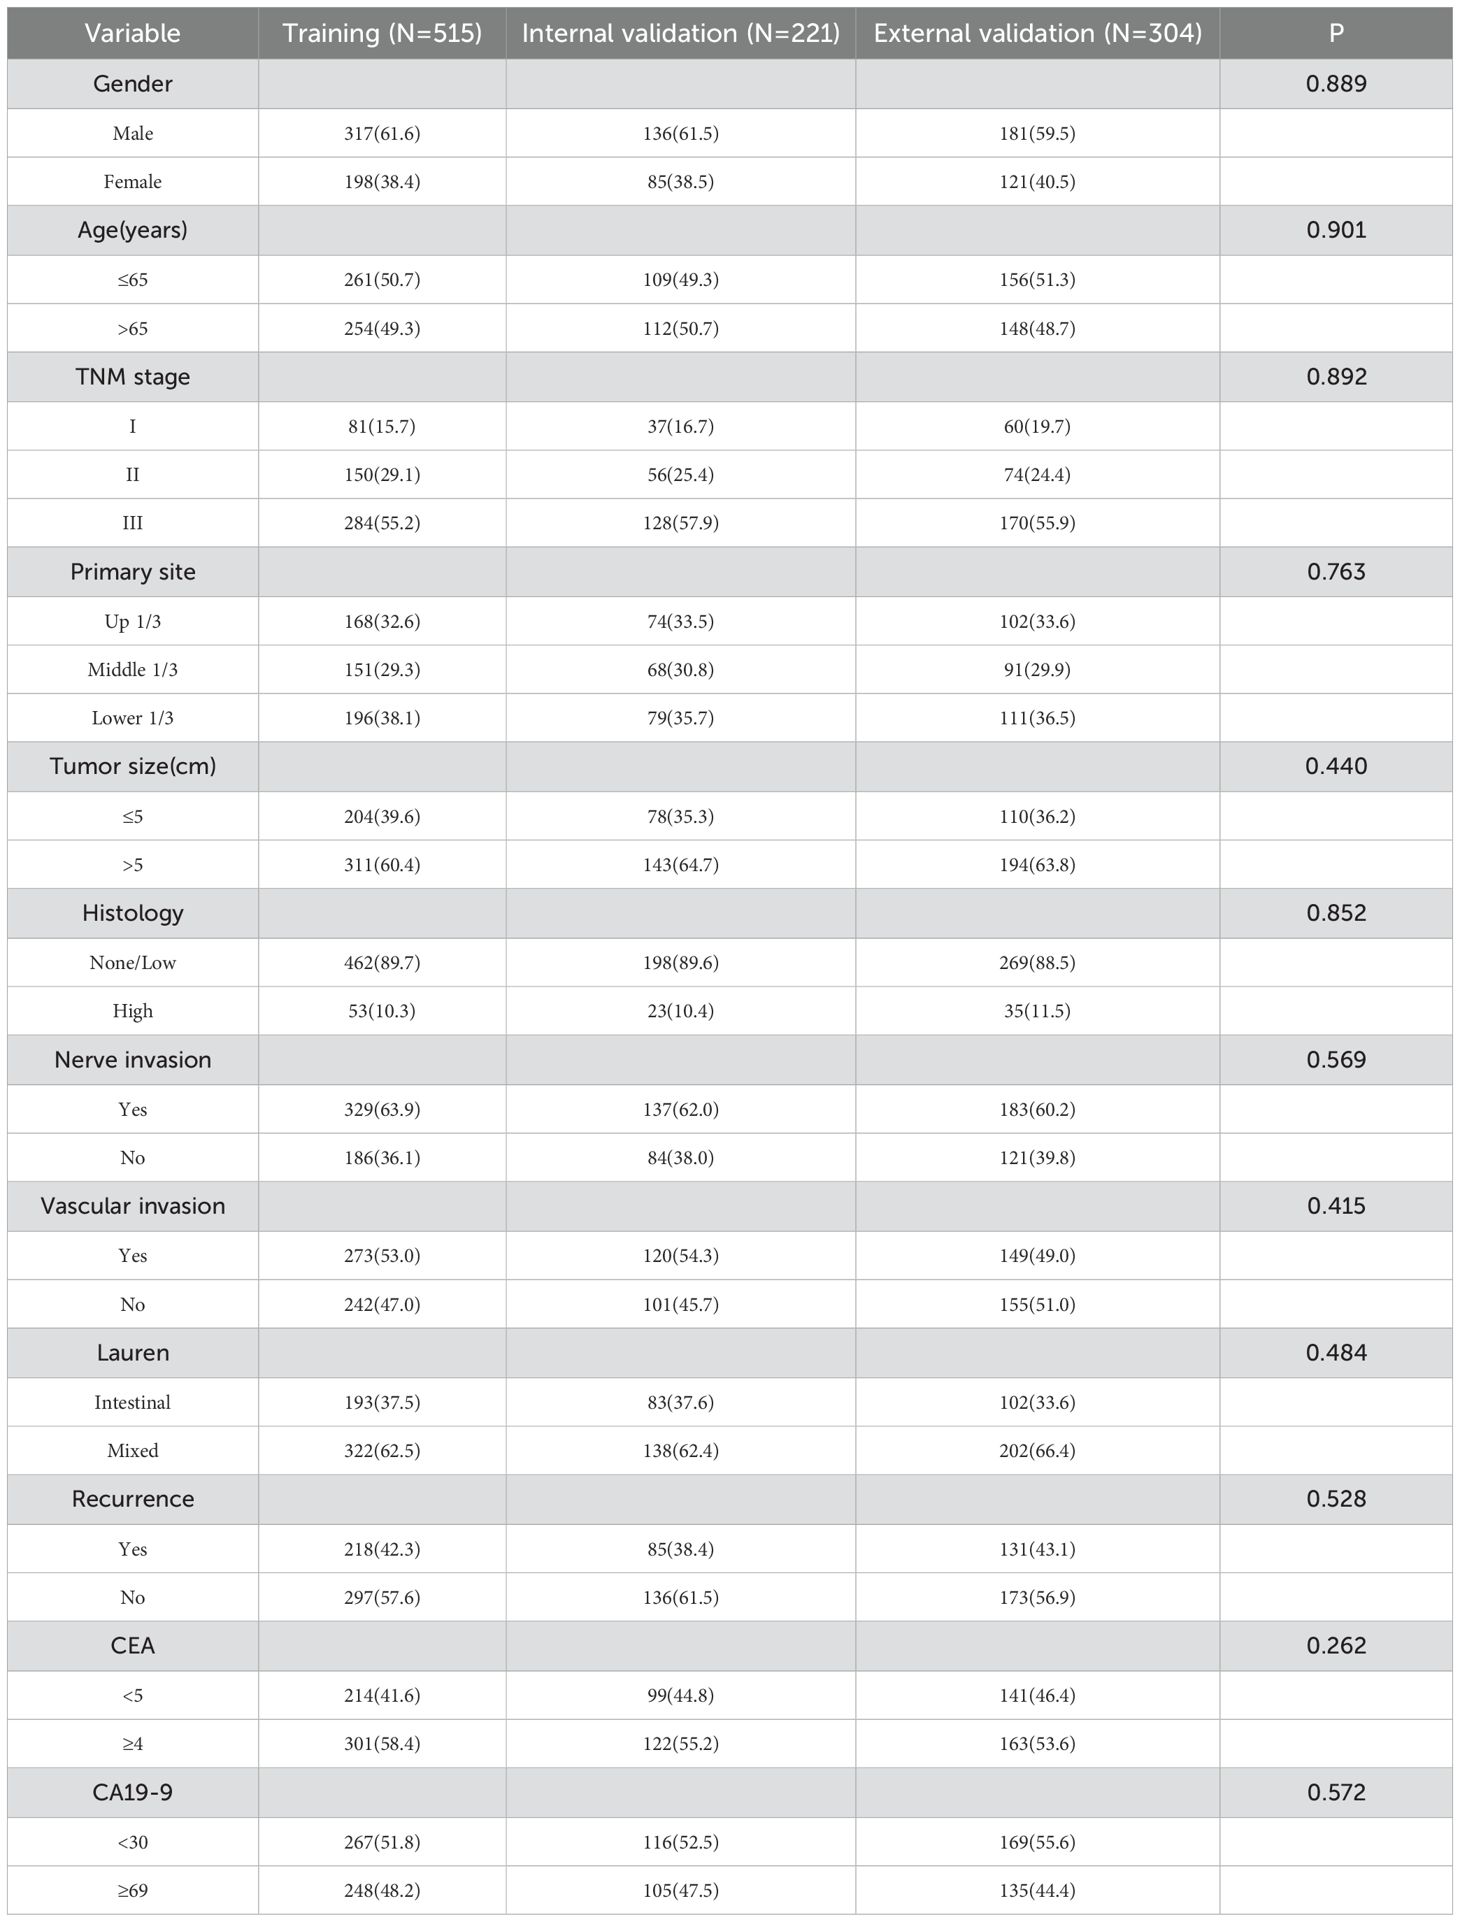
Table 2. Comparison of clinical characteristics of patients in the training set and validation set.
Development of a predictive model for postoperative recurrence in LAGC patients based on four peripheral blood metabolic markers
We first analyzed the impact of four metabolic markers on the postoperative recurrence of LAGC patients following radical surgery. Multivariable logistic regression analysis revealed that high levels of LHR, TCHR, TGHR, and TyG were significantly associated with recurrence. As shown in Table 3, in the training set, the OR for LHR, TCHR, TGHR, and TyG were 4.352 (95% CI: 2.847-6.650), 3.342 (95% CI: 2.165-5.160), 2.839 (95% CI: 1.853-4.350), and 4.245 (95% CI: 2.751-6.548), respectively, all with P-values < 0.001. In the internal validation set, LHR (OR = 3.616, 95% CI: 1.866-7.004), TCHR (OR = 3.568, 95% CI: 1.768-7.201), TGHR (OR = 3.605, 95% CI: 1.863-6.977), and TyG (OR = 4.273, 95% CI: 2.124-8.597) also showed significant associations (P < 0.001). In the external validation set, LHR (OR = 4.210, 95% CI: 2.424-7.313), TCHR (OR = 3.824, 95% CI: 2.188-6.683), TGHR (OR = 3.009, 95% CI: 1.731-5.230), and TyG (OR = 3.767, 95% CI: 2.143-6.620) similarly demonstrated strong predictive capabilities (P < 0.001). These findings suggest that these metabolic markers are independent predictors of gastric cancer recurrence, and based on this, we developed a comprehensive metabolic score using these four markers.
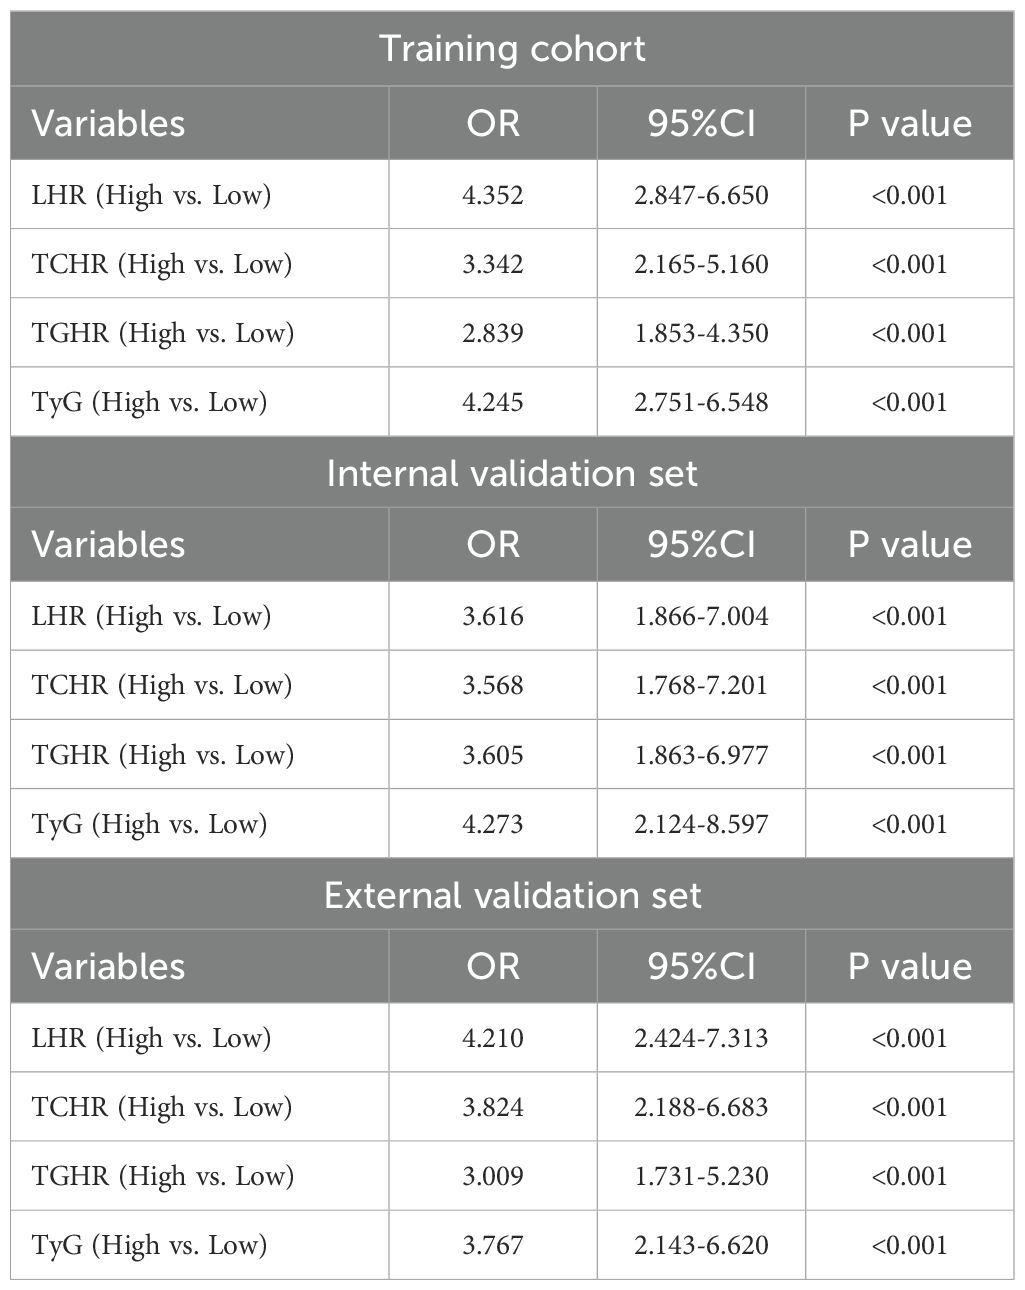
Table 3. Multivariable logistic regression analysis of peripheral blood metabolic markers and recurrence of locally advanced gastric cancer.
Further multivariable analysis identified TNM stage, pathological type, SII, and metabolic score as significant predictors of postoperative recurrence in LAGC. In the training cohort, the risk of recurrence in stage III patients was 7.31 times higher than in stage I/II patients (OR = 7.312, 95% CI: 3.345-10.563, P < 0.001), while patients with high pathological types had a 2.24-fold increased risk compared to those with low or no pathological types (OR = 2.242, 95% CI: 1.323-4.672, P = 0.005). The recurrence risk for patients in the high SII group was 1.62 times higher than in the low SII group (OR = 1.623, 95% CI: 1.242-3.679, P = 0.010), and the risk for those in the high metabolic score group was 5.21 times higher than in the low score group (OR = 5.206, 95% CI: 3.633-9.220, P < 0.001) (Table 4). Based on these findings, we constructed a nomogram for predicting postoperative recurrence in LAGC patients (Figure 2A).
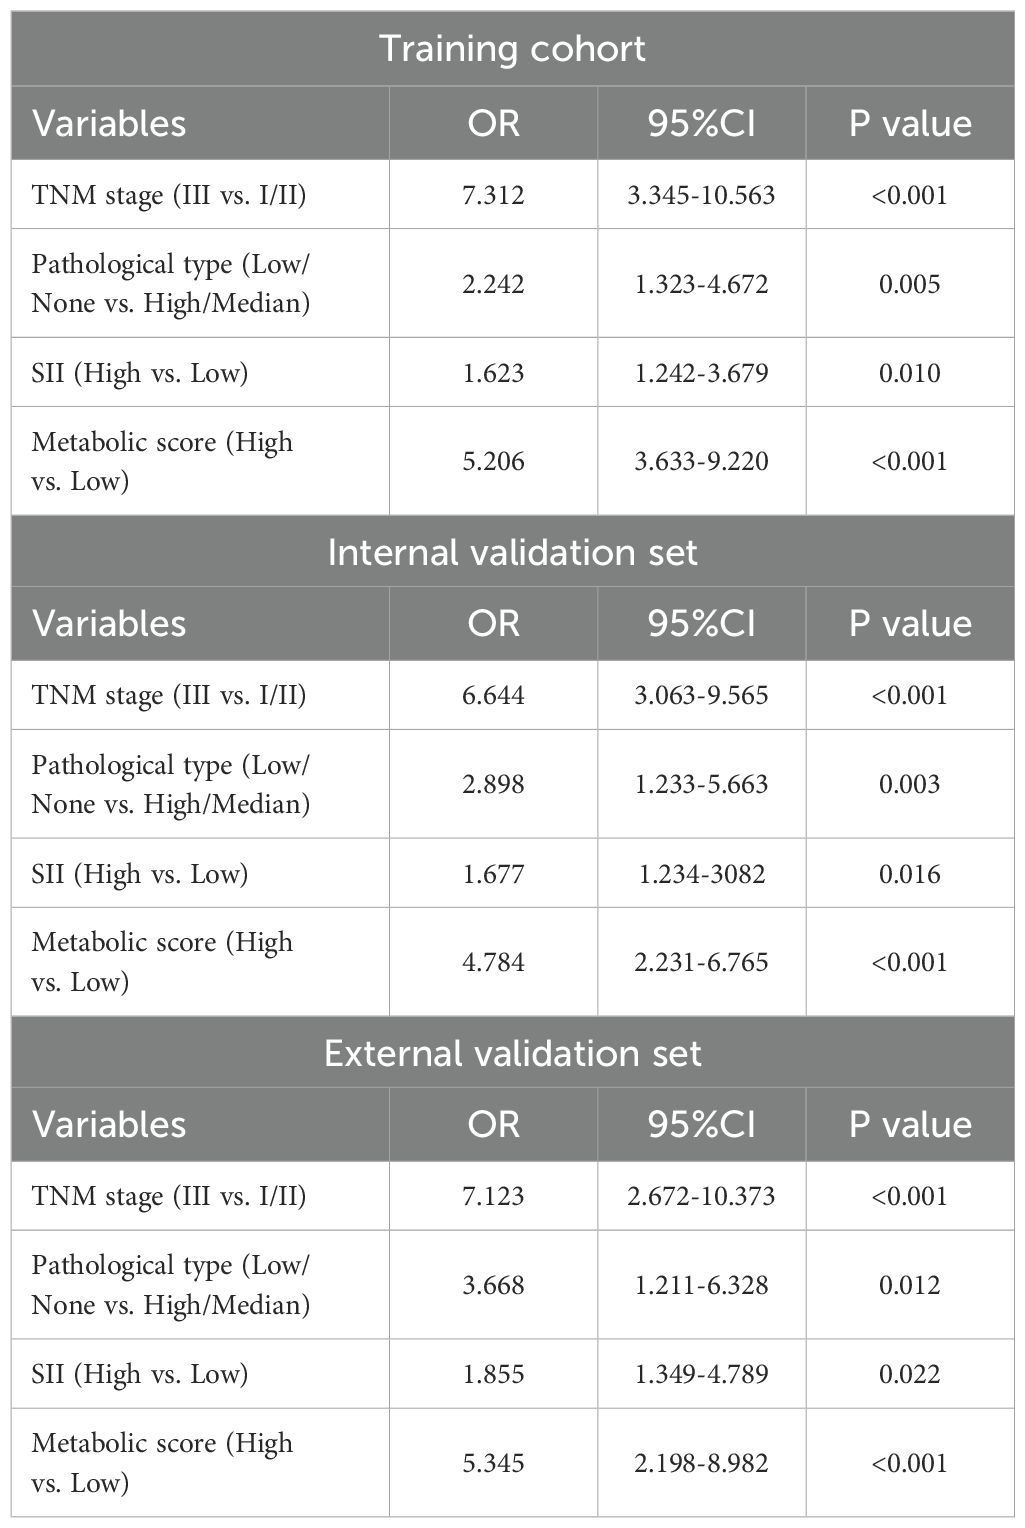
Table 4. Multivariable analysis of factors affecting recurrence in patients with locally advanced gastric cancer.
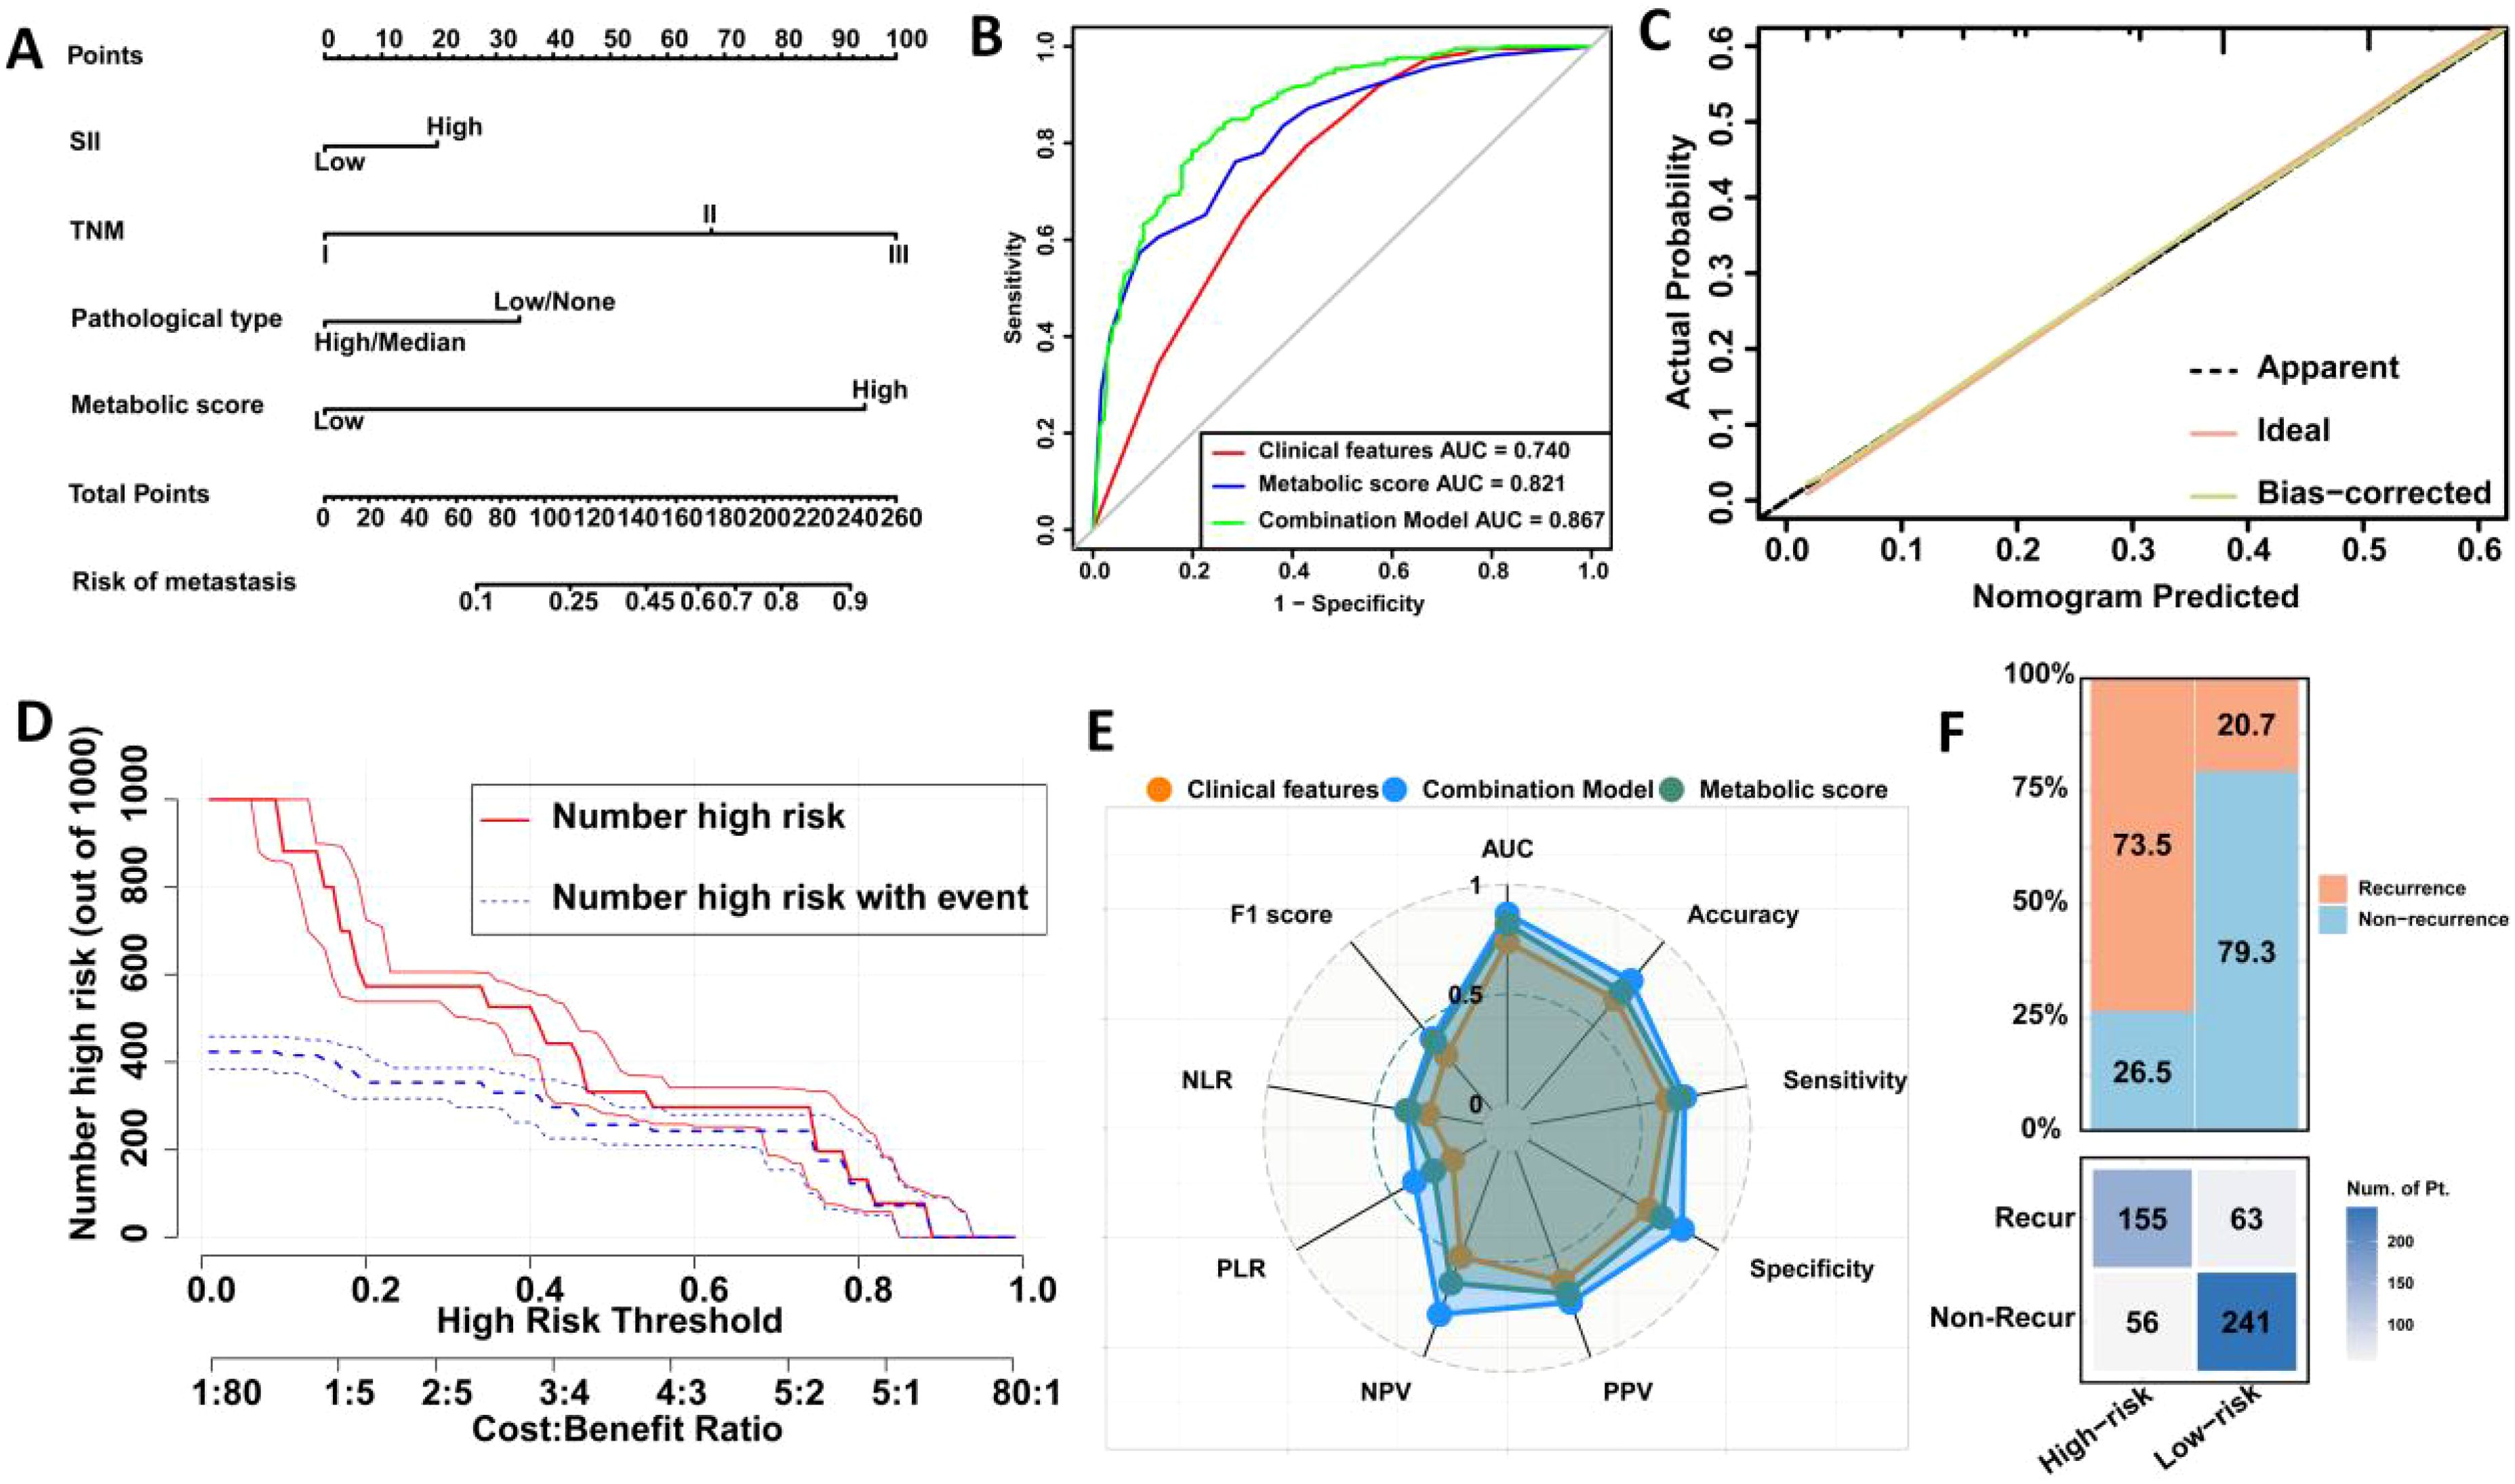
Figure 2. Construction and validation of a prediction model for postoperative recurrence in LAGC patients based on peripheral blood metabolic indicators. (A) Visual nomogram based on training set; (B) Comparison of ROC curve areas of different prediction models; (C) Calibration curve; (D) Clinical impact curve; (E) Radar chart; (F) Confusion matrix. AUC, Area under the curve; NLR, Negative Likelihood Ratio; PLR, Positive Likelihood Ratio; NPV, Negative Predictive Value; PPV, Positive Predictive Value; Recur, recurrence; Non-Recur, Non-recurrence.
ROC curve analysis indicated that the metabolic score model outperformed clinical features alone, with an AUC of 0.821 versus 0.740 (Delong test, p = <0.001) (Figure 2B). When combining clinical features with the metabolic score, the predictive AUC increased to 0.867 (95% CI: 0.836-0.897), significantly surpassing the performance of clinical features alone (0.867 vs. 0.740, Delong test, p = 0.001) or metabolic score alone (0.867 vs. 0.821, Delong test, p <0.001). Calibration curves further confirmed the strong predictive performance of the nomogram (Figure 2C). Clinical impact curve analysis demonstrated that the nomogram provided superior net benefits across a wide range of threshold probabilities, supporting the clinical value of the combined model (Figure 2D). Additionally, radar chart and confusion matrix analyses revealed that the combined model performed better than using clinical features or metabolic scores alone in the training set. The combined model in the training set achieved an AUC of 0.867, with an accuracy of 76.8%, sensitivity of 71.1%, and specificity of 81.1% (Figures 2E, F, Table 5).
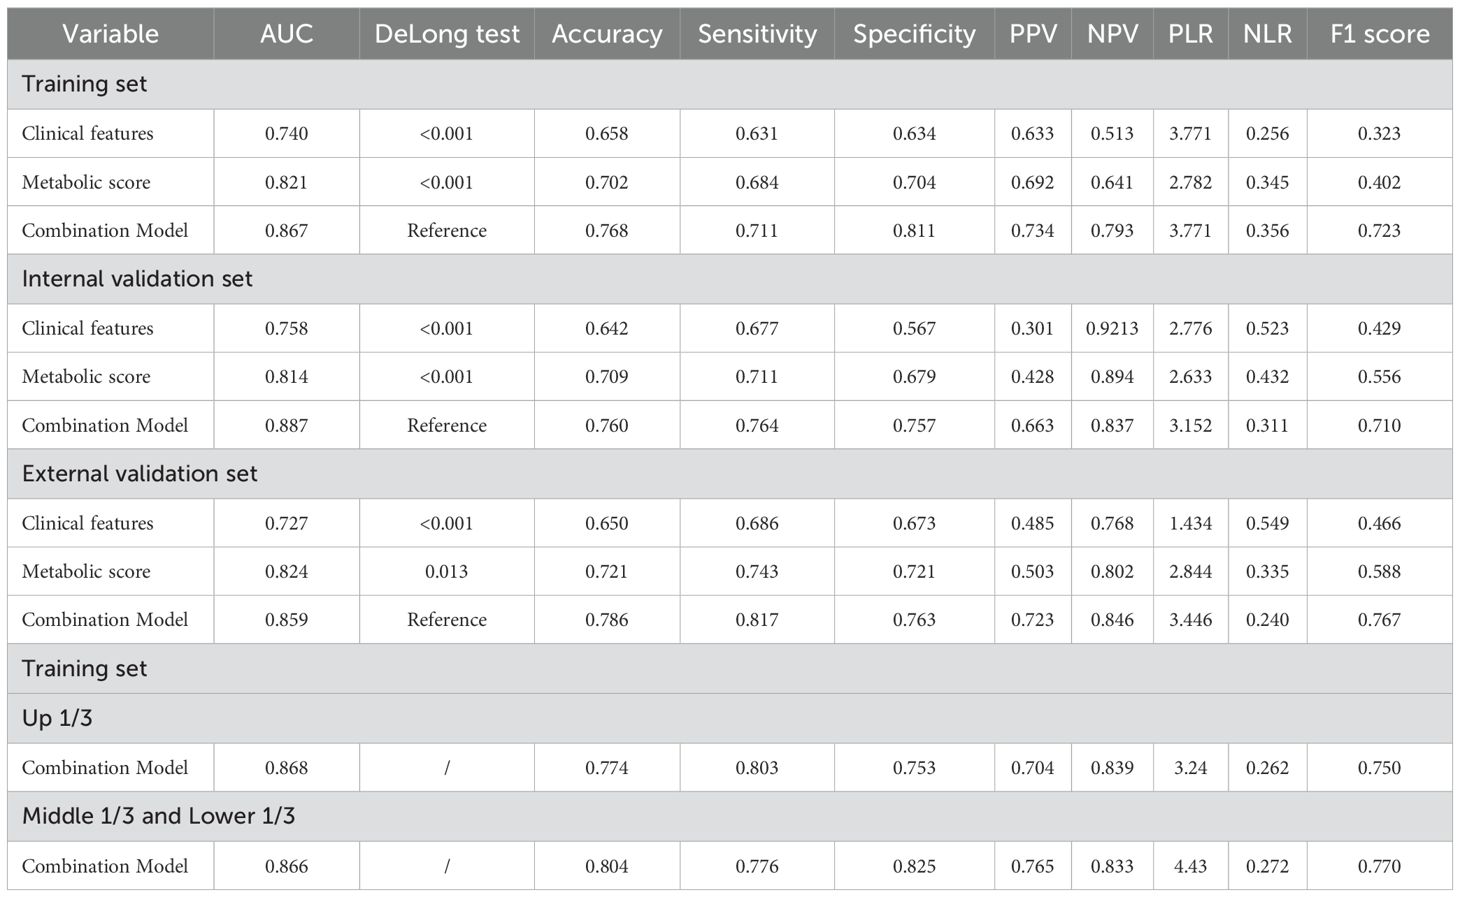
Table 5. Comparison of performance indicators of different models for predicting recurrence of locally advanced gastric cancer.
Validation of a predictive model for postoperative recurrence in LAGC patients based on four peripheral blood metabolic markers
We first analyzed the predictive performance of the model in the internal validation set. The OR for various factors were as follows: TNM stage (OR = 6.64, 95% CI: 3.063-9.565, P < 0.001), pathological type (OR = 2.90, 95% CI: 1.233-5.663, P = 0.003), SII (OR = 1.68, 95% CI: 1.234-3.082, P = 0.016), and metabolic score (OR = 4.78, 95% CI: 2.231-6.765, P < 0.001). In the external validation set, the OR values were: TNM stage (OR = 7.12, 95% CI: 2.672-10.373, P < 0.001), pathological type (OR = 3.67, 95% CI: 1.211-6.328, P = 0.012), SII (OR = 1.86, 95% CI: 1.349-4.789, P = 0.022), and metabolic score (OR = 5.35, 95% CI: 2.198-8.982, P < 0.001). These results demonstrate that TNM stage, pathological type, SII, and metabolic score are significant predictors of recurrence in locally advanced gastric cancer across both validation sets (Tables 3, 4).
Next, we plotted ROC curves in the internal validation set, which revealed that the combined model outperformed both clinical features alone (AUC = 0.887 vs. 0.758, Delong test, p < 0.001) and metabolic score alone (AUC = 0.887 vs. 0.814, Delong test, p < 0.001) (Figure 3A). Similar results were observed in the external validation set (Figure 3F). Calibration curve analysis further confirmed the robust predictive performance of the combined model in both internal and external validation sets (Figures 3B, G). Clinical impact curve analysis showed that the nomogram provided superior net benefit over a wide range of threshold probabilities, indicating the significant predictive value of the combined model (Figures 3D, I).
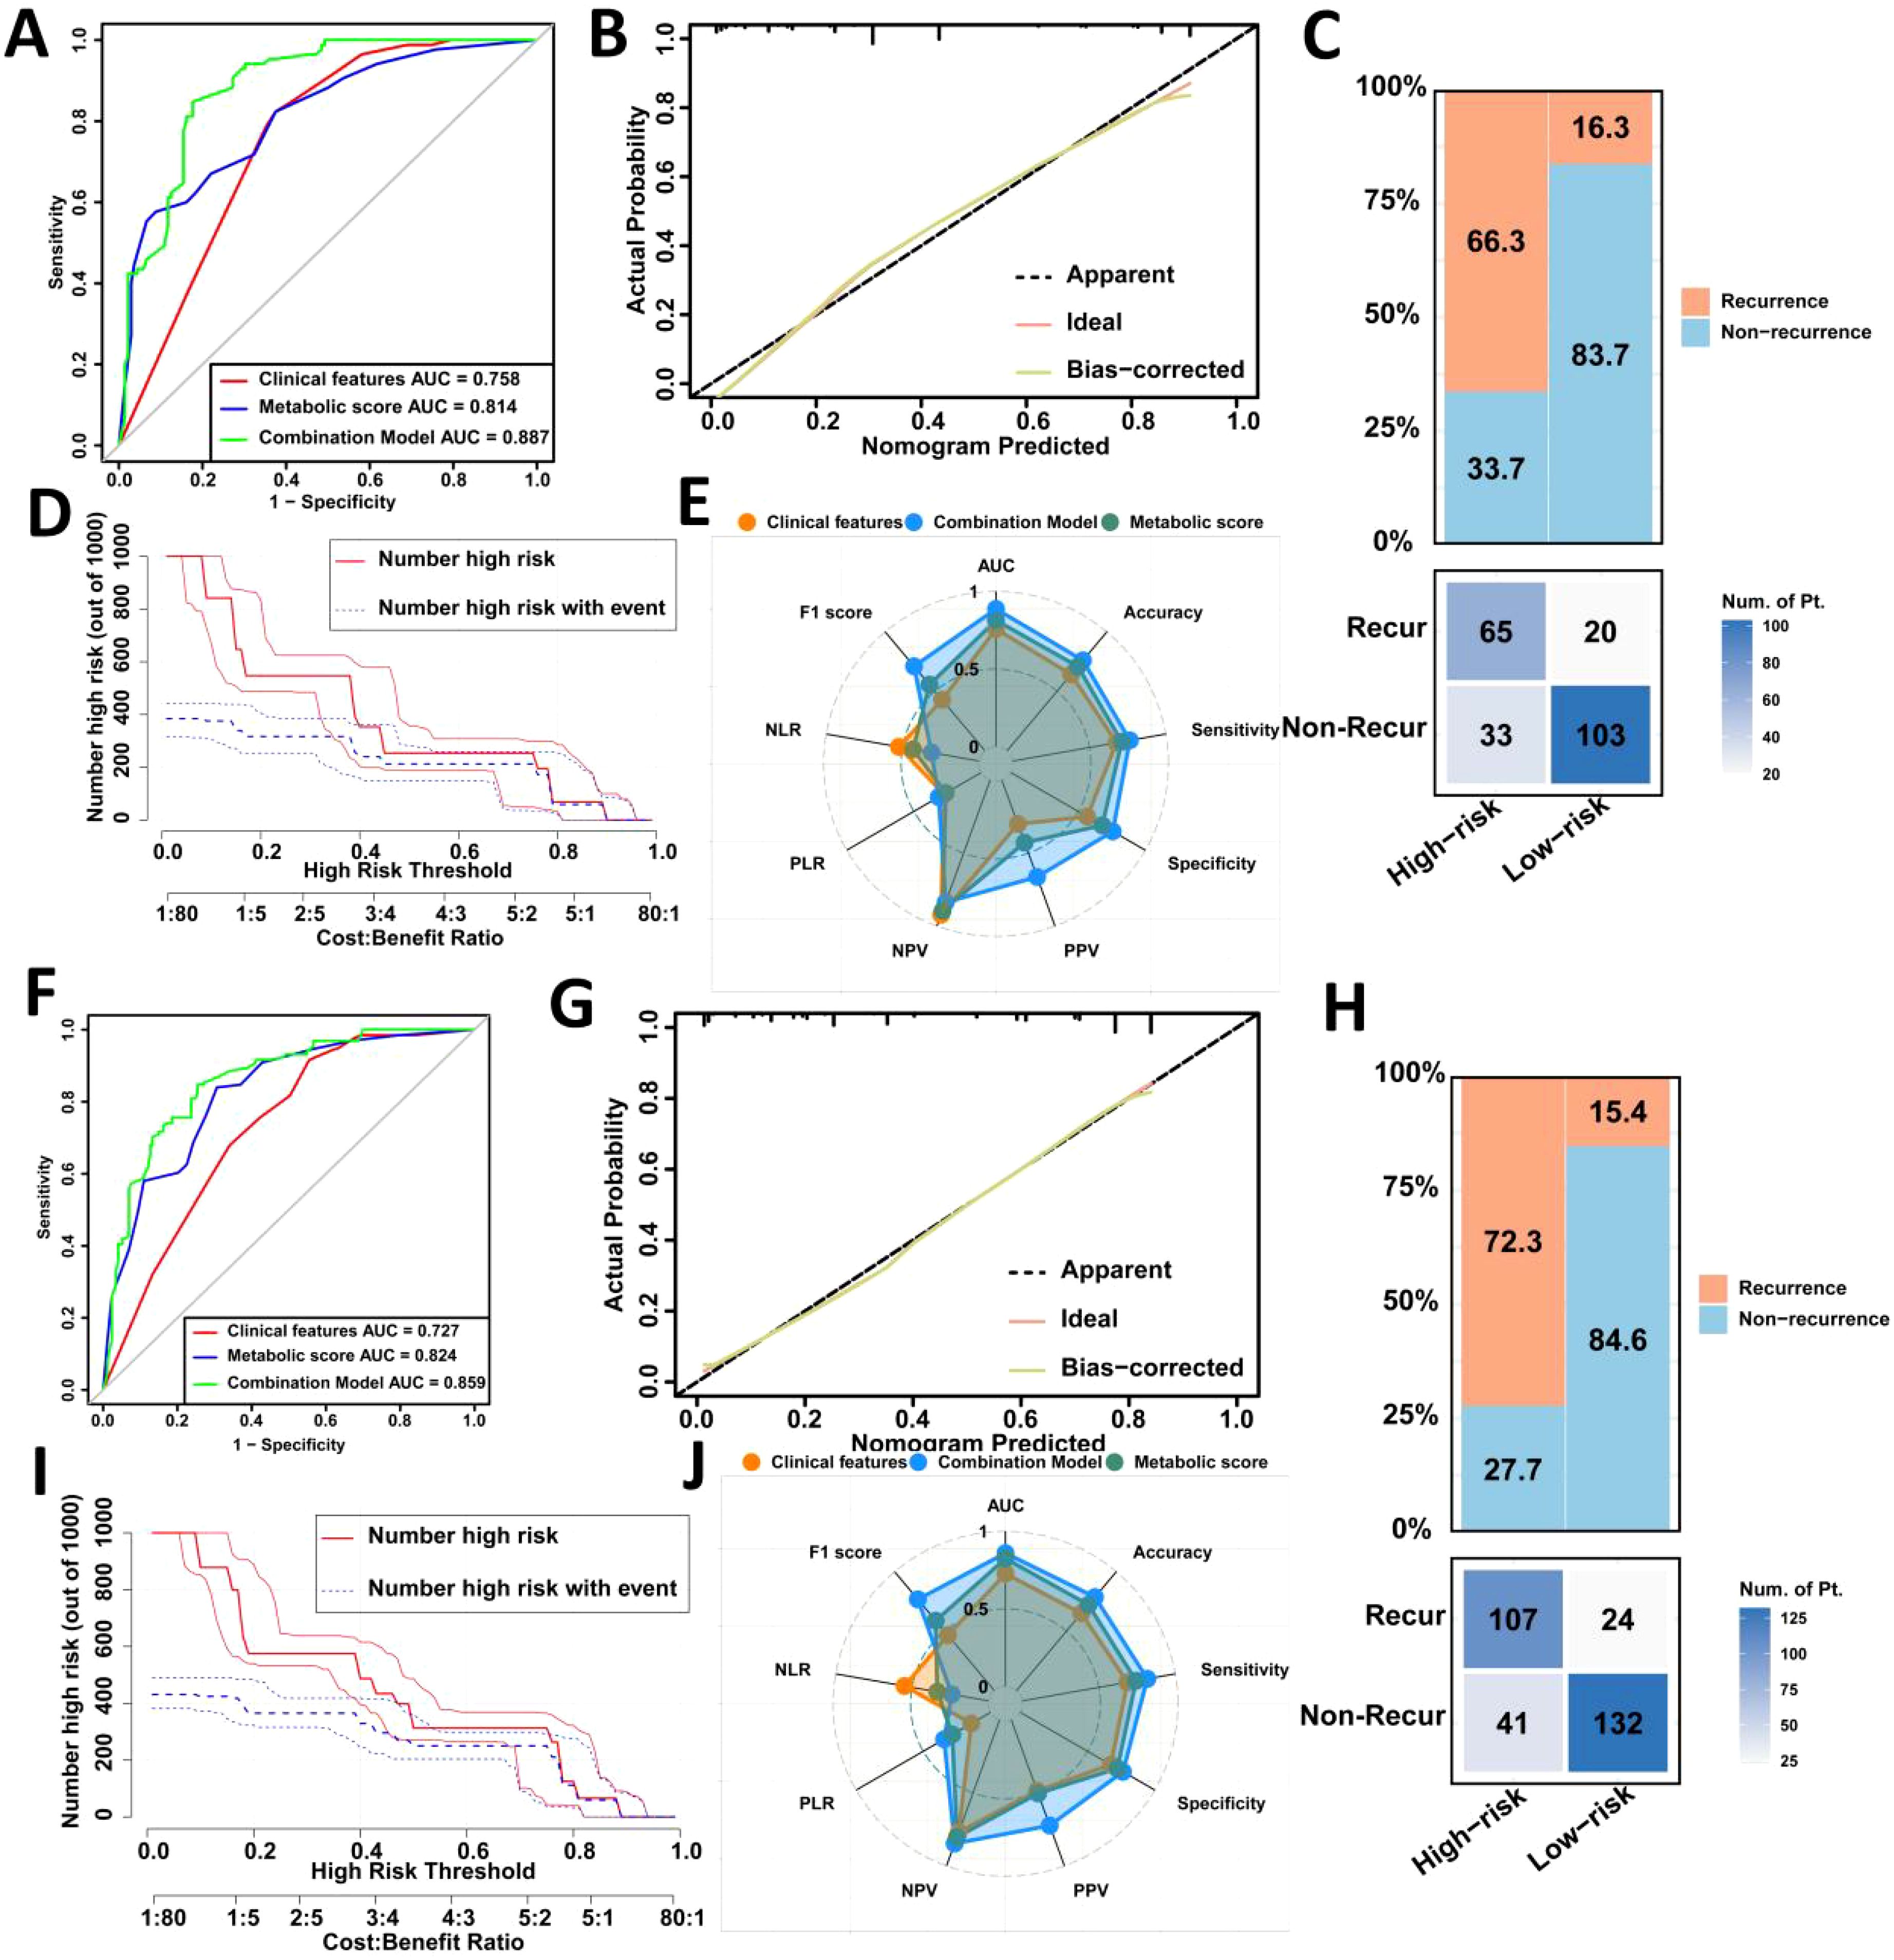
Figure 3. Validation of the prediction model for postoperative recurrence in LAGC patients in the internal validation set and the external validation set. (A) Comparison of ROC curve areas of different prediction models in the internal validation set; (B) Calibration curve in the internal validation set; (C) Confusion matrix in the internal validation set; (D) Clinical impact curve in the internal validation set; (E) Radar chart in the internal validation set; (F) Comparison of ROC curve areas of different prediction models in the external validation set; (G) Calibration curve in the external validation set; (H) Confusion matrix in the external validation set; (I) Clinical impact curve in the external validation set; (J) Radar chart in the external validation set. AUC, Area under the curve; NLR, Negative Likelihood Ratio; PLR, Positive Likelihood Ratio; NPV, Negative Predictive Value; PPV, Positive Predictive Value; Recur, recurrence; Non-Recur, Non-recurrence.
Confusion matrix and radar chart analyses revealed that the combined model in the internal validation set achieved excellent results, with an AUC of 0.887, accuracy of 76.0%, sensitivity of 76.4%, and specificity of 75.7% (Figures 3C, E). In the external validation set, the combined model had an AUC of 0.859, accuracy of 78.6%, sensitivity of 81.7%, and specificity of 76.3%, outperforming single-factor models (Figures 3H, J).
Overall, the combined model demonstrated strong predictive capability across multiple performance metrics, particularly in terms of accuracy, sensitivity, and specificity, confirming the effectiveness of integrating clinical features and metabolic scores in predicting gastric cancer recurrence (Table 5).
Comparison of predictive model for postoperative recurrence in LAGC patients based on before and after radical operation four peripheral blood metabolic markers
We collected serum biomarkers for patients within 7 days after surgery compared them with those before surgery, and the results showed no significant differences (Supplementary Table 1). Then we constructed a metabolic score model based on the four serum biomarkers within 7 days after surgery, and ROC curve analysis indicated no significant differences compared to the model using preoperative markers. Subsequently, we integrated clinical features with the metabolic score, with the ROC of 0.858 (0.826-0.889) in the training set, 0.874 (0.828-0.918) in internal validation set, 0.847 (0.804-0.891) in the external validation set. The Delong test results showed that in the train and external validation set, the model based on the preoperative serum biomarkers demonstrated better performance (Supplementary Table 2).
Association between metabolic score based on four peripheral blood metabolic markers and prognosis in LAGC patients
We followed up on 1,040 LAGC patients included in the analysis, evaluating survival outcomes across three datasets. In the training set, patients with high metabolic scores had significantly worse 5-year OS (33.0% vs. 53.0%, P < 0.0001) and DFS (22.6% vs. 47.7%, P < 0.0001) compared to those with low metabolic scores (Figures 4A, B). Similar results were observed in both the internal and external validation sets, where high metabolic score patients showed poorer 5-year OS (internal validation: 25.0% vs. 52.8%, P < 0.0001; external validation: 33.5% vs. 65.1%, P < 0.0001) and DFS (internal validation: 20.8% vs. 44.8%, P < 0.0001; external validation: 31.0% vs. 56.4%, P < 0.0001) (Figures 4C–F).
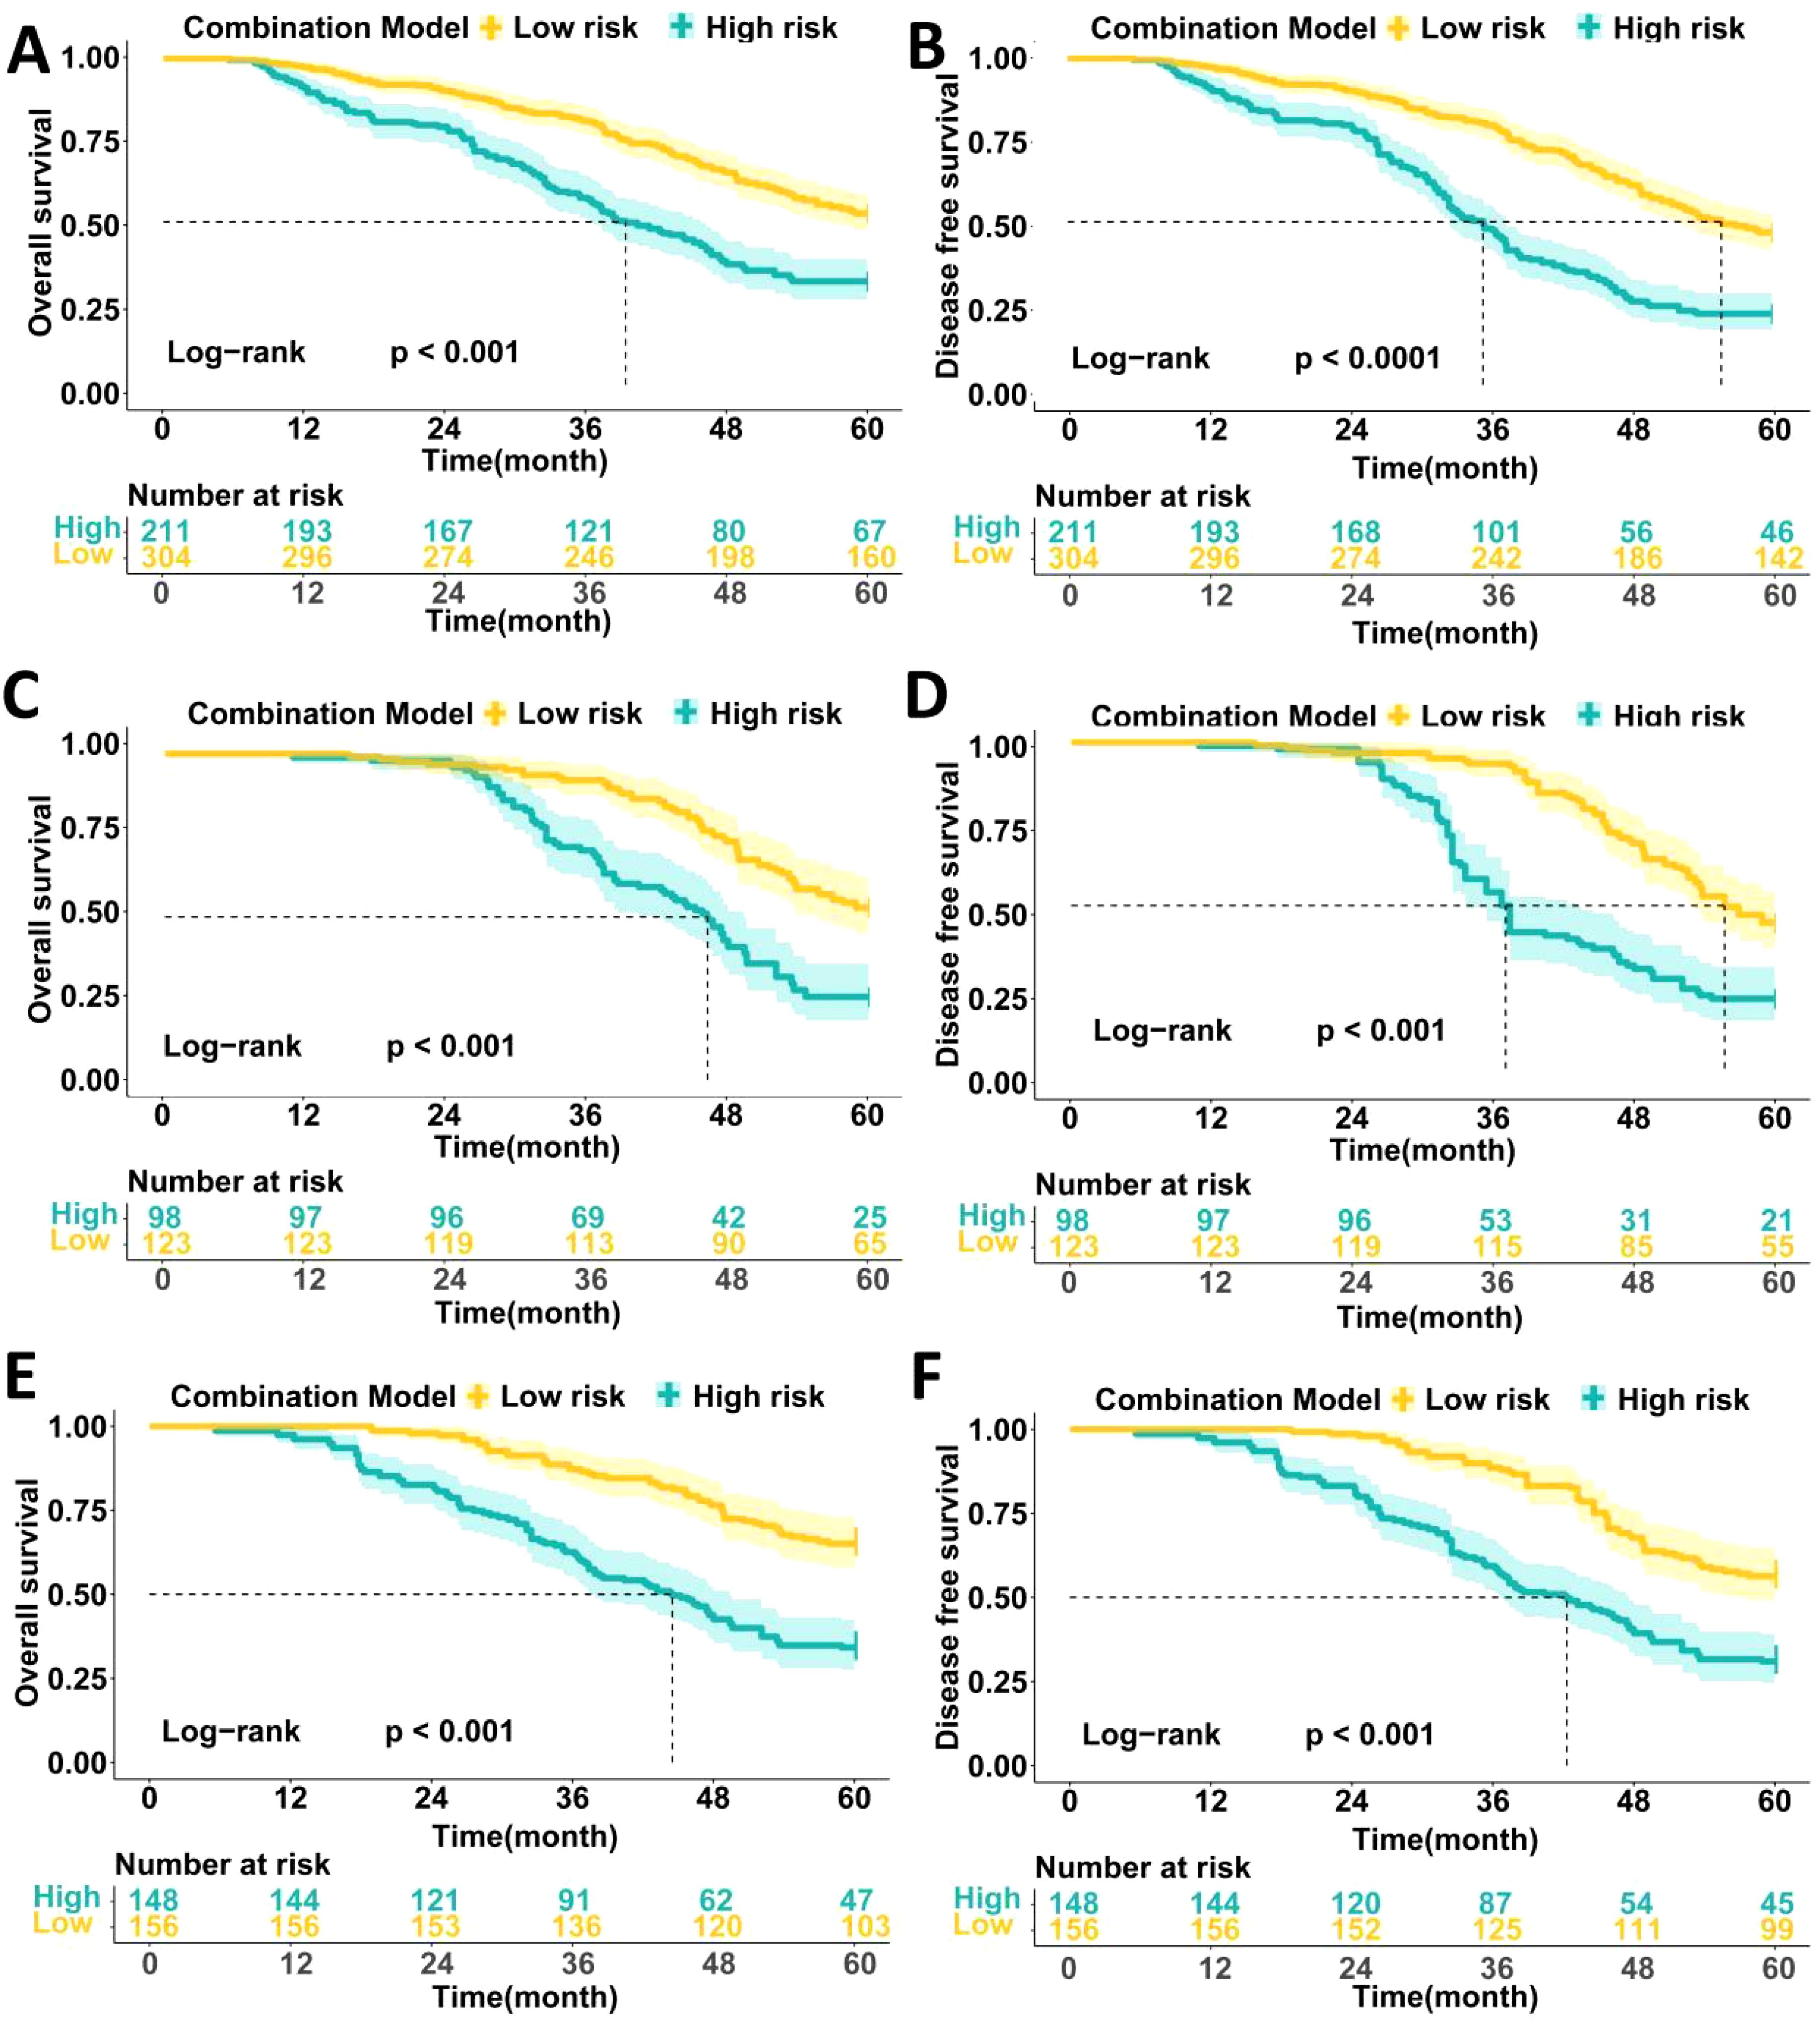
Figure 4. Comparison of the survival prognosis of LAGC patients in three data sets based on high and low expression groups of peripheral blood metabolic scores. (A) Comparison of 5-year OS survival curves of patients with high and low metabolic score groups in the training set; (B) Comparison of 5-year DFS survival curves of patients with high and low metabolic score groups in the training set; (C) Comparison of 5-year OS survival curves of patients with high and low metabolic score groups in the internal validation set; (D) Comparison of 5-year DFS survival curves of patients with high and low metabolic score groups in the internal validation set; (E) Comparison of 5-year OS survival curves of patients with high and low metabolic score groups in the external validation set; (F) Comparison of 5-year DFS survival curves of patients with high and low metabolic score groups in the external validation set.
Cox multivariable analysis revealed that TNM stage, pathological type, and metabolic score are independent prognostic factors for 5-year OS in locally advanced gastric cancer patients. In univariate analysis, patients with stage III disease had a significantly higher risk than those with stages I/II (HR = 4.469, P < 0.001), while patients with high pathological type had a greater survival risk compared to those with low/no pathological type (HR = 3.323, P = 0.002). Patients with high metabolic scores had a significantly shorter survival compared to those with low scores (HR = 4.245, P = 0.001). Multivariable analysis further confirmed TNM stage (HR = 5.223, P < 0.001), pathological type (HR = 2.423, P = 0.011), and metabolic score (HR = 3.785, P = 0.001) as independent prognostic factors (Table 6).
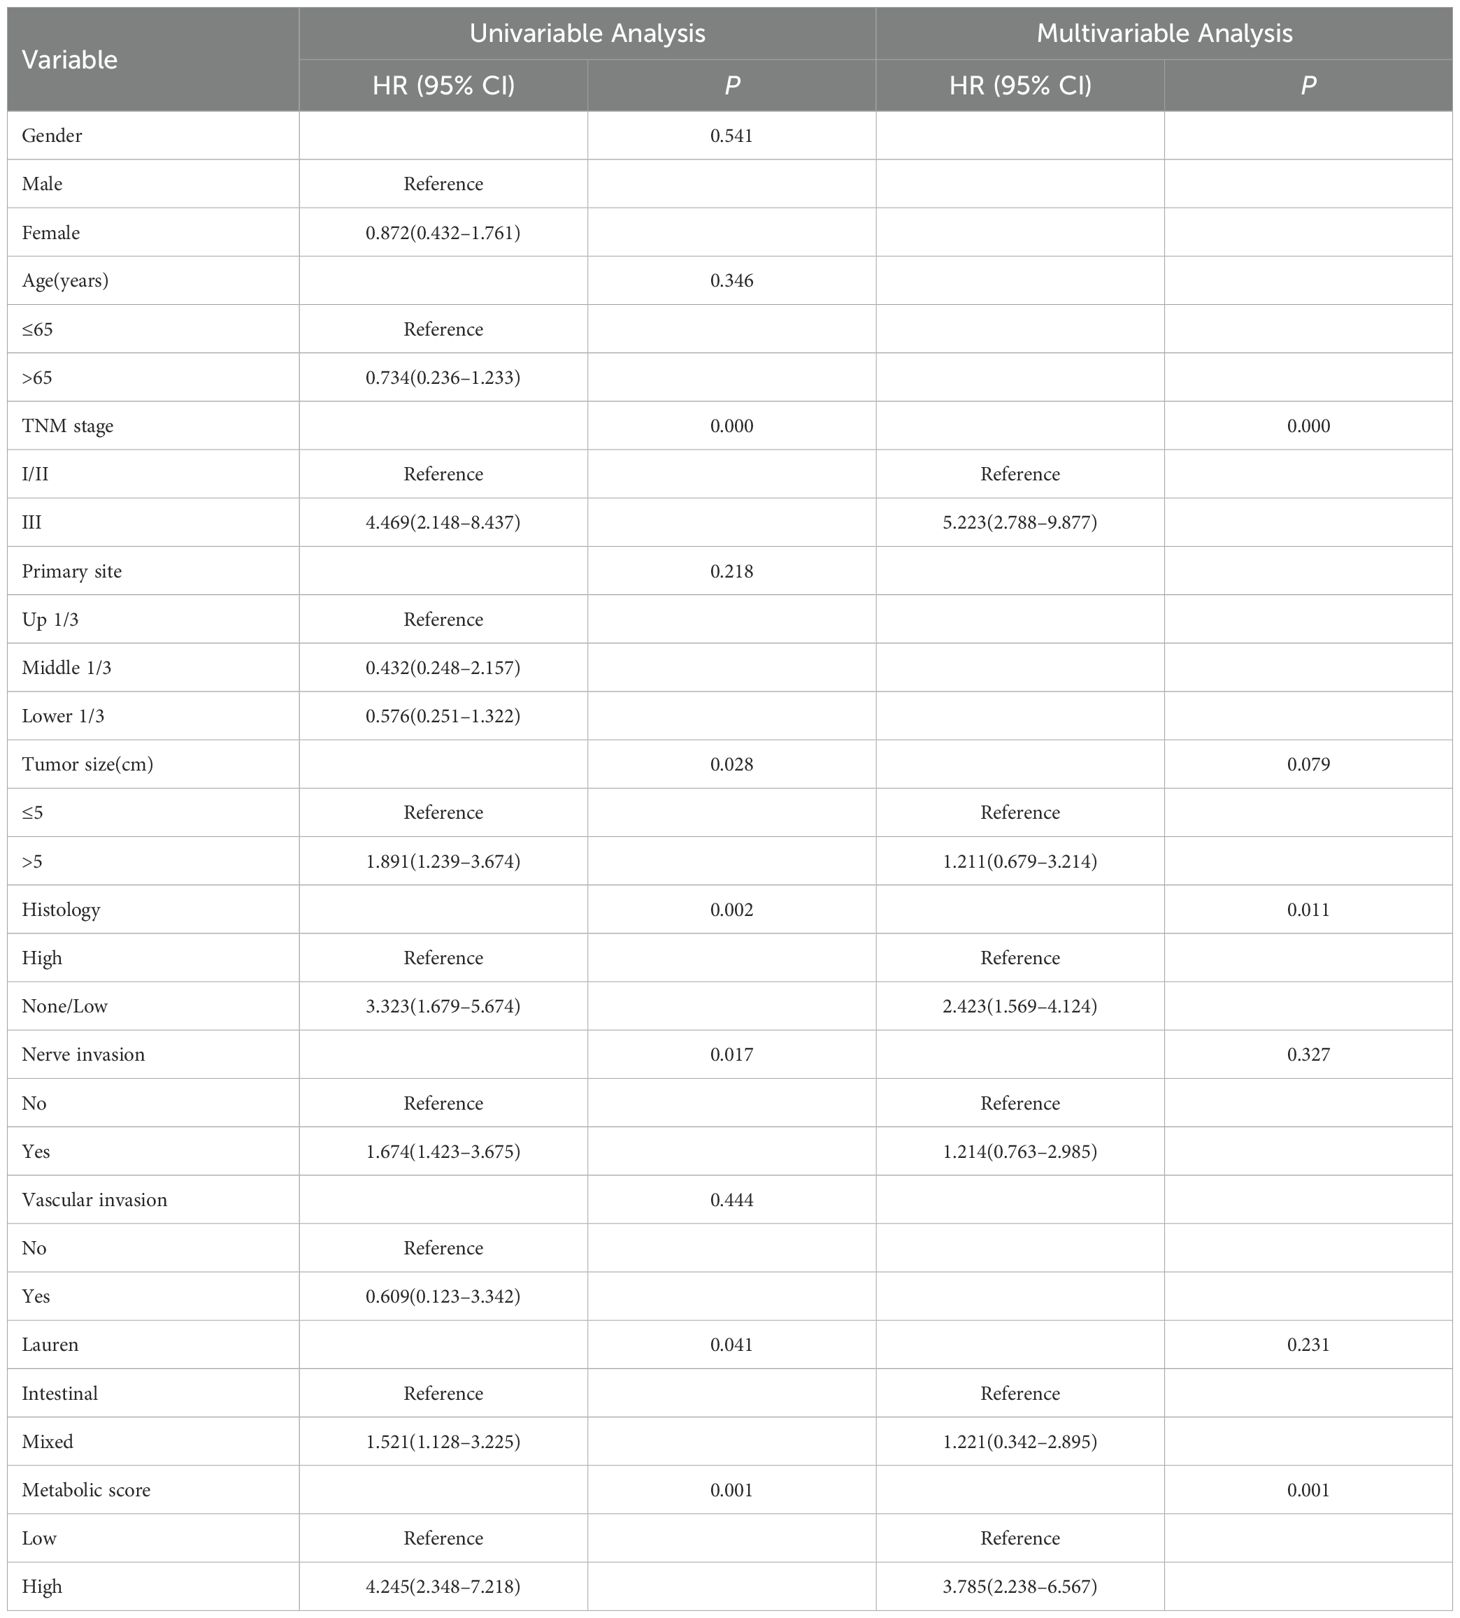
Table 6. Cox multivariable analysis of factors affecting 5-year OS in patients with locally advanced gastric cancer.
Additionally, Cox multivariable analysis demonstrated that TNM stage, pathological type, and metabolic score are independent prognostic factors for 5-year DFS. In univariate analysis, patients with stage III disease had a significantly higher risk of recurrence compared to those with stages I/II (HR = 5.234, P = 0.001), while patients with high pathological type had a higher risk of recurrence compared to those with low/no pathological type (HR = 2.454, P = 0.013). Patients with high metabolic scores had a significantly higher risk of recurrence than those with low scores (HR = 4.521, P = 0.001). In multivariable analysis, TNM stage (HR = 5.784, P = 0.001) and metabolic score (HR = 4.231, P = 0.001) remained independent prognostic factors, while pathological type (HR = 2.674, P = 0.003) continued to show significant prognostic impact (Table 7).
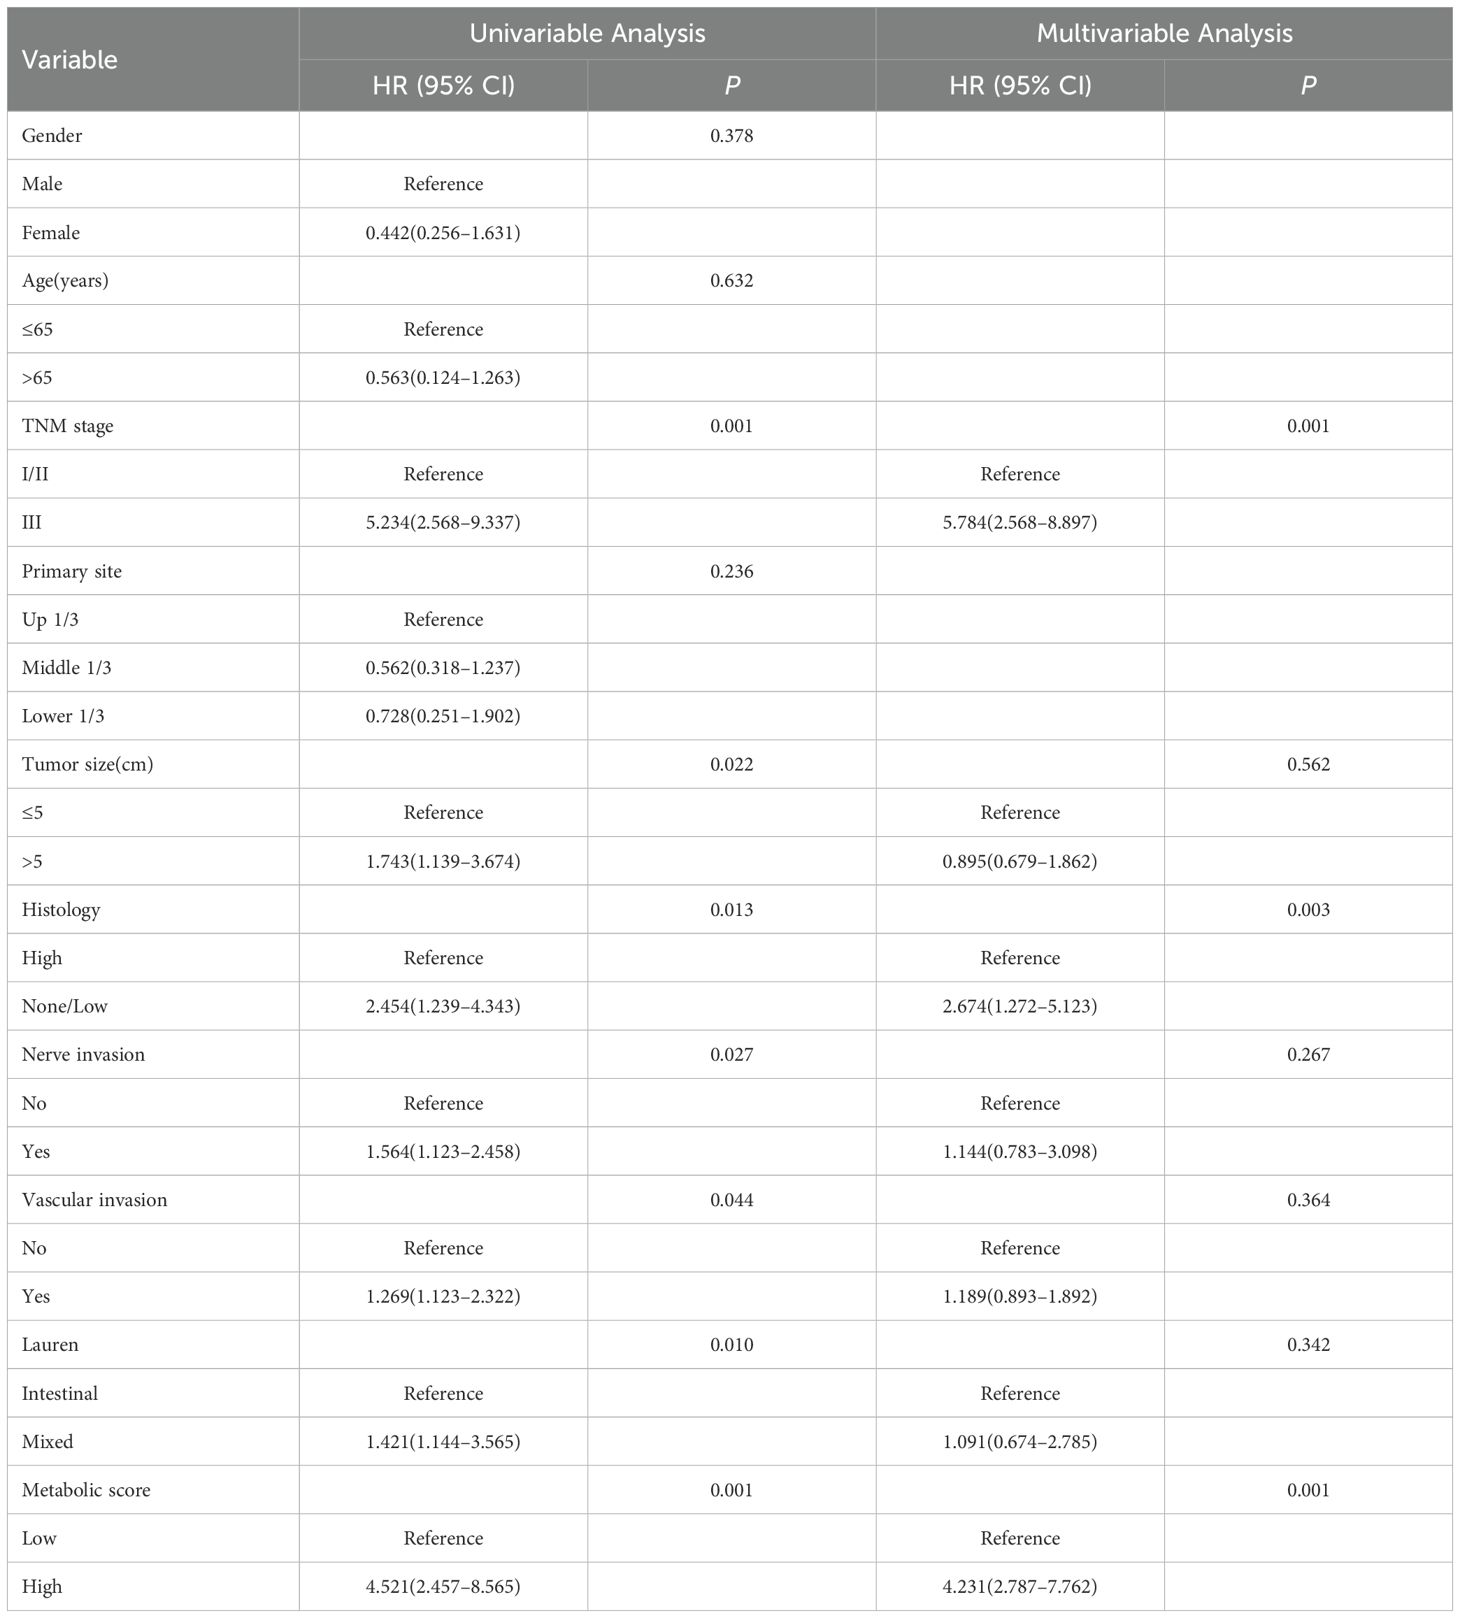
Table 7. Cox multivariable analysis of factors affecting 5-year DFS in patients with locally advanced gastric cancer.
Discussion
In this study, we developed and validated a predictive model based on four peripheral blood metabolic markers (LHR, TCHR, TGHR, and TyG) to assess postoperative recurrence risk in patients with locally advanced gastric cancer (LAGC). The results revealed that high levels of these metabolic markers were significantly associated with increased recurrence risk and worse survival outcomes, both in terms of OS and DFS. Furthermore, multivariable Cox regression analysis identified these metabolic markers, along with TNM stage and pathological type, as independent prognostic factors. The novel metabolic score, combining these markers, showed robust predictive capabilities, outperforming clinical features alone in the prediction of recurrence. This model also demonstrated strong predictive performance across different datasets (training, internal, and external validation sets), with excellent accuracy, sensitivity, and specificity, indicating its potential for use in clinical practice to guide postoperative management in LAGC patients.
Previous studies have emphasized the importance of metabolic alterations in cancer prognosis (25). Several studies have investigated the role of individual metabolic markers, such as the TyG, in predicting the prognosis of GC). For example, a study by Kim et al. demonstrated that TyG was significantly associated with poor prognosis and recurrence in gastric cancer patients (26). Similarly, other studies have shown that lipid ratios, such as the low-density LHR correlate with the prognosis of various cancers, including gastric cancer (27, 28). LHR has been found to reflect not only lipid metabolism but also inflammation and oxidative stress, which are known to play key roles in tumor progression (29). In contrast to previous studies that focused on single metabolic markers, our study integrated multiple metabolic indices into a composite score, which significantly improved predictive accuracy for recurrence. This aligns with findings from recent research in other cancer types, such as colorectal and breast cancer, where combining multiple biomarkers provided a more comprehensive risk stratification (30, 31).
While individual metabolic markers have been widely studied, the integration of multiple markers into a composite score is a novel approach that offers several advantages. One of the strengths of our model lies in its ability to incorporate diverse aspects of metabolic dysregulation. Metabolic alterations, including lipid and glucose metabolism, insulin resistance, and inflammation, are known to interact in complex ways and contribute to cancer progression. Our findings support this notion by demonstrating that high levels of multiple metabolic markers, including LHR, TCHR, TGHR, and TyG, are independently associated with worse prognosis. This composite score reflects the multifactorial nature of metabolic disruption in cancer and may better capture the metabolic environment that promotes recurrence. This is particularly important for cancers like gastric cancer, where metabolic changes can influence not only tumor growth but also the tumor microenvironment and immune responses (32–35). By integrating these markers, we offer a more holistic approach to recurrence prediction, which could be more reliable than using individual markers alone.
From a molecular perspective, the results of this study highlight the significant role that metabolic dysregulation plays in cancer progression and recurrence. Metabolic markers like LHR, TCHR, TGHR, and TyG are linked to various underlying molecular mechanisms, including lipid metabolism, insulin resistance, and systemic inflammation, which can directly or indirectly promote tumor growth. For instance, the LHR ratio reflects dyslipidemia, a condition frequently observed in cancer patients. Dyslipidemia has been associated with the increased availability of fatty acids, which fuel tumor cell proliferation and metastasis. Elevated triglycerides and low HDL levels have also been implicated in promoting inflammation and endothelial dysfunction, both of which contribute to tumor angiogenesis and metastasis (36). Furthermore, the TyG index, which combines triglyceride and fasting blood glucose levels, has been linked to insulin resistance, a known driver of cancer progression (37, 38). Together, these metabolic alterations provide a favorable microenvironment for cancer cell survival, migration, and resistance to therapy. Therefore, our findings suggest that a metabolic composite score based on these markers not only predicts recurrence but also reflects underlying molecular processes that contribute to cancer progression. By combining multiple indicators, it is possible to capture the complex changes in the metabolic system more comprehensively, changes that may not be revealed by a single indicator.
Despite the promising findings, this study has several limitations that should be addressed in future research. One limitation is the retrospective nature of the study, which inherently introduces bias due to the use of historical data. Although we have minimized the impact of biases through strict data filtering and multi-center validation, these limitations may still affect the credibility of the model. While we validated the model across different datasets, prospective validation is needed to confirm the predictive power and generalizability of the composite score in real-world clinical settings. Additionally, while the study focused on peripheral blood markers, other factors, such as genetic, epigenetic alterations and gut microbiota, may provide a more comprehensive perspective on recurrence risk. Integrating these factors with metabolic markers may enhance the model’s predictive accuracy and provide a more comprehensive understanding of the molecular mechanisms driving recurrence in LAGC patients. Furthermore, the study did not explore the impact of adjuvant therapies, which may interact with metabolic markers and influence recurrence risk. Future studies should consider incorporating these variables to refine the predictive model further. Additionally, the lack of complete postoperative dynamic monitoring data for peripheral blood metabolic composite scores posed a challenge for conducting a unified analysis of postoperative trends. Addressing this limitation in future research by incorporating comprehensive postoperative monitoring could offer deeper insights.
In conclusion, our study highlights the potential of a peripheral blood metabolic composite score based on LHR, TCHR, TGHR, and TyG as a reliable and practical tool for predicting postoperative recurrence in LAGC patients. The model demonstrated strong predictive power across multiple validation cohorts and was found to outperform traditional clinical features alone. Given its non-invasive nature and the widespread availability of the required biomarkers, this composite score could serve as a valuable tool for clinicians to identify high-risk patients and guide postoperative management decisions. As we continue to refine the model and validate it prospectively, it has the potential to become an integral part of personalized treatment strategies for LAGC patients, ultimately improving clinical outcomes and survival.
Data availability statement
The raw data supporting the conclusions of this article will be made available by the authors, without undue reservation.
Ethics statement
The studies involving humans were approved by the Fourth Hospital of Hebei Medical University. The studies were conducted in accordance with the local legislation and institutional requirements. Written informed consent for participation in this study was provided by the participants’ legal guardians/next of kin. Written informed consent was obtained from the individual(s) for the publication of any potentially identifiable images or data included in this article.
Author contributions
NM: Formal Analysis, Methodology, Software, Validation, Writing – original draft, Writing – review & editing. ZW: Data curation, Writing – review & editing. YP: Supervision, Writing – review & editing. XW: Methodology, Validation, Writing – original draft. WY: Writing – review & editing, Data curation, Investigation. LW: Writing – review & editing. JL: Conceptualization, Methodology, Writing – original draft. WM: Supervision, Writing – review & editing, Validation.
Funding
The author(s) declare that financial support was received for the research and/or publication of this article. Hebei Province Major Science and Technology Support Project (242W7713Z).
Conflict of interest
The authors declare that the research was conducted in the absence of any commercial or financial relationships that could be construed as a potential conflict of interest.
Generative AI statement
The author(s) declare that no Generative AI was used in the creation of this manuscript.
Publisher’s note
All claims expressed in this article are solely those of the authors and do not necessarily represent those of their affiliated organizations, or those of the publisher, the editors and the reviewers. Any product that may be evaluated in this article, or claim that may be made by its manufacturer, is not guaranteed or endorsed by the publisher.
Supplementary material
The Supplementary Material for this article can be found online at: https://www.frontiersin.org/articles/10.3389/fonc.2025.1536811/full#supplementary-material
References
1. Qiu WW, Chen QY, Zheng WZ, He QC, Huang ZN, Xie JW, et al. Postoperative follow-up for gastric cancer needs to be individualized according to age, tumour recurrence pattern, and recurrence time. Eur J Surg Oncol. (2022) 48:1790–8. doi: 10.1016/j.ejso.2022.02.025
2. Ding P, Wu J, Wu H, Li T, Niu X, Yang P, et al. Transcriptomics-based liquid biopsy for early detection of recurrence in locally advanced gastric cancer. Adv Sci (Weinh). (2024) 18:e2406276. doi: 10.1002/advs.202406276
3. Ding P, Wu H, Wu J, Li T, Gu R, Zhang L, et al. Transcriptomics-based liquid biopsy panel for early non-invasive identification of peritoneal recurrence and micrometastasis in locally advanced gastric cancer. J Exp Clin Cancer Res. (2024) 43:181. doi: 10.1186/s13046-024-03098-5
4. Shibata C, Nakano T, Yasumoto A, Mitamura A, Sawada K, Ogawa H, et al. Comparison of CEA and CA19-9 as a predictive factor for recurrence after curative gastrectomy in gastric cancer. BMC Surg. (2022) 22:213. doi: 10.1186/s12893-022-01667-z
5. Ding P, Wu H, Wu J, Li T, He J, Ju Y, et al. N6-methyladenosine modified circPAK2 promotes lymph node metastasis via targeting IGF2BPs/VEGFA signaling in gastric cancer. Oncogene. (2024) 43:2548–63. doi: 10.1038/s41388-024-03099-w
6. Gyamfi J, Kim J, Choi J. Cancer as a metabolic disorder. Int J Mol Sci. (2022) 23:1155. doi: 10.3390/ijms23031155
7. Masetti M, Carriero R, Portale F, Marelli G, Morina N, Pandini M, et al. Lipid-loaded tumor-associated macrophages sustain tumor growth and invasiveness in prostate cancer. J Exp Med. (2022) 219:e20210564. doi: 10.1084/jem.20210564
8. Wang Y, Du J, Wu X, Abdelrehem A, Ren Y, Liu C, et al. Crosstalk between autophagy and microbiota in cancer progression. Mol Cancer. (2021) 20:163. doi: 10.1186/s12943-021-01461-0
9. Cheng C, Geng F, Cheng X, Guo D. Lipid metabolism reprogramming and its potential targets in cancer. Cancer Commun (Lond). (2018) 38:27. doi: 10.1186/s40880-018-0301-4
10. Cao M, Isaac R, Yan W, Ruan X, Jiang L, Wan Y, et al. Cancer-cell-secreted extracellular vesicles suppress insulin secretion through miR-122 to impair systemic glucose homeostasis and contribute to tumour growth. Nat Cell Biol. (2022) 24:954–67. doi: 10.1038/s41556-022-00919-7
11. Ariaans G, de Jong S, Gietema JA, Lefrandt JD, de Vries EG, Jalving M. Cancer-drug induced insulin resistance: innocent bystander or unusual suspect. Cancer Treat Rev. (2015) 41:376–84. doi: 10.1016/j.ctrv.2015.02.007
12. Meng H, Zhu L, Kord-Varkaneh H, Santos H O, Tinsley GM, Fu P. Effects of intermittent fasting and energy-restricted diets on lipid profile: A systematic review and meta-analysis. Nutrition. (2020) 77:110801. doi: 10.1016/j.nut.2020.110801
13. Wu X, Wang S, Lin L, Jia X, Hu C, Qi H, et al. Association between triglyceride glucose index and breast cancer in 142,184 Chinese adults: findings from the REACTION study. Front Endocrinol (Lausanne). (2024) 15:1321622. doi: 10.3389/fendo.2024.1321622
14. Cai C, Chen C, Lin X, Zhang H, Shi M, Chen X, et al. An analysis of the relationship of triglyceride glucose index with gastric cancer prognosis: A retrospective study. Cancer Med. (2024) 13:e6837. doi: 10.1002/cam4.6837
15. Ma MZ, Yuan SQ, Chen YM, Zhou ZW. Preoperative apolipoprotein B/apolipoprotein A1 ratio: A novel prognostic factor for gastric cancer. Onco Targets Ther. (2018) 11:2169–76. doi: 10.2147/OTT.S156690
16. Notarnicola M, Altomare DF, Correale M, Ruggieri E, D'Attoma B, Mastrosimini A, et al. Serum lipid profile in colorectal cancer patients with and without synchronous distant metastases. Oncology. (2005) 68:371–4. doi: 10.1159/000086977
17. Ruan GT, Deng L, Xie HL, Shi JY, Liu XY, Zheng X, et al. Systemic inflammation and insulin resistance-related indicator predicts poor outcome in patients with cancer cachexia. Cancer Metab. (2024) 12:3. doi: 10.1186/s40170-024-00332-8
18. Ruan GT, Xie HL, Zhang HY, Liu CA, Ge YZ, Zhang Q, et al. A novel inflammation and insulin resistance related indicator to predict the survival of patients with cancer. Front Endocrinol (Lausanne). (2022) 13:905266. doi: 10.3389/fendo.2022.905266
19. Ruan GT, Xie HL, Gong YZ, Ge YZ, Zhang Q, Wang ZW, et al. Prognostic importance of systemic inflammation and insulin resistance in patients with cancer: a prospective multicenter study. BMC Cancer. (2022) 22:700. doi: 10.1186/s12885-022-09752-5
20. Hill MA, Yang Y, Zhang L, Sun Z, Jia G, Parrish AR, et al. Insulin resistance, cardiovascular stiffening and cardiovascular disease. Metabolism. (2021) 119:154766. doi: 10.1016/j.metabol.2021.154766
21. Ding P, Wu H, Li T, Wu J, Yang L, Yang J, et al. Impact of preoperative sarcopenia on postoperative complications and prognosis in patients undergoing robotic gastric cancer surgery: A propensity score matching study. Nutrition. (2024) 123:112408. doi: 10.1016/j.nut.2024.112408
22. Ding P, Wu J, Wu H, Li T, Yang J, Yang L, et al. Myosteatosis predicts postoperative complications and long-term survival in robotic gastrectomy for gastric cancer: A propensity score analysis. Eur J Clin Invest. (2024) 54:e14201. doi: 10.1111/eci.14201
23. Liu XY, Zhang Q, Zhang X, Ge YZ, Ruan GT, Xie HL, et al. Prognostic value of insulin resistance in patients with female reproductive system Malignancies: A multicenter cohort study. Immun Inflammation Dis. (2023) 11:e1107. doi: 10.1002/iid3.1107
24. Tohidi M, Baghbani-Oskouei A, Ahanchi NS, Azizi F, Hadaegh F. Fasting plasma glucose is a stronger predictor of diabetes than triglyceride-glucose index, triglycerides/high-density lipoprotein cholesterol, and homeostasis model assessment of insulin resistance: Tehran Lipid and Glucose Study. Acta Diabetol. (2018) 55:1067–74. doi: 10.1007/s00592-018-1195-y
25. Hopkins BD, Goncalves MD, Cantley LC. Obesity and cancer mechanisms: cancer metabolism. J Clin Oncol. (2016) 34:4277–83. doi: 10.1200/JCO.2016.67.9712
26. Kim YM, Kim JH, Park JS, Baik SJ, Chun J, Youn YH, et al. Association between triglyceride-glucose index and gastric carcinogenesis: a health checkup cohort study. Gastric Cancer. (2022) 25:33–41. doi: 10.1007/s10120-021-01222-4
27. Nam SY, Jeong J, Jeon SW. Constant association between low high-density lipoprotein cholesterol and gastric cancer regardless of site. J Obes Metab Syndr. (2023) 32:141–50. doi: 10.7570/jomes22045
28. Wu Y, Xin J, Loehrer EA, Jiang X, Yuan Q, Christiani DC, et al. High-density lipoprotein, low-density lipoprotein and triglyceride levels and upper gastrointestinal cancers risk: a trans-ancestry Mendelian randomization study. Eur J Clin Nutr. (2022) 76:995–1002. doi: 10.1038/s41430-022-01078-6
29. Mickiewicz A, Kreft E, Kuchta A, Wieczorek E, Marlęga J, Ćwiklińska A, et al. The impact of lipoprotein apheresis on oxidative stress biomarkers and high-density lipoprotein subfractions. Oxid Med Cell Longev. (2020) 2020:9709542. doi: 10.1155/2020/9709542
30. Hao JQ, Zhuang ZX, Hu SY, Zhang YJ, Zhang JW, He FJ, et al. The association between non-high-density lipoprotein cholesterol to high-density lipoprotein cholesterol ratio (NHHR) and low muscle mass in adults aged 20-59: a population-based study in the United States. Lipids Health Dis. (2024) 23:274. doi: 10.1186/s12944-024-02243-5
31. Pedersen KM, Çolak Y, Bojesen SE, Nordestgaard BG. Low high-density lipoprotein and increased risk of several cancers: 2 population-based cohort studies including 116,728 individuals. J Hematol Oncol. (2020) 13:129. doi: 10.1186/s13045-020-00963-6
32. Yang K, Wang X, Song C, He Z, Wang R, Xu Y, et al. The role of lipid metabolic reprogramming in tumor microenvironment. Theranostics. (2023) 13:1774–808. doi: 10.7150/thno.82920
33. Jin HR, Wang J, Wang ZJ, Xi MJ, Xia BH, Deng K, et al. Lipid metabolic reprogramming in tumor microenvironment: from mechanisms to therapeutics. J Hematol Oncol. (2023) 16:103. doi: 10.1186/s13045-023-01498-2
34. Vitale I, Manic G, Coussens LM, Kroemer G, Galluzzi L. Macrophages and metabolism in the tumor microenvironment. Cell Metab. (2019) 30:36–50. doi: 10.1016/j.cmet.2019.06.001
35. Xiao Z, Dai Z, Locasale JW. Metabolic landscape of the tumor microenvironment at single cell resolution. Nat Commun. (2019) 10:3763. doi: 10.1038/s41467-019-11738-0
36. Zhao TJ, Zhu N, Shi YN, Wang YX, Zhang CJ, Deng CF, et al. Targeting HDL in tumor microenvironment: New hope for cancer therapy. J Cell Physiol. (2021) 236:7853–73. doi: 10.1002/jcp.30412
37. Wang H, Ruan S, Wu Z, Yan Q, Chen Y, Cui J, et al. Prognostic significance of glucose-lipid metabolic index in pancreatic cancer patients with diabetes mellitus. Cancer Med. (2024) 13:e7108. doi: 10.1002/cam4.7108
Keywords: locally advanced gastric cancer, postoperative recurrence, metabolic markers, predictive model, nomogram
Citation: Meng N, Wang Z, Peng Y, Wang X, Yue W, Wang L, Lv J and Ma W (2025) Peripheral blood metabolic composite score based on peripheral blood metabolism can be used as an assessment of recurrence after surgery in patients with locally advanced gastric cancer: a novel and promising index. Front. Oncol. 15:1536811. doi: 10.3389/fonc.2025.1536811
Received: 04 December 2024; Accepted: 26 March 2025;
Published: 17 April 2025.
Edited by:
Jianming James Tang, University of Alabama at Birmingham, United StatesReviewed by:
Run-Cong Nie, Sun Yat-sen University Cancer Center (SYSUCC), ChinaLin Liu, Xiyuan Hospital of China Academy of Chinese Medical Sciences, China
Copyright © 2025 Meng, Wang, Peng, Wang, Yue, Wang, Lv and Ma. This is an open-access article distributed under the terms of the Creative Commons Attribution License (CC BY). The use, distribution or reproduction in other forums is permitted, provided the original author(s) and the copyright owner(s) are credited and that the original publication in this journal is cited, in accordance with accepted academic practice. No use, distribution or reproduction is permitted which does not comply with these terms.
*Correspondence: Ning Meng, c2p6X21lbmdfbmluZ0AxNjMuY29t
†ORCID: Ning Meng, orcid.org/0000-0002-1526-6640