 Ciara M. Ward1†
 Charles Brockwell1†Gavin S. McNee2Emily Orton1Emily N. P. Prowse1
 Susanne A. Gatz1,3*
 Clare C. Davies1*
- 1Department of Cancer and Genomic Sciences, College of Medical and Health Sciences, University of Birmingham, Birmingham, United Kingdom
- 2School of Life Sciences, University of Wolverhampton, Wolverhampton, United Kingdom
- 3Department of Paediatric Oncology, Birmingham Women’s and Children’s NHS Foundation Trust, Birmingham, United Kingdom
Introduction: Ewing sarcoma is a rare type of cancer arising from bone and soft tissues mainly affecting children and young adults. Treatments include intensive chemotherapy, surgery and radiotherapy, however more than 30% of patients die from the disease. Direct drug targeting of EWS-FLI1 remains a significant challenge, therefore new approaches are urgently required.
Methods: Analysis of PRMT1 and PRMT5 transcript expression using the R2 platform focusing on the Filion dataset of sarcomas that includes Ewing sarcoma patients alongside other fusion-positive sarcomas and breast and lung cancer datasets. Immunoblotting across a panel of Ewing sarcoma cell lines detected PRMT1 and PRMT5 expression and associated activity. Cell viability assay after PRMT inhibition, with and without olaparib, were conducted by trypan blue exclusion and MTT assay. DNA damage was detected by immunofluorescence staining for markers of DNA damage (γH2AX) and double-strand breaks (53BP1).
Results: We show that the expression and activity of the arginine methyltransferases PRMT1 and PRMT5 are elevated in Ewing sarcoma and that inhibition of PRMT1 or PRMT5 with pre-clinical inhibitors leads to growth arrest and apoptosis that is dependent on the expression of the driver oncogene EWSR1::FLI1. Mechanically, we show that PRMT1 and PRMT5 inhibitors promote DNA damage, and that PRMT5 inhibitors synergise with the PARP inhibitor olaparib to induce elevated DNA damage and reduced cell viability.
Discussion: Our study implies that PRMT1/PRMT5 are important mediators of EWSR1::FLI1 oncogenicity and that drug targeting PRMT1/PRMT5 in combination with DNA damaging chemotherapies could be an effective therapeutic strategy for the treatment of ES patients.
Introduction
Ewing Sarcoma (ES) is a rare cancer of bone and soft tissues affecting children and young adults. Standard of care involves multimodal therapy with non-specific chemotherapies, radiotherapy and surgery. Despite this intensive regime, those with metastatic or recurrent disease have a particularly poor outcome and 30% of patients are not cured (1, 2). New therapeutic approaches are thus urgently required to provide better, safer, and kinder treatment options.
ES are characterised by distinct chromosomal translocations that generate a gene fusion of a member of the RNA binding FET gene family (EWSR1, FUS) and a member of the ETS transcription factor gene family (FLI1, ERG, FEV, ETV1 and ETV4). The most common genetic event occurring in 85%-90% of cases is the production of the EWSR1::FLI1 gene fusion encoding the EWS-FLI1 fusion protein that functions as an aberrant transcription factor (1, 3). This oncogenic fusion protein has been the focus of translational research for many years, but direct targeting has remained elusive for imminent clinical application. Therapeutic avenues have thus tried to identify vulnerabilities and dependencies created through the fusion protein itself. For example, the EWS-FLI1 fusion protein promotes the rewiring of transcriptional programs, the generation of oncogenic alternative splicing products (4, 5), and genome instability through the sequestering of BRCA1 leading to aberrant R-loop formation and replication stress (6, 7). Consequently, ES cells display sensitivity to PARP inhibitors attributed to defective homologous recombination (HR) (6). Despite this, efforts to translate these findings to the clinic have faced challenges. Treatment with PARP inhibitors as a single agent showed no clinical benefit (8, 9), and whilst chemotherapy/PARP inhibitor combinations promoted responses in a few patients, combination drug doses were limited due to toxicity (10–12). Together, this implies that the underlying oncogenic mechanisms of ES are complex and that combining PARP inhibition with chemotherapy is not sufficient to create a therapeutic window that would allow ES cells to be preferentially sensitised over healthy patient cells.
Protein post-translational modifications are vital for increasing the functional diversity of the proteome, however their deregulation promotes cancer initiation and progression. Methylation of arginine residues by protein arginine methyltransferases (PRMTs) is one such modification with elevated expression of PRMTs highly associated with the development, pathogenesis, and drug resistance of adult solid and haematological cancers (13). PRMTs catalyse mono- and dimethylation of the guanidino group of the arginine residue using S-adenosyl methionine (SAM) as a methyl donor. Dimethylation can occur asymmetrically (ADMA) by Type 1 enzymes (PRMT1/PRMT2/PRMT3/CARM1/PRMT6/PRMT8) where two methyl groups are placed onto one of the terminal nitrogen atoms of the guanidino group, or symmetrically (SDMA) by Type II enzymes (PRMT5/PRMT9) where one methyl group is placed onto each of the terminal nitrogen groups (14). PRMT1 and PRMT5 are the predominant mediators of ADMA and SDMA respectively and are known to methylate histone and non-histone proteins. This contributes to a wide range of cellular processes that are deregulated in cancer, including cancer cell survival, stemness, migration, immune invasion, genome stability and chemoresistance (13, 14). Mechanistically, PRMT1/PRMT5 regulate oncogenic epigenetic-mediated gene expression, mRNA splicing, DNA repair, epithelial-mesenchymal transition, and receptor signalling (13). As such, genetic or siRNA-mediated depletion of PRMT1 or PRMT5 levels result in decreased cancer cell proliferation (15–17) and co-operate with DNA damaging chemotherapies to reduce cell viability (18–21). The development of clinically relevant inhibitors for specific PRMTs, particularly for PRMT5, has thus progressed at a phenomenal rate with several Phase I/II clinical trials initiated for adult haematological, breast and lung cancer (14, 22).
Intriguingly, many of the functions of the EWS-FLI1 fusion protein are shared with those identified for PRMTs. For example, EWS is an arginine methylated protein (23), and both PRMT1 and PRMT5 regulate R-loop formation and DNA repair via HR (18, 24–26). PRMTs are also key regulators of canonical and alternative splicing (13), whilst arginine methylation regulates phase separation (27), an inherent property of the FET family of RNA binding proteins. In this work, we show that PRMT1/PRMT5 expression and associated ADMA/SDMA is elevated in ES cells. Inhibition of PRMT1 or PRMT5 leads to reduced ES cell proliferation, whilst combining both PRMT inhibitors leads to a robust induction of apoptosis. Mechanistically, PRMT inhibitors promote DNA damage and potentiate the effects of olaparib thereby reducing ES cell survival. Critically, the cell-detrimental effect of PRMT inhibition was dependent on the expression of EWS-FLI1 implying a therapeutic window of opportunity for the clinical use of PRMT inhibitors. Taken together, our study implies that PRMT1/PRMT5 are important mediators of EWS-FLI1 oncogenicity and that drug targeting of PRMT1/PRMT5 in combination with DNA damaging chemotherapies could be an effective therapeutic strategy for the treatment of ES patients.
Materials and methods
Cell lines and cell culture
TC-32 Ewing sarcoma cell line was maintained in RPMI 1640 supplemented with 10% foetal bovine serum (FBS), 1% L-glutamine and 1% penicillin and streptomycin. SK-N-MC Ewing sarcoma cell line was maintained in Dulbecco’s Modified Eagle Medium (DMEM)/F12 (Ham) (1:1)) supplemented with 10% FBS, 1% glutamine, 1% penicillin and streptomycin. A673 (ATCC) and A673 clone ASP#14 (28) (herein referred to as A673-tetON-shEWSR1::FLI1) Ewing sarcoma cell lines were maintained in DMEM supplemented with 10% FBS, 1% Glutamine, 1% penicillin and streptomycin. A673-tetON-shEWSR1::FLI1 were maintained in 50µg/ml Zeocin and 2μg/ml Blasticidin. BMMSC (bone marrow mesenchymal stem cells) were a gift from Helen McGettrick (University of Birmingham) and were maintained in mesenchymal stem cell growth medium 2 (Promocell) in penicillin/streptomycin-free conditions. HFF1 cells were a gift from Joanna Parish (University of Birmingham) and cultured in DMEM supplemented with 10% FBS, 1% glutamine, 1% penicillin and streptomycin. The siRNA sequences are: siCTRL: 5’-CGUACGCGGAAUACUUCGA-3’; siPRMT5: 5’-CGAAAAGCUG ACACACUA-3’; siPRMT1: 5’-UGAGCGUUCCUAGGCGGUUUC-3’. SK-N-MC-TetON-shPRMT1 and SK-N-MC-TetON-shPRMT5 cell lines were generated by lentiviral infection of pTRIPZ-shPRMT1 (construct ID: V3THS-381699; Horizon Discovery) and pLKO-tetOn-shPRMT5 constructs. Sequences are: shPRMT1 (5’-TCATTGCAGGCAGAACGG-3’); shPRMT5-2 (5’-AGGGACTGGAATACGCTAATT-3’) (16).
Drug treatments
Please see associated figure legends for concentrations and durations of GSK591 (PRMT5 inhibitor) (29, 30), MS023 (Type 1 PRMT inhibitor) (31) and olaparib treatments.
Trypan blue cell viability assays
Cells were plated in duplicate in 6 well plate and treated with GSK591 and/or MS023 for 4 days at the dose indicated in the figure legend. For trypan blue exclusion assay, media was removed, and cells resuspended in trypan blue solution. Cell numbers were determined using the Cellometer cell counter (Nexcelom Bioscience) and the Cellometer Auto Counter software (Version 3.3.5.11, Nexcelom Bioscience). For A673-tetON-shEWSR1::FLI1 cells, cells were plated in duplicate in 6 well plate and treated with 2μg/ml doxycycline and/or 1μM olaparib as required. 72 hrs later, media was replaced and GSK591/MS023 included as desired. Cells were harvested for trypan blue exclusion assay 4 days later. SK-N-MC-TetON-shPRMT1 and SK-N-MC-TetON-shPRMT5 cell lines were treated with 1μg/ml doxycycline for 7 days and viable cell number determined by trypan blue exclusion analysis.
MTT assay
Cells were plated in triplicate in 96 well plate and treated with GSK591 and DNA damaging agents for 6 days at the dose indicated in the figure legend. MTT (0.5mg/ml) was added for 2 hours, solubilised by the addition of acidified isopropanol and absorbance measure at 560nm. Data presented is normalised to samples that did not receive DNA damaging agents.
Transcriptomic analysis
Data mining of the R2 platform for PRMT5, MEP50 and PRMT1 expression was accessed via https://hgserver1.amc.nl/cgi-bin/r2/main.cgi?open_page=login using platforms MAS 5.0-u133a and MAS 5.0 u133p2. Probe set were: PRMT5 = 217786_s_at; MEP50/WDR77 = 201421_s_at; PRMT1 = 206445_s_at). The following datasets were accessed: Filion (n=137; 7 different fusion positive sarcoma subtypes including n=24 EWSR1-FLI1 and n=4 EWSR1-ERG) (32), breast cancer sets Miller et al. (n=251) and Sinn et al. (n=1108), and lung cancer sets Jen et al. (n=107).The Ewing Sarcoma Cell Line Atlas (ESCLA) contains whole genome DNA methylation, transcriptome, proteome and chromatin immunoprecipitation sequencing data of 18 cell lines with doxycycline (dox)-inducible knockdown of the respective fusion protein (33). Data presented as log2-transformed.
Immunocytochemistry
Cells were trypsinised and washed three times with ice cold PBS before fixing in ice-cold 4% (w/v) paraformaldehyde (Merck Life Sciences) for 12 mins. Following three washes with ice-cold PBS, 100,000 cells were centrifuged (5 min) onto a 6mm-diameter circular area on microscopic slides using a Shandon CytoSpin cytocentrifuge (Thermo Scientific). Slides were allowed to air dry for 15 min before treatment with ice-cold cytoskeletal pre-extraction buffer (PBS-0.5% Triton X-100 containing 10mM PIPES (pH 6.0), 300mM Sucrose, 100mM NaCl and 3mM MgCl2) for 10 min at room temperature. After two rinses with ice-cold PBS, cells were permeabilised with PBS-0.5% (v/v) Triton X-100 for 5 min at room temperature, washed with ice-cold PBS (3 × 5 min), and blocked with PBS/5% FBS/1% bovine serum albumin/0.3% Triton X-100 for 1 hr at room temperature. Cells were incubated in a humid chamber at 4°C overnight with the primary antibody diluted in blocking buffer. Slides were washed three times with PBS-0.1% Tween (5 min), incubated with the relevant fluorophore-conjugated secondary antibody diluted with blocking buffer for 1 hr at room temperature in the dark, washed three times with PBS-0.1% Tween (5 min) and nuclei counterstained using ProLong Gold Antifade mounting media containing 4′,6-diamidino-2-phenylindole (DAPI) (Invitrogen). For detection of 53BP1 foci in EdU+ cells, EdU (10μM) was added 30 mins to cell culture media before cells were trypsinised, fixed in 3.6% PFA and collected for cytospin (as to protocol above). After pre-extraction (PBS-0.5% Triton X-100 containing 10mM PIPES (pH 6.0), 300mM Sucrose, 100mM NaCl and 3mM MgCl2; 10 min at room temperature), slides were incubated in blocking solution (5% FBS in PBS-0.3% Triton X-100) for 5 mins and Click-IT reaction (4mM CuSO4, 100mM sodium ascorbate, 1:800 Alexa-Fluro 594 Azide (Thermo Fisher), in x1 Tris-buffer saline (TBS)) for 30 mins at room temperature in the dark. Following three washes (5 mins) with PBS-0.3% (v/v) Triton X-100, slides were blocked in with PBS/5% FBS/1% bovine serum albumin/0.3% Triton X-100 for 1 hr at room temperature, incubated with primary antibody overnight, followed by three PBS-0.1% Tween washes (5 min) and incubation with the relevant fluorophore-conjugated secondary antibody diluted with blocking buffer for 1 hr at room temperature in the dark. After three washed with PBS-0.1% Tween (5 mins), nuclei counterstained using ProLong Gold Antifade mounting media containing 4′,6-diamidino-2-phenylindole (DAPI) (Invitrogen). 53BP1 and Rad51 foci number was counted by eye using a Zeiss AxioVert 3 microscope; γH2AX intensity was determined by analysis >100 nuclei per experimental replicate using ImageJ software. Antibodies used for immunostaining were: γH2AX (1:1000; Millipore; #05-636); 53BP1 (1:1000; Novas Biologicals; #NB100-304); Rad51 (1:500; Millipore; PC130); DyLight 488 anti-Rabbit (1:1000; Invitrogen; #35552) and Alexa Fluor 594 anti-Mouse (1:1000; Invitrogen; #A11032).
Immunoblotting
Cell lysates were prepared by sonicating in ice-cold UTB buffer (8M Urea, 50mM Tris, pH 7.5, 150mM 2-mercaptoethanol), sonicated twice at 25% amplitude using a thin probe (5 seconds), and clarified by centrifugation. Proteins were separated by SDS-PAGE and transferred to PVDF membrane, blocked and incubated overnight in primary antibody. Membranes were washed and incubated with secondary antibody and visualised by enhanced chemiluminescence and X-ray film. Antibodies used for immunoblotting were: PRMT1 (1:1000; Cell Signalling Technology; #2449); PRMT5 (1:1000; Active Motif; #61001); MEP50 (1:1000; Cell Signalling Technology; #2823); ADMA (1:1000; Epicypher; #13281001); ADMA (1:1000; Cell Signalling Technology; #13222); MMA (1:1000; Cell Signalling Technology; #8015); FLI1 (1:1000; BD Pharmingen; #554266); phospho-RPA-Ser4/8 (1:1000; Bethyl; #A300-245A); RPA (1:1000; Calbiochem; #NA18); phospho-Chk1-Ser345 (1:1000; Cell Signalling Technology; #2348); Chk1 (1:1000; Cell Signalling Technology; #2360); β-actin-HRP (1:5000; Cell Signalling Technology; #5125); GAPDH (1:5000; Cell Signalling Technology; #2118); γH2AX (1:1000; Millipore; #05-636); cleaved caspase-3-Asp175 (1:1000; Cell Signalling Technology; #9661); Rabbit IgG-HRP (1:5000; DAKO; #P0399); Mouse IgG-HRP; 1:5000; Cell Signalling Technology; #7076).
Cell cycle analysis
Cells were treated with GSK591/MS023 for 48 hrs and pulsed for 60 mins with 50μM BrdU before trypsinisation and collection. Cells were washed in ice-cold PBS and fixed in 70% EtOH. For BrdU staining, cells were washed twice with ice-cold PBS and resuspended in 2M HCl for 20 mins at room temperature. Cells were washed twice with ice-cold PBS and once with ice-cold PBS-0.2% Tween-20/1% BSA (PBS-T20-BSA). Cells were incubated with 20μl anti-BrdU-FITC (BD Biosciences) in a total volume of 100μl of PBS-T20-BSA and incubated in the dark on ice for 1 hr. Following two washes with PBS-T20-BSA and one wash with PBS, cells were resuspended in PBS (25μg/ml propidium iodide/100μg/ml RNaseA) and analysed by flow cytometry using a BD LSR Fortessa X-20 and FlowJo software.
Statistical analysis
The means of two independent groups were compared by a Student’s t-test (two-sided, equal variance). Results are expressed as mean ± SEM or SD, and data were analysed by GraphPad Prism 9.2.0 and the Excel program of Microsoft Office.
Results
PRMT1, PRMT5 and associated enzymatic activities are elevated in ES cells
As a first indicator for a potential relevance of PRMT1 and PRMT5 in ES, we queried the R2 platform for PRMT1 and PRMT5 mRNA expression focusing on the Filion dataset which includes ES alongside other fusion-positive sarcomas (32). We included two breast and one lung cancer dataset for comparison as these tumour types are the focus of PRMT5 inhibitor phase I/II trials for adult cancers (14, 22). We found that PRMT1 and PRMT5 expression, along with MEP50 the obligate cofactor of PRMT5, are generally higher in multiple sarcoma types, including EWSR1::FLI1 and EWSR1::ERG fusion-positive ES tumours, than in breast and lung cancer (Figure 1A, Supplementary Figure 1A). Screening of a panel of four EWSR1::FLI1 and one ESWR1::ERG fusion ES cell lines supported the transcriptional profiling, with elevated PRMT1 and PRMT5 protein expression and SDMA and ADMA levels compared to non-transformed human foreskin fibroblast cells (HFF1) and bone marrow mesenchymal stem cells [BMMSC - the perceived cell of origin of ES (34)] (Figure 1B). Again, protein levels of PRMT1/PRMT5 were generally higher in ES cells compared to MCF7 and SUM159 breast cancer lines (Figure 1B). PRMT1, PRMT5, SDMA and ADMA are thus elevated in ES cells compared to normal tissue.
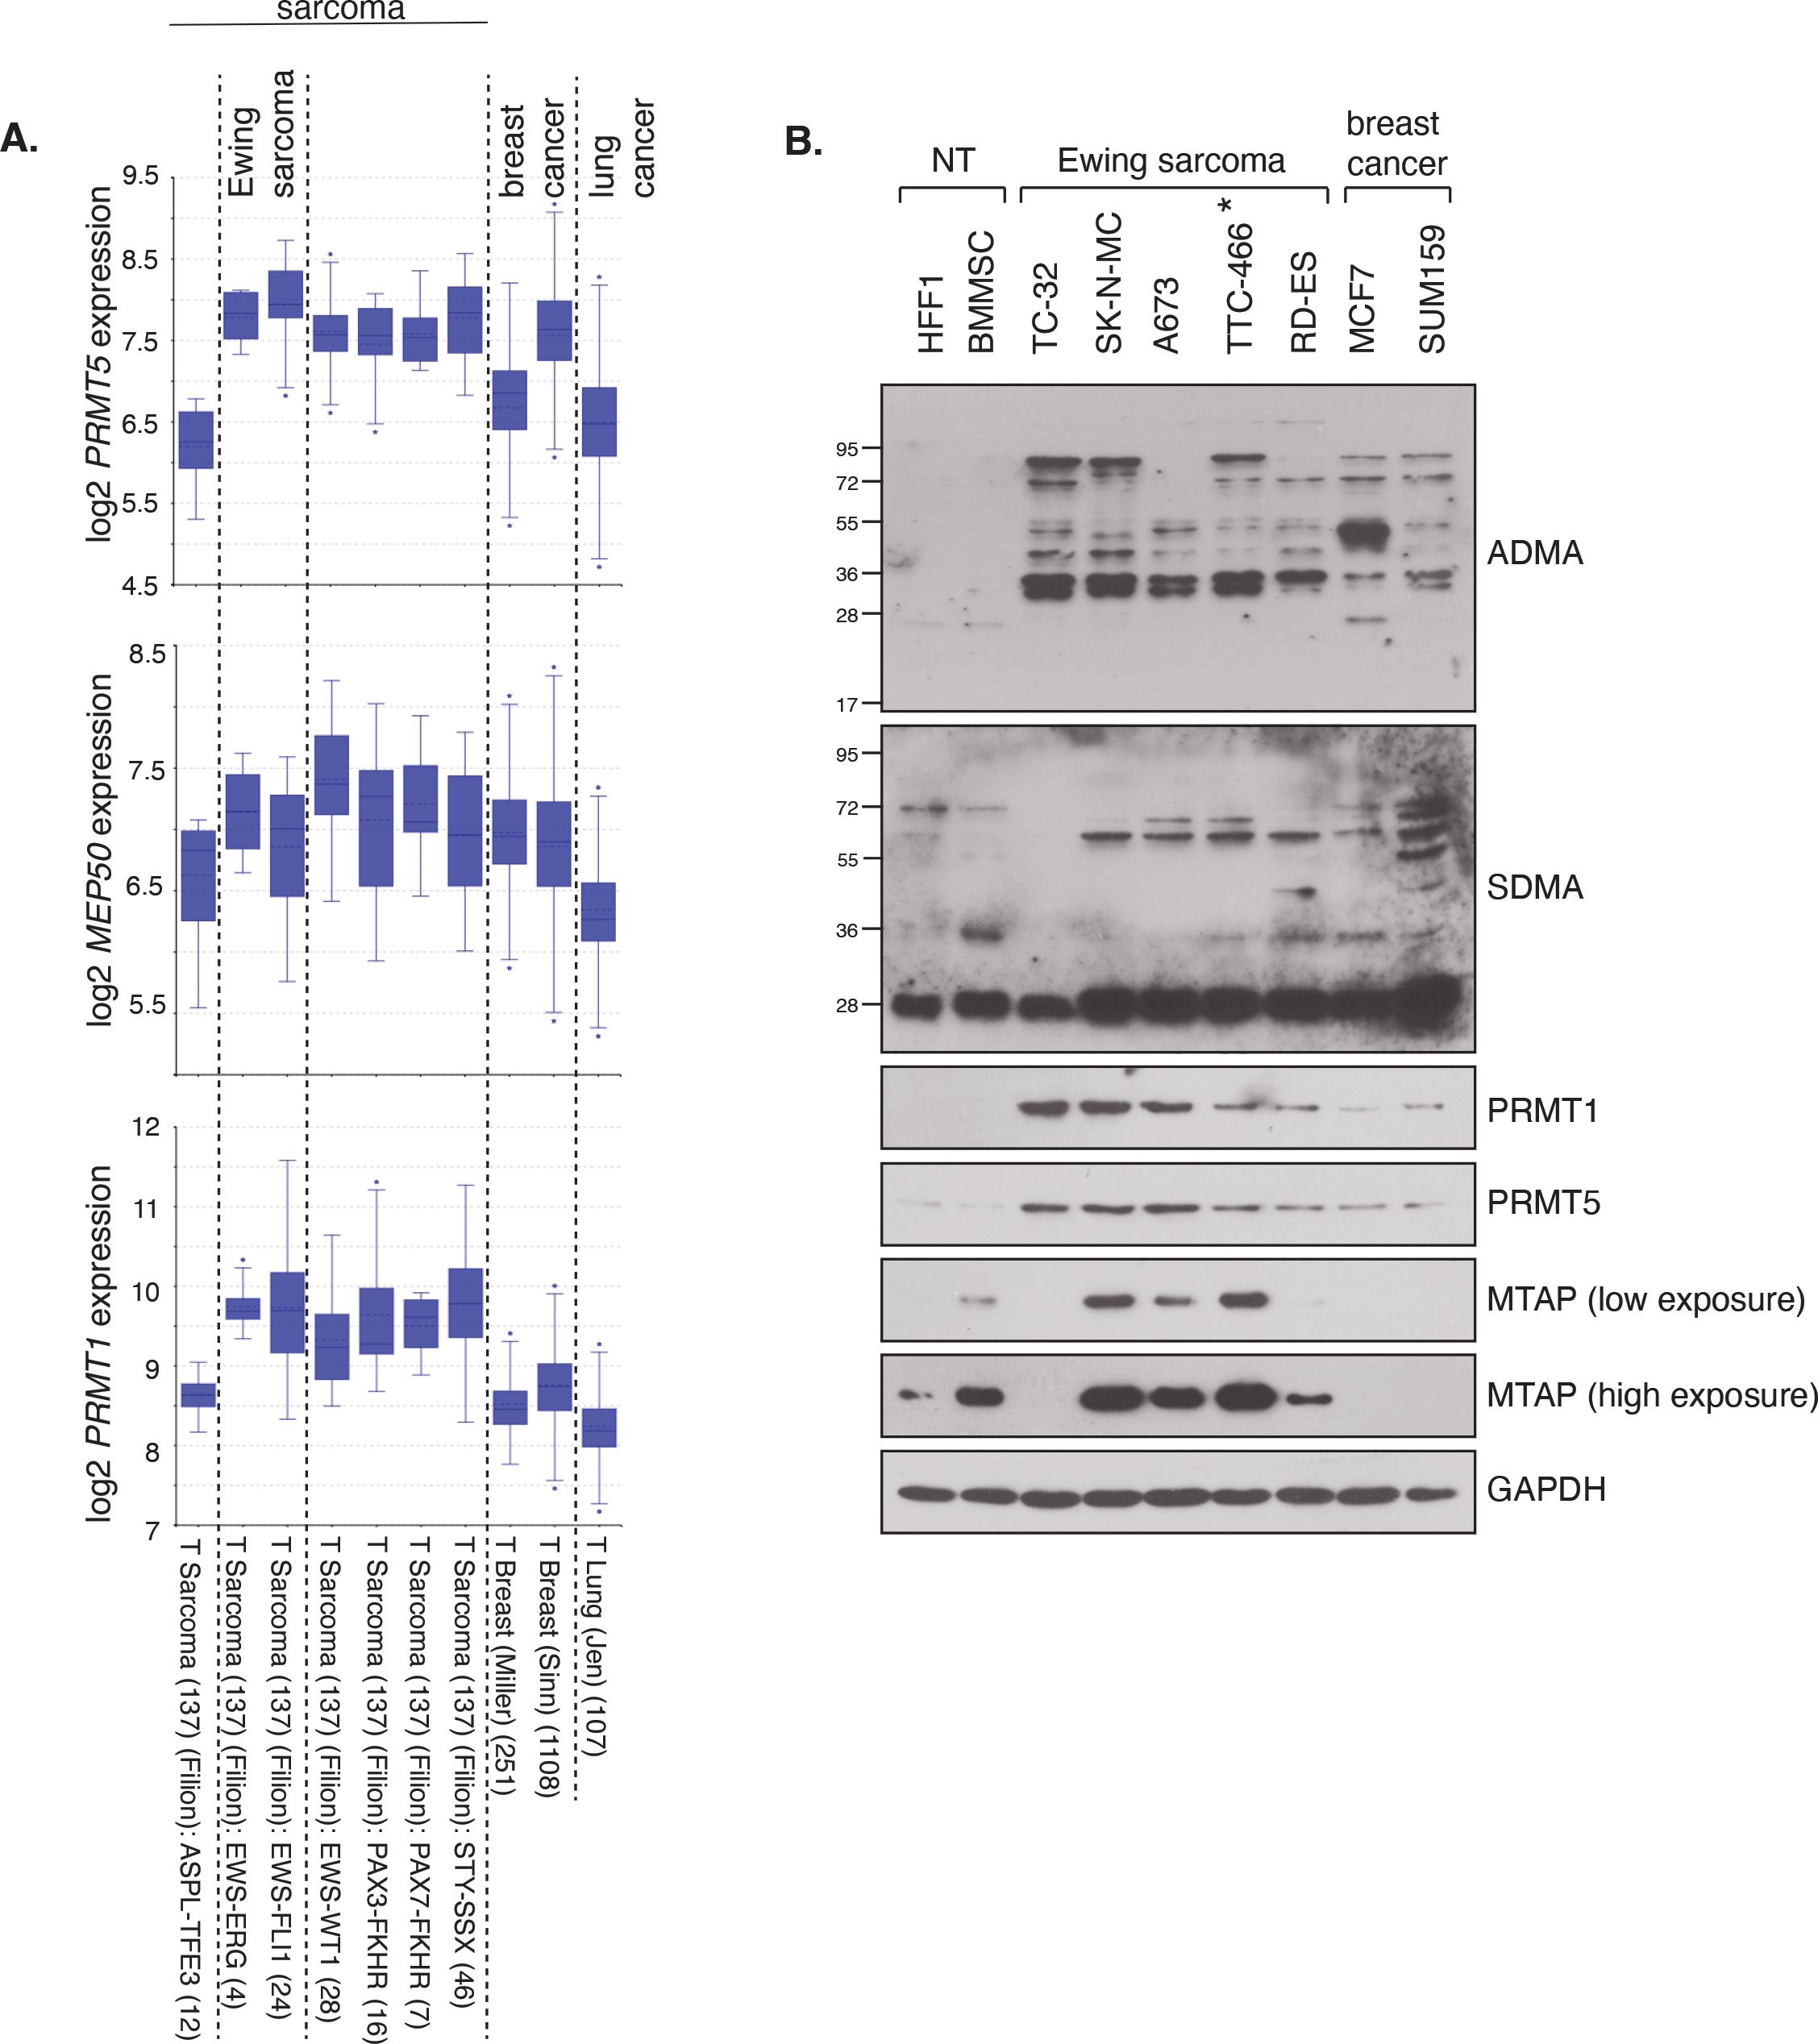
Figure 1. PRMT1 and PRMT5 expression and activity is elevated in Ewing sarcoma. (A) mRNA expression levels of PRMT1, PRMT5 and MEP50 in fusion-positive sarcomas, including Ewing sarcoma (EWRS1::FLI1 and EWSR1::ERG; dataset 2 and 3), in comparison to breast and lung cancer tissues. Data taken from the R2 platform of Affymetrix datasets (MAS 5.0-u133a - PRMT5 217786_s_at; MEP50/WDR77 201421_s_at; PRMT1 206445_s_at). (B) Protein levels of PRMT1 and PRMT5, and associated activity, as determined by ADMA and SDMA levels, is elevated in a panel of ES cell lines compared to non-transformed (NT) HFF1 and BMMSC cells. Data representative of n=3 biologically independent experiments. Asterisk indicates EWSR1::ERG fusion cell line.
PRMT1 and PRMT5 regulate the growth of EWSR1::FLI1 fusion ES cells
To determine if PRMT1 and/or PRMT5 are required for the growth of ES cells, we conducted a dose response analysis into the effects of the specific PRMT5 inhibitor GSK591 (29, 30), the tool compound to the clinically relevant PRMT5 inhibitor GSK3326595 (35). To inhibit PRMT1 we used the Type I inhibitor MS023 that displays a strong preference towards the inhibition of PRMT1, with a 6-fold lower in vivo IC50 for PRMT6, the next best-targeted Type 1 PRMT enzyme (31). We found that a 4-day treatment of GSK591 or MS023 with low concentrations of compounds led to a dose-dependent reduction in cell proliferation in the EWSR1::FLI1 positive fusion ES cell lines SK-NM-C, TC-32 and A673 (Figures 2A–F). TC-32 responded similarly to MS023 and GSK591 resulting in a 66.14% and 63.5% reduction in cell viability at the highest concentration of inhibitor (500nM of GSK591, 1μM MS023). In contrast, both SK-N-MC and A673 displayed increased sensitivity to GSK591. This was particularly striking in A673 where only 33.9% of cells were remaining after treatment with the low dose of 100nM GSK591. As expected, in all three cell lines, GSK591 reduced cellular SDMA but also led to a concurrent increase in ADMA in SK-N-MC cells. Likewise, MS023 reduced cellular ADMA levels but also increased SDMA and monomethylation (MMA) (Figure 2G, Supplementary Figure 2). The ability of PRMT5 and Type I inhibition to lead to increases in the alternative form of dimethylation is a well-documented phenomenon of substrate scavenging evident at global levels of ADMA/SDMA (36). Although MS023 has a higher efficacy for PRMT1 over other Type I enzymes (31), we wondered what proportion of the MS023 response was via PRMT1 inhibition. We therefore generated SK-N-MC cell lines with doxycycline-inducible knockdown of PRMT1 and found that depletion of PRMT1 led to a similar effect on cell growth as addition of MS023 (Figure 2H), strongly implying that the effects of MS023 are largely mediated by inhibition of PRMT1. Similarly, shRNA-mediated depletion of PRMT5 affected cell survival to a similar extent as GSK591 (Figure 2I).
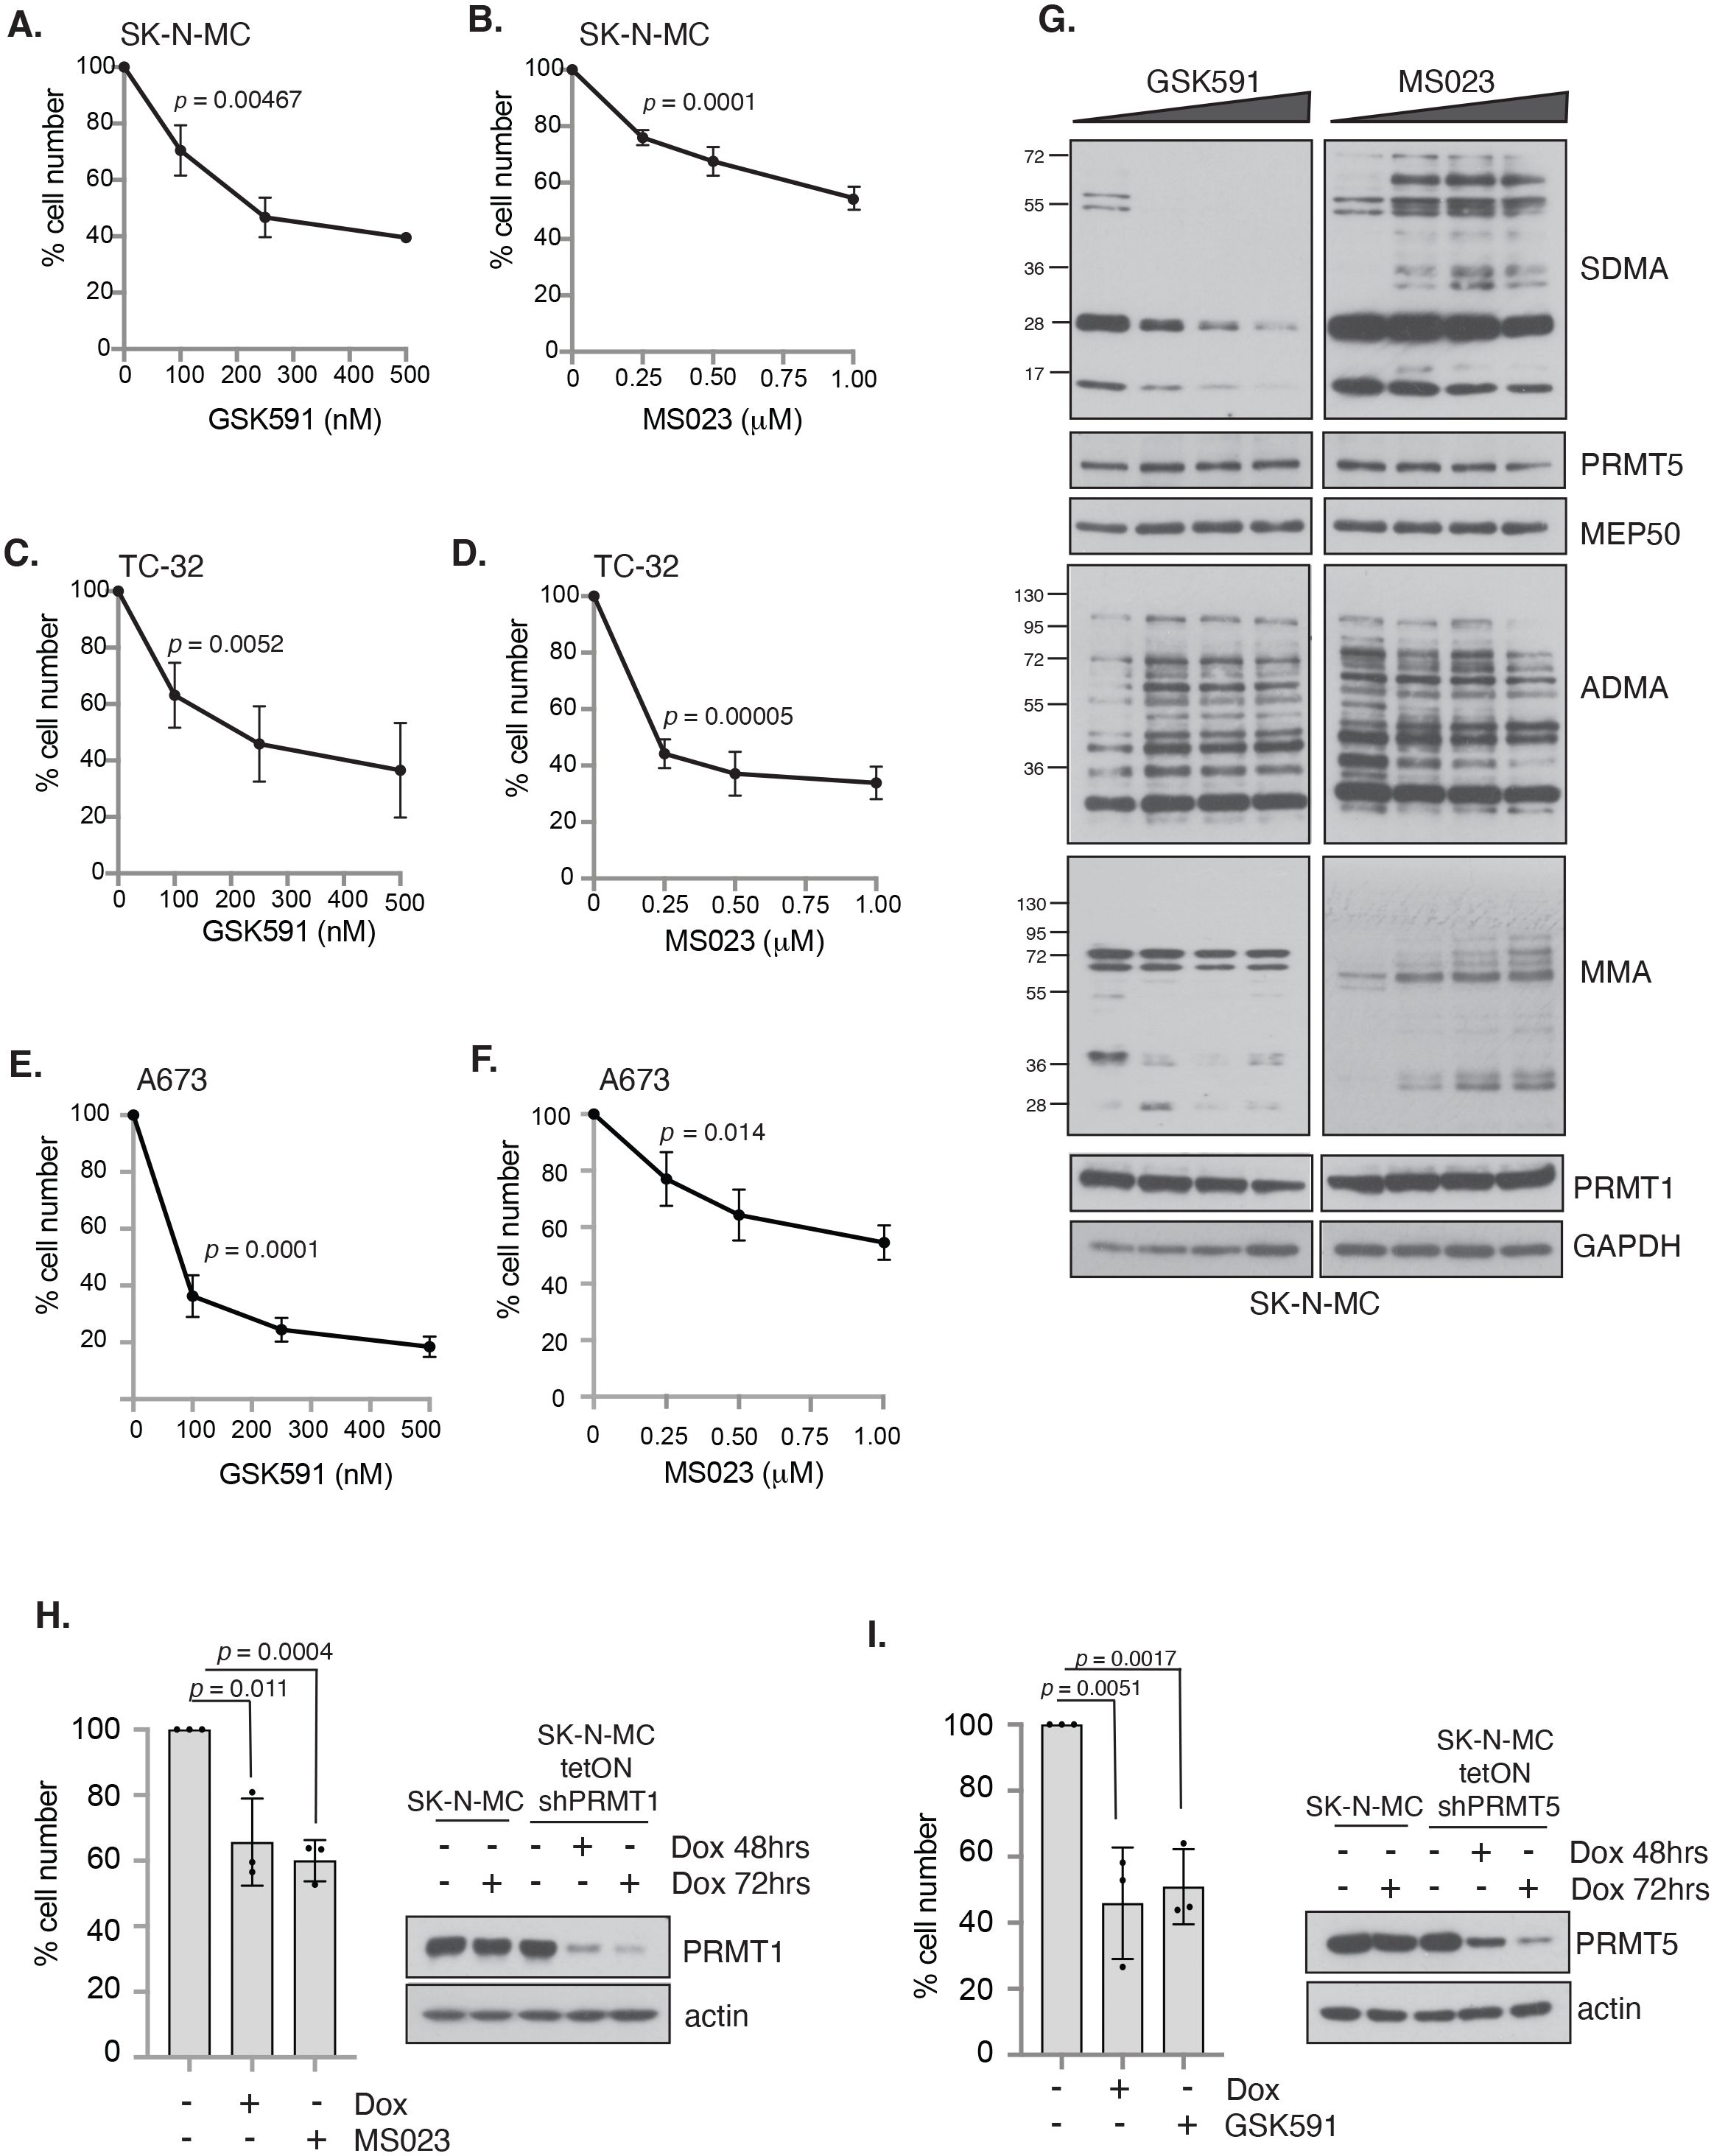
Figure 2. Inhibition of PRMT activity reduces cell viability in a panel of Ewing sarcoma cell lines. Cells were treated with either the PRMT5 inhibitor GSK591 or the Type I PRMT inhibitor MS023 for 4 days and viability measured by trypan blue exclusion. (A, B) SK-N-MC; (C, D) TC-32; (E, F) A673. n=3; mean ± SD; Student’s t-test (two-sided, equal variance). Statistics carried on lowest dose of GSK591 or MS023 compared to untreated. (G) GSK591 and MS023 alters levels of ADMA, SDMA and MMA in SK-N-MC cells. Data representative of n=3 biologically independent experiments. (H) Inducible knockdown of PRMT1 in SK-N-MC cells reduced cell viability to a similar extent as MS023 treatment. Cells were treated with doxycycline (1μg/ml) for 7 days and MS023 (1μM) for 4 days starting 72 hours after start of doxycycline treatment, and viability assessed by trypan blue exclusion. n=3; mean ± SD; Student’s t-test (two-sided, equal variance). (I) Inducible knockdown of PRMT5 in SK-N-MC cells reduced cell viability to a similar extent as GSK591 treatment. Cells were treated with doxycycline (1μg/ml) for 7 days and GSK591 (500nM) for 4 days starting 72 hours after start of doxycycline treatment, and viability assessed by trypan blue exclusion. n=3; mean ± SD; Student’s t-test (two-sided, equal variance).
Combining type 1 inhibitor and GSK591 promotes apoptosis of ES cells but not in normal bone marrow mesenchymal stem cells
One concern for PRMT monotherapy treatment is the possibility that clinically relevant doses may produce adverse effects that limit clinical applications. Alternatively, combining low concentrations of PRMT1 or PRMT5 inhibitors is well tolerated in mice and can synergically reduce growth and promote apoptosis in pancreatic cancer and DLBCL cancer cells (37). Taking low concentrations of GSK591 and MS023 that exhibited partial growth suppression (SK-N-MC = 250nM for both inhibitors; TC-32 = 100nM for both inhibitors; A673 = 100nM for GSK591 and 250nM for MS023), we found that a 4-day treatment of both compounds promoted a greater growth inhibition effect than either monotherapy (Figures 3A–D). This was particularly striking in A673 cells with a 91.06% reduction in cell viability after combination treatment (Figure 3C). Indeed, combination GSK591 and MS023 appears to be promoting apoptosis in all three cell lines, supported by an induction of cleaved caspase-3 (Figures 3D, E). Interestingly, low dose GSK591 was also able to induce a low level of apoptosis as a monotherapy in A673 cells (Figure 3E).
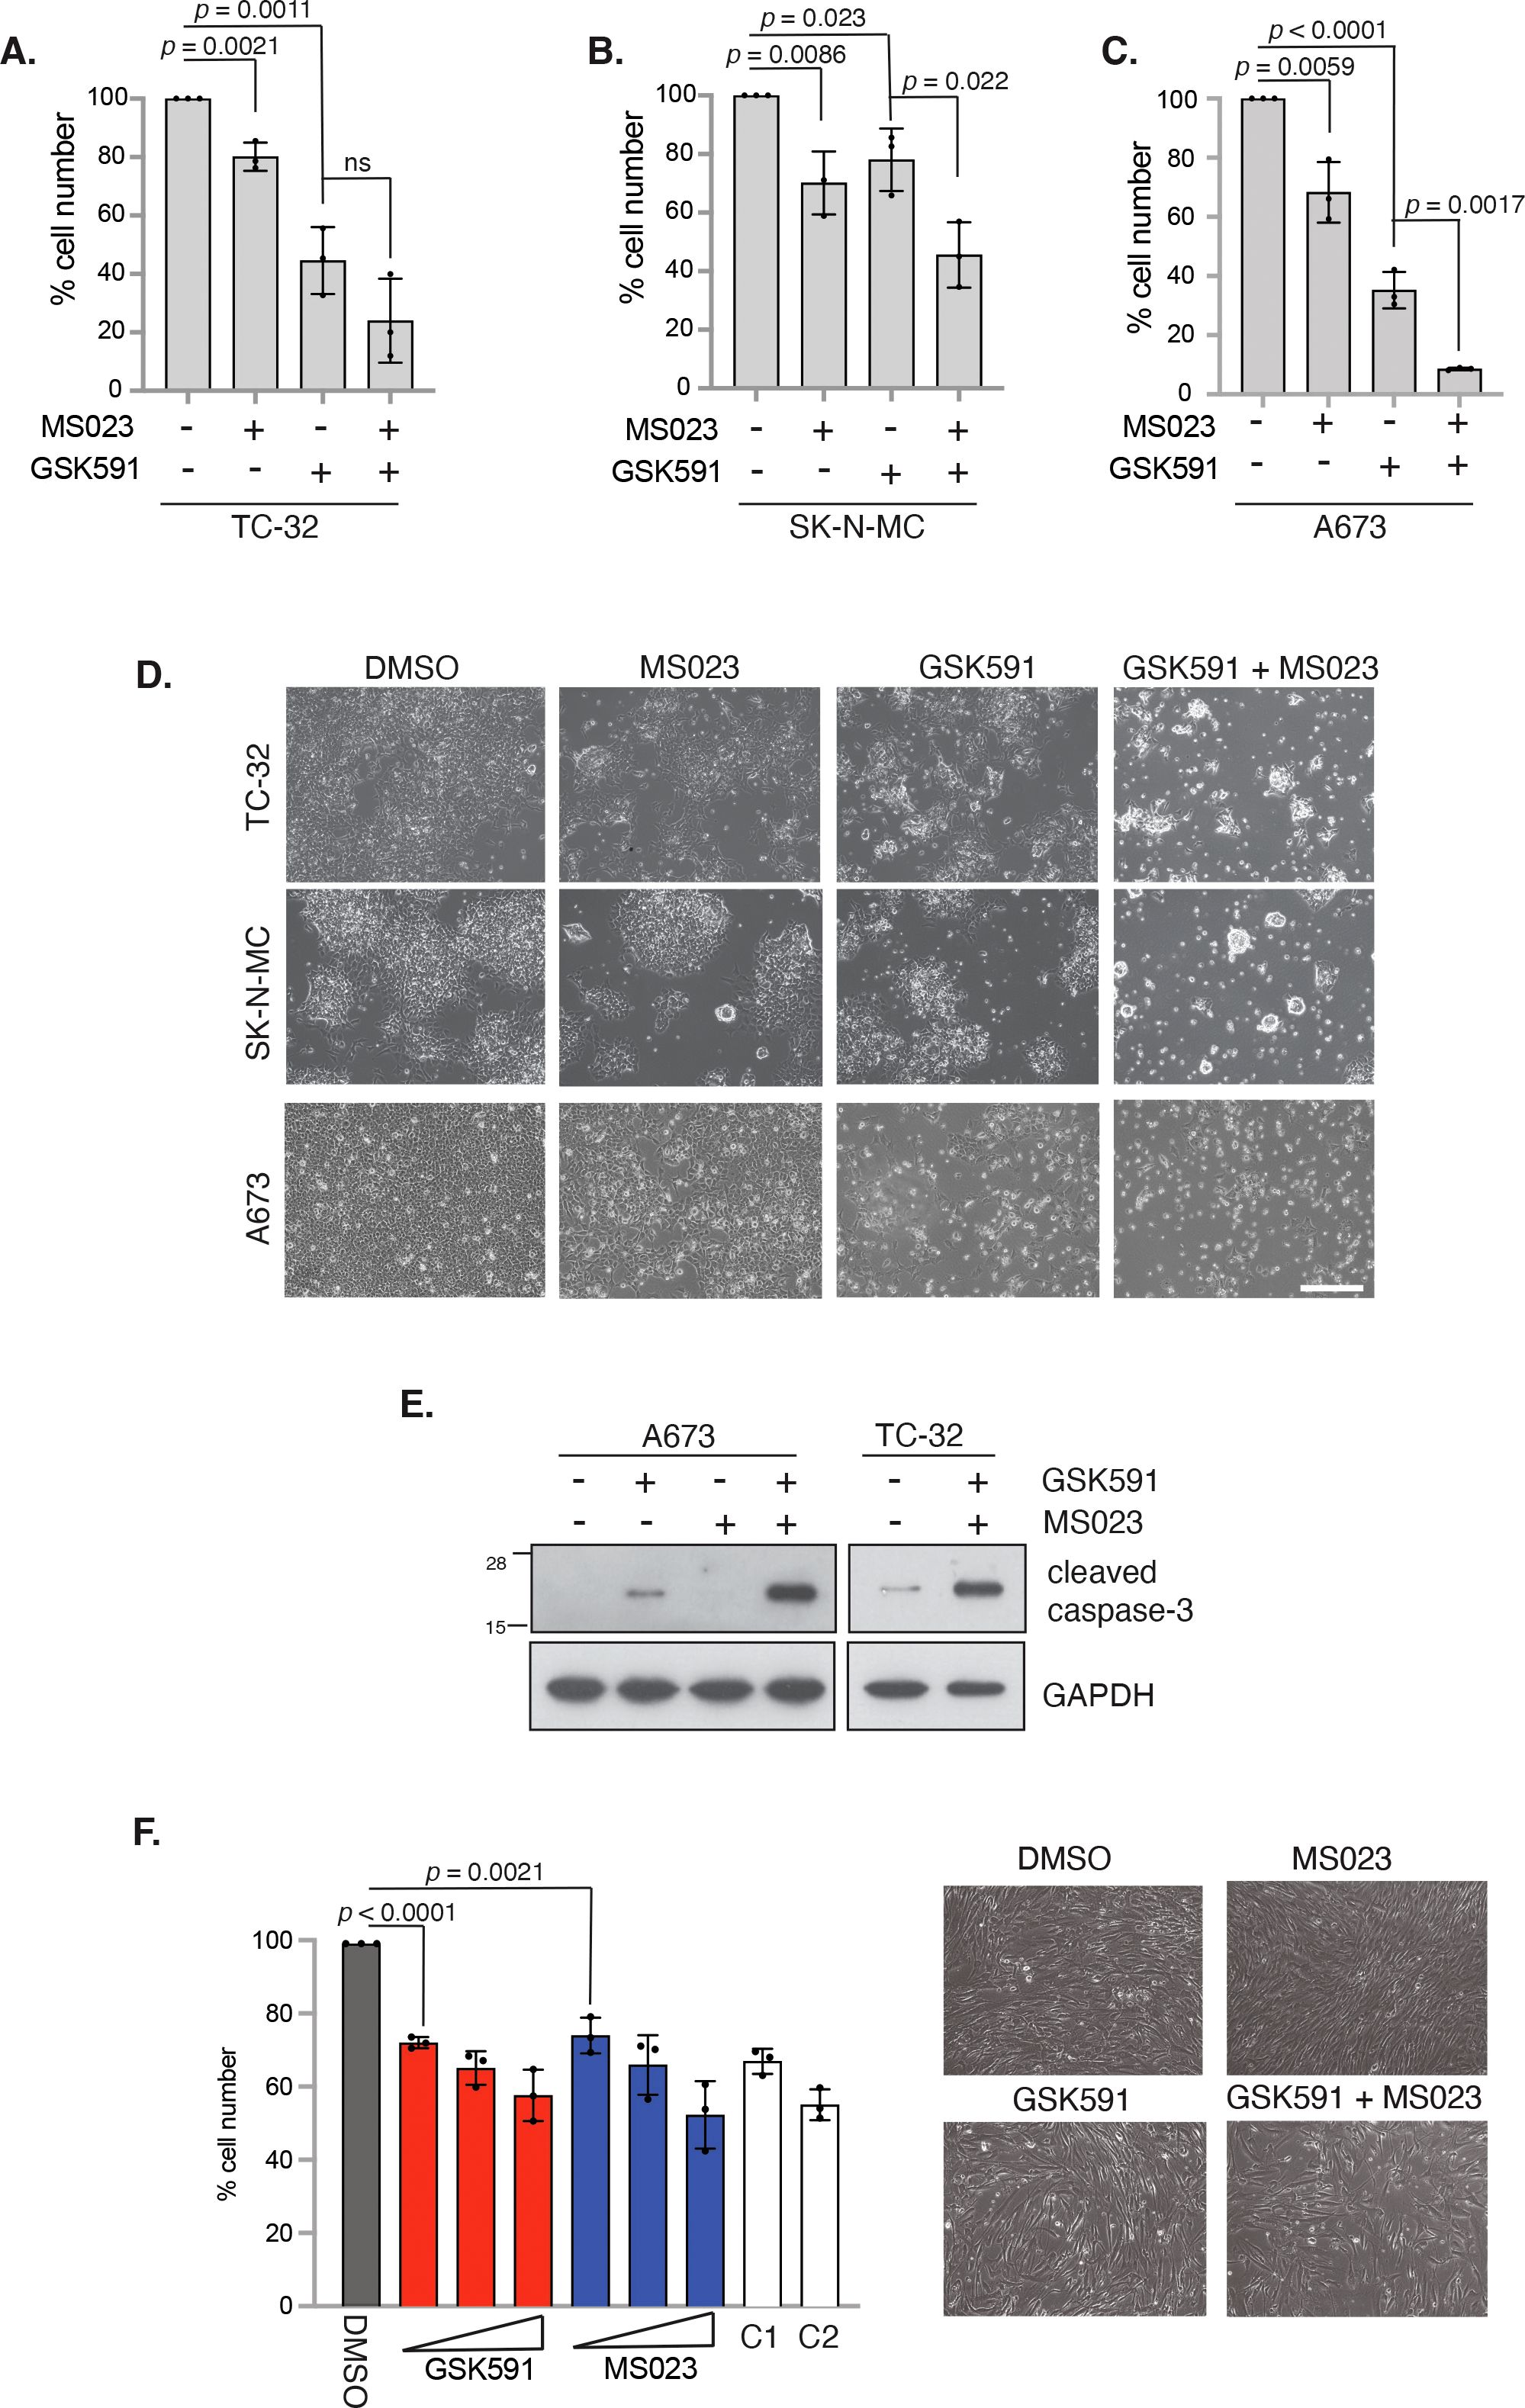
Figure 3. Combination PRMT5 and Type 1 PRMT inhibitors synergise to promote apoptosis in EWS-FLI1 cells. (A) TC-32 cells were treated with 100nM GSK591 or 100nM MS023 for 4 days, and viability assessed by trypan blue exclusion. ns, not significant. (B) SK-N-MC cells were treated with 250nM GSK591 or 250nM MS023 for 4 days, and viability assessed by trypan blue exclusion. (C) A673 cells were treated with 100nM GSK591 or 250nM MS023 for 4 days, and viability assessed by trypan blue exclusion. (D) Representative brightfield images of cells in A-C after 4 days treatment. Scale bar = 300nm. (E) Cells were treated with inhibitors for 4 days and apoptosis assessed by immunoblotting for cleaved caspase-3. (F) Bone marrow mesenchymal stem cells (BMMSCs) were treated with GSK591 (100nM, 250nM, 500nM), MS023 (100nM, 250nM, 1μM) or combination (C1 = 100nM GSK591/MS023; C2 = 250nM GSK591/MS023) for 5 days and viability assessed by trypan blue exclusion. n=3; mean ± SD; Student’s t-test (two-sided, equal variance). To the left of graph: Representative brightfield images of BMMSC after 5 days treatment of MS023 (250nM) and/or GSK591 (250nM). Scale bar = 300nm. In all panels, n=3; mean ± SD; Student’s t-test (two-sided, equal variance).
We next wanted to determine the effects of MS023 and GSK591 on the growth of non-transformed BMMSC cells. Interestingly, we found that monotherapy drug treatments only led to a modest reduction in cell proliferation at the low doses that showed drastic effects in ES cells. For example, 100nM GSK591 or MS023 only lead to a 27.3% and 25.3% reduction in cell proliferation respectively. Moreover, the dose response effect for either MS023 or GSK591 observed in ES cells was largely absent in BMMSCs, and combination treatment of GSK591/MS023 did not further supress growth beyond that of either single agent at the same concentrations nor induced apoptosis (Figure 3F). Taken together, our data implies that GSK591 alone induced low level apoptosis, and that combining low dose Type 1/PRMT5 inhibitors drives a more potent apoptotic response in ES cells. Critically, the effect of either single agent or combined therapy on normal BMMSCs is minimally cytostatic thereby suggesting a therapeutic window of opportunity that could potentially mitigate clinically associated adverse effects.
PRMT inhibitors synergise with olaparib inducing cell death and are dependent on EWSR1::FLI1 expression for cytotoxic effect
The defining feature of 85-90% of ES cancers is expression of the EWS-FLI1 oncogenic fusion protein that is essential for cellular transformation and cancer growth (1, 38). Direct drug targeting of EWS-FLI1 is challenging given the lack of catalytic activity, hence pathways that are dependent on the function of EWS-FLI1 have been suggested as an alternative approach that could confer synthetic lethal and hence tumour-specific targeting. Firstly, we examined if EWS-FLI1 contributes to expression of PRMT family members by interrogating the ESCLA RNA-sequencing datasets derived from a panel of 18 ES cell lines that had undergone shRNA-mediated depletion of EWSR1::FLI1 (33). We found that reducing EWSR1::FLI1 expression did not affect transcript levels of PRMT family members or MEP50 (Supplementary Figure 3A). Likewise, neither GSK591 nor MS023 altered EWS-FLI1 protein levels (Supplementary Figure 3B). Next, we wanted to understand if the growth inhibition exhibited by GSK591 and/or MS023 treatment was dependent on the EWS-FLI1 oncogenic fusion protein. To achieve this, we focused on the engineered A673 cell line utilised in the ESCLA dataset (A673-tetON-shEWSR1::FLI1 (28)) that enables controllable suppression of the oncogenic fusion without a major compromise in cell viability (Figure 4A). Here, we found that the effects of single agent GSK591 and MS023 were largely supressed by partial depletion of EWSR1::FLI1 (Figures 4B, C; Figure 4E Lane 3 and 4), however the reduced viability exhibited by combining GSK591/MS023 was only partially dependent on ESWR1::FLI1 (Figure 4E, Lane 5). This data therefore indicates a functional link between PRMT1, PRMT5 and EWS-FLI1 that is important for ES cell survival, but that dual MS023/GSK591 therapy that suppresses most arginine methylation events in the cell reduces cell survival in both a fusion dependent and independent manner.
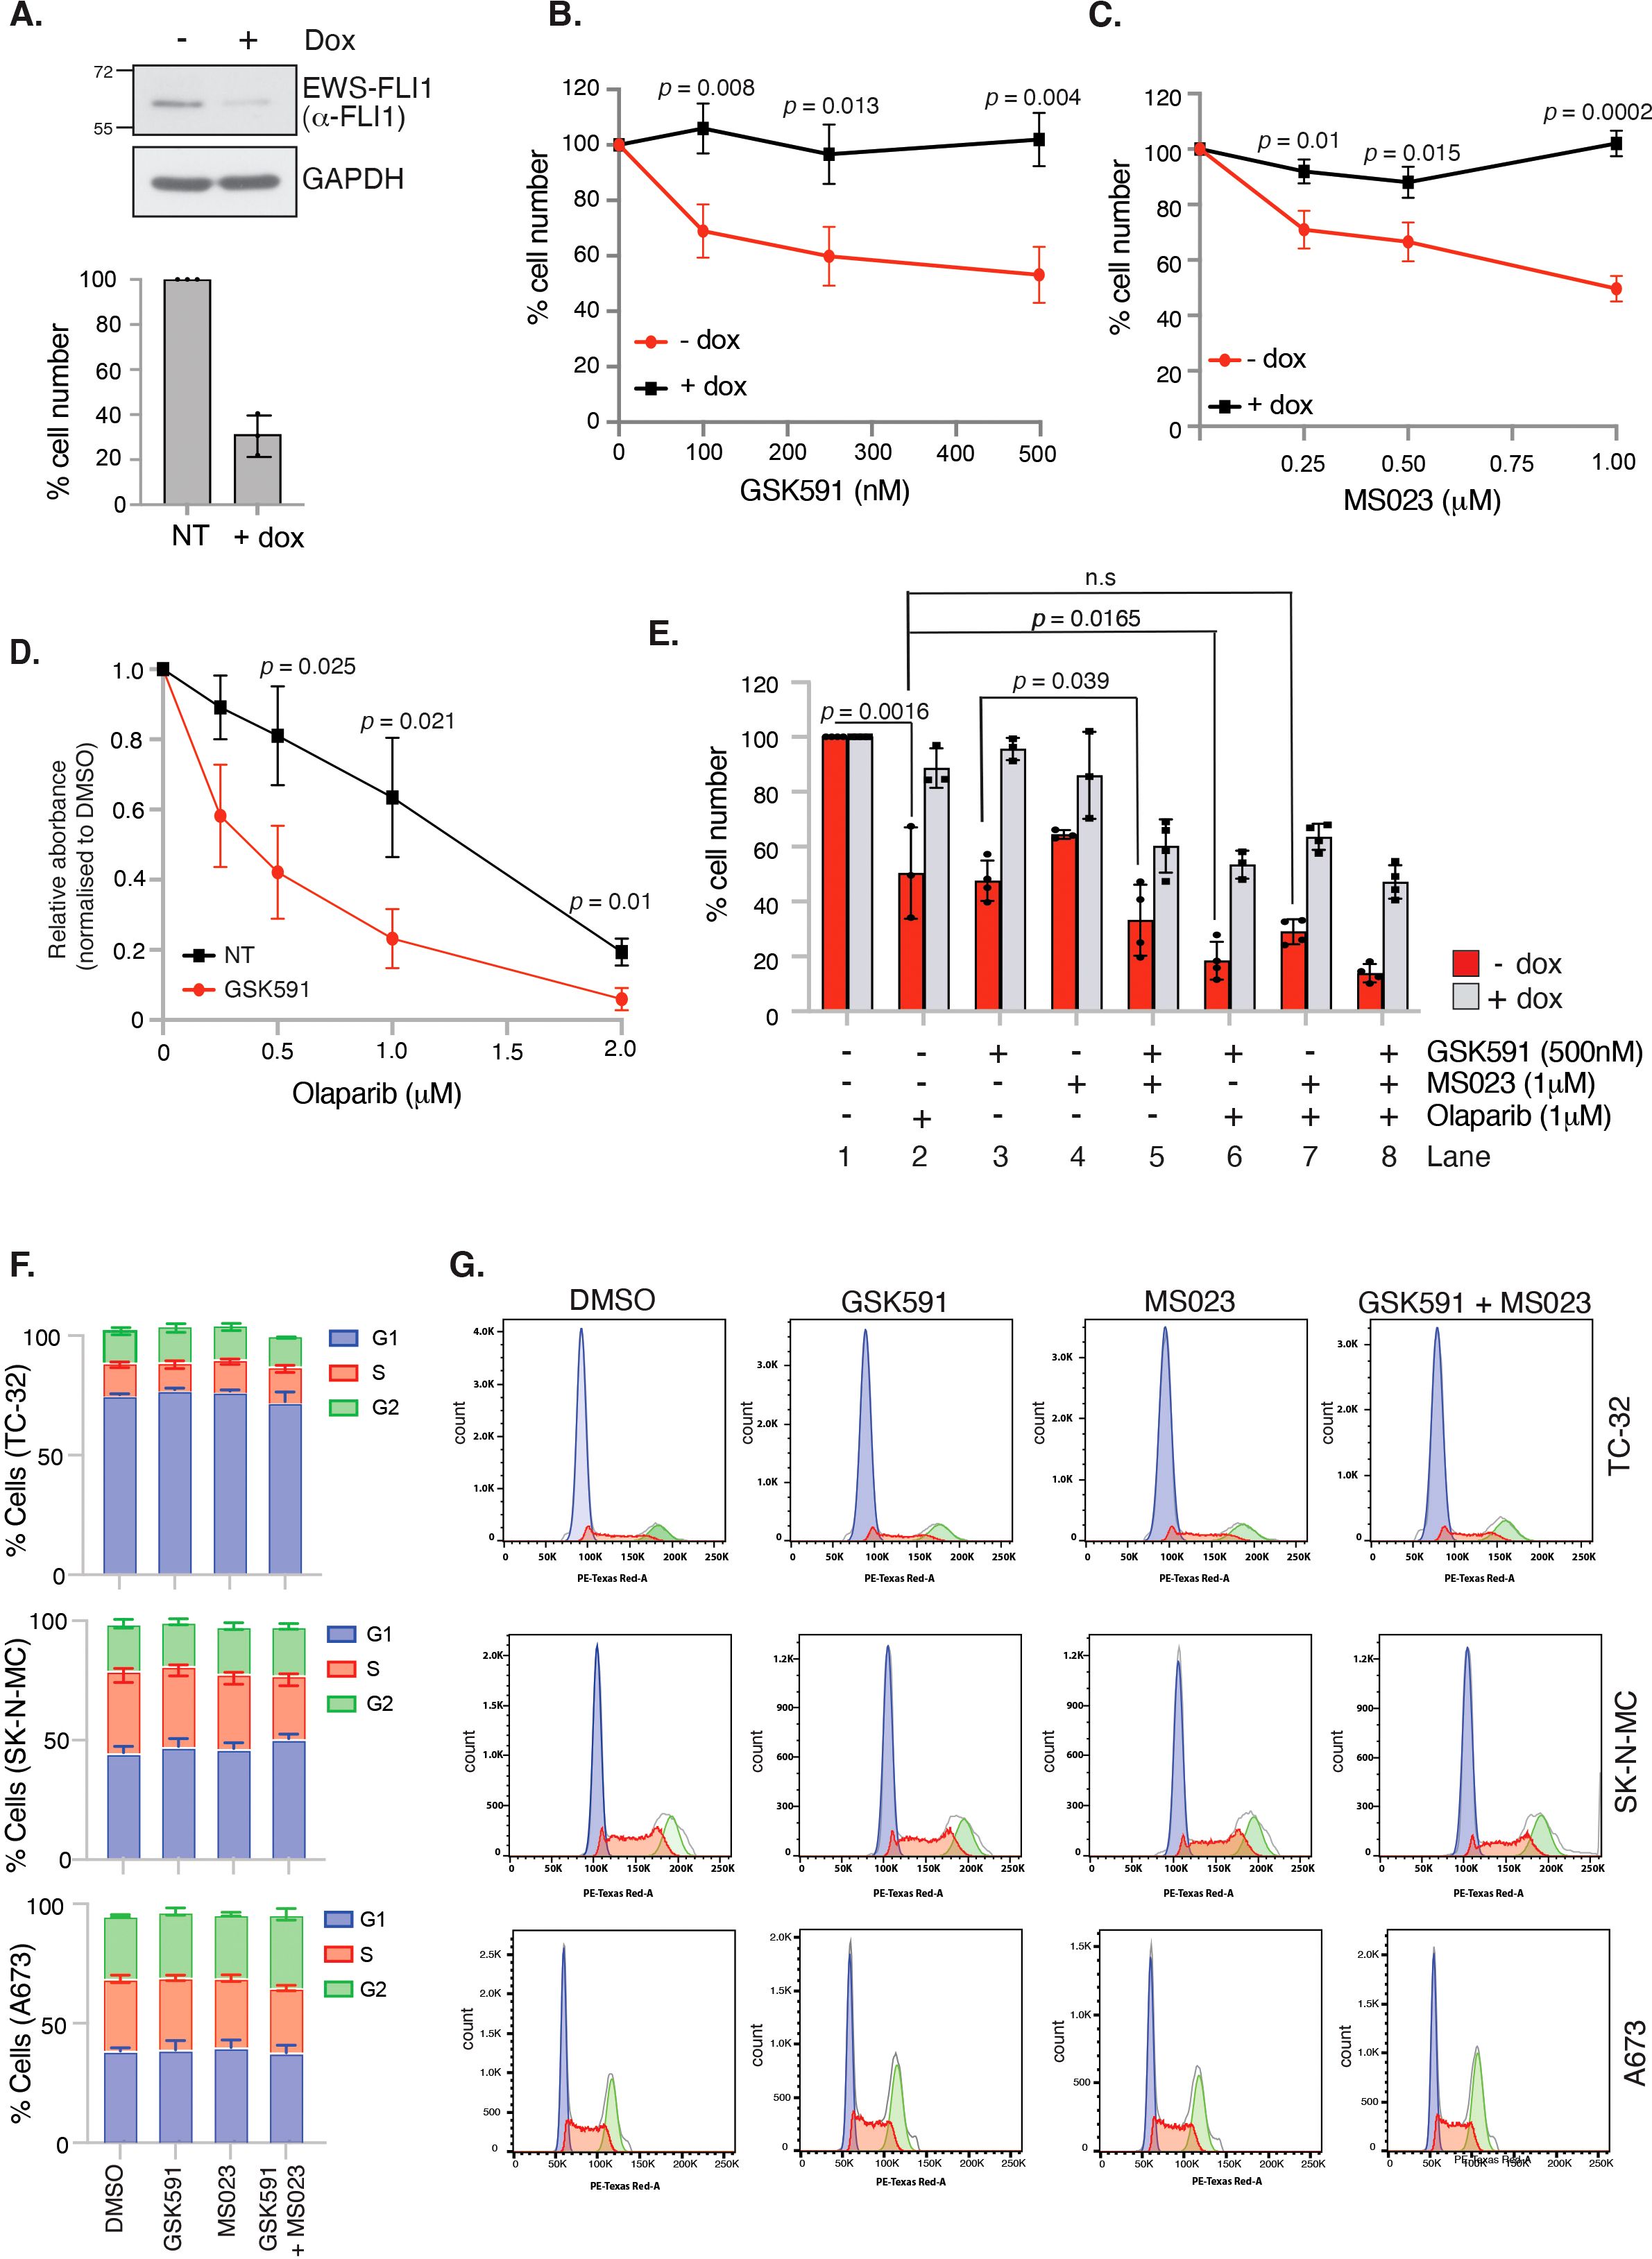
Figure 4. GSK591 and MS023 reduce A673 cell viability in a EWSR1::FLI1-dependent manner. (A) Immunoblot demonstrating inducible knockdown of EWSR1::FLI1 in A673-tetON-EWSR1::FLI1 cells with corresponding decrease in cell viability, as measured by trypan blue exclusion. Cells were treated with 2μg/ml doxycycline for 7 days before analysis. n=3; mean ± SD. (B) Knockdown of EWSR1::FLI1 suppresses GSK591-induced reduction in cell viability. A673-tetON-EWSR1::FLI1 cells were treated for 3 days with doxycycline before drug treatment with GSK591 for a further 4 days. Cell proliferation was measured by trypan blue exclusion assay. n=3; mean ± SD; Student’s t-test (two-sided, equal variance). (C) Knockdown of EWSR1::FLI1 suppresses MS023-induced reduction in cell viability. A673-tetON-EWSR1::FLI1 cells were treated for 3 days with doxycycline before drug treating with MS023 for a further 4 days. n=3; mean ± SD; Student’s t-test (two-sided, equal variance). (D) GSK591 (125nM) A673 cells to olaparib. Cells were treated for 6 days and cell viability/metabolism measured by MTT assay. n=3; mean ± SD; Student’s t-test (two-sided, equal variance). (E) GSK591 synergises with olaparib to reduce viability that is partially dependent on EWSR1::FLI1. A673-tetON-EWSR1::FLI1 cells were treated for 3 days with doxycycline before drug treating with MS023 (1μM) and/or GSK591 (500nM) for a further 4 days. Olaparib (1μM) was administered for 7 days. Cell proliferation was measured by trypan blue exclusion assay. n>3; mean ± SD; Student’s t-test (two-sided, equal variance). ns, not significant. (F) 48 hrs GSK591, MS023 or combination does not affect cell cycle. TC-32 = 100nM GSK591/MS023; SK-N-MC = 250nM GSK591/MS023; A673 = 100nM GSK591; 250nM MS023. n=3; mean ± SD. (G) Representative cell cycle profiles of data presented in (F).
Next, we wanted to examine if PRMT inhibitors could synergise with olaparib in A673 cells. ES cells are genetically BRCA1 wildtype, however the ability of the EWS-FLI1 fusion protein to sequester BRCA1 promotes HR deficiency leading to olaparib sensitivity (6). Moreover, both PRMT1 and PRMT5 are known regulators of HR-mediated repair. For example, PRMT5 methylates RUVBL1 leading to 53BP1 mobilisation from double strand break ends and is required for the splicing of DNA repair genes (18, 39), whilst PRMT1-mediated methylation of MRE11 is enhanced in S/G2 phase of the cell cycle enabling nuclease-mediated DNA end resection that commits a cell to HR-mediated repair (24, 40). Treatment with low dose GSK591 led to a dose-dependent sensitisation of A673 cells to olaparib (Figure 4D). As expected, olaparib was only effective in reducing the survival of A673 cells when EWS-FLI1 was expressed (Figure 4E, Lane 2). Combination GSK591 and olaparib treatment was partially rescued by EWSR1::FLI1 depletion (Figure 4E, Lane 6) implying that mechanisms of cytotoxicity with GSK591/olaparib involve both fusion dependent and independent events. Interestingly, we found that combining olaparib with MS023 did not lead to a significant reduction in cell viability (Figure 4E; compare Lane 2 and 7), suggesting that in ES cells, SDMA but not PRMT1-dependent ADMA contributes to DNA repair after olaparib-induced damage. One explanation for a lack of additive effect between MS023 and olaparib is the potential for MS023 to lead to a G1 cell cycle arrest, thereby reducing the number of cells that can enter S-phase and encounter olaparib-induced damage (41). However, 48 hrs treatment of single agent MS023 or GSK591, or combination MS023/GSK591 treatment, did not affect the cell cycle nor the ability of A673 cells to enter S-phase and undergo DNA synthesis (Figures 4F, G, Supplementary Figure 4). Taken together, our data suggests that combining PRMT5 inhibitors with agents that require DNA replication for cytotoxicity is an interesting new avenue for the treatment of ES.
Arginine methylation regulates genome stability in ES cells
Having demonstrated that PRMT inhibitors lead to reduced cell viability and apoptosis, we next wanted to determine if this was due to increased DNA damage leading to genome instability. We therefore treated TC-32 cells with low dose GSK591 and MS023 and quantified the number of DSBs as indicated by 53BP1 foci formation 24 hrs after drug treatment, hence capturing the early events before cell death. Monotherapy of MS023 or GSK591 resulted in a significant amount of DNA damage in the absence of exogenous stressors, which was significantly exacerbated by combining GSK591 with MS023 (Figure 5A). Likewise, depletion of PRMT1 or PRMT5 in A673 cells led to elevated DNA damage as determined by 53BP1 foci formation (Figure 5B; Supplementary Figure 5). Focusing on the effects of GSK591, either alone, or in combination with olaparib, we found that GSK591 monotherapy resulted in a significant amount of DNA damage in A673 cells, as determined by γH2AX intensity and 53BP1 foci formation. Combining GSK591 with olaparib, or depleting PRMT5 with siRNA, induced more DNA damage than either agent alone (Figures 5B–D) suggesting that the reduced viability is in part due to a defective DNA damage response. Indeed, depletion of PRMT5 reduced olaparib-induced RAD51 foci formation implying defective HR (Figure 5E). Interestingly, we noticed that GSK591 appeared to induce two populations of cells with one group experiencing relatively high levels of damage per cell. Given that the main mechanism of olaparib cytotoxicity is through the trapping of PARP leading to DNA replication interference and replication stress (42), we posit that GSK591 may be further promoting replication stress and therefore be a more potent inducer of DNA damage in S-phase cells. Supporting this, we found that GSK591-induced DSBs were enriched in EdU+ S-phase cells (Figure 5F) and that levels of RPA phosphorylation (Ser4/8), a marker of RS-induced checkpoint activation and regulator of replication for restart and late origin firing (43), were similar to that induced by single agent olaparib treatment (Figure 5G). As such, combination GSK591 and olaparib greatly increased RPA and Chk1 phosphorylation (Figure 5G). Moreover, GSK591 also sensitised A673 cells to the replication stress-inducing agent hydroxyurea (Figure 5H). Taken together, our data suggests that PRMT5 is required for the replication stress response in ES and that inhibition leads to accumulation of DNA damage during S-phase that manifests to a cytotoxic level over time and predisposes cells to additional replication-inducing agents such as PARP inhibitors.
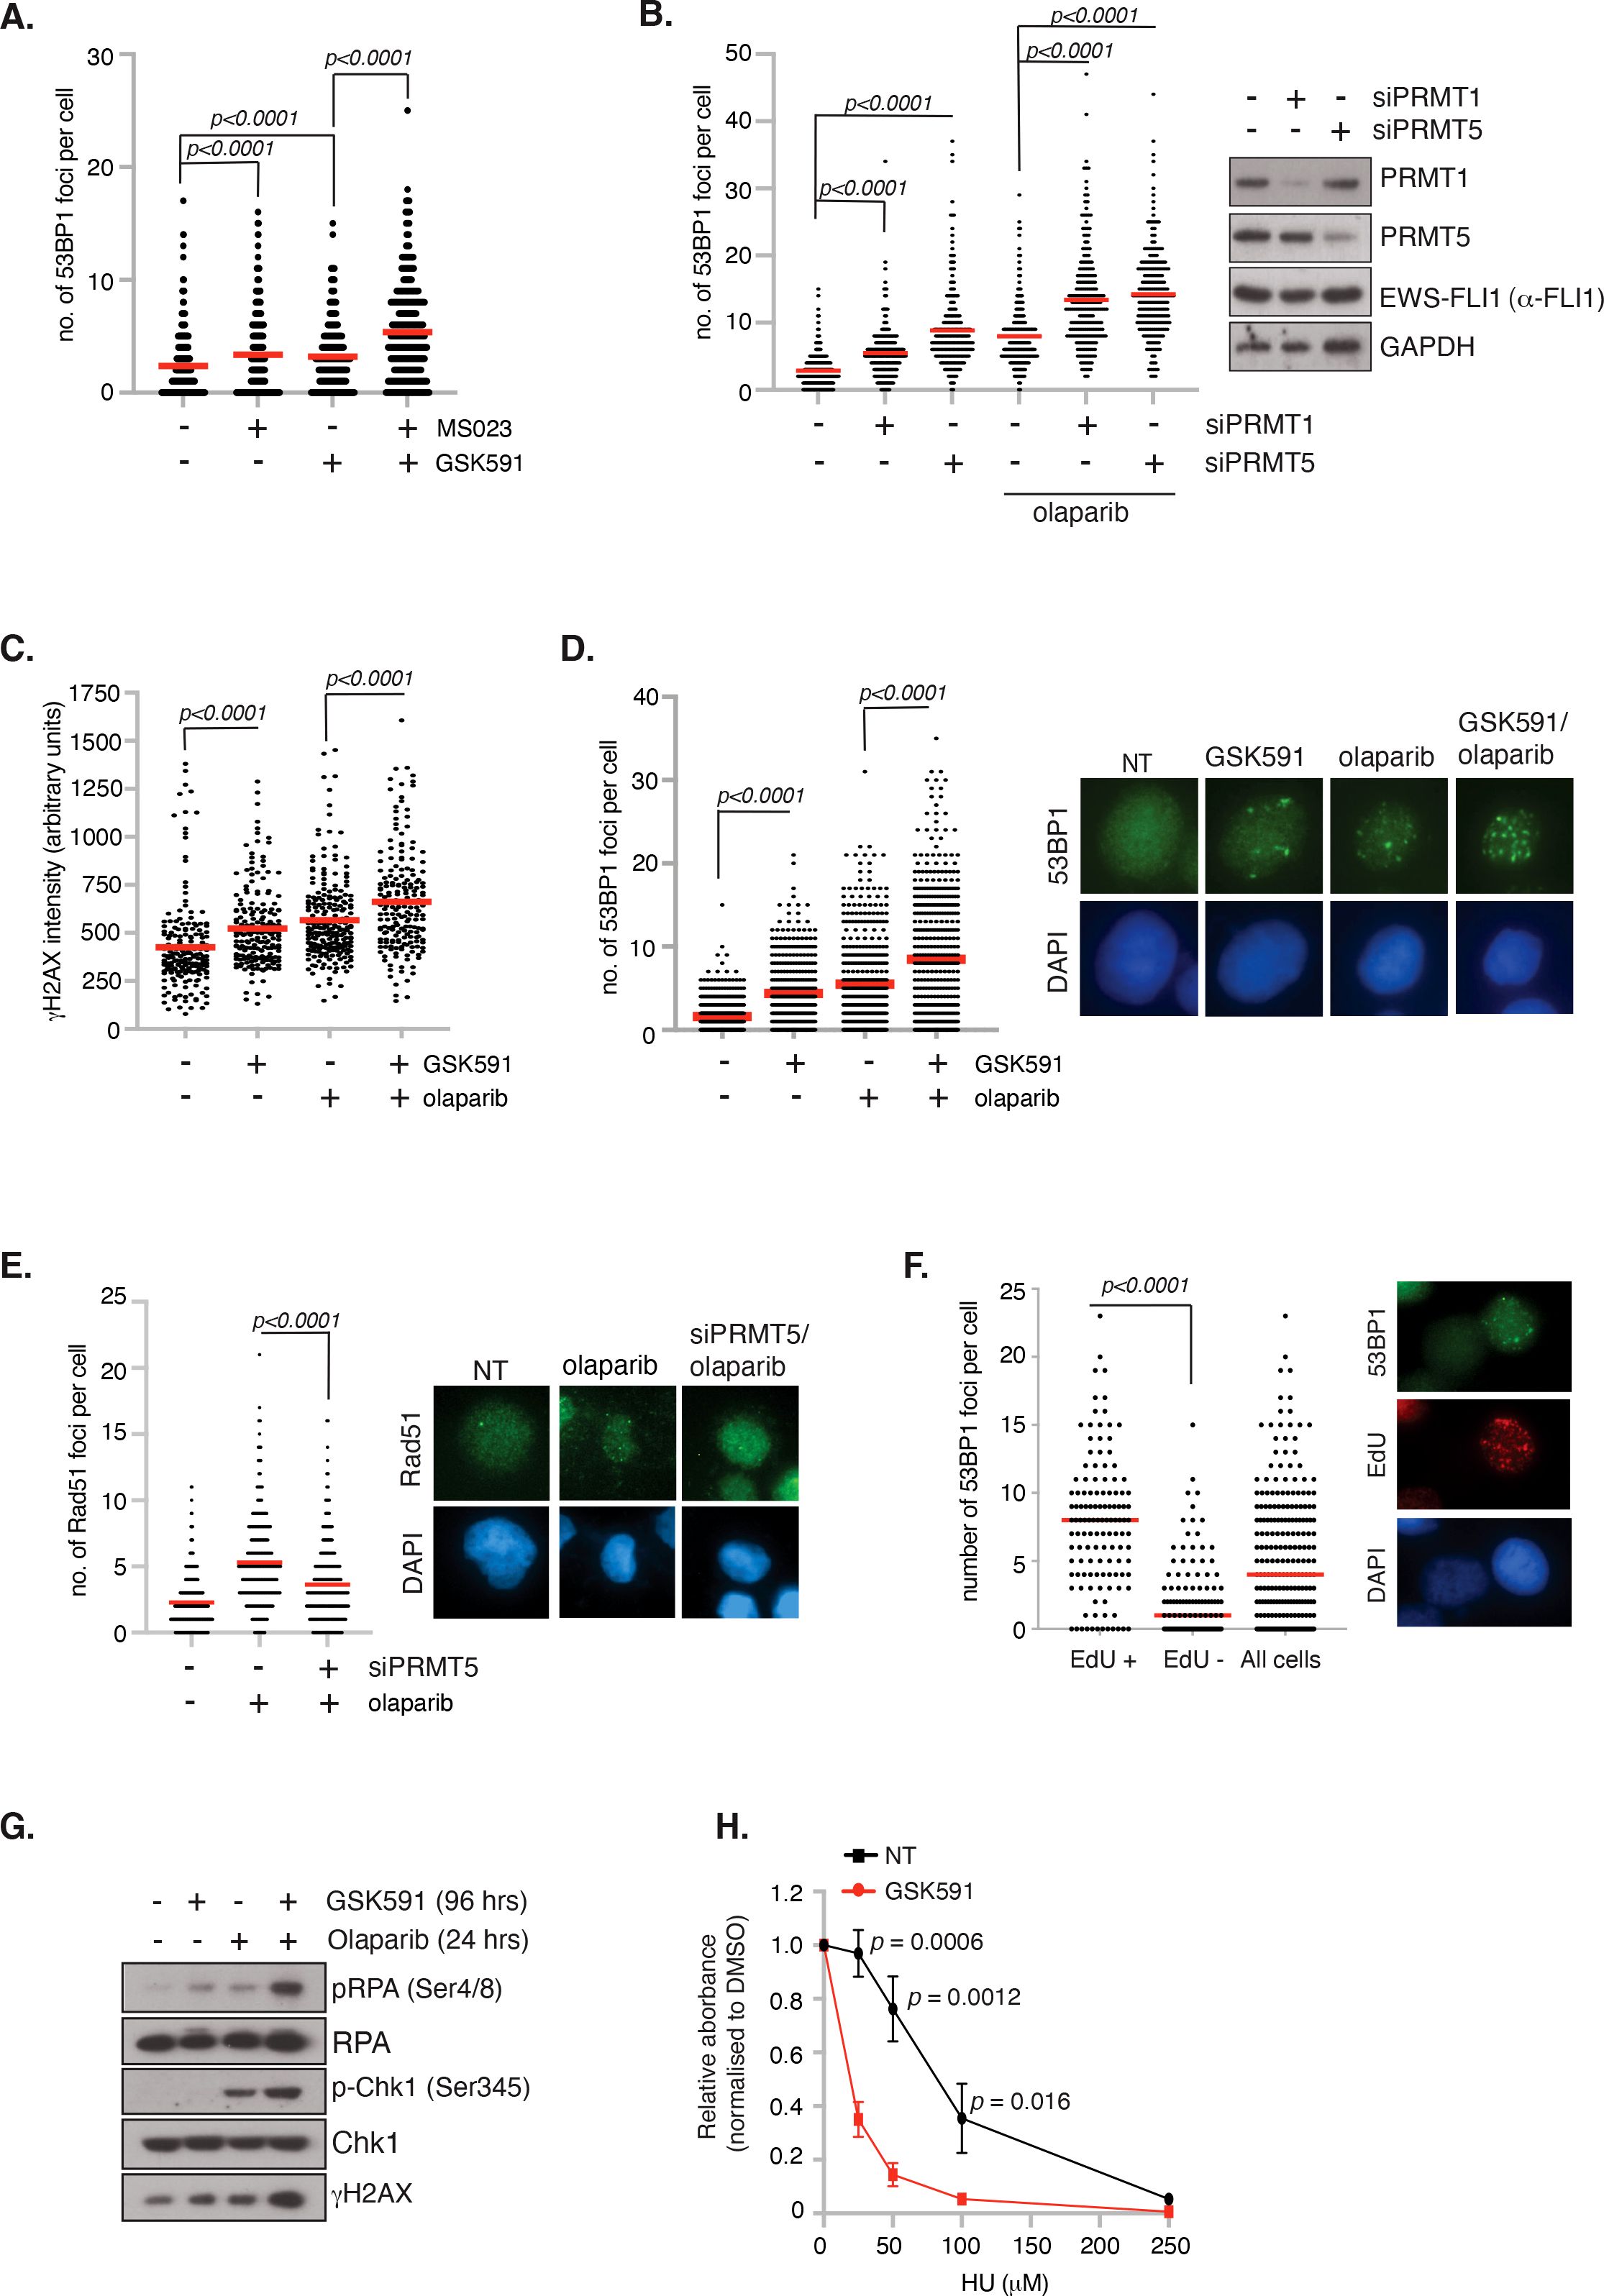
Figure 5. Inhibition of PRMT5 promotes replication stress and DNA damage. (A) TC-32 cells were treated with 100nM GSK591, MS023 or in combination for 24 hrs and the number of 53BP1 foci per cell quantified. At least 100 cells per biological replicate were analysed. n=3; mean ± SD; Student’s t-test (two-sided, equal variance). (B) Depletion of PRMT1 and PRMT5 in A673 cells induces 53BP1 foci formation and augments olaparib (1μM; 24 hrs)-induced damage. At least 75 cells per biological replicate were analysed. n=3; mean; Student’s t-test (two-sided, equal variance). (C, D) GSK591 synergises with olaparib inducing (C) γH2AX and (D) 53BP1 foci. A673 were pretreated with GSK591 (500nM) for 72 hrs or olaparib (1μM) for 24 hrs. For combination treatments, cells were pretreated with GSK591 for 48 hrs before addition of olaparib for a further 24 hrs. At least 100 cells per biological replicate were analysed. n=3; Student’s t-test (two-sided, equal variance). Representative images are to the right of data. (E) Depletion of PRMT5 in A673 cells supresses olaparib-induced Rad51 foci formation. At least 75 cells per biological replicate were analysed. n=3; mean; Student’s t-test (two-sided, equal variance). Representative images are to the right of the data. (F) DNA damage induced by PRMT5 inhibition in A673 cells is enriched in EdU+ S-phase cells. Cells were treated with GSK591 (500nM) for 48 hrs and the number of 53BP1 foci per cell analysed. n=2; mean; Student’s t-test (two-sided, equal variance). Representative images are to the right of the data. (G) Combination GSK591 (500nM; 4 days) and olaparib (5μM; 24 hrs) induces a replication stress response as indicated by increased phosphorylation of RPA and Chk1. Immunoblot is representative of 3 biological experiments. (H) GSK591 (125nM) sensitises A673 cells to hydroxyurea (HU). Cells were treated for 6 days and cell viability/metabolism measure by MTT assay. n=3; mean ± SD; Student’s t-test (two-sided, equal variance).
Discussion
In this study, we identify a role for the arginine methyltransferases PRMT1 and PRMT5 in the survival of Ewing sarcoma cells. We find that PRMT1 and PRMT5 expression is elevated in a panel of ES cell lines and regulates genome stability because inhibition of either PRMT1 or PRMT5 resulted in DNA damage and DSB induction that was significantly exacerbated by combining both PRMT inhibitors. Mechanistically, PRMT5 appears to be involved in the replication stress response because GSK591 preferentially led to DNA damage in S-phase cells and can potentiate the effects of replication stress-inducing agents olaparib and HU promoting cell death. Interestingly, BMMSCs representative of normal tissue only experienced modest growth inhibition after combination of both inhibitors. This, coupled with our findings that the effects of PRMT inhibitors depend on the expression of EWSR1::FLI1, indicate that drug treating ES patients with PRMT inhibitors, with or without PARP inhibitors, offers a potential new therapeutic approach.
Clinical inhibition of PRMT activity has gained significant interest in the treatment of adult solid cancers and haematological disease with PRMT5 inhibitors rapidly entering phase I/II clinical trials (22). Whereas PRMT1 inhibitors struggled in Phase I with no inhibitor currently in clinical development, first-generation PRMT5 inhibitors have demonstrated encouraging clinical activity with good target engagement and manageable adverse effects (44–46). However, predictive biomarkers for response are lacking and have thus limited the drug development of these first-generation PRMT5 inhibitors. Our in vitro analysis using a panel of ES cell lines treated with the PRMT5 tool compound GSK591 are therefore particularly encouraging for the treatment of ES patients. Given that the effect of PRMT5 inhibition is largely dependent on the presence of the ES-specific fusion, we hypothesise that this fusion-induced sensitivity to PRMT5 inhibition provides a unique therapeutic window compared to normal tissues. As such, the fusion itself could potentially serve as predictive biomarker for responses to first-generation PRMT5 inhibitors.
ES are highly aggressive cancers and GSK591 demonstrated synergy with olaparib and HU. As such, rather than proposing single agent PRMT5 inhibitor treatment, a combination treatment with a next generation PARP1 specific inhibitor that displays less haematologic toxicity, e.g. AZD5305 (47) could be promising. Our data thus supports further studies evaluating the in vivo efficacy of first-generation PRMT5 inhibitors in combination with PARP inhibitors in preclinical ES PDX models, as well as more detailed mechanistic analysis and potential biomarker development beyond the EWS-FLI1 fusion protein. Interestingly, although ES is a cancer of low mutational burden, 12% of patients have CDKN2A deletion (48) an event that often leads to co-deletion of MTAP. MTAP is an enzyme that is part of the methionine salvage pathway that metabolically converts methylthioadenosine (MTA) to methylthioribose (MTR) and adenine ultimately leading to methionine regeneration. MTA was shown to biochemically compete with SAM for PRMT5 binding leading to a moderately potent but selective inhibition (49–51). Consequently, MTAP deleted cancers are particularly vulnerable to further inhibition with second-generation PRMT5 inhibitors that can selectively target the PRMT5:MTA complex leading to a synthetic lethal relationship (52, 53). As these second-generation inhibitors are also in Phase I development for adult cancers [NCT06672523; NCT063690354; NCT06137144; NCT06130553; NCT06589596], including adult sarcoma [NCT05732831], a clinical trial with one of these inhibitors in ES patients with MTAP deletion could also be considered after further preclinical in vitro and in vivo assessment. Together, our data using the PRMT5 inhibitor GSK591 has the potential to rapidly expedite clinical trial development in paediatric and young adult ES patients using these compounds.
Whilst many of the identified oncogenic functions of EWSR1::FLI1 are known functions of PRMTs, the detailed mechanisms by which PRMTs regulate the survival of EWSR1::FLI1 ES cells is still largely unknown. ES cells experience a high degree of replication stress and R-loop formation due to EWS-FLI1-dependent promotion of CDK9-mediated RNA Polymerase II activation (6, 54). To counteract this, ES cells upregulate proteins that are part of the normal replication stress response providing a buffering system to ensure cancer cell survival. Consequently, treatment of ES cells with drugs that inhibit essential components of the replication stress response, e,g. Chk1, ATR and CDC7 (54–57), or further exacerbate replication stress [e.g. replication inhibiting agents aphidicolin, clofarabine and PARP inhibitors (6, 56)] induced DNA damage and cell death and are being explored clinically in ES patients. For example, ES patients with classical EWSR1 fusions have been included in the ESMART (European Proof of Concept Therapeutic Stratification Trial of Molecular Anomalies in Relapsed or Refractory Tumors in Children and Adolescents) trial (58, 59) comprising of Arm D [combination irinotecan and olaparib (12)] and Arm N [combination olaparib and ATR inhibitor ceralasertib (60)]. Likewise, a Phase II randomised trial of the PARP inhibitor talazoparib with liposomal irinotecan vs temozolomide with liposomal irinotecan is currently being undertaken in relapsed/refractory ES patients [NCT04901702], whilst a single arm Phase II study of trabectidine with low dose irinotecan appears promising [NCT04067115] (61). Our findings that PRMT5 is upregulated in ES cells contributing to genome stability and DNA repair after replication stress is highly suggestive that PRMT5 is an unappreciated component of the ES cell replication stress buffering system counteracting deleterious EWSR::FLI1-induced replication stress. This finding allows us to consider PRMT5 inhibitors as an additional and potentially more targeted class of drugs to treat ES. Future studies that understand the contributions of PRMT5 to the replication stress response in ES cells will shed new light into the mechanisms of malignant progression and resistance development that could be further exploited therapeutically.
Data availability statement
The original contributions presented in the study are included in the article/Supplementary Material. Further inquiries can be directed to the corresponding authors.
Ethics statement
Ethical approval was not required for the studies on humans in accordance with the local legislation and institutional requirements because only commercially available established cell lines were used.
Author contributions
CW: Data curation, Investigation, Methodology, Writing – review & editing. CB: Data curation, Investigation, Writing – review & editing. GM: Data curation, Investigation, Writing – review & editing, Software. EO: Data curation, Investigation, Writing – review & editing. SG: Conceptualization, Data curation, Investigation, Project administration, Supervision, Writing – original draft, Writing – review & editing. EP: Data curation, Writing – review & editing. CD: Conceptualization, Data curation, Funding acquisition, Investigation, Methodology, Project administration, Supervision, Writing – original draft, Writing – review & editing.
Funding
The author(s) declare that financial support was received for the research and/or publication of this article. This work was supported by funds exclusively awarded to CD via a CRUK programme grant (C52376/A25500). The authors declare that this study received funding from AstraZeneca. The funder was not involved in the study design, collection, analysis, interpretation of data, the writing of this article or the decision to submit it for publication.
Acknowledgments
We thank Dr. Kelly Chiang for help with flow cytometry and Prof. Sue Burchell for her kind gift of Ewing sarcoma cell lines TC-32, SK-N-MC, TTC-466, RD-ES and Prof. Heinrich Kovar for the A673-tetON-shESWR1::FLI1 cell line (with permission of Prof. Xavier Alonso who originally created it). We thank Prof. Helen McGettrick and Prof. Joanna Parish for gifting the BMMSC and HFF-1 cell lines respectively.
Conflict of interest
CD has received research funding from AstraZeneca. SG has/has had an advisory role for EMD Serono/MERCK KGaA, AMGEN, and GILEAD; signed a consultancy agreement with AstraZeneca and Schroedinger Therapeutics; and received research funding from AstraZeneca own grant outside this project and fee to institution, GSK fee to institution, and BAYER grant outside of this project.
The remaining authors declare that the research was conducted in the absence of any commercial or financial relationships that could be construed as a potential conflict of interest.
The author(s) declared that they were an editorial board member of Frontiers, at the time of submission. This had no impact on the peer review process and the final decision.
Generative AI statement
The author(s) declare that no Generative AI was used in the creation of this manuscript.
Publisher’s note
All claims expressed in this article are solely those of the authors and do not necessarily represent those of their affiliated organizations, or those of the publisher, the editors and the reviewers. Any product that may be evaluated in this article, or claim that may be made by its manufacturer, is not guaranteed or endorsed by the publisher.
Supplementary material
The Supplementary Material for this article can be found online at: https://www.frontiersin.org/articles/10.3389/fonc.2025.1538208/full#supplementary-material
Supplementary Figure 1 | Transcript expression of PRMT1, PRMT5 and MEP50 across a panel of Ewing Sarcoma, breast and lung cancer tissue datasets of patients. Data taken from the R2 Affymetrix platform (MAS 5.0-u133p2- PRMT5 217786_s_at; MEP50/WDR77 201421_s_at; PRMT1 206445_s_at).
Supplementary Figure 2 | Dose effects of GSK591 (0-500nM) and MS023 (0-1μM) on SDMA, ADMA and MMA levels in TC-32 and A673 cells. Representative image of n=3 independent experiments.
Supplementary Figure 3 | (A) mRNA expression levels of PRMT1, PRMT2, CARM1, PRMT5, PRMT6, PRMT7, PRMT9 and MEP50 after inducible knockdown of EWSR::FLI1 in a panel of ES-tetONE-EWSR1::FLI1 cell lines. Data is normalised to non-induced control. Cell lines used in our study are highlighted blue. Data taken from the ESCLA dataset (33). (B) A673 cells were treated with GSK591 (500nM) or MS023 (1μM) for 3 days and immunoblotted as indicated. Representative image of n=2.
Supplementary Figure 4 | 48 hrs GSK591, MS023 and combination does not alter entry into S-phase in A673 cells (100nM GSK591; 250nM MS023). n=3; mean ± SD.
Supplementary Figure 5 | Representative images of data presented in Figure 5B. Scale bar = 10nm.
References
1. Riggi N, Suvà ML, and Stamenkovic I. Ewing’s sarcoma. New Engl J Med. (2021) 384:154–64. doi: 10.1056/nejmra2028910
2. Grünewald TGP, Cidre-Aranaz F, Surdez D, Tomazou EM, de Álava E, Kovar H, et al. Ewing sarcoma. Nat Rev Dis Primers. (2018) 4:5. doi: 10.1038/s41572-018-0003-x
3. Yu H, Ge Y, Guo L, and Huang L. Potential approaches to the treatment of Ewing’s sarcoma. Oncotarget. (2016) 8:5523–39. doi: 10.18632/oncotarget.12566
4. Selvanathan SP, Graham GT, Grego AR, Baker TM, Hogg JR, Simpson M, et al. EWS–FLI1 modulated alternative splicing of ARID1A reveals novel oncogenic function through the BAF complex. Nucleic Acids Res. (2019) 47:9619–36. doi: 10.1093/nar/gkz699
5. Sand LGL, Szuhai K, and Hogendoorn PCW. Sequencing overview of ewing sarcoma: A journey across genomic, epigenomic and transcriptomic landscapes. Int J Mol Sci. (2015) 16:16176–215. doi: 10.3390/ijms160716176
6. Gorthi A, Romero JC, Loranc E, Cao L, Lawrence LA, Goodale E, et al. EWS–FLI1 increases transcription to cause R-loops and block BRCA1 repair in Ewing sarcoma. Nature. (2018) 555:387–91. doi: 10.1038/nature25748
7. Garnett MJ, Edelman EJ, Heidorn SJ, Greenman CD, Dastur A, Lau KW, et al. Systematic identification of genomic markers of drug sensitivity in cancer cells. Nature. (2012) 483:570–5. doi: 10.1038/nature11005
8. Choy E, Butrynski JE, Harmon DC, Morgan JA, George S, Wagner AJ, et al. Phase II study of olaparib in patients with refractory Ewing sarcoma following failure of standard chemotherapy. BMC Cancer. (2014) 14:813. doi: 10.1186/1471-2407-14-813
9. de Bono J, Ramanathan RK, Mina L, Chugh R, Glaspy J, Rafii S, et al. Phase I, dose-escalation, two-part trial of the PARP inhibitor talazoparib in patients with advanced germline BRCA1/2 mutations and selected sporadic cancers. Cancer Discov. (2017) 7:620–9. doi: 10.1158/2159-8290.cd-16-1250
10. Chugh R, Ballman KV, Helman LJ, Patel S, Whelan JS, Widemann B, et al. SARC025 arms 1 and 2: A phase 1 study of the poly(ADP-ribose) polymerase inhibitor niraparib with temozolomide or irinotecan in patients with advanced Ewing sarcoma. Cancer. (2021) 127:1301–10. doi: 10.1002/cncr.33349
11. Federico SM, Pappo AS, Sahr N, Sykes A, Campagne O, Stewart CF, et al. A phase I trial of talazoparib and irinotecan with and without temozolomide in children and young adults with recurrent or refractory solid Malignancies. Eur J Cancer. (2020) 137:204–13. doi: 10.1016/j.ejca.2020.06.014
12. Gatz SA, Berlanga P, Archambaud B, Bouchoucha Y, André N, Corradini N, et al. Abstract CT088: Phase I/II study of the PARP inhibitor olaparib in combination with irinotecan in children with advanced Malignancies: arm D of the AcSé-ESMART trial. Cancer Res. (2023) 83:CT088–8. doi: 10.1158/1538-7445.am2023-ct088
13. Guccione E and Richard S. The regulation, functions and clinical relevance of arginine methylation. Nat Rev Mol Cell Bio. (2019) 20:642–57. doi: 10.1038/s41580-019-0155-x
14. Jarrold J and Davies CC. PRMTs and arginine methylation: cancer’s best-kept secret? Trends Mol Med. (2019) 25:993–1009. doi: 10.1016/j.molmed.2019.05.007
15. Giuliani V, Miller MA, Liu C-Y, Hartono SR, Class CA, Bristow CA, et al. PRMT1-dependent regulation of RNA metabolism and DNA damage response sustains pancreatic ductal adenocarcinoma. Nat Commun. (2021) 12:4626. doi: 10.1038/s41467-021-24798-y
16. Chiang K, Zielinska AE, Shaaban AM, Sanchez-Bailon MP, Jarrold J, Clarke TL, et al. PRMT5 is a critical regulator of breast cancer stem cell function via histone methylation and FOXP1 expression. Cell Rep. (2017) 21:3498–513. doi: 10.1016/j.celrep.2017.11.096
17. Gu Z, Gao S, Zhang F, Wang Z, Ma W, Davis RE, et al. Protein arginine methyltransferase 5 is essential for growth of lung cancer cells. Biochem J. (2012) 446:235–41. doi: 10.1042/bj20120768
18. Clarke TL, Sanchez-Bailon MP, Chiang K, Reynolds JJ, Herrero-Ruiz J, Bandeiras TM, et al. PRMT5-dependent methylation of the TIP60 coactivator RUVBL1 is a key regulator of homologous recombination. Mol Cell. (2017) 21(12):3498-3513. doi: 10.1016/j.molcel.2017.01.019
19. Carter J, Hulse M, Sivakumar M, Burtell J, Thodima V, Wang M, et al. PRMT5 inhibitors regulate DNA damage repair pathways in cancer cells and improve response to PARP inhibition and chemotherapies. Cancer Res Commun. (2023) 3:2233–43. doi: 10.1158/2767-9764.crc-23-0070
20. Wei X, Yang J, Adair SJ, Ozturk H, Kuscu C, Lee KY, et al. Targeted CRISPR screening identifies PRMT5 as synthetic lethality combinatorial target with gemcitabine in pancreatic cancer cells. Proc Natl Acad Sci. (2020) 117(45):28068-28079. doi: 10.1073/pnas.2009899117
21. He L, Hu Z, Sun Y, Zhang M, Zhu H, Jiang L, et al. PRMT1 is critical to FEN1 expression and drug resistance in lung cancer cells. DNA Repair. (2020) 95:102953. doi: 10.1016/j.dnarep.2020.102953
22. Wu Q, Schapira M, Arrowsmith CH, and Barsyte-Lovejoy D. Protein arginine methylation: from enigmatic functions to therapeutic targeting. Nat Rev Drug Discov. (2021) 20(7):509–530. doi: 10.1038/s41573-021-00159-8
23. Belyanskaya LL, Gehrig PM, and Gehring H. Exposure on cell surface and extensive arginine methylation of ewing sarcoma (EWS) protein. J Biol Chem. (2001) 276:18681–7. doi: 10.1074/jbc.m011446200
24. Sanchez-Bailon MP, Choi S-Y, Dufficy ER, Sharma K, McNee GS, Gunnell E, et al. Arginine methylation and ubiquitylation crosstalk controls DNA end-resection and homologous recombination repair. Nat Commun. (2021) 12:6313. doi: 10.1038/s41467-021-26413-6
25. Mersaoui SY, Yu Z, Coulombe Y, Karam M, Busatto FF, Masson J, et al. Arginine methylation of the DDX5 helicase RGG/RG motif by PRMT5 regulates resolution of RNA: DNA hybrids. EMBO J. (2019) 38:e100986. doi: 10.15252/embj.2018100986
26. Yang Y, McBride KM, Hensley S, Lu Y, Chedin F, and Bedford MT. Arginine methylation facilitates the recruitment of TOP3B to chromatin to prevent R loop accumulation. Mol Cell. (2014) 53:484–97. doi: 10.1016/j.molcel.2014.01.011
27. Luo Y-Y, Wu J-J, and Li Y-M. Regulation of liquid–liquid phase separation with focus on post-translational modifications. Chem Commun. (2021) 57(98):13275-13287. doi: 10.1039/d1cc05266g
28. Carrillo J, García-Aragoncillo E, Azorín D, Agra N, Sastre A, González-Mediero I, et al. Cholecystokinin down-regulation by RNA interference impairs ewing tumor growth. Clin Cancer Res. (2007) 13:2429–40. doi: 10.1158/1078-0432.ccr-06-1762
29. Chan-Penebre E, Kuplast KG, Majer CR, Boriack-Sjodin PA, Wigle TJ, Johnston LD, et al. A selective inhibitor of PRMT5 with in vivo and in vitro potency in MCL models. Nat Chem Biol. (2015) 11(6):432–7. doi: 10.1038/nchembio.1810
30. Duncan KW, Rioux N, Boriack-Sjodin PA, Munchhof MJ, Reiter LA, Majer CR, et al. Structure and property guided design in the identification of PRMT5 tool compound EPZ015666. ACS medicinal Chem Lett. (2016) 7:162–6. doi: 10.1021/acsmedchemlett.5b00380
31. Eram MS, Shen Y, Szewczyk MM, Wu H, Senisterra G, Li F, et al. A potent, selective, and cell-active inhibitor of human type I protein arginine methyltransferases. ACS Chem Biol. (2015) 11(3):772-781. doi: 10.1021/acschembio.5b00839
32. Filion C, Motoi T, Olshen A, Laé M, Emnett R, Gutmann D, et al. The EWSR1/NR4A3 fusion protein of extraskeletal myxoid chondrosarcoma activates the PPARG nuclear receptor gene. J Pathol. (2009) 217:83–93. doi: 10.1002/path.2445
33. Orth MF, Surdez D, Faehling T, Ehlers AC, Marchetto A, Grossetête S, et al. Systematic multi-omics cell line profiling uncovers principles of Ewing sarcoma fusion oncogene-mediated gene regulation. Cell Rep. (2022) 41:111761. doi: 10.1016/j.celrep.2022.111761
34. Riggi N, Cironi L, Provero P, Suvà M-L, Kaloulis K, Garcia-Echeverria C, et al. Development of ewing’s sarcoma from primary bone marrow–derived mesenchymal progenitor cells. Cancer Res. (2005) 65:11459–68. doi: 10.1158/0008-5472.can-05-1696
35. Feustel K and Falchook GS. Protein arginine methyltransferase 5 (PRMT5) inhibitors in oncology clinical trials: A review. J Immunother Precis Oncol. (2022) 5:58–67. doi: 10.36401/jipo-22-1
36. Dhar S, Vemulapalli V, Patananan AN, Huang GL, Lorenzo AD, Richard S, et al. Loss of the major Type I arginine methyltransferase PRMT1 causes substrate scavenging by other PRMTs. Sci Rep. (2013) 3:1311. doi: 10.1038/srep01311
37. Fedoriw A, Rajapurkar SR, O’Brien S, Gerhart SV, Mitchell LH, Adams ND, et al. Anti-tumor activity of the type I PRMT inhibitor, GSK3368715, synergizes with PRMT5 inhibition through MTAP loss. Cancer Cell. (2019) 36:100–114.e25. doi: 10.1016/j.ccell.2019.05.014
38. Yasir M, Park J, and Chun W. EWS/FLI1 characterization, activation, repression, target genes and therapeutic opportunities in ewing sarcoma. Int J Mol Sci. (2023) 24:15173. doi: 10.3390/ijms242015173
39. Hamard P-J, Santiago GE, Liu F, Karl DL, Martinez C, Man N, et al. PRMT5 regulates DNA repair by controlling the alternative splicing of histone-modifying enzymes. Cell Rep. (2018) 24:2643–57. doi: 10.1016/j.celrep.2018.08.002
40. Boisvert F-M, Déry U, Masson J-Y, and Richard S. Arginine methylation of MRE11 by PRMT1 is required for DNA damage checkpoint control. Genes Dev. (2005) 19:671–6. doi: 10.1101/gad.1279805
41. Nguyen HP, Le AQ, Liu E, Cesarano A, DiMeo F, Perna F, et al. Protein arginine methyltransferase 1 is a therapeutic vulnerability in multiple myeloma. Front Immunol. (2023) 14:1239614. doi: 10.3389/fimmu.2023.1239614
42. Murai J, Huang SN, Das BB, Renaud A, Zhang Y, Doroshow JH, et al. Trapping of PARP1 and PARP2 by clinical PARP inhibitors. Cancer Res. (2012) 72:5588–99. doi: 10.1158/0008-5472.can-12-2753
43. Ashley AK, Shrivastav M, Nie J, Amerin C, Troksa K, Glanzer JG, et al. DNA-PK phosphorylation of RPA32 Ser4/Ser8 regulates replication stress checkpoint activation, fork restart, homologous recombination and mitotic catastrophe. DNA Repair. (2014) 21:131–9. doi: 10.1016/j.dnarep.2014.04.008
44. Villar MV, Spreafico A, Moreno V, Braña I, Hernandez T, Razak AA, et al. First-in-human study of JNJ-64619178, a protein arginine methyltransferase 5 (PRMT5) inhibitor, in patients with advanced cancers. Ann Oncol. (2020) 31:S470. doi: 10.1016/j.annonc.2020.08.651
45. Ahnert JR, Perez CA, Wong KM, Maitland ML, Tsai F, Berlin J, et al. PF-06939999, a potent and selective PRMT5 inhibitor, in patients with advanced or metastatic solid tumors: A phase 1 dose escalation study. J Clin Oncol. (2021) 39:3019–9. doi: 10.1200/jco.2021.39.15_suppl.3019
46. Siu LL, Rasco DW, Vinay SP, Romano PM, Menis J, Opdam FL, et al. 438O METEOR-1: A phase I study of GSK3326595, a first-in-class protein arginine methyltransferase 5 (PRMT5) inhibitor, in advanced solid tumours. Ann Oncol. (2019) 30:v159. doi: 10.1093/annonc/mdz244
47. Illuzzi G, Staniszewska AD, Gill SJ, Pike A, McWilliams L, Critchlow SE, et al. Preclinical characterization of AZD5305, a next generation, highly selective PARP1 inhibitor and trapper. Clin Cancer Res. (2022) 28:4724–36. doi: 10.1158/1078-0432.ccr-22-0301
48. Tirode F, Surdez D, Ma X, Parker M, Deley MCL, Bahrami A, et al. Genomic landscape of ewing sarcoma defines an aggressive subtype with co-association of STAG2 and TP53 mutations. Cancer Discov. (2014) 4:1342–53. doi: 10.1158/2159-8290.cd-14-0622
49. Mavrakis KJ, McDonald ER, Schlabach MR, Billy E, Hoffman GR, deWeck A, et al. Disordered methionine metabolism in MTAP/CDKN2A-deleted cancers leads to dependence on PRMT5. Sci (New York NY). (2016) 351:1208–13. doi: 10.1126/science.aad5944
50. Kryukov GV, Wilson FH, Ruth JR, Paulk J, Tsherniak A, Marlow SE, et al. MTAP deletion confers enhanced dependency on the PRMT5 arginine methyltransferase in cancer cells. Sci (New York NY). (2016) 351:1214–8. doi: 10.1126/science.aad5214
51. Marjon K, Cameron MJ, Quang P, Clasquin MF, Mandley E, Kunii K, et al. MTAP deletions in cancer create vulnerability to targeting of the MAT2A/PRMT5/RIOK1 axis. Cell Rep. (2016) 15:574–87. doi: 10.1016/j.celrep.2016.03.043
52. Engstrom LD, Aranda R, Waters L, Moya K, Bowcut V, Vegar L, et al. MRTX1719 is an MTA-cooperative PRMT5 inhibitor that exhibits synthetic lethality in preclinical models and patients with MTAP deleted cancer. Cancer Discov. (2023) 13:2412–31. doi: 10.1158/2159-8290.cd-23-0669
53. Smith JM, Barlaam B, Beattie D, Bradshaw L, Chan HM, Chiarparin E, et al. Discovery and in vivo efficacy of AZ-PRMT5i-1, a novel PRMT5 inhibitor with high MTA cooperativity. J Med Chem. (2024) 67:13604–38. doi: 10.1021/acs.jmedchem.4c00097
54. Nieto-Soler M, Morgado-Palacin I, Lafarga V, Lecona E, Murga M, Callen E, et al. Efficacy of ATR inhibitors as single agents in Ewing sarcoma. Oncotarget. (2016) 7:58759–67. doi: 10.18632/oncotarget.11643
55. Koppenhafer SL, Goss KL, Terry WW, and Gordon DJ. Inhibition of the ATR–CHK1 pathway in ewing sarcoma cells causes DNA damage and apoptosis via the CDK2-mediated degradation of RRM2. Mol Cancer Res. (2020) 18:91–104. doi: 10.1158/1541-7786.mcr-19-0585
56. Goss KL, Koppenhafer SL, Harmoney KM, Terry WW, and Gordon DJ. Inhibition of CHK1 sensitizes Ewing sarcoma cells to the ribonucleotide reductase inhibitor gemcitabine. Oncotarget. (2017) 8:87016–32. doi: 10.18632/oncotarget.18776
57. Martin JC, Sims JR, Gupta A, Hagoel TJ, Gao L, Lynch ML, et al. CDC7 kinase (DDK) inhibition disrupts DNA replication leading to mitotic catastrophe in Ewing sarcoma. Cell Death Discov. (2022) 8:85. doi: 10.1038/s41420-022-00877-x
58. Geoerger B, Paoletti X, Bautista F, Gatz SA, Marshall LV, André N, et al. AcSé-ESMART, a European precision cancer medicine proof-of-concept platform trial. Nat Med. (2023) 29:2985–7. doi: 10.1038/s41591-023-02580-5
59. Geoerger B, Bautista F, André N, Berlanga P, Gatz SA, Marshall LV, et al. Precision cancer medicine platform trials: Concepts and design of AcSé-ESMART. Eur J Cancer. (2024) 208:114201. doi: 10.1016/j.ejca.2024.114201
60. Gatz SA, Simón ARS, Archambaud B, Abbou S, Cleirec M, Leruste A, et al. Abstract CT019: Phase I/II study of the PARP inhibitor olaparib and ATR inhibitor ceralasertib in children with advanced Malignancies: Arm N of the AcSé-ESMART trial. Cancer Res. (2023). doi: 10.1158/1538-7445.am2023-ct019
61. Grohar PJ, Ballman KV, Heise R, Mascarenhas L, Glod J, Wedekind MFF, et al. SARC037: Phase II results of trabectedin given as a 1-hour (h) infusion in combination with low dose irinotecan in patients (pts) with relapsed/refractory Ewing sarcoma (ES). J Clin Oncol. (2024) 42:11508–8. doi: 10.1200/jco.2024.42.16_suppl.11508
Keywords: Ewing sarcoma, PRMT1, PRMT5, arginine methylation, DNA damage, olaparib, therapeutics
Citation: Ward CM, Brockwell C, McNee GS, Orton E, Prowse ENP, Gatz SA and Davies CC (2025) Arginine methylation regulates Ewing sarcoma cell viability in a EWSR1::FLI1 dependent manner and provides a therapeutic opportunity. Front. Oncol. 15:1538208. doi: 10.3389/fonc.2025.1538208
Received: 27 January 2025; Accepted: 17 June 2025;
Published: 01 August 2025.
Edited by:
Aditi Vedi, Cambridge University Hospitals NHS Foundation Trust, United KingdomReviewed by:
William L. Blalock, National Research Council (CNR), ItalyPengda Liu, University of North Carolina at Chapel Hill, United States
Copyright © 2025 Ward, Brockwell, McNee, Orton, Prowse, Gatz and Davies. This is an open-access article distributed under the terms of the Creative Commons Attribution License (CC BY). The use, distribution or reproduction in other forums is permitted, provided the original author(s) and the copyright owner(s) are credited and that the original publication in this journal is cited, in accordance with accepted academic practice. No use, distribution or reproduction is permitted which does not comply with these terms.
*Correspondence: Clare C. Davies, Yy5jLmRhdmllc0BiaGFtLmFjLnVr; Susanne A. Gatz, cy5nYXR6QGJoYW0uYWMudWs=
†These authors have contributed equally to this work