 Hui Li1
 Leeann Aguilar Meza2
 Shailesh K. Shahi1
 Zuohui Zhang1
 Wen Wen1Di Hu1Hong Lin1
 Ashutosh K. Mangalam1
 Jia Luo1*
- 1Department of Pathology, University of Iowa Carver College of Medicine, Iowa City, IA, United States
- 2Holden Comprehensive Cancer Center, University of Iowa, Iowa City, IA, United States
Introduction: Breast cancer is the most frequently diagnosed cancer in women worldwide. Alcohol consumption is a significant and modifiable risk factor, yet the mechanisms linking alcohol to breast cancer progression remain unclear. Recent evidence suggests that the gut microbiome—a complex ecosystem that modulates metabolism, immunity, and inflammation—may act as a mediator of alcohol-induced tumor promotion. We hypothesized that binge-like alcohol exposure induces gut dysbiosis, which in turn drives systemic inflammation and carcinogenic processes.
Methods: We utilized MMTV-Wnt1 transgenic mice, a well-established model for mammary tumor development, along with wild-type FVB mice. Adolescent and adult female mice were administered binge-like doses of ethanol via intraperitoneal injection. Fecal samples were collected and analyzed by 16S rRNA gene sequencing to assess microbial diversity, composition, and taxonomic changes in response to alcohol exposure.
Results: Binge-like alcohol exposure significantly reduced gut microbial richness in adult Wnt1 and FVB mice. In both adolescent and adult mice, alcohol markedly altered the composition of the gut microbiota across both strains. Differential abundance analysis identified specific microbial taxa significantly impacted by ethanol treatment, suggesting targeted perturbations of the gut microbial community.
Conclusion: Our findings demonstrate that intraperitoneal binge-like alcohol exposure induces gut dysbiosis in both tumor-prone and wild-type mice. These alterations in the gut microbiome may contribute to the pro-inflammatory and tumor-promoting effects of alcohol in breast tissue. This study provides insights into the potential role of gut dysbiosis in alcohol-induced mammary tumor promotion and offers avenues for future research.
Introduction
Alcohol consumption has emerged as a critical risk factor for breast cancer as many epidemiological and experimental studies have demonstrated a positive correlation between alcohol consumption and increased breast cancer risk (1–6). However, the cellular and molecular mechanisms underlying alcohol’s tumor promotion remain unclear. There are several proposed mechanisms. For example, alcohol consumption can elevate the estrogen levels in both premenopausal and postmenopausal women, which may contribute to the effect of alcohol on increased breast cancer risk (7–10). Alcohol and its metabolite, acetaldehyde, are both known to damage DNA and induce gene mutations (11, 12). Alcohol exposure can also promote the accumulation of excessive reactive oxygen species (ROS) and oxidative stress, which may promote mammary carcinogenesis and aggressiveness (5, 11). Recently, studies have shown that alcohol consumption may also affect the gut microbiome, an essential regulator of systemic inflammation, estrogen metabolism, and immune responses, suggesting a novel pathway through which alcohol may impact breast cancer risk and progression (13–15).
The gut microbiome is the complex community of microbes such as bacteria, viruses and fungi that reside in the gastrointestinal system and modulate the functions of local and distant organs through metabolic, immunologic and hormonal pathways (16–18). For instance, short-chain fatty acids produced by microbial fermentation of dietary fiber regulate immune responses and gut barrier function (19–21). Certain gut bacteria can influence the production of neurotransmitters such as serotonin and dopamine, thereby impacting brain function and behavior (22, 23). A disruption in the composition of the gut microbiome, known as gut dysbiosis, is characterized by reduced microbial diversity, loss of beneficial bacteria or overgrowth of harmful bacteria. Gut dysbiosis has been linked to a wide range of diseases including breast cancer (24, 25). Recent studies have suggested that gut dysbiosis plays a role in various aspects of breast cancer, including tumorigenesis, disease progression, metastasis and treatment outcome (26–29). For example, a gut microbiome profiling study conducted in the Midwestern United States revealed gut dysbiosis in breast cancer patients, characterized by the depletion of short-chain fatty acid-producing gut bacteria (30). Additionally, a pilot study reported associations between gut microbiome composition and breast tumor characteristics, such as receptor status, stage, and grade, as well as established breast cancer risk factors (31).
Emerging evidence has demonstrated that alcohol consumption can disrupt the gut microbiome and alcohol-induced gut dysbiosis is considered an early factor in alcohol-related disorders such as alcohol use disorders (AUD) and alcoholic-liver disease (ALD) (13–15, 32). The role of gut dysbiosis in alcohol-related breast cancer, however, has not yet been studied. Using a mammary tumorigenesis model of MMTV-Wnt1 transgenic mice, we have previously shown that alcohol exposure enhanced tumorigenesis and aggressiveness, with adolescent mice showing greater sensitivity to the effects of alcohol than adults (33). In this study, we aimed to determine whether alcohol exposure alters the gut microbiome in MMTV-Wnt1 mice prior to the onset of mammary tumorigenesis by analyzing changes in gut bacterial composition following alcohol exposure.
Materials and methods
Animals and experimental groups
FVB MMTV-Wnt1 [FVB.Cg-Tg (Wnt1)1Hev/J] transgenic and FVB wild type (WT) mice were obtained from The Jackson Laboratories (Bar Harbor, ME), bred, and housed in a climate-controlled animal facility. All procedures were reviewed and approved by the Institutional Animal Care and Use Committee (IACUC) of the University of Iowa. In this study, only female mice were used. Adolescent mice (5-week-old) or adult mice (10-week-old) from either FVB wt or MMTV-Wnt1 (Wnt1) transgenic strain were assigned into control and alcohol exposure groups. Two ages were selected because we previously demonstrated that adolescent Wnt1 mice were more susceptible to alcohol-induced mammary tumor promotion than adult mice (33). For alcohol exposure, the animals received a daily intraperitoneal (IP) injection of either PBS (control) or ethanol solution (2.5 g/kg, 25% w/v) for 15 days. The IP route was selected over oral gavage to model binge-like alcohol exposure while minimizing stress and gastrointestinal irritation, thereby allowing for more direct assessment of systemic ethanol effects on mammary tissue (33). All mice were monitored daily by palpation to ensure none developed mammary tumors.
The experimental groups were assigned based on age, strain, and treatment (Figure 1). The adolescent mice started at 5 weeks old (5W) and became 7 weeks old (7W) after 15 days of treatment. The adult mice started at 10 weeks old (10W) and became 12 weeks old (12W) after a 15-day treatment period. There were four experimental groups of animals used in this study: 1) Adolescent FVB which included the control group before (Control_5W, n = 7) or after PBS treatment (Control_7W, n = 7) and the ethanol group before (Ethanol_5W, n = 5) or after ethanol treatment (Ethanol_7W, n = 5); 2) Adult FVB which included the control group before (Control_10W, n = 8) or after PBS treatment (Control_12W, n = 8) and the ethanol group before (Ethanol_10W, n = 8) or after ethanol treatment (Ethanol_12W, n = 8); 3) Adolescent Wnt1 which included the control group before (Control_5W, n = 5) or after PBS treatment (Control_7W, n = 5) and the ethanol group before (Ethanol_5W, n = 7) or after ethanol treatment (Ethanol_7W, n = 7); 4) Adult Wnt1 which included the control group before (Control_10W, n = 6) or after PBS treatment (Control_12W, n = 6) and the ethanol group before (Ethanol_10W, n = 7) or after ethanol treatment (Ethanol_12W, n = 7).
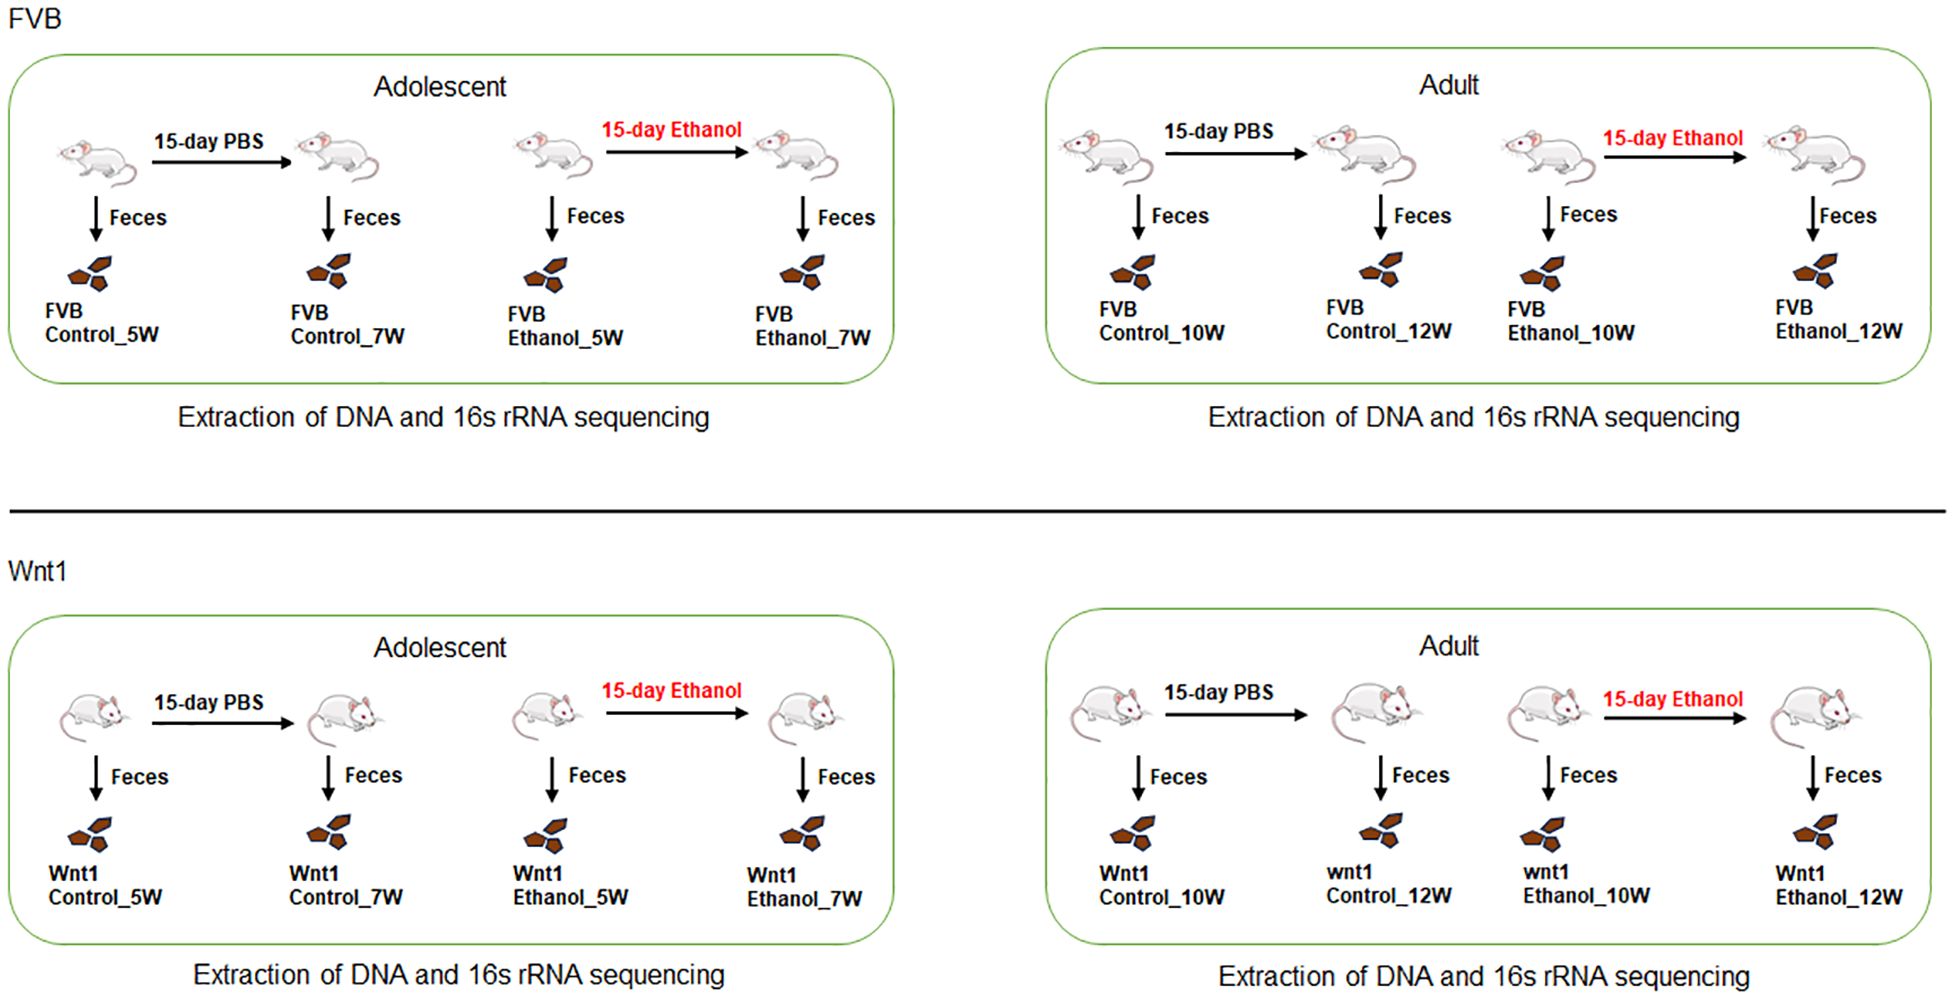
Figure 1. Design of experimental groups. Both adolescent (5-week-old) and adult (10-week-old) FVB and Wnt1 mice were treated with either PBS or ethanol for 15 days and one day after the treatment, their feces were collected and sent for DNA purification and 16s rRNA sequencing for gut microbiome composition. The number of each experimental groups are as follows: Adolescent FVB which includes control group before (FVB control_5W, n = 7) or after PBS treatment (FVB control_7W, n = 7) and ethanol group before (FVB Ethanol_5W, n = 5) or after ethanol treatment (FVB Ethanol_7W, n = 5); 2) Adult FVB including control group before (FVB control_10W, n = 8) or after PBS treatment (FVB control_12W, n = 8) and ethanol group before (FVB Ethanol_10W, n = 8) or after ethanol treatment (FVB Ethanol_12W, n = 8); 3) Adolescent Wnt1 which includes control group before (Wnt1 control_5W, n = 5) or after PBS treatment (Wnt1 control_7W, n = 5) and ethanol group before (Wnt1 Ethanol_5W, n = 7) or after ethanol treatment (Wnt1 Ethanol_7W, n = 7); 4) Adult Wnt1 including control group before (Wnt1 control_10W, n = 6) or after PBS treatment (Wnt1 control_12W, n = 6) and ethanol group before (Wnt1 Ethanol_10W, n = 7) or after ethanol treatment (Wnt1 Ethanol_12W, n = 7).
Fecal sample collection, extraction of DNA and 16s RNA sequencing
Fecal samples from each animal were collected either one day before or after the exposure and stored at -80°C freezer until further processing for DNA extraction. Microbial DNA extraction, 16S rRNA amplicon, and sequencing were performed according to a previously published protocol (34). Briefly, DNA was isolated using DNeasy PowerLyzer PowerSoil Kit (Qiagen, Germantown, MD) as per the manufacturer’s instructions, including the recommended bead-beating step. The sequencing library was prepared using a 2-step amplification, where the V3-V4 region of the bacterial 16S rRNA gene was amplified in step 1, and barcodes were added using the Nextera XT Index Kit (Illumina MiSeq) in step 2. PCR products were purified and sequenced using the Illumina MiSeq platform. The R based platform Divisive Amplicon Denoising Algorithm 2 (DADA2) (35) was used to trim, merge, and filter reads and generate an amplicon sequence variant (ASV) table. The ASVs were taxonomically classified from kingdom to species levels using the Silva database (version 138.1), with a median read count of 49,839 (ranging from 1,667 to 78,455 reads).
Microbiome analyses and visualization
Microbial communities were analyzed using previously described methods for each experimental group (30, 34, 36). Briefly, custom R (Version 4.3.1) scripts were utilized, integrating packages such as phyloseq (37), vegan (38), ggpubr (39), dplyr (40), microbiome (41), tidyr (42), sigminer (43), and ggplot2 (44). Except for alpha diversity, reads underwent normalization using constant-sum scaling and log10 transformation at the bacterial level to their median sequencing depth. Alpha diversity analysis was conducted on unfiltered data using the Chao1 index. Beta diversity was assessed via Principal Component Analysis (PCA) based on weighted UniFrac distances, with significance tested through PERMANOVA. A heatmap of the most abundant genera was generated using the phyloseq (37) and ggplot2 (44) packages, visualizing top bacterial genera based on weighted UniFrac distances (45). Multidimensional Scaling (MDS) was employed for ordination, with sample groups arranged along the x-axis to represent relative abundance. To visualize enrichment, the LEfSe plot was produced using the microbiomeMarker (46) package’s “run_lefse” function, highlighting the genera enriched in the different groups within each experimental group using the Kruskal-Wallis test.
Statistical analyses
A two-way analysis of variance (ANOVA) was conducted with age and treatment as independent variables to analyze the relative abundance of selected microbial taxa across experimental groups. Post hoc comparisons were performed using Tukey’s correction for multiple comparisons, utilizing GraphPad Prism Version 10.3.1 (GraphPad Software, Inc., www.graphpad.com). Additionally, the Wilcoxon matched-pairs signed rank test was applied to assess the effects of alcohol on the abundance of microbial taxa in selected treatment groups. A significance threshold of p < 0.05 was set for all analyses.
Results
Microbiome analysis of alpha diversity of alcohol-exposed mice
Alpha diversity refers to within-sample diversity. When examining alpha diversity, we are able to evaluate the distribution of microbes within a sample or metadata category. The Chao1 index, a statistical estimator that measures species richness, is widely used to assess alpha diversity in microbiome research including gut microbiome (47). We used Chao1 index to determine the effect of alcohol exposure on alpha diversity (Figure 2). In FVB mice, there was no significant difference in the Chao1 index between control groups in either adolescents (p control_7W vs. control_5W = 0.16) or adults (pcontrol_12W vs. control_10W = 0.14). Alcohol exposure did not significantly change the Chao1 index in adolescent mice (pEthanol_7W vs. Ethanol_5W = 0.2), but significantly reduced the number of microbial species in adults (pEthanol_12W vs. Ethanol_10W = 0.0013). In Wnt1 mice, the Chao1 index similarly showed no significant differences between control groups either in adolescents (pcontrol_7W vs. control_5W = 1) or adults (pcontrol_12W vs. control_10W = 1). Alcohol exposure did not significantly alter the Chao1 index in adolescents (pEthanol_7W vs. Ethanol_5W = 0.28), but significantly reduced microbial richness in adults (pEthanol_12W vs. Ethanol_10W = 0.0023). These findings demonstrate that alcohol exposure significantly reduced alpha diversity in adults in both mouse strains, whereas the impact on the adolescents was not significant.
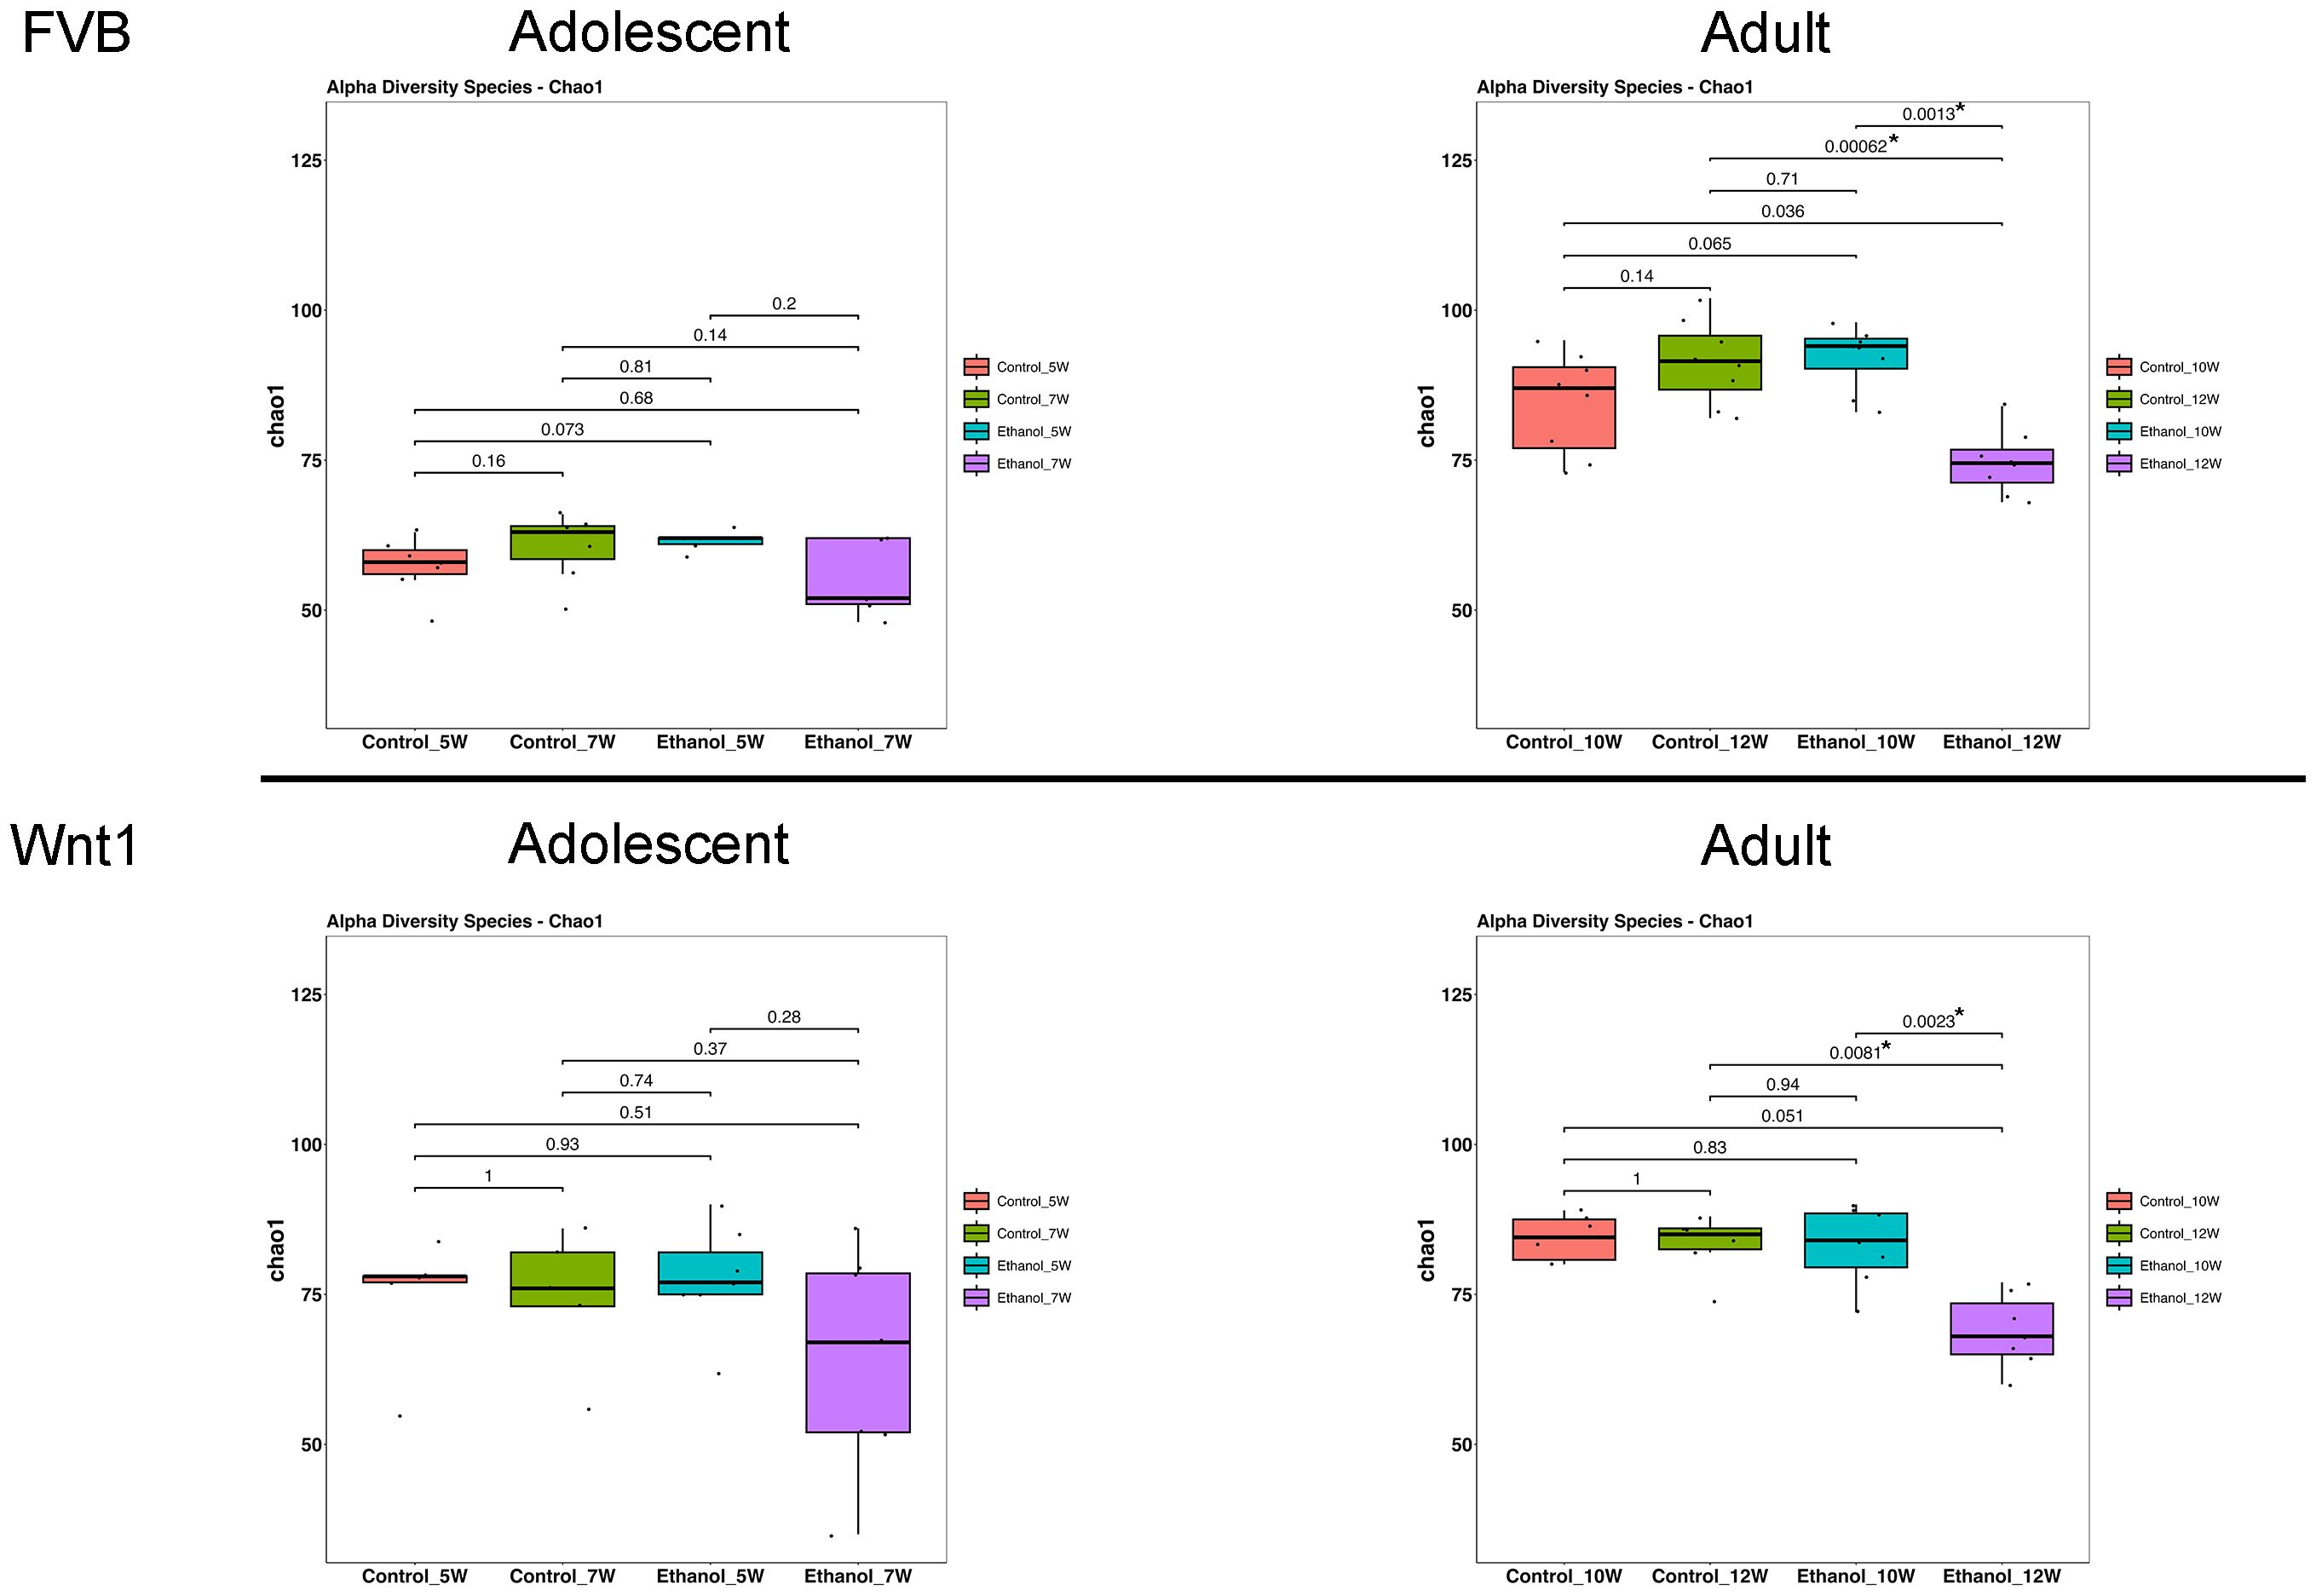
Figure 2. Effects of alcohol on microbial species richness. The effect of alcohol on alpha diversity was measured by Chao1 index in all experimental groups: Overall group differences were analyzed using the Kruskal–Wallis test, followed by pairwise comparisons with Wilcoxon rank-sum tests. Alcohol exposure significantly reduced alpha diversity in adult mice. *p < 0.05.
Microbiome analysis of beta diversity of alcohol-exposed mice
Beta diversity is the diversity between samples and a common statistical method to assess the similarity or differences in microbial compositions between samples (47). To examine the impact of alcohol exposure on microbial diversity across experimental groups, we employed weighted UniFrac, a quantitative measure of beta diversity (Figure 3). In FVB mice, treatment significantly affected gut microbial composition in both adolescents (p = 0.001) and adults (p = 0.001). Further analysis by treatment revealed significant differences in the microbial community in controls across age groups for both adolescents (pcontrol_7W vs. control_5W = 0.01) and adults (pcontrol_12W vs. control_10W = 0.025), and an even more marked differences in alcohol groups in both adolescents (pEthanol_7W vs. Ethanol_5W = 0.002) and adults (pEthanol_12W vs. Ethanol_10W = 0.002). A similar trend was observed in Wnt1 mice, with a near-significant treatment effect on gut microbial composition in adolescents (p = 0.076), and a significant effect in adults (p = 0.013). When separated by treatment, the control groups showed a nearly significant difference in adolescents (pcontrol_7W vs. control_5W = 0.055) and adults (pcontrol_12W vs. control_10W = 0.088), while significant differences were observed in alcohol-exposed adolescents (pEthanol_7W vs. Ethanol_5W = 0.013) and adults (pEthanol_12W vs. Ethanol_10W = 0.014). These results suggested that alcohol exposure has a more pronounced impact on the beta diversity, compared to the effects with natural age-related development in controls regardless of strains and ages.
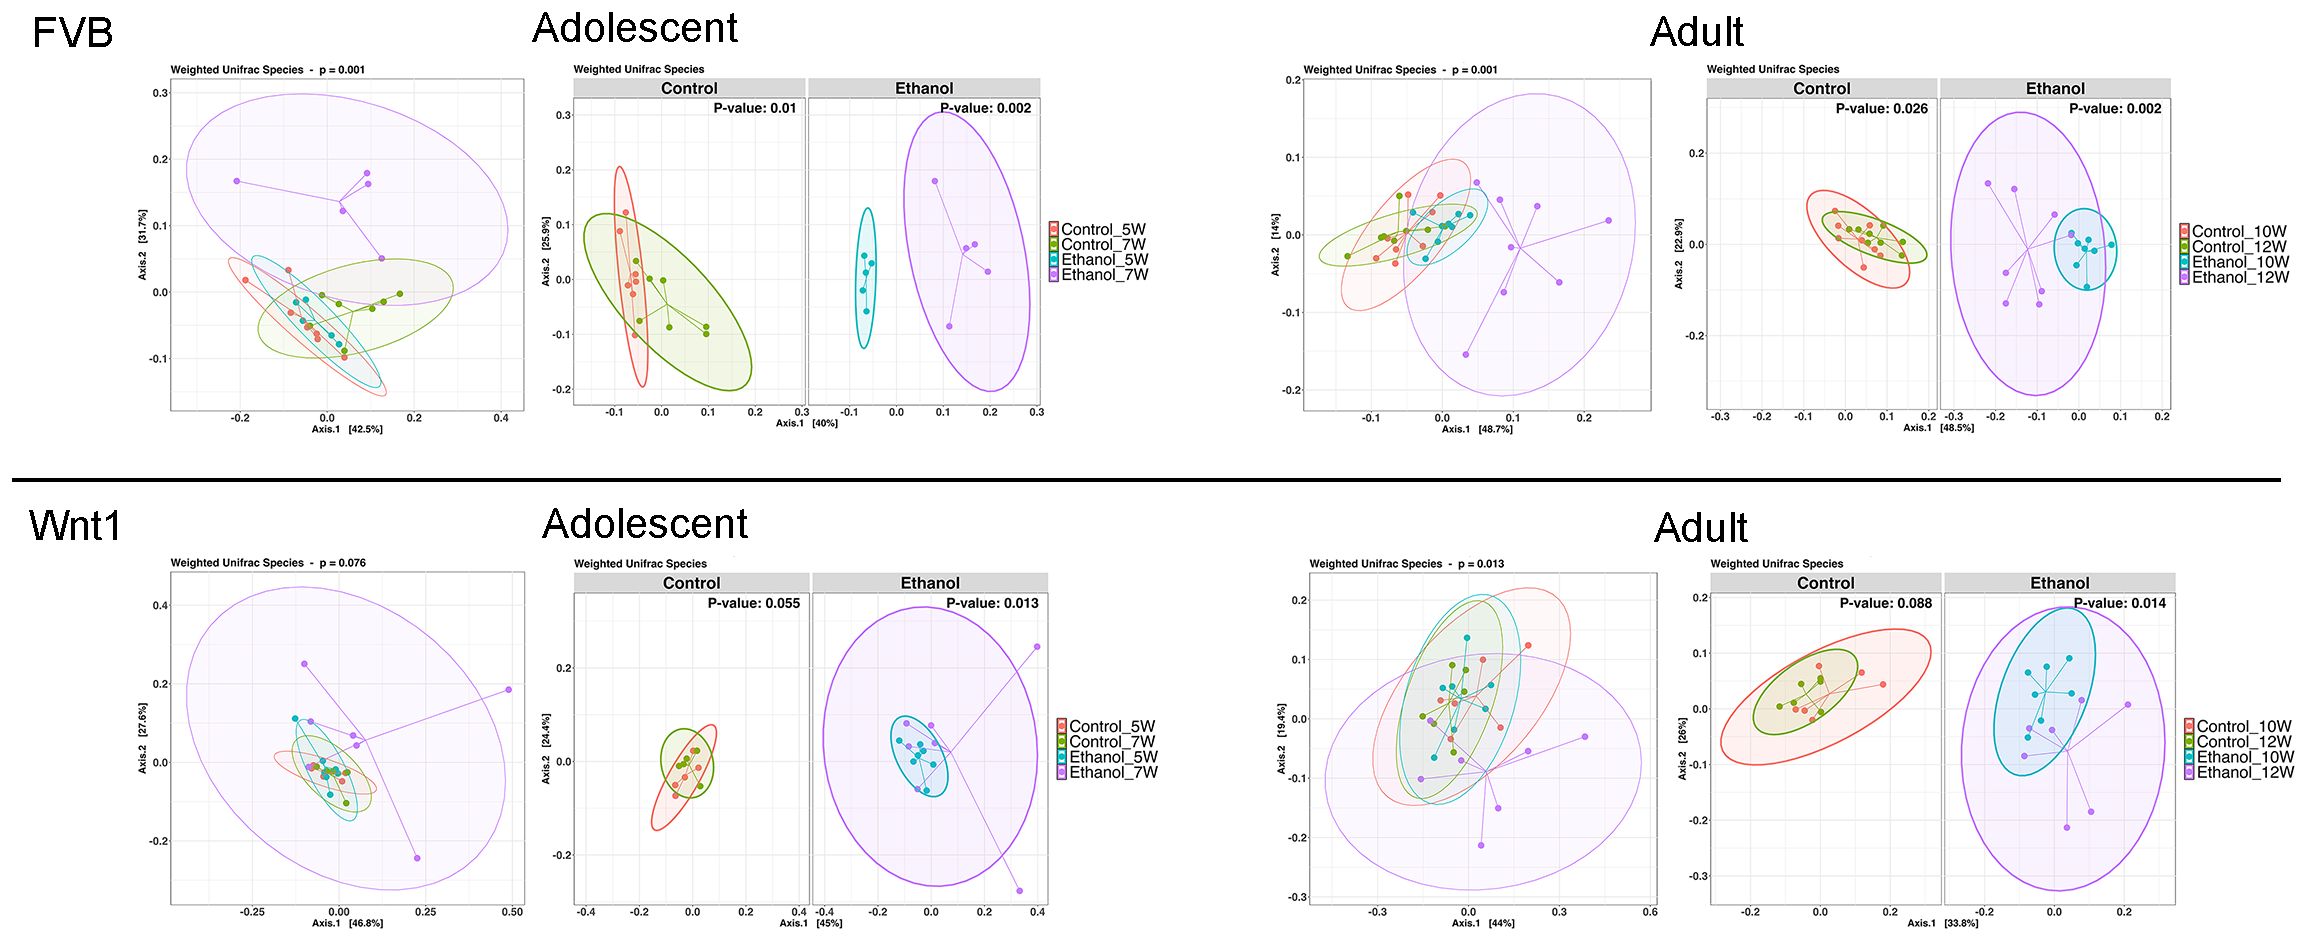
Figure 3. Effects of alcohol on microbial compositions. The effect of alcohol on beta diversity was determined by weighted UniFrac analysis in all experimental groups. PERMANOVA (adonis2) was applied to test for differences between groups. Alcohol exposure significantly changed the microbial compositions in adolescents and adults in both strains. The percentages shown on Axis.1 and Axis.2 represent the proportion of total variation in the microbial community composition that is captured by each principal coordinate. For instance, a label of “42.5%” on Axis.1 indicates that this axis explains 42.5% of the variation in the pairwise Weighted UniFrac distances among samples. Similarly, “31.7%” on Axis.2 represents an additional 31.7% of variation explained.
The abundance of microbial populations of alcohol-exposed mice
To highlight the most abundant microbial taxa in each experimental group, we used heatmap visualization to display the top 20 most prevalent microbial populations (Figure 4). The heatmap analysis revealed a similar pattern of microbial abundance across the experimental groups. In both adolescent and adult FVB experimental groups, the commonly identified taxa included the species Akkermansia muciniphila; the genera Turicibacter, Lachnoclostridium, Lactobacillus, Lachnospiraceae_NK4A136_group, and Alistipes; the families Muribaculaceae, Oscillospiraceae, and Ruminococcaceae; and the order Clostridia_vadinBB60_group. In the adolescent and adult Wnt1 experimental groups, the taxa commonly identified were the species A. muciniphila and Lactobacillus intestinalis; the genera Bacteroides, Lachnospiraceae_NK4A136_group, Lactobacillus, Prevotellaceae_UCG-001, Alistipes, Rikenellaceae_RC9_gut_group, and Ruminococcus; the families Lachnospiraceae and Ruminococcaceae. The analysis showed distinct yet overlapping microbial profiles across experimental groups, with certain taxa appearing as key microbial populations such as A. muciniphila, and members of Lachnospiraceae and Ruminococcaceae families, present in both FVB and Wnt1 groups. This combination of both shared and distinct microbial populations between the FVB and Wnt1 groups may relate to their age and genetic backgrounds.
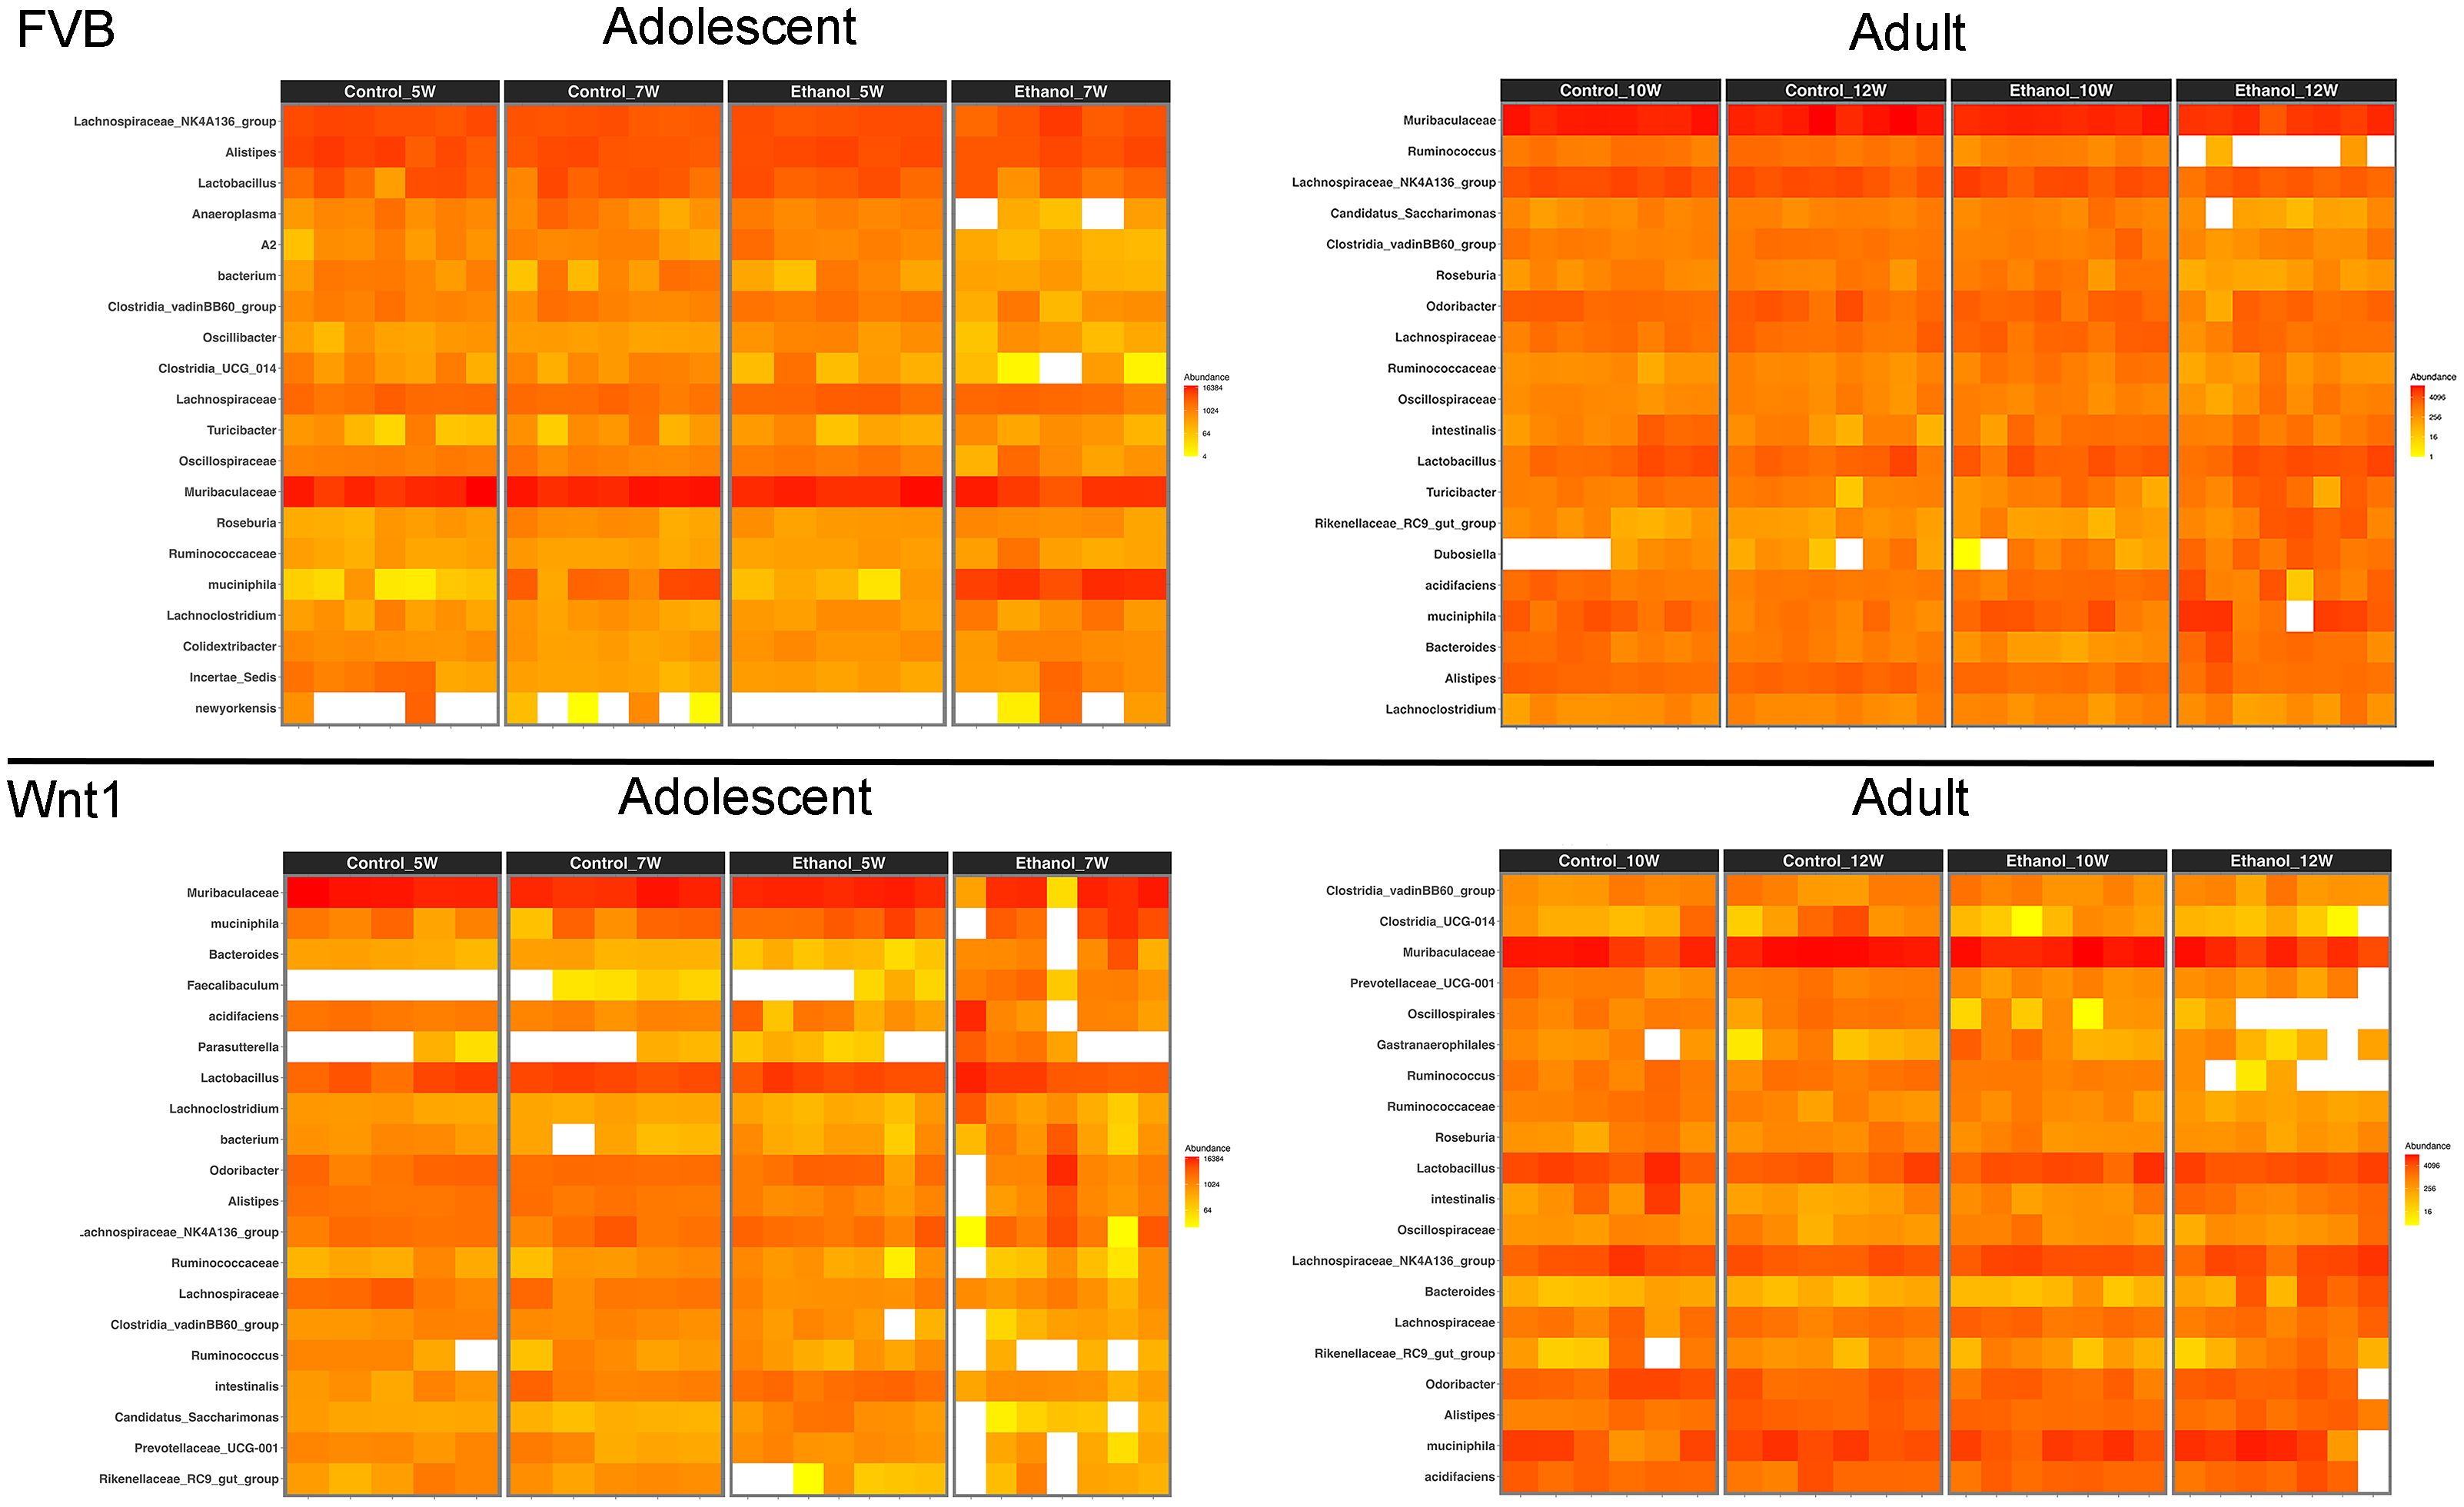
Figure 4. Effects of alcohol on microbial taxa. Heat maps show the top 20 most prevalent microbial taxa within each experimental group. Genus names have been used to represent taxa, including Lachnospiraceae_NK4A136_group (for bacterium), Dubosiella (for newyorkensis), Bacteroides (for acidifaciens), Akkermansia (for muciniphila), Lactobacillus (for intestinalis), and Lachnospiraceae (for A2). Full taxonomic classifications can be accessed in the 16S rRNA gene sequencing data deposited in the Sequence Read Archive (SRA) under BioProject ID: PRJNA1248563.
The differential microbial populations of alcohol-exposed mice
We then performed Linear Discriminant Analysis Effect Size (LEfSe) analysis to identify the microbial populations that are most affected by alcohol exposure in each experimental group (Figure 5). LEfSe is a biomarker discovery tool that identifies statistically significant differences between multiple groups. In the adolescent FVB experimental group, LEfSe analysis revealed that the species A. muciniphila and the genus Colidextribacter were the most enriched taxa in alcohol-exposed mice. In the adult FVB experimental group, alcohol exposure was associated with an enrichment of the species A. muciniphila, Lactobacillus reuteri, and Parabacteroides goldsteinii, as well as the genera Bacteroides, Dubosiella, Rikenellaceae_RC9_gut_group, and Parasutterella. In the adolescent Wnt1 experimental group, alcohol exposure led to a higher abundance of the genera Faecalibaculum, Bacteroides, and Turicibacter. In the adult Wnt1 experimental group, alcohol exposure was associated with an enrichment of the species P. goldsteinii and L. reuteri, along with the genera Bacteroides and Rikenella. These results indicate that age and genetic background significantly affect the microbiome’s response to alcohol, with both overlapping and unique taxa affected across experimental groups.
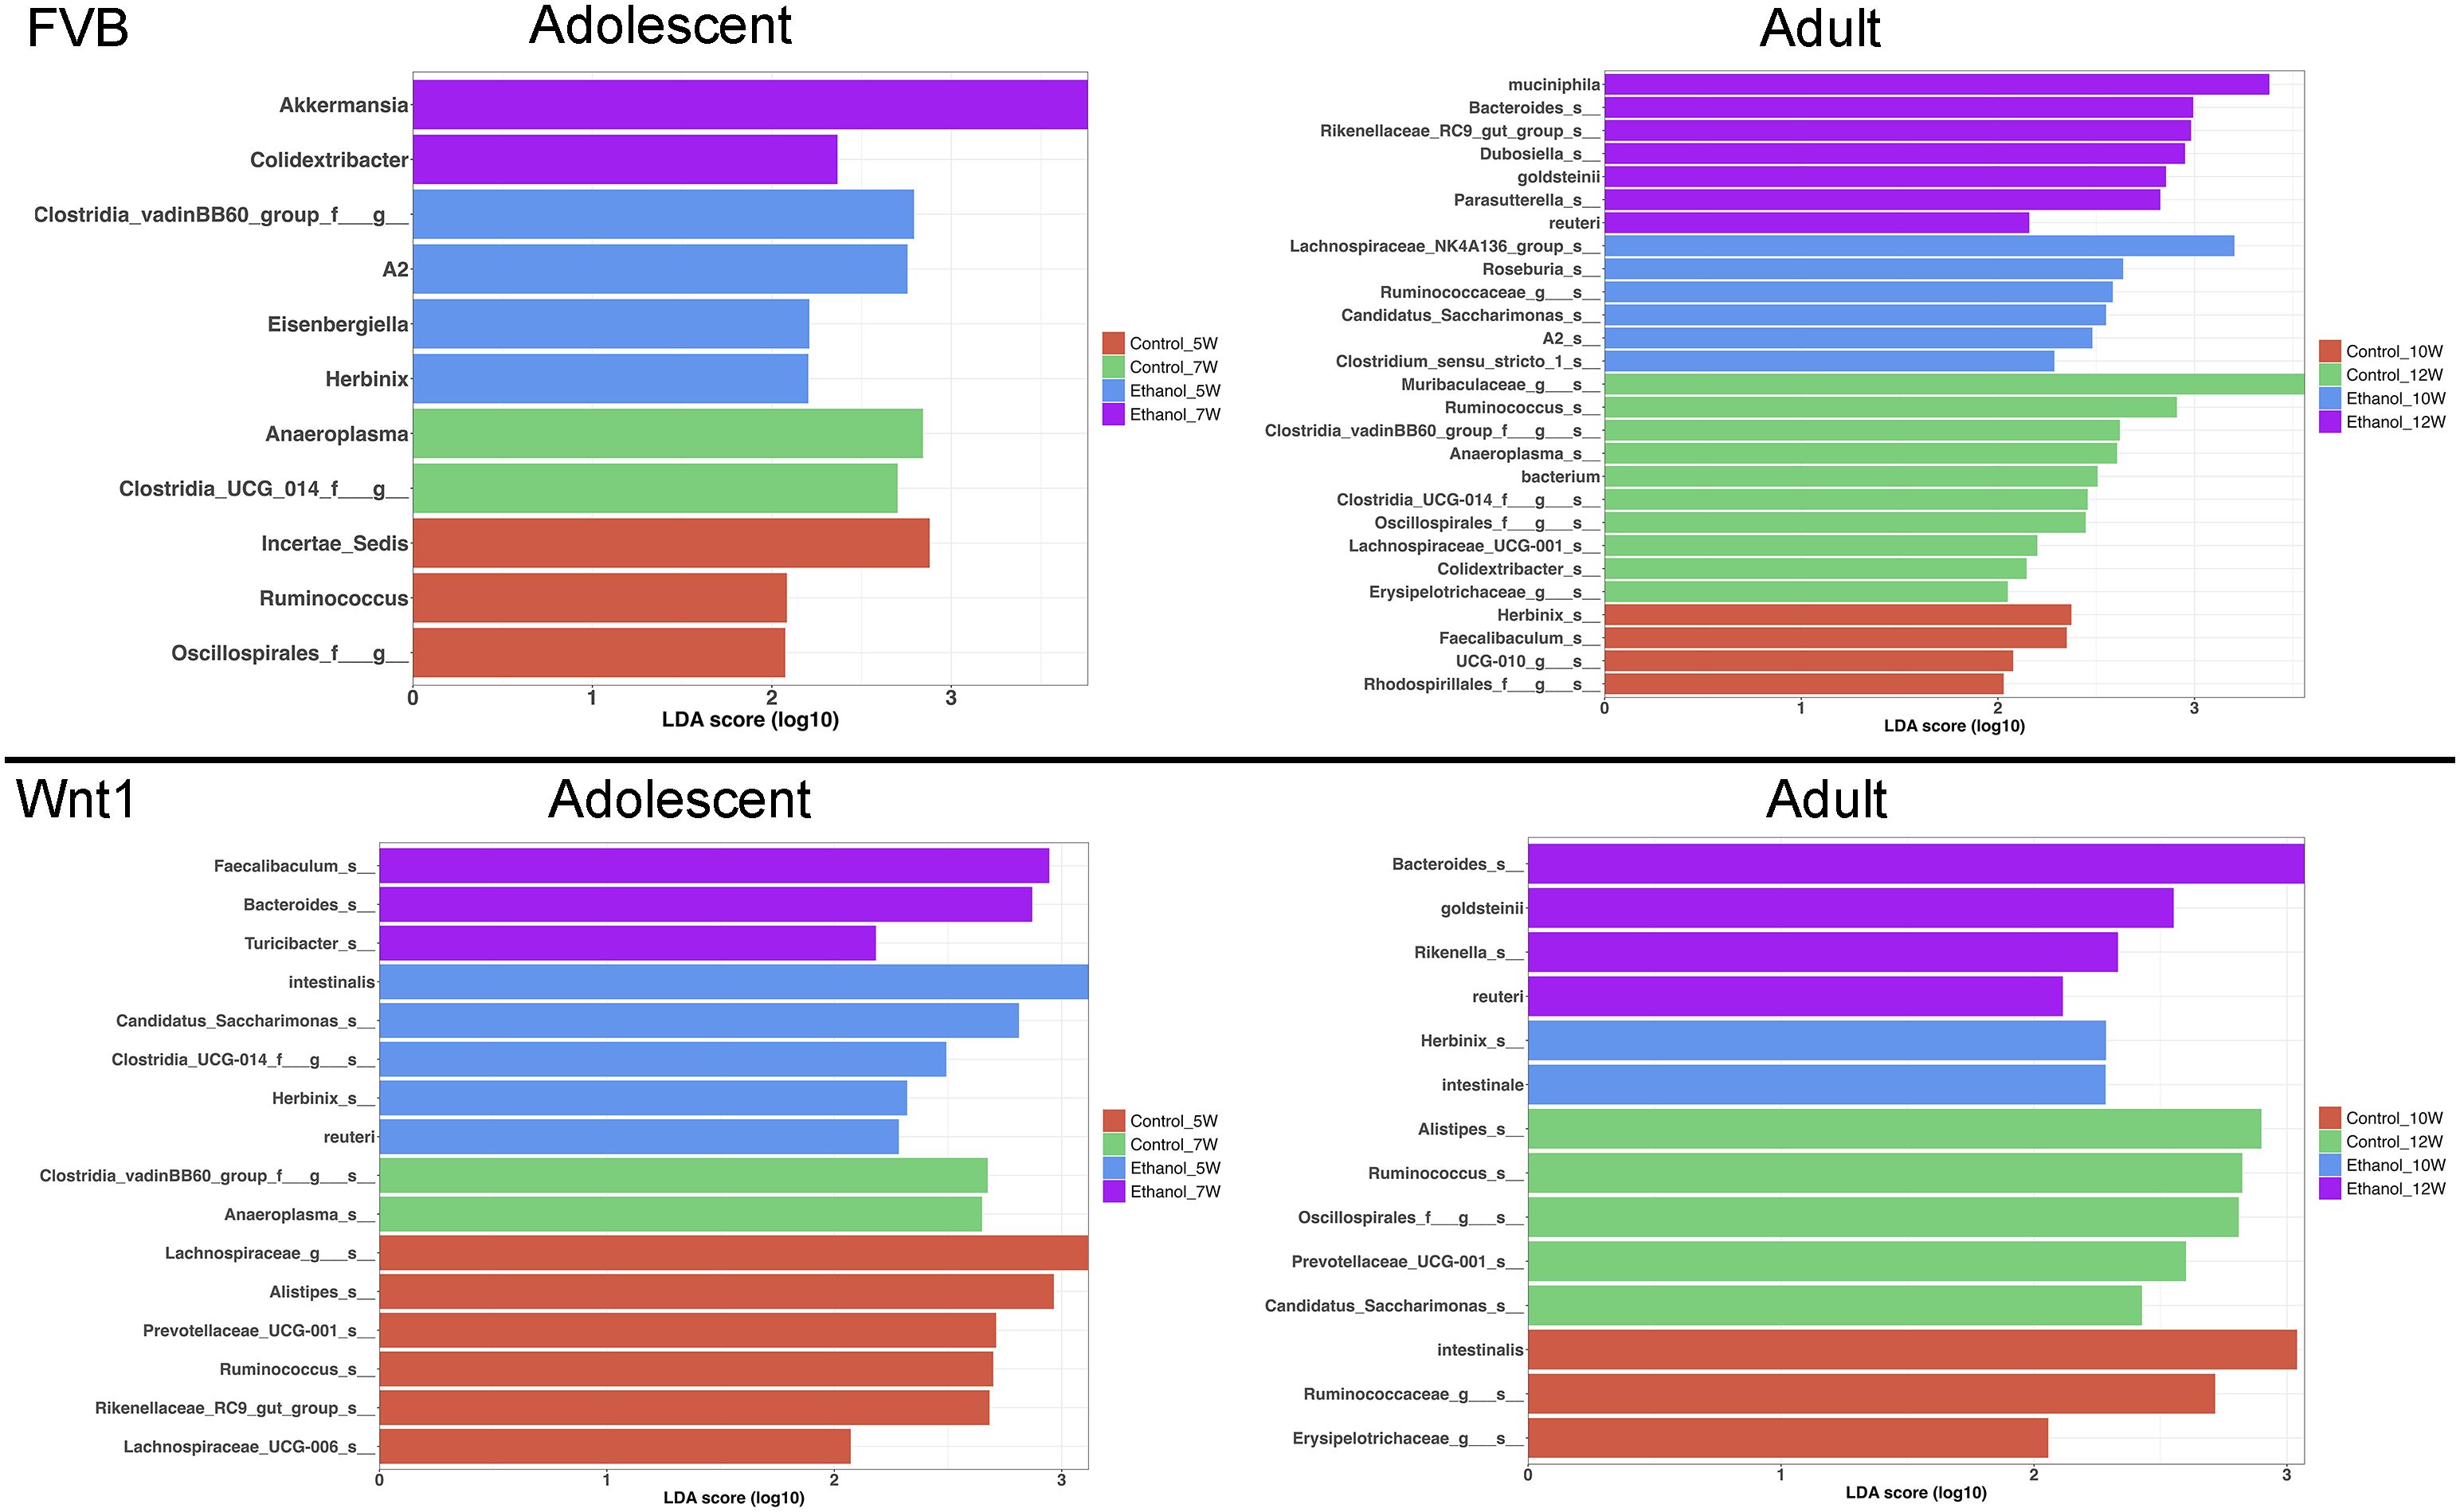
Figure 5. Effects of alcohol on specific microbial taxa. Linear Discriminant Analysis Effect Size (LEfSe) analysis was performed to identify the microbial taxa that were mostly affected by alcohol exposure.
Comparisons of taxonomic abundance of selective microbial population
We conducted a two-way analysis of variance (ANOVA) for each microbial taxon that was identified in the LEfSe analysis to validate the findings in each experimental group (Supplementary Figures 4-7). We further analyzed microbial taxa that were significantly altered by alcohol exposure in adolescent Wnt1 mice, because they were more sensitive to alcohol’s tumor promotion compared to adults (33). We also compared the relative abundance of specific taxa across other experimental groups.
Alcohol exposure increased the abundance of several microbial taxa in the adolescent Wnt1 experimental group, including P. goldsteinii and the genera Bacteroides, Faecalibaculum, and Turicibacter. The abundance of these taxa was analyzed across various experimental groups using two-way ANOVA followed by Tukey’s post hoc test (Figure 6). Levels of P. goldsteinii showed a nearly significant increase in alcohol-exposed adolescent Wnt1 mice (p = 0.062) and were significantly enriched in adult Wnt1 and adult FVB mice. Although Bacteroides levels showed a non-significant increase in the adolescent Wnt1 experimental group by two-way ANOVA followed by Tukey’s post hoc test (p = 0.1590), the Wilcoxon test revealed a significant effect (p = 0.0469, Supplementary Figure 1). Both adult Wnt1 and FVB experimental groups exhibited a significant increase in Bacteroides following alcohol exposure. Faecalibaculum levels were significantly elevated in alcohol-exposed adolescent Wnt1 mice but were notably decreased in the control group of adult FVB mice. Levels of Turicibacter were significantly increased in the adolescent Wnt1 experimental group than that in the control group, with a near-significant increase also observed in the adult FVB experimental group (p = 0.0801).
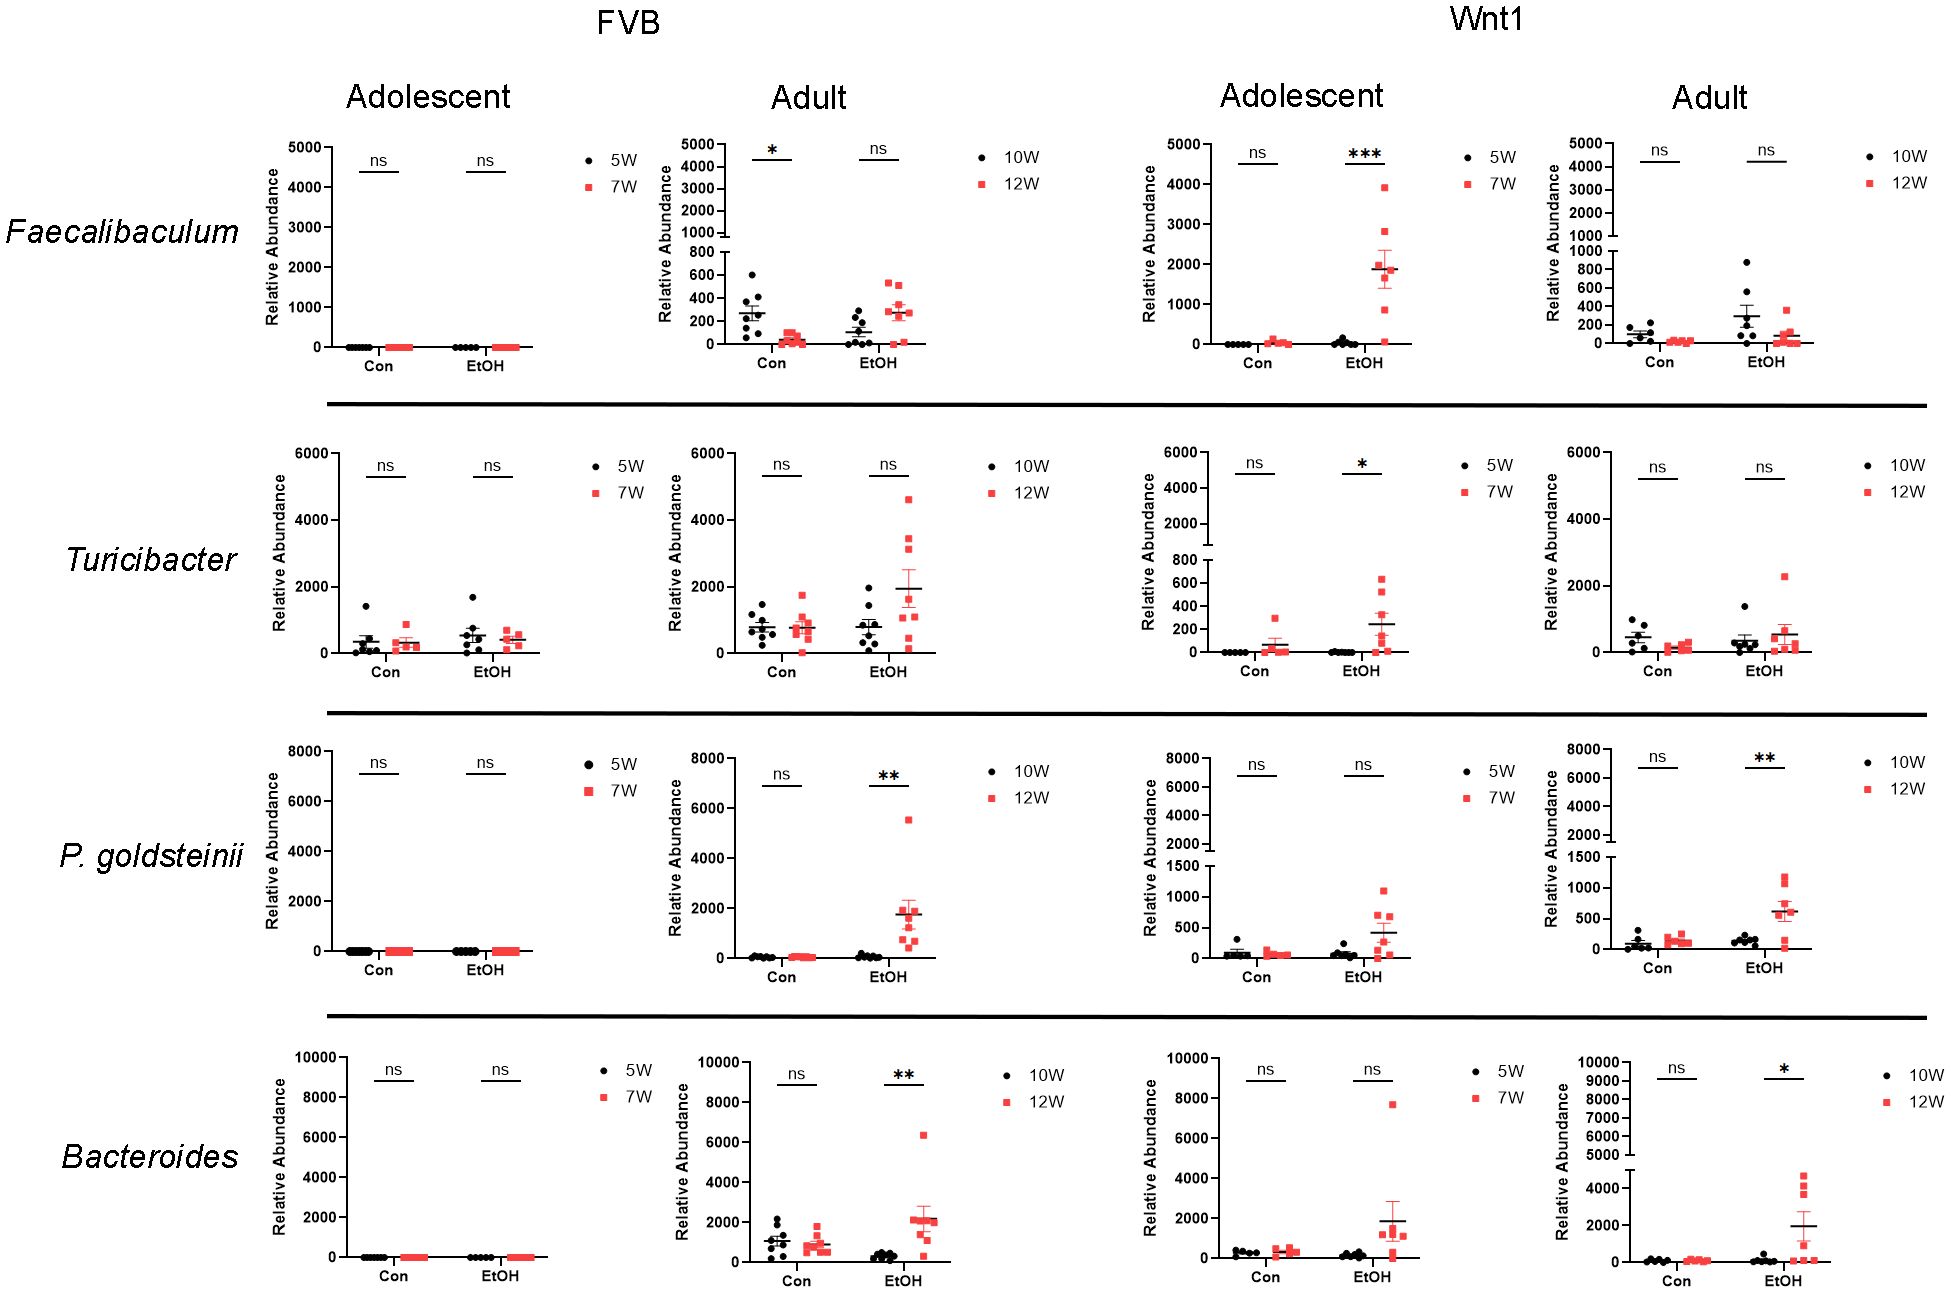
Figure 6. Analysis of alcohol-enriched microbial taxa. Alcohol-enriched microbial taxa were analyzed by two-way ANOVA followed by Tukey’s post hoc test. Selective microbial taxa including the species P. goldsteinii; the genera Faecalibaculum, Turicibacter and Bacteroides were increased by alcohol exposure. FVB: n = 7 for control (Con) 5W and 7W; n = 5 for ethanol (EtOH) 5W and 7W; n = 8 for control (Con) 10W and 12W; n = 8 for ethanol (EtOH) 10W and 12W; Wnt1: n = 5 for control (Con) 5W and 7W; n = 7 for ethanol (EtOH) 5W and 7W; n = 6 for control (Con) 10W and 12W; n = 7 for ethanol (EtOH) 10W and 12W. ∗p < 0.05, ∗∗p < 0.01, ∗∗∗p < 0.001, ns = not significant (p > 0.05).
Although A. muciniphila did not show a significant increase in alcohol-exposed adolescent Wnt1 mice, it is one of the most abundant bacterial species in the gut microbiome and was identified in both the heatmap and LEfSe analysis across multiple experimental groups (Supplementary Figure 2). A detailed examination revealed that A. muciniphila was significantly elevated by alcohol exposure only in the adolescent FVB group, with no significant changes observed in other groups.
In contrast, the abundance of certain microbial taxa, including the species L. intestinalis and the genera Anaeroplasma, Herbinix, and Candidatus_Saccharimonas, was decreased following alcohol exposure in the adolescent Wnt1 experimental group, with further analysis across all experimental groups (Figure 7). L. intestinalis was significantly reduced in the alcohol-exposed adolescent Wnt1 experimental group, with no similar effects observed in other experimental groups. In the same experimental group, the Anaeroplasma level was significantly higher in control mice but lower in the alcohol-exposed mice, although this reduction was not statistically significant (p = 0.4502). The Wilcoxon test, however, showed a significant effect of alcohol on Anaeroplasma (p = 0.0312, Supplementary Figure 1). In addition, Anaeroplasma was significantly reduced following alcohol exposure in the adolescent FVB experimental group. Herbinix exhibited a consistent decrease following alcohol exposure across the adolescent Wnt1, adult Wnt1, and adolescent FVB experimental groups, with a nearly significant reduction in the adult FVB experimental group (p = 0.0715). Finally, Candidatus_Saccharimonas level was decreased in response to alcohol exposure in both the adolescent Wnt1 and adult FVB experimental groups.
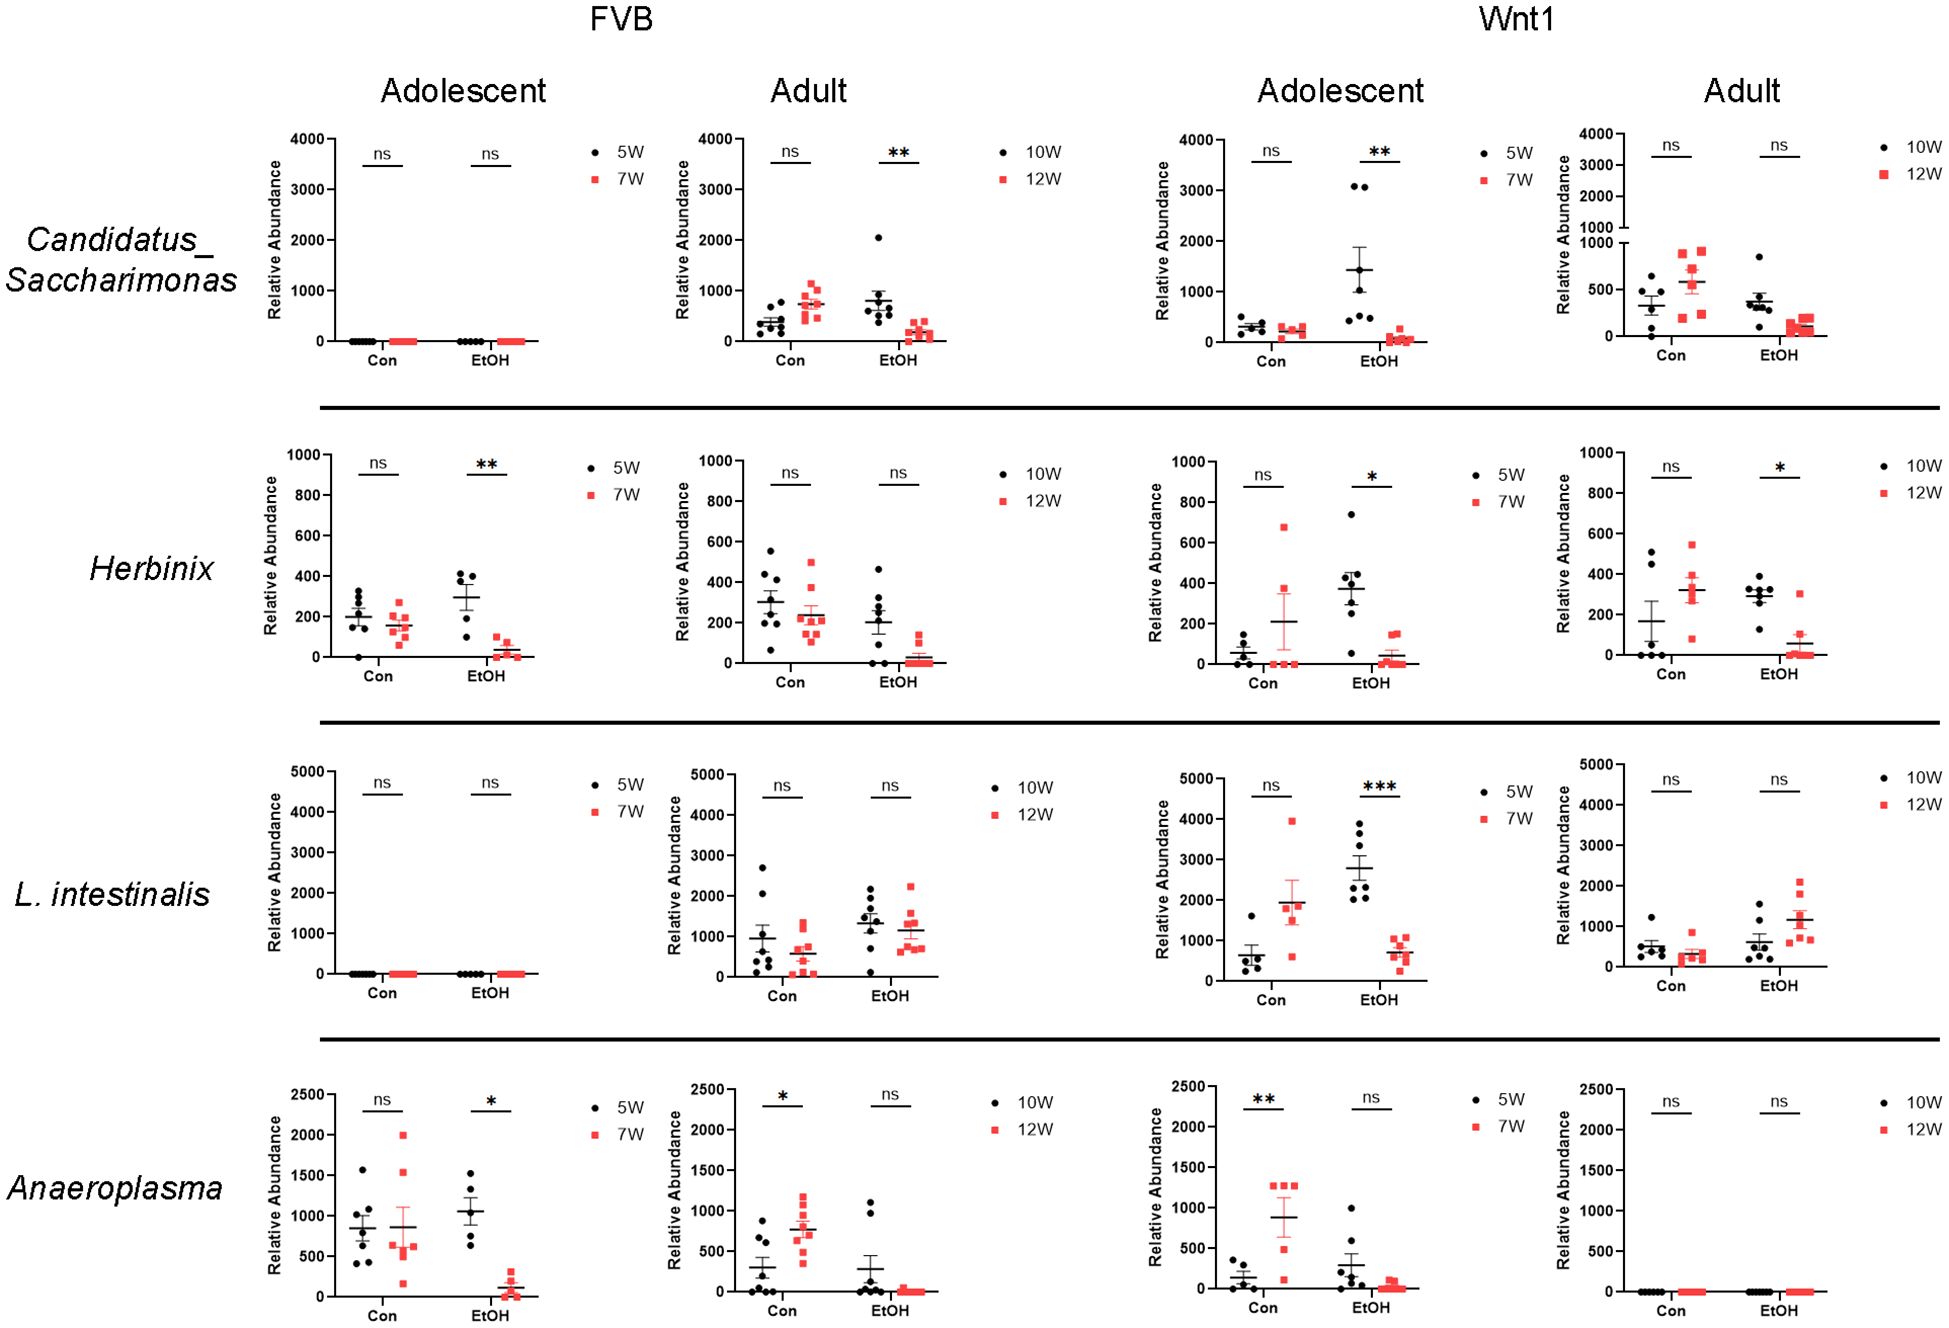
Figure 7. Analysis of alcohol-depleted microbial taxa. Alcohol-depleted microbial taxa were analyzed by two-way ANOVA followed by Tukey’s post hoc test. Selective microbial taxa such as the species L. intestinalis and the genera Candidatus_Saccharimonas, Herbinix and Anaeroplasma were reduced by alcohol exposure. FVB: n = 7 for control (Con) 5W and 7W; n = 5 for ethanol (EtOH) 5W and 7W; n = 8 for control (Con) 10W and 12W; n = 8 for ethanol (EtOH) 10W and 12W; Wnt1: n = 5 for control (Con) 5W and 7W; n = 7 for ethanol (EtOH) 5W and 7W; n = 6 for control (Con) 10W and 12W; n = 7 for ethanol (EtOH) 10W and 12W. ∗p < 0.05, ∗∗p < 0.01, ∗∗∗p < 0.001, ns, not significant (p > 0.05).
Discussion
The Wnt1 transgene, driven by the mouse mammary tumor virus (MMTV) promoter, is a well-established approach for development of a mouse model to study mammary tumor development, as the Wnt1 signaling pathway is crucial for regulating cell proliferation, differentiation and development (48, 49). We previously employed this model to investigate alcohol-induced tumor promotion and found that daily intraperitoneal (IP) injections of ethanol (2.5 g/kg, 25% w/v) for 15 days significantly shortened tumor onset, increased lung metastasis, and elevated circulating levels of estradiol and progesterone, with adolescent mice showing greater sensitivity to the effects of alcohol than adults (33). This 15-day ethanol exposure paradigm was designed to mimic early-stage, heavy episodic alcohol consumption — a pattern prevalent among adolescents and young adults in the U.S. and Europe (50–53) and is more common among females in the U.S. (54). In this study, we further utilized this model to examine the impact of alcohol on the gut microbiome. Our results demonstrated that alcohol exposure significantly reduced microbial species richness as indicated by decreased Chao1 index in adult mice, while it had little effects on this index in adolescent mice. Alcohol also altered microbial compositions as indicated by the analysis of Beta diversity in both adolescents and adults in both strains. Comparative profiling identified a number of taxa consistently affected by alcohol across groups. Further LEfSe and two-way ANOVA analyses confirmed that specific taxa were targets of alcohol exposure.
We first examined the impact of alcohol exposure on alpha diversity by assessing species richness with the Chao1 index (Figure 2) and species diversity with the Shannon index (Supplementary Figure 3). While alcohol exposure did not significantly alter the Shannon index, it had a notable impact on the Chao1 index. A reduced Chao1 index indicating a lower alpha diversity in the gut microbiome, has been reported in patients with breast cancer when compared to healthy controls in multiple studies (55–59). However, there are studies showing that breast cancer patients have different microbial compositions without any difference in alpha diversity (30, 60, 61). An intriguing finding from our study is that the Chao1 index in adolescent mice appeared more resilient to the adverse effects of alcohol exposure compared to adults (Figure 2), suggesting greater plasticity of the adolescent gut microbiome. The microbiome plasticity, or the ability of the gut microbiome to adapt to environmental changes, is known to be highest early in life and decline with age (62–64). Alternatively, this differential response may reflect age-related differences in hepatic alcohol metabolism, where adolescent mice exhibit higher alcohol dehydrogenase and lower aldehyde dehydrogenase activity, potentially limiting acetaldehyde accumulation and associated microbial disruption (65). Together, these findings suggest that while adolescents may be more vulnerable to alcohol’s systemic effects in the context of breast cancer, their gut microbiota may retain greater adaptive capacity, resulting in a more nuanced and multifactorial response to alcohol exposure.
Our beta diversity analysis using weighted UniFrac showed that changes in microbial communities over time were more pronounced in Wnt1 mice compared to FVB mice, with significant alterations observed in the alcohol-exposed groups relative to controls. These results suggest that alcohol exposure significantly disrupts the beta diversity of the gut microbiome over time, beyond the natural developmental changes observed in controls, and Wnt1 mice were more sensitive to alcohol-induced alterations. The increased sensitivity of gut microbiota in Wnt1 mice, may be attributed to the role of Wnt1 signaling in regulating cell proliferation and differentiation, which could interact with the gut microbiome, rendering it more susceptible to environmental factors such as alcohol. Notably, altered beta diversity in the gut microbiome has been linked to various stages of breast cancer, including its subtypes and the presence of metastatic disease (28, 55, 66, 67). These variations in microbial diversity might correlate with systemic inflammation or immune markers, potentially influencing tumor progression and responses to therapies such as chemotherapy or hormone therapy (68, 69).
Comparative analysis of microbial profiles, visualized as heatmaps, revealed distinct yet overlapping responses to alcohol exposure across experimental groups in both FVB and Wnt1 mice. The commonly identified taxa in all experimental groups included the species A. muciniphila; the genera Lachnospiraceae_NK4A136_group, Lactobacillus and Alistipes; and the family Ruminococcaceae. A. muciniphila is a mucus-degrading bacterium that resides in the gut’s mucus layer and is often associated with gut barrier integrity and metabolic health (70, 71). The genus Lachnospiraceae_NK4A136_group, part of the family of Lachnospiraceae, is known for producing short-chain fatty acids (SCFAs) such as butyrate, which supports gut health (19, 20). The genus Lactobacillus comprises numerous probiotic species known for their ability to produce lactic acid and promote gut health (72). Additionally, Alistipes, from the Bacteroidetes phylum, is often linked with protein fermentation and bile acid metabolism (73). The Ruminococcaceae family plays a role in fiber degradation and SCFA production, including butyrate, which supports gut barrier function (74). Although Wnt1 signaling can affect the gut microbiome through its effects on the gut environment and epithelial cell turnover (75, 76), the similar microbial profiles observed in both FVB and Wnt1 mice suggest that alcohol exposure exerts a universal impact on the gut microbiome composition. The combination of shared and unique microbial populations across FVB and Wnt1 groups may reflect variations in age and genetic backgrounds.
To identify specific microbial taxa that were significantly impacted by alcohol exposure, we performed LEfSe and two-way ANOVA analysis. These analyses revealed that a number of selective microbial taxa were increased following alcohol exposure; they include the genera Bacteroides, Faecalibaculum and Turicibacter, the species P. goldsteinii and A. muciniphila. The genus Bacteroides is among the most abundant genera in the gut, including species that play diverse roles ranging from beneficial to pathogenic (77). For example, Bacteroides fragilis, often isolated from extra-intestinal infections, can cause inflammation when it translocates from the gut to other organs due to a compromised intestinal barrier (78–80). Bacteroides fragilis and other Bacteroides species such as Bacteroides uniformis and Bacteroides vulgatus are known to produce beta-glucuronidase, an enzyme involved in the metabolism of estrogens and may influence estrogen-sensitive breast cancer (81, 82). Interestingly, Bacteroides fragilis has also been shown to exert anti-cancer and anti-proliferative effects in mouse breast cancer models (83). The genus Faecalibaculum, from the Erysipelotrichaceae family, plays a critical role in the anti-tumor effects of combined therapies using anti-PD-1 antibody and dietary supplement fucoidan in a breast cancer mouse model (84). One of the Faecalibaculum species, Faecalibaculum rodentium, originally identified as anti-tumorigenic in a mouse model for colorectal cancer (85), was shown to counteract the antibiotic-induced tumor growth acceleration in multiple breast cancer mouse models (86). Meanwhile, Turicibacter, typically present at low or moderate levels in the gut, is involved in the metabolism of lipids and bile acids (87). However, higher levels of Turicibacter have been detected in the intra-tumoral microbiome of patients with triple-negative breast cancer (TNBC) (88) and in the gut microbiota of premenopausal breast cancer patients (89). P. goldsteinii is a low-abundant probiotic in the gut microbiome that supports intestinal integrity and reduces inflammation in conditions such as obesity (90) and pulmonary diseases (91). Finally, A. muciniphila, a mucin-degrading bacterium with anti-inflammatory properties, has been associated with improved outcomes in metabolic disorders, intestinal inflammation and several cancers (92).
The LEfSe and two-way ANOVA analyses also revealed that alcohol exposure led to the reduction of several key microbial taxa: the species L. intestinalis, the genera Candidatus Saccharimonas, Herbinix and Anaeroplasma. L. intestinalis is a known probiotic that has been shown to support gut health and immune regulation in a variety of disease models (93–95). Candidatus Saccharimonas, a genus within the family Candidatus Saccharimonadaceae, has been identified primarily through genetic analysis but remains uncultured, therefore further research is needed to elucidate its functional role. Herbinix, though less studied than other genera in the Lachnospiraceae family, is part of a group known for SCFA production, which plays a crucial role in maintaining gut health. This genus is frequently identified in microbiome studies through sequencing data and contributes to the overall microbial composition of the gut (96, 97). Anaeroplasma has been shown to exhibit anti-inflammatory effects in lung diseases (98) and improve bile acid metabolism and enhance gut barrier function in metabolic disorders (99, 100). Nonetheless, Anaeroplasma has been negatively correlated with the efficacy of naringenin, a flavonoid compound in citrus fruits, in the treatment of non‐alcoholic fatty liver disease (101).
In summary, our findings reveal that even short-term alcohol exposure significantly reduces gut microbiome diversity and disrupts specific microbial communities (Supplementary Table 1). These alterations are biologically meaningful and may persist beyond the exposure period. For instance, Llopis et al. (102) showed that two weeks of alcohol feeding altered the gut microbiota, triggering systemic inflammation and increased intestinal permeability—effects that were reversed by microbiota transplantation, establishing a causal link between alcohol-induced dysbiosis and disease (102). Interestingly, we observed a more pronounced reduction in alpha diversity in adult mice compared to adolescents, a finding that contrasts with our previous work showing that adolescent mice are more susceptible to alcohol-induced mammary tumorigenesis (33). This seeming discrepancy highlights the complex and context-dependent role of the microbiota in cancer susceptibility, which may vary with developmental stage, immune status, and intrinsic tumor risk.
The specific microbial taxa altered in this study such as Turicibacter, Faecalibaculum, P. goldsteinii, L. intestinalis, and A. muciniphila (Supplementary Table 1), are known to regulate inflammation, a critical factor in carcinogenesis. Moreover, Bacteroides fragilis and other species, including Bacteroides uniformis and Bacteroides vulgatus, are implicated in estrogen metabolism, potentially influencing hormone-driven breast cancer pathways. While it remains to be determined whether these observed microbial shifts are causative or merely correlative, functional validation experiments such as fecal microbiota transplantation could clarify their mechanistic role. It is also currently unclear whether the alcohol-induced alterations in microbiome are reversible or not. A future study examining the effects of alcohol after a prolonged abstinence may be necessary. Regardless it is reversible or persistent, our results reveal that alcohol can impact microbiome in a preclinical model of breast cancer development.
We acknowledge there are some limitations in this study. First, microbial abundance was not independently validated; complementary methods such as qPCR or targeted bacterial cultures would strengthen these findings. Second, we administered alcohol via intraperitoneal (IP) injection to model binge-like exposure with controlled dosing and to minimize stress and gastrointestinal irritation associated with oral gavage. While this approach is justified for this study, it does not fully replicate the physiological process of alcohol consumption through the gastrointestinal tract, which may differentially impact gut microbiome composition. Studies using oral gavage administration and appropriate control groups (e.g., handling or gavage controls) may provide additional insight into the effects of alcohol consumption on the gut microbiome.
Together, our results underscore the relevance of alcohol-induced gut dysbiosis in shaping the tumor microenvironment and lay a foundation for future research into microbiota-targeted strategies for breast cancer prevention and therapy.
Data availability statement
The 16S rRNA gene sequencing raw data generated and/or analyzed during this study have been uploaded to the Sequence Read Archive (SRA) under the BioProject ID: PRJNA1248563 for free public access.
Ethics statement
The animal study was approved by Institutional Animal Care and Use Committee (IACUC) of the University of Iowa. The study was conducted in accordance with the local legislation and institutional requirements.
Author contributions
HLi: Formal Analysis, Investigation, Methodology, Writing – original draft, Writing – review & editing, Data curation, Visualization. LM: Data curation, Formal Analysis, Investigation, Methodology, Visualization, Writing – original draft, Writing – review & editing. SS: Conceptualization, Methodology, Resources, Writing – review & editing. ZZ: Resources, Writing – review & editing. WW: Resources, Writing – review & editing. DH: Resources, Writing – review & editing. HLin: Resources, Writing – review & editing. AM: Conceptualization, Resources, Supervision, Writing – review & editing. JL: Conceptualization, Funding acquisition, Investigation, Methodology, Project administration, Resources, Supervision, Writing – review & editing.
Funding
The author(s) declare that financial support was received for the research and/or publication of this article. This research was supported by NIH grants (AA017226 and AA015407).
Conflict of interest
The authors declare that the research was conducted in the absence of any commercial or financial relationships that could be construed as a potential conflict of interest.
The author(s) declared that they were an editorial board member of Frontiers, at the time of submission. This had no impact on the peer review process and the final decision.
Generative AI statement
The author(s) declare that no Generative AI was used in the creation of this manuscript.
Publisher’s note
All claims expressed in this article are solely those of the authors and do not necessarily represent those of their affiliated organizations, or those of the publisher, the editors and the reviewers. Any product that may be evaluated in this article, or claim that may be made by its manufacturer, is not guaranteed or endorsed by the publisher.
Supplementary material
The Supplementary Material for this article can be found online at: https://www.frontiersin.org/articles/10.3389/fonc.2025.1557040/full#supplementary-material
Supplementary Figure 1 | Wilcoxon matched-pairs signed rank test was applied to assess the effects of alcohol exposure on Bacteroides in adolescent Wnt1 mice (left), Anaeroplasma in adolescent Wnt1 mice (right). ∗p < 0.05.
Supplementary Figure 2 | The effects of alcohol exposure on the species A. muciniphila. Two-way ANOVA followed by Tukey’s post hoc test was applied to analyze A. muciniphila in both adolescents (left) and adults (right) in FVB (left panel) and Wnt1 mice (right panel). FVB: n = 7 for control (Con) 5W and 7W; n = 5 for ethanol (EtOH) 5W and 7W; n = 8 for control (Con) 10W and 12W; n = 8 for ethanol (EtOH) 10W and 12W; Wnt1: n = 5 for control (Con) 5W and 7W; n = 7 for ethanol (EtOH) 5W and 7W; n = 6 for control (Con) 10W and 12W; n = 7 for ethanol (EtOH) 10W and 12W. ∗p < 0.05, ∗∗p < 0.01, ∗∗∗p < 0.001, ∗∗∗∗p < 0.0001, ns = not significant (p > 0.05)
Supplementary Figure 3 | Effects of alcohol on microbial species richness. The effect of alcohol on alpha diversity was also measured by Shannon index in all experimental groups.
Supplementary Figure 4 | Two-way ANOVA followed by Tukey’s post hoc test for each microbial taxon identified in the LEfSe analysis of adolescent FVB mice. ∗p < 0.05, ∗∗p < 0.01, ∗∗∗p < 0.001, ns = not significant (p > 0.05).
Supplementary Figure 5 | Two-way ANOVA followed by Tukey’s post hoc test for each microbial taxon identified in the LEfSe analysis of adult FVB mice (A, B). ∗p < 0.05, ∗∗p < 0.01, ∗∗∗p < 0.001, ns = not significant (p > 0.05).
Supplementary Figure 6 | Two-way ANOVA followed by Tukey’s post hoc test for each microbial taxon identified in the LEfSe analysis of adolescent Wnt1 mice. ∗p < 0.05, ∗∗p < 0.01, ∗∗∗p < 0.001, ns = not significant (p > 0.05).
Supplementary Figure 7 | Two-way ANOVA followed by Tukey’s post hoc test for each microbial taxon identified in the LEfSe analysis of adult Wnt1 mice. ∗p < 0.05, ∗∗p < 0.01, ∗∗∗p < 0.001, ns = not significant (p > 0.05).
Supplementary Table 1 | Select differentially abundant microbial taxa affected by ethanol (EtOH) treatment in MMTV-Wnt1 and FVB wild-type mice at adolescent and adult stages. Taxa are listed at the genus or species level. Relative abundance changes are indicated for each treatment group. NS: Not significant. E*, E**, E***: Significantly different in post-EtOH-treated samples compared to pre-EtOH treatment, with * indicating significance level (*p < 0.05, **p < 0.01, ***p < 0.001). ↑: Increased by ethanol treatment. ↓: Decreased by ethanol treatment.
References
1. Chen WY, Rosner B, Hankinson SE, Colditz GA, and Willett WC. Moderate alcohol consumption during adult life, drinking patterns, and breast cancer risk. Jama. (2011) 306:1884–90. doi: 10.1001/jama.2011.1590
2. Seitz HK, Pelucchi C, Bagnardi V, and Vecchia CL. Epidemiology and pathophysiology of alcohol and breast cancer: update 2012. Alcohol Alcoholism. (2012) 47:204–12. doi: 10.1093/alcalc/ags011
3. McDonald JA, Goyal A, and Terry MB. Alcohol intake and breast cancer risk: weighing the overall evidence. Curr Breast Cancer Rep. (2013) 5:208–21. doi: 10.1007/s12609-013-0114-z
4. Bagnardi V, Rota M, Botteri E, Tramacere I, Islami F, Fedirko V, et al. Alcohol consumption and site-specific cancer risk: a comprehensive dose–response meta-analysis. Br J Cancer. (2015) 112:580–93. doi: 10.1038/bjc.2014.579
5. Wang Y, Xu M, Ke Z-J, and Luo J. Cellular and molecular mechanisms underlying alcohol-induced aggressiveness of breast cancer. Pharmacol Res. (2017) 115:299–308. doi: 10.1016/j.phrs.2016.12.005
6. LoConte NK, Brewster AM, Kaur JS, Merrill JK, and Alberg AJ. Alcohol and cancer: A statement of the american society of clinical oncology. J Clin Oncol. (2018) 36:83–93. doi: 10.1200/JCO.2017.76.1155
7. Reichman ME, Judd JT, Longcope C, Schatzkin A, Clevidence BA, Nair PP, et al. Effects of alcohol consumption on plasma and urinary hormone concentrations in premenopausal women. JNCI: J Natl Cancer Institute. (1993) 85:722–7. doi: 10.1093/jnci/85.9.722
8. Gavaler J, Galvao-Teles A, Deal S, and Monteiro E. Proposed mechanisms for the increase in postmenopausal estradiol levels among moderate drinkers: Findings in an international multi-racial multi-ethnic population. Endo crinologia Metabolismo e Nutrição. (2002) 11:141–8.
9. Register TC, Cline JM, and Shively CA. Health issues in postmenopausal women who drink. Alcohol Res Health. (2002) 26:299. doi: 10.1080/07347320490431238
10. Tin ST, Smith-Byrne K, Ferrari P, Rinaldi S, McCullough ML, Teras LR, et al. Alcohol intake and endogenous sex hormones in women: Meta-analysis of cohort studies and Mendelian randomization. Cancer. (2024) 130:3375–86. doi: 10.1002/cncr.35391
11. Dumitrescu RG and Shields PG. The etiology of alcohol-induced breast cancer. Alcohol. (2005) 35:213–25. doi: 10.1016/j.alcohol.2005.04.005
12. Liu Y, Nguyen N, and Colditz GA. Links between alcohol consumption and breast cancer: a look at the evidence. Women’s Health. (2015) 11:65–77. doi: 10.2217/WHE.14.62
13. Bajaj JS. Alcohol, liver disease and the gut microbiota. Nat Rev Gastroenterol Hepatol. (2019) 16:235–46. doi: 10.1038/s41575-018-0099-1
14. Addolorato G, Ponziani FR, Dionisi T, Mosoni C, Vassallo GA, Sestito L, et al. Gut microbiota compositional and functional fingerprint in patients with alcohol use disorder and alcohol-associated liver disease. Liver Int. (2020) 40:878–88. doi: 10.1111/liv.14383
15. Koutromanos I, Legaki E, Gazouli M, Vasilopoulos E, Kouzoupis A, and Tzavellas E. Gut microbiome in alcohol use disorder: Implications for health outcomes and therapeutic strategies-a literature review. World J Methodol. (2024) 14:88519. doi: 10.5662/wjm.v14.i1.88519
16. Brestoff JR and Artis D. Commensal bacteria at the interface of host metabolism and the immune system. Nat Immunol. (2013) 14:676–84. doi: 10.1038/ni.2640
17. Sommer F and Bäckhed F. The gut microbiota—masters of host development and physiology. Nat Rev Microbiol. (2013) 11:227–38. doi: 10.1038/nrmicro2974
18. Ruff WE and Kriegel MA. Autoimmune host–microbiota interactions at barrier sites and beyond. Trends Mol Med. (2015) 21:233–44. doi: 10.1016/j.molmed.2015.02.006
19. Hu S, Wang J, Xu Y, Yang H, Wang J, Xue C, et al. Anti-inflammation effects of fucosylated chondroitin sulphate from Acaudina molpadioides by altering gut microbiota in obese mice. Food Funct. (2019) 10:1736–46. doi: 10.1039/C8FO02364F
20. Ma L, Ni Y, Wang Z, Tu W, Ni L, Zhuge F, et al. Spermidine improves gut barrier integrity and gut microbiota function in diet-induced obese mice. Gut Microbes. (2020) 12:1832857. doi: 10.1080/19490976.2020.1832857
21. Liu X-F, Shao J-H, Liao Y-T, Wang L-N, Jia Y, Dong P-J, et al. Regulation of short-chain fatty acids in the immune system. Front Immunol. (2023) 14:1186892. doi: 10.3389/fimmu.2023.1186892
22. O’Mahony SM, Clarke G, Borre Y, Dinan TG, and Cryan J. Serotonin, tryptophan metabolism and the brain-gut-microbiome axis. Behav Brain Res. (2015) 277:32–48. doi: 10.1016/j.bbr.2014.07.027
23. Dicks LM. Gut bacteria and neurotransmitters. Microorganisms. (2022) 10:1838. doi: 10.3390/microorganisms10091838
24. Yang J, Tan Q, Fu Q, Zhou Y, Hu Y, Tang S, et al. Gastrointestinal microbiome and breast cancer: correlations, mechanisms and potential clinical implications. Breast Cancer. (2017) 24:220–8. doi: 10.1007/s12282-016-0734-z
25. Zhang J, Xia Y, and Sun J. Breast and gut microbiome in health and cancer. Genes Dis. (2021) 8:581–9. doi: 10.1016/j.gendis.2020.08.002
26. Laborda-Illanes A, Sanchez-Alcoholado L, Dominguez-Recio ME, Jimenez-Rodriguez B, Lavado R, Comino-Méndez I, et al. Breast and gut microbiota action mechanisms in breast cancer pathogenesis and treatment. Cancers. (2020) 12:2465. doi: 10.3390/cancers12092465
27. Ruo SW, Alkayyali T, Win M, Tara A, Joseph C, Kannan A, et al. Role of gut microbiota dysbiosis in breast cancer and novel approaches in prevention, diagnosis, and treatment. Cureus. (2021) 13. doi: 10.7759/cureus.17472
28. Terrisse S, Derosa L, Iebba V, Ghiringhelli F, Vaz-Luis I, Kroemer G, et al. Intestinal microbiota influences clinical outcome and side effects of early breast cancer treatment. Cell Death Differentiation. (2021) 28:2778–96. doi: 10.1038/s41418-021-00784-1
29. Zhang J, Xie Q, Huo X, Liu Z, Da M, Yuan M, et al. Impact of intestinal dysbiosis on breast cancer metastasis and progression. Front Oncol. (2022) 12:1037831. doi: 10.3389/fonc.2022.1037831
30. Shrode RL, Knobbe JE, Cady N, Yadav M, Hoang J, Cherwin C, et al. Breast cancer patients from the Midwest region of the United States have reduced levels of short-chain fatty acid-producing gut bacteria. Sci Rep. (2023) 13:526. doi: 10.1038/s41598-023-27436-3
31. Wu AH, Tseng C, Vigen C, Yu Y, Cozen W, Garcia AA, et al. Gut microbiome associations with breast cancer risk factors and tumor characteristics: a pilot study. Breast Cancer Res Treat. (2020) 182:451–63. doi: 10.1007/s10549-020-05702-6
32. Mutlu E, Keshavarzian A, Engen P, Forsyth CB, Sikaroodi M, and Gillevet P. Intestinal dysbiosis: a possible mechanism of alcohol-induced endotoxemia and alcoholic steatohepatitis in rats. Alcohol Clin Exp Res. (2009) 33:1836–46. doi: 10.1111/j.1530-0277.2009.01022.x
33. Xu M, Li H, Chen D, Wu H, Wen W, Xu H, et al. Adolescent-and adult-initiated alcohol exposure in mice differentially promotes tumorigenesis and metastasis of breast cancer. Alcohol: Clin Exp Res. (2023) 47:251–62. doi: 10.1111/acer.14964
34. Shahi SK, Zarei K, Guseva NV, and Mangalam AK. Microbiota analysis using two-step PCR and next-generation 16S rRNA gene sequencing. J visualized experiments: JoVE. (2019) 152:10.3791/59980. doi: 10.3791/59980
35. Callahan BJ, McMurdie PJ, Rosen MJ, Han AW, Johnson AJA, and Holmes SP. DADA2: High-resolution sample inference from Illumina amplicon data. Nat Methods. (2016) 13:581–3. doi: 10.1038/nmeth.3869
36. Yadav M, Ali S, Shrode RL, Shahi SK, Jensen SN, Hoang J, et al. Multiple sclerosis patients have an altered gut mycobiome and increased fungal to bacterial richness. PloS One. (2022) 17:e0264556. doi: 10.1371/journal.pone.0264556
37. McMurdie PJ and Holmes S. phyloseq: an R package for reproducible interactive analysis and graphics of microbiome census data. PloS One. (2013) 8:e61217. doi: 10.1371/journal.pone.0061217
38. Oksanen J, Blanchet FG, Friendly M, Kindt R, Legendre P, Minchin PR, et al. Community ecology package: vegan. R A Lang Environ Stat Comput. (2024).
40. Wickham H, François R, Henry L, and Müller K. dplyr: A grammar of data manipulation. (2023). 1289.
41. Lahti L, Shetty S, Blake T, and Salojarvi J. Tools for microbiome analysis in R. Microbiome package. (2017). doi: 10.1186/s40168-017-0237-y
42. Wickham H, Vaughan D, Girlich M, Ushey K, and Posit Software, PBC. tidyr: tidy messy data. (2024).
43. Wang S, Tao Z, Li H, Wu T, Liu X-S, and Mayakonda A. Sigminer: extract, analyze and visualize mutational signatures for genomic variations. (2024).
44. Wickham H, Chang W, Henry L, Pedersen TL, Takahashi K, Wilke C, et al. ggplot2: elegant graphics for data analysis. (2016). 1295. doi: 10.1007/978-3-319-24277-4
45. Lozupone C and Knight R. UniFrac: a new phylogenetic method for comparing microbial communities. Appl Environ Microbiol. (2005) 71:8228–35. doi: 10.1128/AEM.71.12.8228-8235.2005
46. Cao Y, Dong Q, Wang D, Zhang P, Liu Y, and Niu C. microbiomeMarker: an R/Bioconductor package for microbiome marker identification and visualization. Bioinformatics. (2022) 38:4027–9. doi: 10.1093/bioinformatics/btac438
47. Jensen SN, Cady NM, Shahi SK, Peterson SR, Gupta A, Gibson-Corley KN, et al. Isoflavone diet ameliorates experimental autoimmune encephalomyelitis through modulation of gut bacteria depleted in patients with multiple sclerosis. Sci Adv. (2021) 7:eabd4595. doi: 10.1126/sciadv.abd4595
48. Tsukamoto AS, Grosschedl R, Guzman RC, Parslow T, and Varmus HE. Expression of the int-1 gene in transgenic mice is associated with mammary gland hyperplasia and adenocarcinomas in male and female mice. Cell. (1988) 55:619–25. doi: 10.1016/0092-8674(88)90220-6
49. Li Y, Hively WP, and Varmus HE. Use of MMTV-Wnt-1 transgenic mice for studying the genetic basis of breast cancer. Oncogene. (2000) 19:1002–9. doi: 10.1038/sj.onc.1203273
50. Patrick ME and Schulenberg JE. Alcohol use and heavy episodic drinking prevalence and predictors among national samples of American eighth- and tenth-grade students. J Stud Alcohol Drugs. (2010) 71:41–5. doi: 10.15288/jsad.2010.71.41
51. Danielsson A-K, Romelsjö A, and Tengström A. Heavy episodic drinking in early adolescence: gender-specific risk and protective factors. Subst Use Misuse. (2011) 46:633–43. doi: 10.3109/10826084.2010.528120
52. Danielsson AK, Wennberg P, Hibell B, and Romelsjö A. Alcohol use, heavy episodic drinking and subsequent problems among adolescents in 23 European countries: does the prevention paradox apply? Addiction. (2012) 107:71–80. doi: 10.1111/j.1360-0443.2011.03537.x
53. Rossheim ME, Stephenson CJ, Thombs DL, Livingston MD, Walters ST, Suzuki S, et al. Characteristics of drinking events associated with heavy episodic drinking among adolescents in the United States. Drug Alcohol Depend. (2017) 181:50–7. doi: 10.1016/j.drugalcdep.2017.09.018
54. Forman-Hoffman VL, Edlund M, Glasheen C, and Ridenour T. Alcohol initiation and progression to use, heavy episodic use, and alcohol use disorder among young adolescents ages 12–14 living in US Households. J Stud Alcohol Drugs. (2017) 78:853–60. doi: 10.15288/jsad.2017.78.853
55. Goedert JJ, Jones G, Hua X, Xu X, Yu G, Flores R, et al. Investigation of the association between the fecal microbiota and breast cancer in postmenopausal women: a population-based case-control pilot study. J Natl Cancer Institute. (2015) 107:djv147. doi: 10.1093/jnci/djv147
56. Ma Z, Qu M, and Wang X. Analysis of gut microbiota in patients with breast cancer and benign breast lesions. Polish J Microbiol. (2022) 71:217–26. doi: 10.33073/pjm-2022-019
57. Wu AH, Vigen C, Tseng C, Garcia AA, and Spicer D. Effect of chemotherapy on the gut microbiome of breast cancer patients during the first year of treatment. Breast Cancer: Targets Ther. (2022) 14:433–51. doi: 10.2147/BCTT.S350049
58. Luan B, Ge F, Lu X, Li Z, Zhang H, Wu J, et al. Changes in the fecal microbiota of breast cancer patients based on 16S rRNA gene sequencing: a systematic review and meta-analysis. Clin Trans Oncol. (2024) 26:1480–96. doi: 10.1007/s12094-023-03373-5
59. Valé BG, Franck GD, Kouamé K, Stanislas A, Safiatou C, Bernadette DF, et al. Comparative Study of Gut Microbiota in Breast Cancer Patients versus Controls in Abidjan, Côte d’Ivoire. Adv Microbiol. (2024) 14:405–15.
60. Aarnoutse R, Hillege LE, Ziemons J, De Vos-Geelen J, de Boer M, Aerts EMER, et al. Intestinal microbiota in postmenopausal breast cancer patients and controls. Cancers. (2021) 13:6200. doi: 10.3390/cancers13246200
61. Yaghjyan L, Mai V, Wang X, Ukhanova M, Tagliamonte M, Martinez YC, et al. Gut microbiome, body weight, and mammographic breast density in healthy postmenopausal women. Cancer Causes Control. (2021) 32:681–92. doi: 10.1007/s10552-021-01420-6
62. Grembi JA, Nguyen LH, Haggerty TD, Gardner CD, Holmes SP, and Parsonnet J. Gut microbiota plasticity is correlated with sustained weight loss on a low-carb or low-fat dietary intervention. Sci Rep. (2020) 10:1405. doi: 10.1038/s41598-020-58000-y
63. Qin W, Song P, Lin G, Huang Y, Wang L, Zhou X, et al. Gut microbiota plasticity influences the adaptability of wild and domestic animals in co-inhabited areas. Front Microbiol. (2020) 11. doi: 10.3389/fmicb.2020.00125
64. Thriene K and Michels KB. Human gut microbiota plasticity throughout the life course. Int J Environ Res Public Health. (2023) 20. doi: 10.3390/ijerph20021463
65. Yang J, Wang H, Lin X, Liu J, Feng Y, Bai Y, et al. Gut microbiota dysbiosis induced by alcohol exposure in pubertal and adult mice. mSystems. (2024) 9:e0136624. doi: 10.1128/msystems.01366-24
66. Byrd DA, Vogtmann E, Wu Z, Han Y, Wan Y, Clegg-Lamptey JN, et al. Associations of fecal microbial profiles with breast cancer and nonmalignant breast disease in the Ghana Breast Health Study. Int J Cancer. (2021) 148:2712–23. doi: 10.1002/ijc.33473
67. Wenhui Y, Zhongyu X, Kai C, Zhaopeng C, Jinteng L, Mengjun M, et al. Variations in the gut microbiota in breast cancer occurrence and bone metastasis. Front Microbiol. (2022) 13:894283. doi: 10.3389/fmicb.2022.894283
68. Jørgensen S, Trøseid M, Kummen M, Anmarkrud J, Michelsen A, Osnes L, et al. Altered gut microbiota profile in common variable immunodeficiency associates with levels of lipopolysaccharide and markers of systemic immune activation. Mucosal Immunol. (2016) 9:1455–65. doi: 10.1038/mi.2016.18
69. Cano-Ortiz A, Laborda-Illanes A, Plaza-Andrades I, Membrillo del Pozo A, Villarrubia Cuadrado A, Rodríguez Calvo de Mora M, et al. Connection between the gut microbiome, systemic inflammation, gut permeability and FOXP3 expression in patients with primary Sjögren’s syndrome. Int J Mol Sci. (2020) 21:8733. doi: 10.3390/ijms21228733
70. Macchione I, Lopetuso LR, Ianiro G, Napoli M, Gibiino G, Rizzatti G, et al. Akkermansia muciniphila: key player in metabolic and gastrointestinal disorders. Eur Rev Med Pharmacol Sci. (2019) 18:8075–83. doi: 10.26355/eurrev_201903_17163
71. Mo C, Lou X, Xue J, Shi Z, Zhao Y, Wang F, et al. The influence of Akkermansia muciniphila on intestinal barrier function. Gut Pathog. (2024) 16:41. doi: 10.1186/s13099-024-00635-7
72. Slover CM and Danziger L. Lactobacillus: a review. Clin Microbiol Newslett. (2008) 30:23–7. doi: 10.1016/j.clinmicnews.2008.01.006
73. Parker BJ, Wearsch PA, Veloo AC, and Rodriguez-Palacios A. The genus Alistipes: gut bacteria with emerging implications to inflammation, cancer, and mental health. Front Immunol. (2020) 11:906. doi: 10.3389/fimmu.2020.00906
74. Biddle A, Stewart L, Blanchard J, and Leschine S. Untangling the genetic basis of fibrolytic specialization by Lachnospiraceae and Ruminococcaceae in diverse gut communities. Diversity. (2013) 5:627–40. doi: 10.3390/d5030627
75. Moparthi L and Koch S. Wnt signaling in intestinal inflammation. Differentiation. (2019) 108:24–32. doi: 10.1016/j.diff.2019.01.002
76. Liang L, Liu L, Zhou W, Yang C, Mai G, Li H, et al. Gut microbiota-derived butyrate regulates gut mucus barrier repair by activating the macrophage/WNT/ERK signaling pathway. Clin Sci. (2022) 136:291–307. doi: 10.1042/CS20210778
77. Wexler HM. Bacteroides: the good, the bad, and the nitty-gritty. Clin Microbiol Rev. (2007) 20:593–621. doi: 10.1128/CMR.00008-07
78. Akhi MT, Ghotaslou R, Asgharzadeh M, Varshochi M, Pirzadeh T, Memar MY, et al. Bacterial etiology and antibiotic susceptibility pattern of diabetic foot infections in Tabriz, Iran. GMS hygiene infection control. (2015) 10. doi: 10.3205/dgkh000255
79. Akhi MT, Ghotaslou R, Beheshtirouy S, Asgharzadeh M, Pirzadeh T, Asghari B, et al. Antibiotic susceptibility pattern of aerobic and anaerobic bacteria isolated from surgical site infection of hospitalized patients. Jundishapur J Microbiol. (2015) 8. doi: 10.5812/jjm.20309v2
80. Sun F, Zhang Q, Zhao J, Zhang H, Zhai Q, and Chen W. A potential species of next-generation probiotics? The dark and light sides of Bacteroides fragilis in health. Food Res Int. (2019) 126:108590. doi: 10.1016/j.foodres.2019.108590
81. Fuhrman BJ, Feigelson HS, Flores R, Gail MH, Xu X, Ravel J, et al. Associations of the fecal microbiome with urinary estrogens and estrogen metabolites in postmenopausal women. J Clin Endocrinol Metab. (2014) 99:4632–40. doi: 10.1210/jc.2014-2222
82. Fernández-Murga ML, Gil-Ortiz F, Serrano-García L, and Llombart-Cussac A. A new paradigm in the relationship between gut microbiota and breast cancer: β-glucuronidase enzyme identified as potential therapeutic target. Pathogens. (2023) 12:1086. doi: 10.3390/pathogens12081086
83. Karami P, Goli HR, Abediankenari S, Chandani SR, Jafari N, Ghasemi M, et al. Anti-tumor effects of Bacteroides fragilis and Bifidobacterium bifidum culture supernatants on mouse breast cancer. Gene Rep. (2023) 33:101815. doi: 10.1016/j.genrep.2023.101815
84. Li H, Dong T, Tao M, Zhao H, Lan T, Yan S, et al. Fucoidan enhances the anti-tumor effect of anti-PD-1 immunotherapy by regulating gut microbiota. Food Funct. (2024) 15:3463–78. doi: 10.1039/D3FO04807A
85. Zagato E, Pozzi C, Bertocchi A, Schioppa T, Saccheri F, Guglietta S, et al. Endogenous murine microbiota member Faecalibaculum rodentium and its human homologue protect from intestinal tumour growth. Nat Microbiol. (2020) 5:511–24. doi: 10.1038/s41564-019-0649-5
86. McKee AM, Kirkup BM, Madgwick M, Fowler WJ, Price CA, Dreger SA, et al. Antibiotic-induced disturbances of the gut microbiota result in accelerated breast tumor growth. Iscience. (2021) 24. doi: 10.1016/j.isci.2021.103012
87. Lynch JB, Gonzalez EL, Choy K, Faull KF, Jewell T, Arellano A, et al. Gut microbiota Turicibacter strains differentially modify bile acids and host lipids. Nat Commun. (2023) 14:3669. doi: 10.1038/s41467-023-39403-7
88. Wang Y, Qu D, Zhang Y, Jin Y, Feng Y, Zhang H, et al. Intra-tumoral microbial community profiling and associated metabolites alterations of TNBC. Front Oncol. (2023) 13:1143163. doi: 10.3389/fonc.2023.1143163
89. He C, Liu Y, Ye S, Yin S, and Gu J. Changes of intestinal microflora of breast cancer in premenopausal women. Eur J Clin Microbiol Infect Dis. (2021) 40:503–13. doi: 10.1007/s10096-020-04036-x
90. Wu T-R, Lin C-S, Chang C-J, Lin T-L, Martel J, Ko Y-F, et al. Gut commensal Parabacteroides goldsteinii plays a predominant role in the anti-obesity effects of polysaccharides isolated from Hirsutella sinensis. Gut. (2019) 68:248–62. doi: 10.1136/gutjnl-2017-315458
91. Lai H-C, Lin T-L, Chen T-W, Kuo Y-L, Chang C-J, Wu T-R, et al. Gut microbiota modulates COPD pathogenesis: role of anti-inflammatory Parabacteroides goldsteinii lipopolysaccharide. Gut. (2022) 71:309–21. doi: 10.1136/gutjnl-2020-322599
92. Cani PD, Depommier C, Derrien M, Everard A, and de Vos WM. Akkermansia muciniphila: paradigm for next-generation beneficial microorganisms. Nat Rev Gastroenterol Hepatol. (2022) 19:625–37. doi: 10.1038/s41575-022-00631-9
93. Lim EY, Song EJ, Kim JG, Jung SY, Lee SY, Shin HS, et al. Lactobacillus intestinalis YT2 restores the gut microbiota and improves menopausal symptoms in ovariectomized rats. Benef Microbes. (2021) 12:503–16. doi: 10.3920/BM2020.0217
94. Lin WS, Chueh TL, Nagabhushanam K, Ho CT, and Pan MH. Piceatannol and 3’-hydroxypterostilbene alleviate inflammatory bowel disease by maintaining intestinal epithelial integrity and regulating gut microbiota in mice. J Agric Food Chem. (2023) 71:1994–2005. doi: 10.1021/acs.jafc.2c08170
95. Wang QW, Jia DJC, He JM, Sun Y, Qian Y, Ge QW, et al. Lactobacillus intestinalis primes epithelial cells to suppress colitis-related Th17 response by host-microbe retinoic acid biosynthesis. Advanced Sci. (2023) 10:2303457. doi: 10.1002/advs.202303457
96. Maus I, Bremges A, Stolze Y, Hahnke S, Cibis KG, Koeck DE, et al. Genomics and prevalence of bacterial and archaeal isolates from biogas-producing microbiomes. Biotechnol Biofuels. (2017) 10:264. doi: 10.1186/s13068-017-0947-1
97. Jia T, Yun Y, and Yu Z. Propionic acid and sodium benzoate affected biogenic amine formation, microbial community, and quality of oat silage. Front Microbiol. (2021) 12:750920. doi: 10.3389/fmicb.2021.750920
98. Wang H, He Y, Dang D, Zhao Y, Zhao J, and Lu W. Gut microbiota-derived tryptophan metabolites alleviate allergic asthma inflammation in ovalbumin-induced mice. Foods. (2024) 13. doi: 10.3390/foods13091336
99. Wu W, Kaicen W, Bian X, Yang L, Ding S, Li Y, et al. Akkermansia muciniphila alleviates high-fat-diet-related metabolic-associated fatty liver disease by modulating gut microbiota and bile acids. Microb Biotechnol. (2023) 16:1924–39. doi: 10.1111/1751-7915.14293
100. Forlano R, Martinez-Gili L, Takis P, Miguens-Blanco J, Liu T, Triantafyllou E, et al. Disruption of gut barrier integrity and host-microbiome interactions underlie MASLD severity in patients with type-2 diabetes mellitus. Gut Microbes. (2024) 16:2304157. doi: 10.1080/19490976.2024.2304157
101. Cao P, Yue M, Cheng Y, Sullivan MA, Chen W, Yu H, et al. Naringenin prevents non-alcoholic steatohepatitis by modulating the host metabolome and intestinal microbiome in MCD diet-fed mice. Food Sci Nutr. (2023) 11:7826–40. doi: 10.1002/fsn3.3700
Keywords: alcohol misuse, breast cancer, gut dysbiosis, tumor promotion, Wnt1
Citation: Li H, Meza LA, Shahi SK, Zhang Z, Wen W, Hu D, Lin H, Mangalam A K and Luo J (2025) Effects of alcohol on gut microbiome in adolescent and adult MMTV-Wnt1 mice. Front. Oncol. 15:1557040. doi: 10.3389/fonc.2025.1557040
Received: 07 January 2025; Accepted: 25 June 2025;
Published: 16 July 2025.
Edited by:
Mukul S. Godbole, MIT World Peace University, IndiaReviewed by:
Sonali Vishal, Yale University, United StatesBhasker Dharavath, Beth Israel Deaconess Medical Center and Harvard Medical School, United States
Rupa Mishra, Prashanti Cancer Care Mission - Centre for Translational Cancer Research, India
Copyright © 2025 Li, Meza, Shahi, Zhang, Wen, Hu, Lin, Mangalam and Luo. This is an open-access article distributed under the terms of the Creative Commons Attribution License (CC BY). The use, distribution or reproduction in other forums is permitted, provided the original author(s) and the copyright owner(s) are credited and that the original publication in this journal is cited, in accordance with accepted academic practice. No use, distribution or reproduction is permitted which does not comply with these terms.
*Correspondence: Jia Luo, amlhLWx1b0B1aW93YS5lZHU=