 Xiaoqin Tang
 Wei Wei
 Fei Li
- Department of Neurosurgery, Southwest Hospital, Chongqing, China
Background: The natural history of untreated IDH-mutant astrocytoma, CNS WHO grade 2, progressing to astrocytoma grade 4 remains poorly characterized.
Methods: A 67-year-old woman with a histologically confirmed grade 2 astrocytoma developed a spatially adjacent grade 4 lesion after eight years without therapeutic intervention. Tumor tissue and peripheral blood were analyzed using integrated genomic, transcriptomic, and immune profiling.
Results: The central region retained grade 2 histology, while the peripheral region exhibited grade 4 features. Both shared mutations in IDH1, TP53, and ATRX, with highly concordant methylation patterns. The grade 4 lesion uniquely acquired mutations in CIC, BRCA2, and RPA4, and showed a 70% increase in NAF1 mutant allele frequency. Pathway analysis revealed MSP-RON and NF-κB activation, increased mast cell infiltration, and reduced IL-17 signaling, dendritic cells, and CD4+/CD8+ T-cell presence. Among the 1,926 peripheral blood T-cell receptor clonotypes, only 2.1% were detected in the tumor regions. Two highly abundant clonotypes were consistently present in peripheral blood, grade 2, and grade 4 samples, indicating clonal persistence across compartments.
Conclusion: This case highlights the clonal progression of an IDH-mutant astrocytoma from grade 2 to grade 4, potentially driven by additional mutations and immune remodeling. These exploratory findings suggest candidate mechanisms of glioma evolution and may inform adoptive T-cell therapy approaches.
Introduction
Diffuse low-grade gliomas, particularly isocitrate dehydrogenase (IDH)-mutant astrocytomas, frequently progress to higher-grade forms such as astrocytoma, CNS WHO grade 4. Despite advances in molecular profiling and the adoption of the 2021 WHO classification, the biological mechanisms underlying this malignant transformation remain poorly understood, especially in the absence of therapeutic interference (1). Previous studies have implicated multiple pathways in astrocytoma progression, including PI3K/Akt/mTOR signaling (2), RB pathway disruption (3, 4), dysregulated cell cycle control (5), DNA methylation reprogramming (6), and MET-exon-14-skipping (METex14) (7). In addition, gliomas develop a profoundly immunosuppressive tumor microenvironment, in which impaired local immune surveillance may facilitate malignant progression (8–10). However, current understanding is primarily derived from tumors that have undergone surgery, chemotherapy (11), or radiotherapy (12), which confound the natural history of progression. Here, we report a rare case of untreated IDH-mutant astrocytoma that progressed from CNS WHO grade 2 to grade 4 over eight years, without resection or effective adjuvant therapy, providing a unique opportunity to explore intrinsic mechanisms of glioma evolution under unaltered clinical conditions.
Case presentation
A 67-year-old woman presented in June 2010 with persistent headaches and dizziness. Initial brain computed tomography (CT) identified an intracranial lesion. Follow-up imaging in October 2013 showed a non-enhancing, low-density area in the right frontal lobe with a suborbicular appearance, suggesting a low-grade glioma. The patient remained untreated until May 2018, when she developed worsening headaches, blurred vision, and left-sided weakness. Repeat CT and magnetic resonance imaging (MRI) demonstrated significant tumor enlargement, midline shift due to lateral ventricular compression, and a newly enhancing region posterior to the original lesion (Figure 1A), raising suspicion for high-grade transformation.
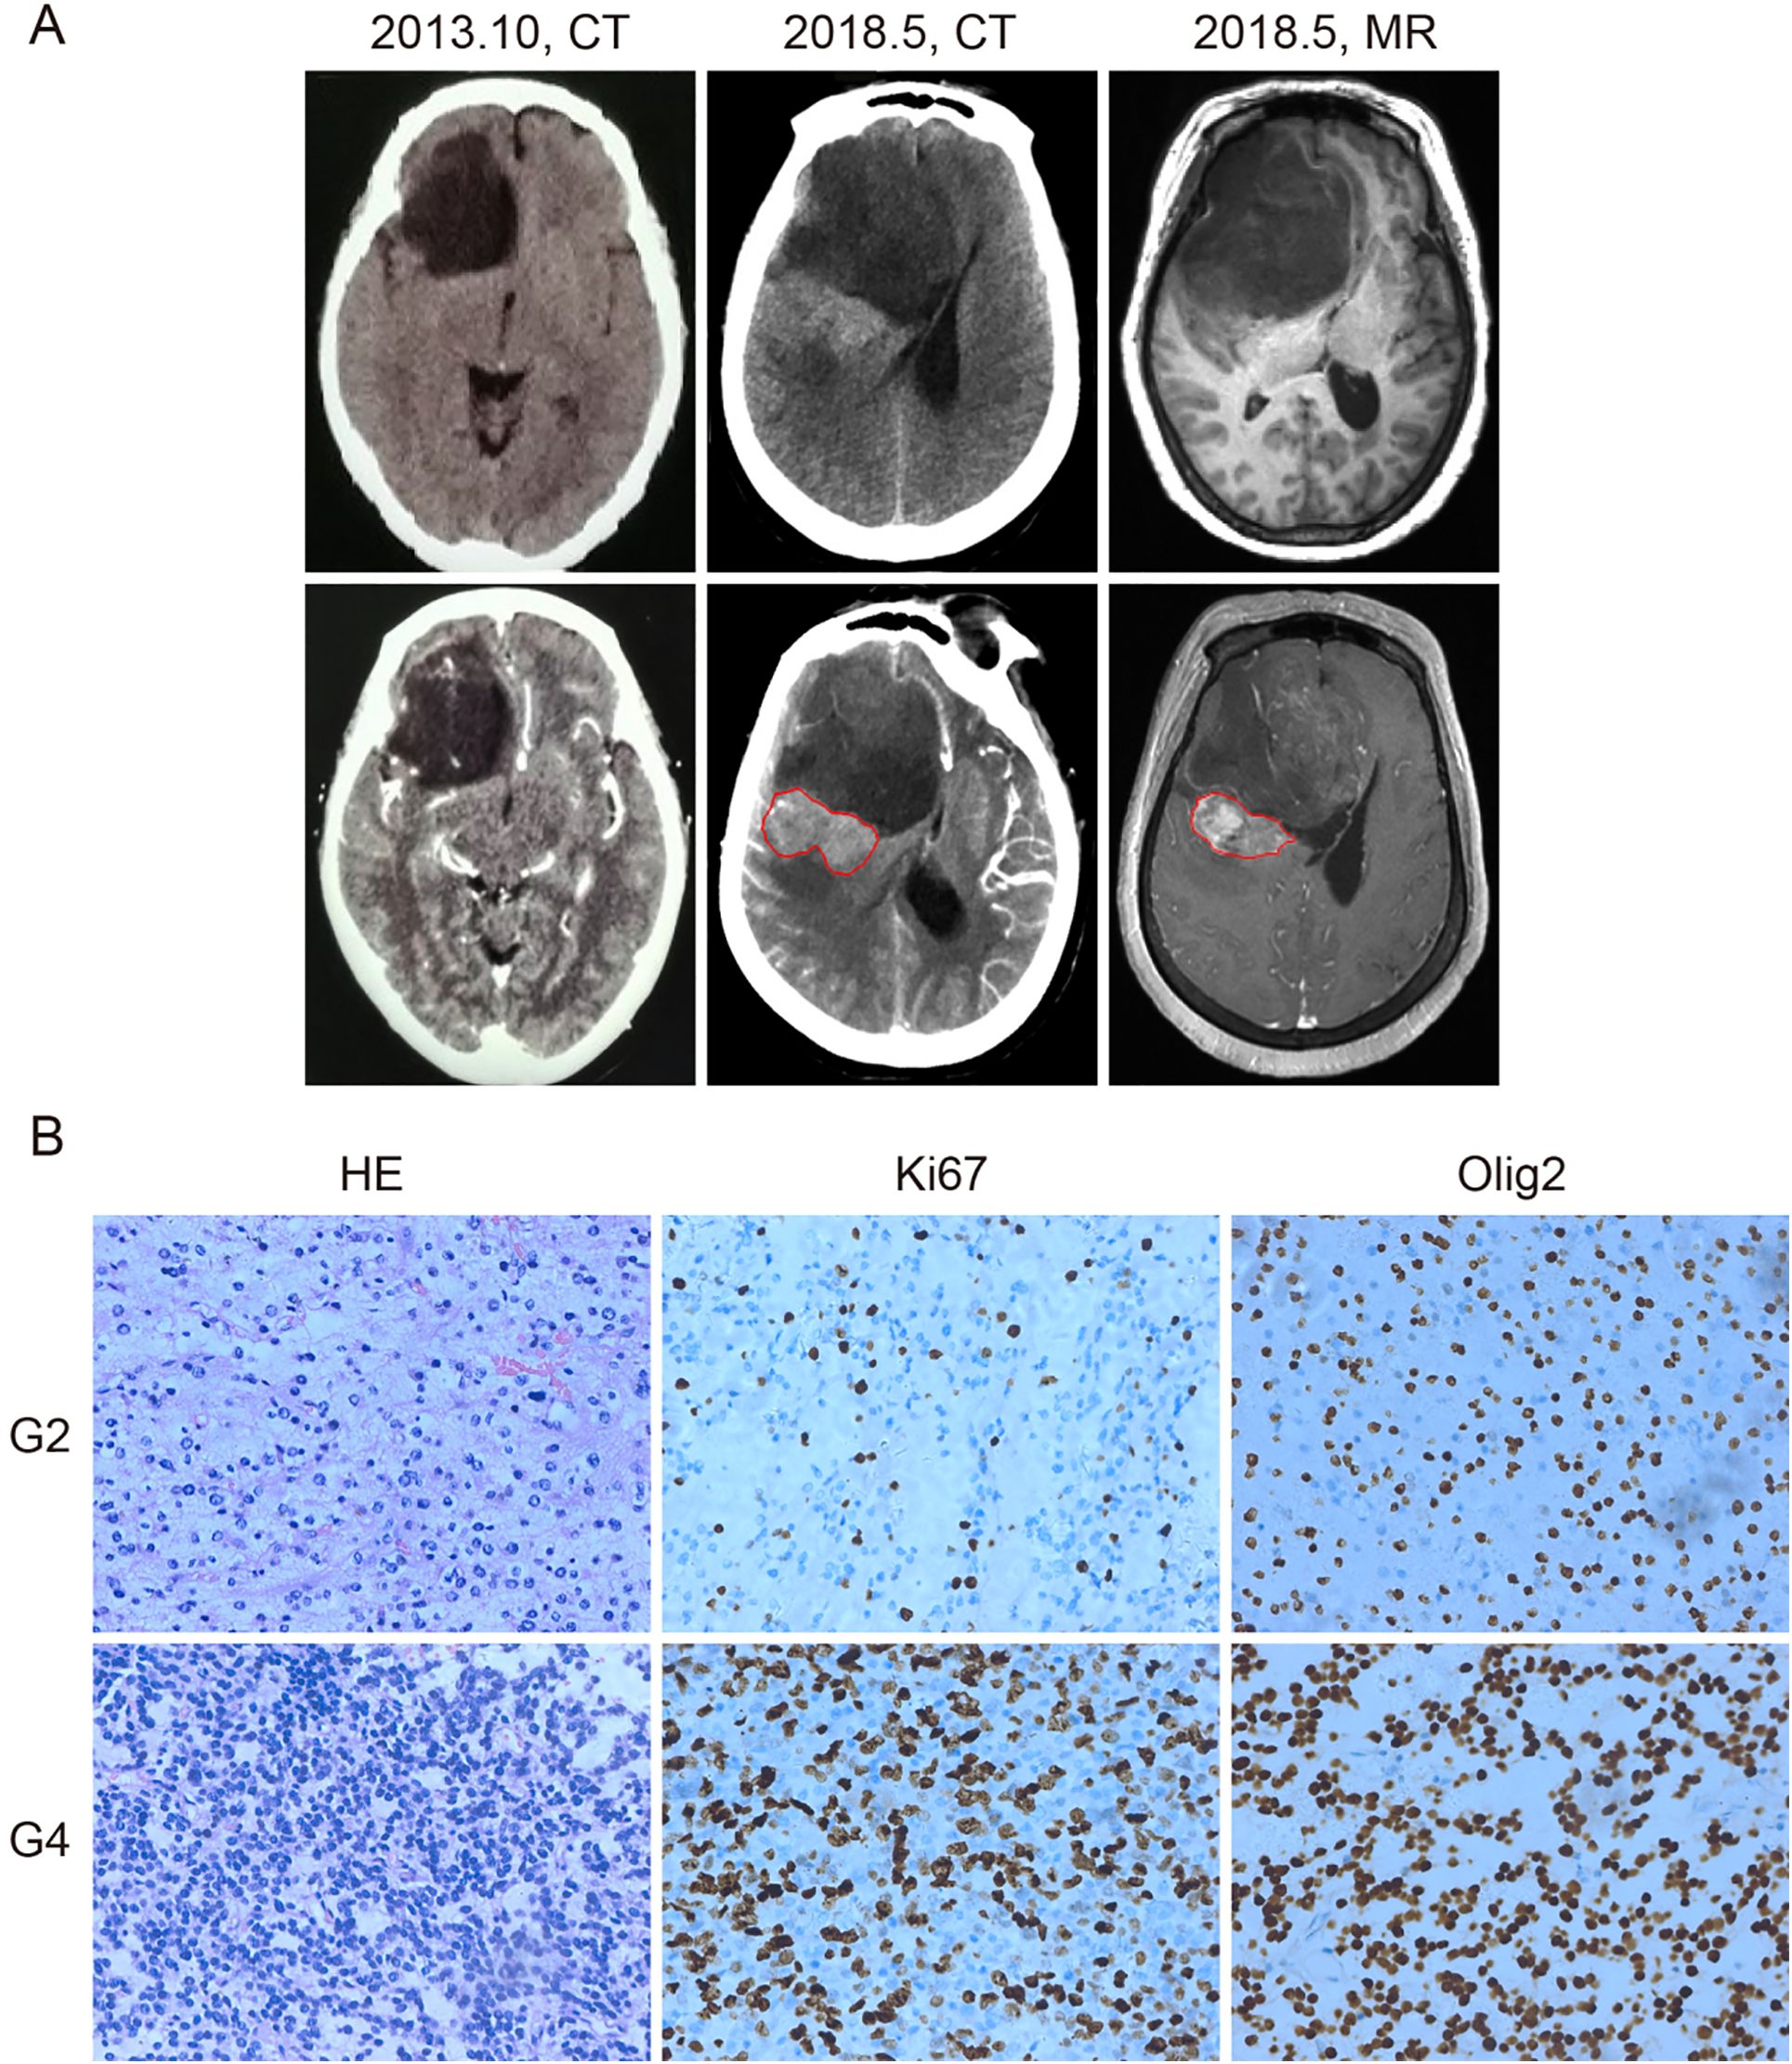
Figure 1. Computed tomography (CT), magnetic resonance imaging (MRI), and histological diagnosis of the patient. (A) CT and MRI images of the tumor. In October 2013, CT showed a low-density area in the right frontal lobe without enhancement (left panel). By May 2018, CT (middle panel) and contrast-enhanced MRI (right panel) revealed tumor enlargement and a newly enhancing region (outlined in red), suggesting malignant progression. (B) Hematoxylin and eosin (HE), anti-Ki67, and anti-Olig2 staining of the grade 2 (G2) and grade 4 (G4) tumor samples. Grade 4 tissue exhibited higher cellular density and increased Ki67 staining, indicating elevated proliferative activity. Olig2 positivity was retained in both grades. Brown nuclear staining indicates positive cells. Images are representative of observed patterns.
On June 1, 2018, the patient underwent surgical resection of the entire lesion. Histopathological and molecular analyses revealed two distinct regions: a central component consistent with astrocytoma, IDH-mutant, CNS WHO grade 2, and a peripheral component corresponding to astrocytoma, IDH-mutant, CNS WHO grade 4, according to the 2021 WHO Classification of Tumors of the Central Nervous System (8). The grade 4 region showed increased cellularity, a higher Ki-67 proliferation index, and stronger Olig2 expression compared to the grade 2 region, suggesting a more aggressive biological phenotype (Figure 1B).
Untreated clinical progression from grade 2 to grade 4 astrocytoma
A total of 117 and 96 somatic mutations were identified in the grade 2 and grade 4 astrocytoma regions, respectively, with 53 mutations shared between them (Figure 2A). Canonical glioma-associated alterations such as TERT promoter mutations (C228T, C250T), EGFR VIII fusion, and 1p/19q codeletion were absent. Mutations in IDH (R132S), TP53 (R234C), and ATRX (T1582NfsTer19) were observed in both regions, with comparable mutant allele frequencies (MAFs). Among them, IDH and TP53 exhibited MAFs exceeding 70%, supporting their classification as early mutations present in both tumor regions (Figure 2B).
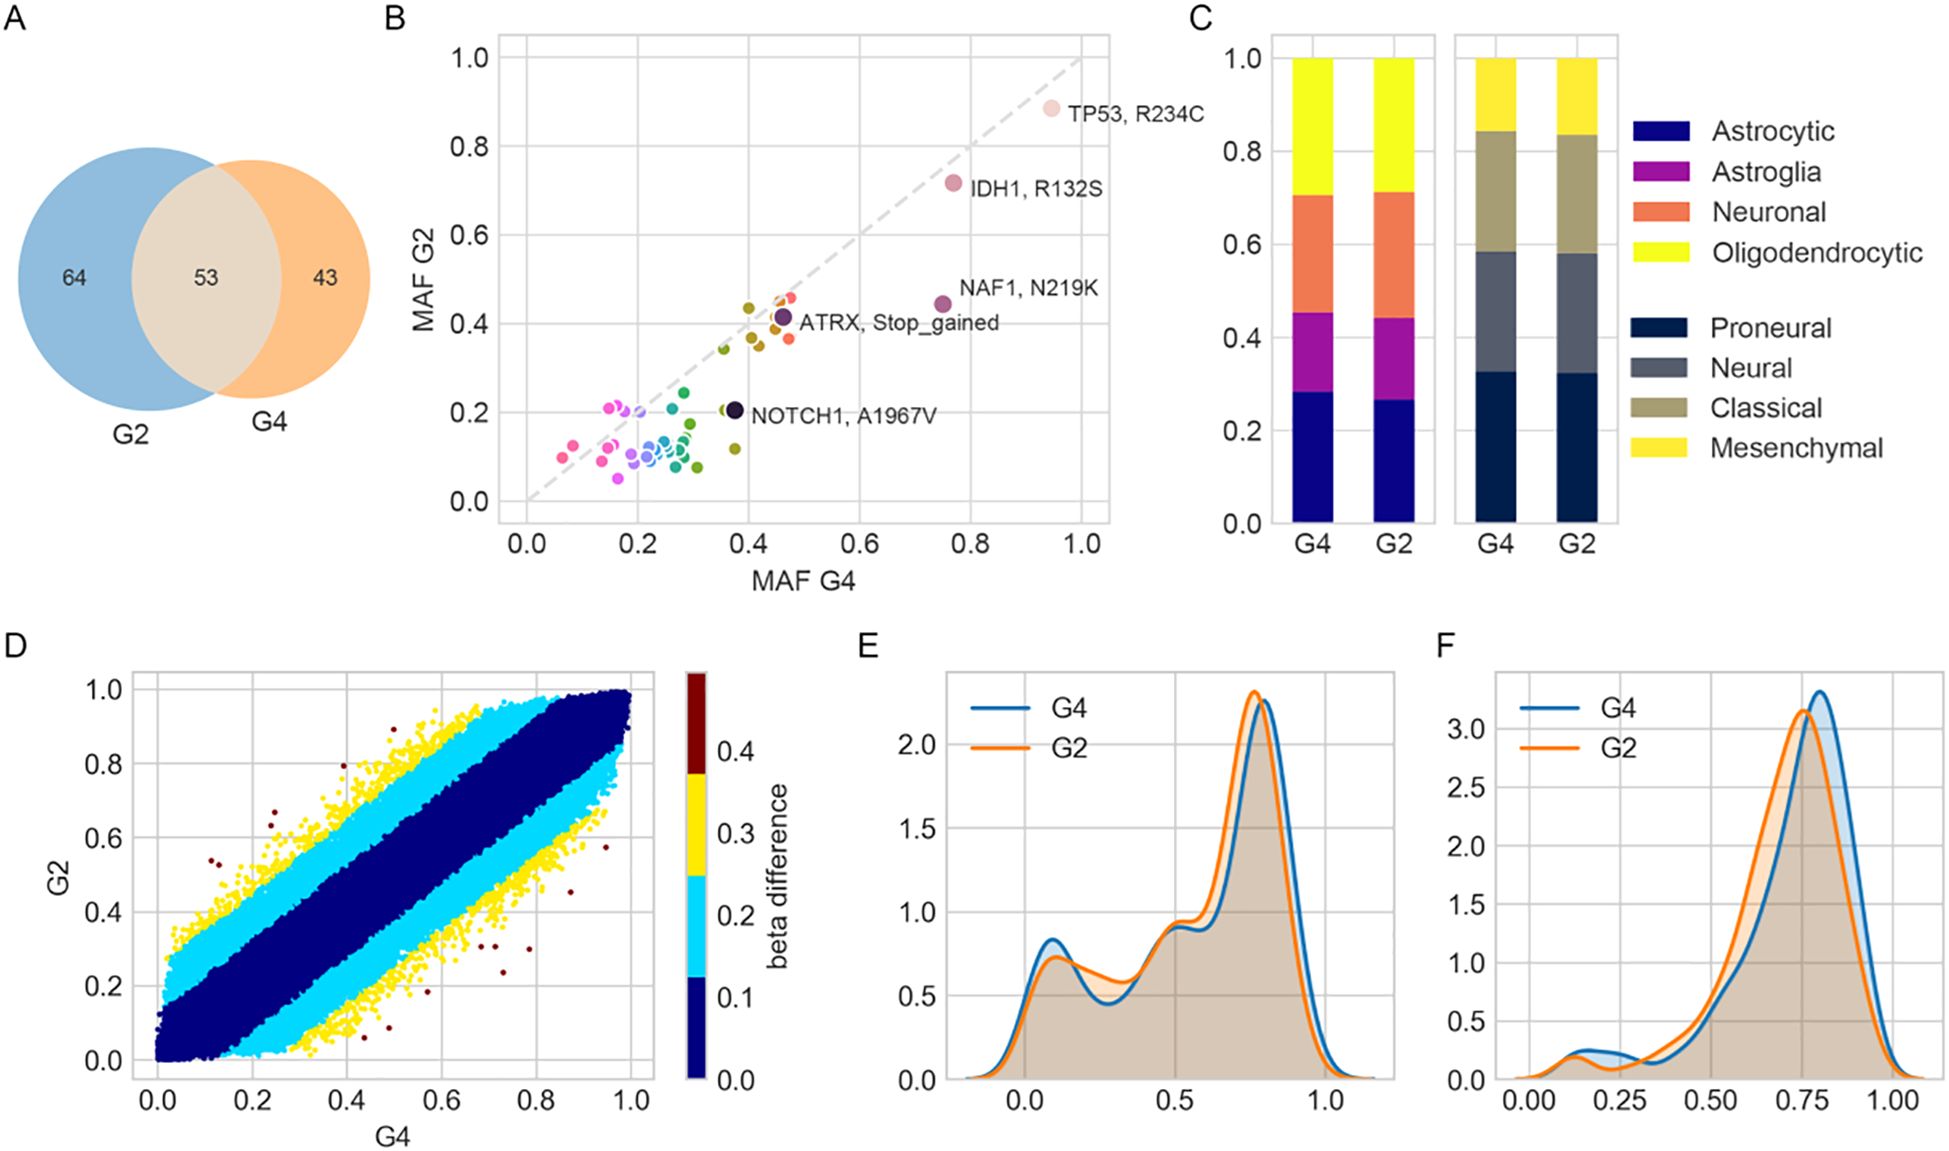
Figure 2. Molecular and transcriptional characterization of grade 2 (G2) and grade 4 (G4) astrocytoma regions. (A) Venn diagram showing the number of unique and shared mutations identified in G2 and G4 tumor samples. (B) Scatterplot comparing minor allele frequencies (MAFs) of shared mutations between G2 and G4. (C) Bar plots showing relative enrichment scores of cell-type and transcriptional subtype signatures derived from ssGSEA using previously published gene sets. (D) Scatterplot of DNA methylation β-values for shared probes between G2 and G4. Color intensity reflects the magnitude of β-value difference, indicating changes in methylation. (E, F) Kernel density plots of β-values for probes defining (E) CpG island methylator phenotype (CIMP, 1,503 probes) and (F) CIMP-high subtype (131 probes), illustrating epigenetic landscape differences.
Transcriptomic subtype analysis based on the Verhaak classification (9) revealed proneural enrichment in both samples (normalized scores: 32.4% in grade 2, 32.8% in grade 4), along with mixed subtype characteristics reflecting intra-tumoral heterogeneity. Cell-of-origin deconvolution indicated contributions from oligodendrocyte- and astrocyte-like gene signatures (28.7% and 29.4% in grade 2, 26.6% and 28.3% in grade 4, respectively) (Figure 2C), which may reflect microenvironmental influences rather than definitive cellular lineage.
In DNA methylation profiling, β-values range from 0 (unmethylated) to 1 (fully methylated). Values around 0.75 indicate extensive promoter hypermethylation across CpG islands. Such a pattern is characteristic of the CpG Island Methylator Phenotype (CIMP), which has been associated with distinct epigenetic tumor subtypes and potentially poorer prognosis (10). DNA methylation profiles were highly concordant between grade 2 and grade 4 (Pearson R² = 0.991). Only 4,035 out of 761,759 CpGs exhibited β-value differences greater than 0.2 (Figure 2D). Both samples showed a high probability of MGMT promoter methylation (0.99) and were classified as CpG island methylator phenotype (CIMP)+, with peak β-values around 0.76 (Figures 2E, F).
Clone evolution analysis suggested a common germline foundation, with phylogenetic divergence supported by MAF distributions and distinct subclonal mutations. Among these, CIC (T761LfsTer163), a frameshift mutation introducing a premature stop codon, and BRCA2 (M3217V), a missense mutation replacing methionine with valine, showed increased representation in grade 4, indicating clonal expansion (Figure 3A). The inferred phylogeny revealed common ancestral mutations at the trunk and lineage-specific alterations in each region (Figure 3B). Notably, 43 mutations were exclusive to grade 4, including CIC, RPA4, BRCA2, NAF, and NOTCH1, supporting the acquisition of additional oncogenic events during malignant progression.
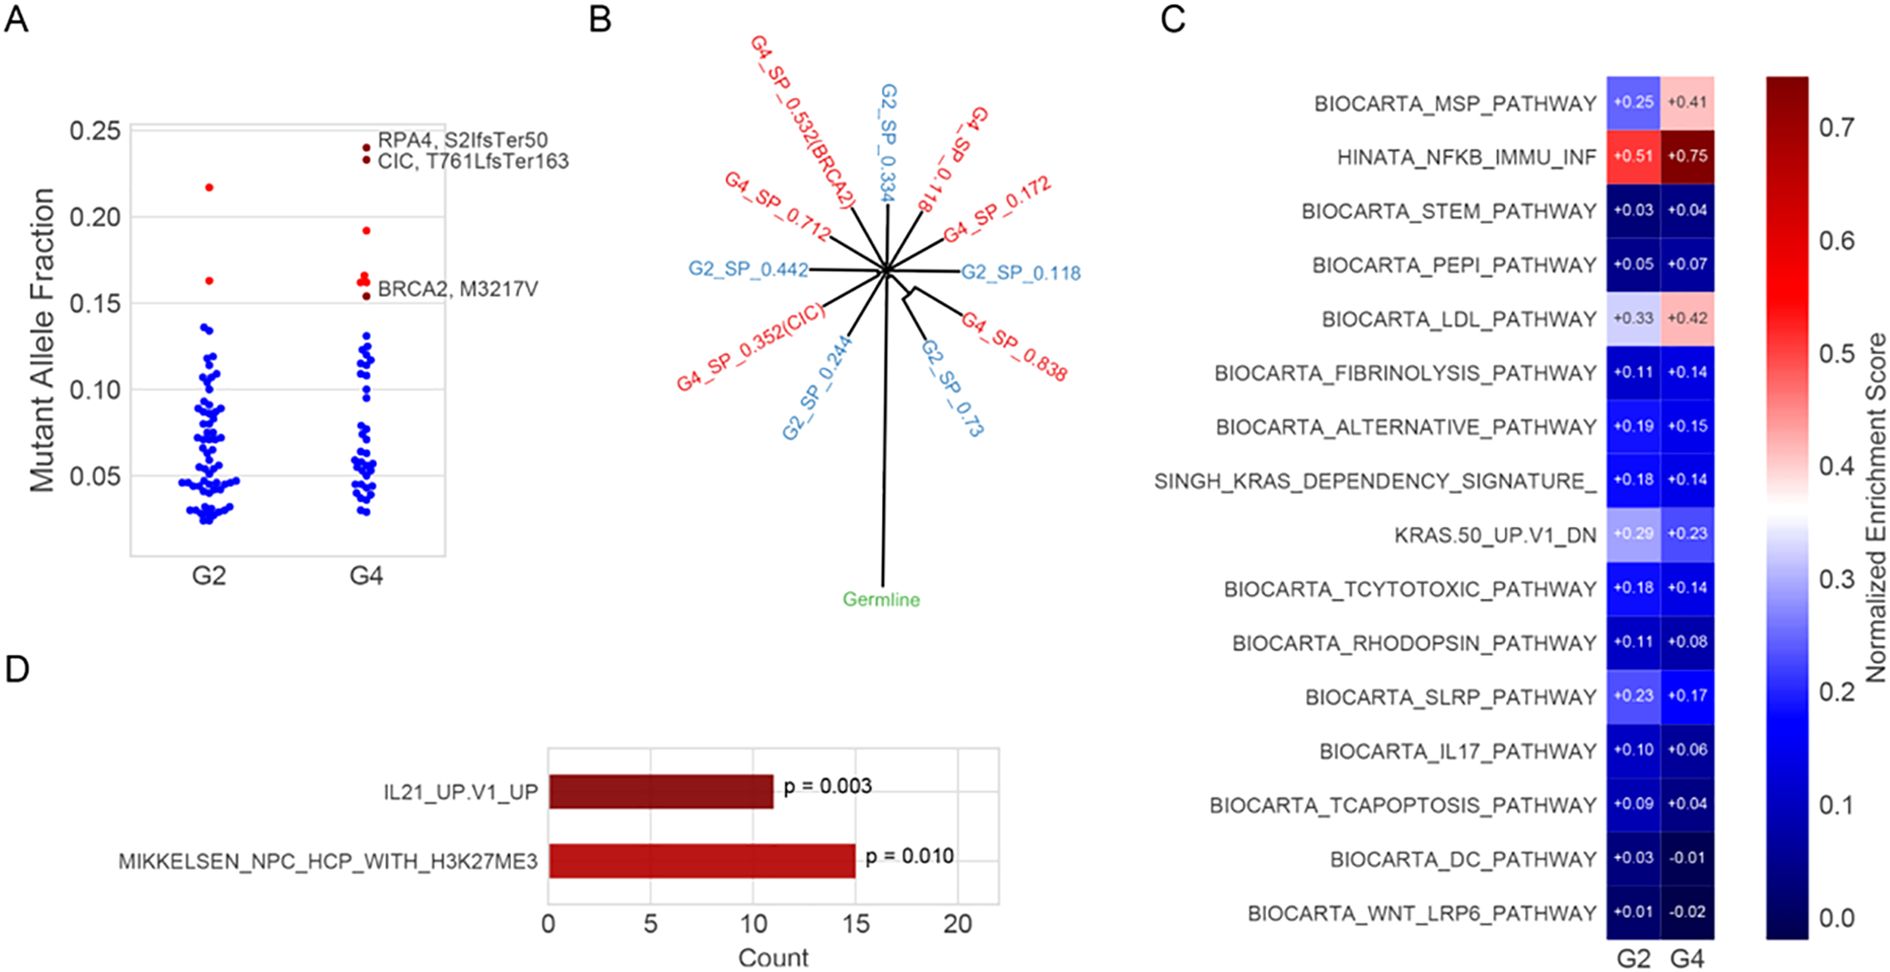
Figure 3. Clone evolution and enrichment pathway analysis. (A) Mutant allele fractions (MAFs) of somatic mutations in G2 and G4 regions. Blue dots represent unannotated variants; red triangles indicate mutations potentially associated with malignant progression (e.g., RPA4 S21fsTer50, CIC T761LfsTer163, and BRCA2 M3217V). RPA4 (S21fsTer50): serine at position 21 to frameshift, terminating at position 50; CIC (T761LfsTer163): threonine at position 761 to leucine frameshift, terminating at position 163; BRCA2 (M3217V): methionine at position 3217 substituted by valine. (B). Inferred clonal architecture reconstructed using SciClone, showing evolutionary relationships between subpopulations (SPs) in G2 (blue) and G4 (red). Internal nodes represent hypothetical ancestral clones; external nodes reflect the cellular prevalence of each SP. (C). Single-sample gene set enrichment analysis (ssGSEA) of curated immune and signaling pathways using RNA-seq expression data from G2 and G4. Normalized enrichment scores (NES) are shown; red and blue indicate positive and negative enrichment, respectively. (D). Pathway enrichment of Egenes associated with significantly hypomethylated CpG sites in G4. Enrichment was assessed using the hypergeometric test, and p-values are indicated.
Single-sample gene set enrichment analysis (ssGSEA) was performed using the GSVA package (v1.44.0) with curated immune-related gene sets from the MSigDB database (v7.5.1). Each gene set’s enrichment score reflects the normalized difference in empirical cumulative distribution functions (ECDFs) between genes in the gene set and the remaining genes in the sample. This analysis revealed upregulation of the MSP-RON signaling pathway and the Hinata NF-κB–associated immune inflammation signature in the grade 4 region. In contrast, WNT LRP6 and IL-17 signaling pathways were downregulated (Figure 3C). The IL-21 Up V1 gene set, associated with T follicular helper (Tfh) cell activation, also showed enrichment in grade 4 (Figure 3D). Additionally, gene ontology (GO) enrichment analysis was conducted using the clusterProfiler package (v4.6.0). Genes upregulated in grade 4 versus grade 2 (n = 3,362, fold change >1.5, p < 0.05) were tested for over-representation in GO biological process and molecular function categories. P-values were calculated using the hypergeometric test and adjusted using the Benjamini–Hochberg false discovery rate (FDR) method. Significantly enriched terms (adjusted p < 0.05) included acute inflammatory response, neuropeptide signaling, and regulation of coagulation (Supplementary Figure S1). All results are exploratory due to the single-patient design and require validation in larger cohorts.
Immune profiling based on deconvoluted RNA expression indicated an increase in activated mast cells (from 3.9% to 6.9% in grade 4), with concomitant decreases in resting CD4+ memory cells and CD8+ T-cell infiltration (Figure 4A). T-cell receptor (TCR) sequencing revealed 1,926 unique clonotypes in peripheral blood, with only 42 (2.13%) detected in either tumor region (Figure 4B). The Shannon diversity index was higher in grade 4 (3.76) than in grade 2 (3.01), while clonality declined (0.50 in grade 2 vs. 0.36 in grade 4), suggesting increased TCR diversity potentially reflecting neoantigen emergence. Fifteen TCR clonotypes were shared between grade 2 and grade 4, all of which showed reduced frequencies in grade 4, consistent with diversification (Figure 4C).
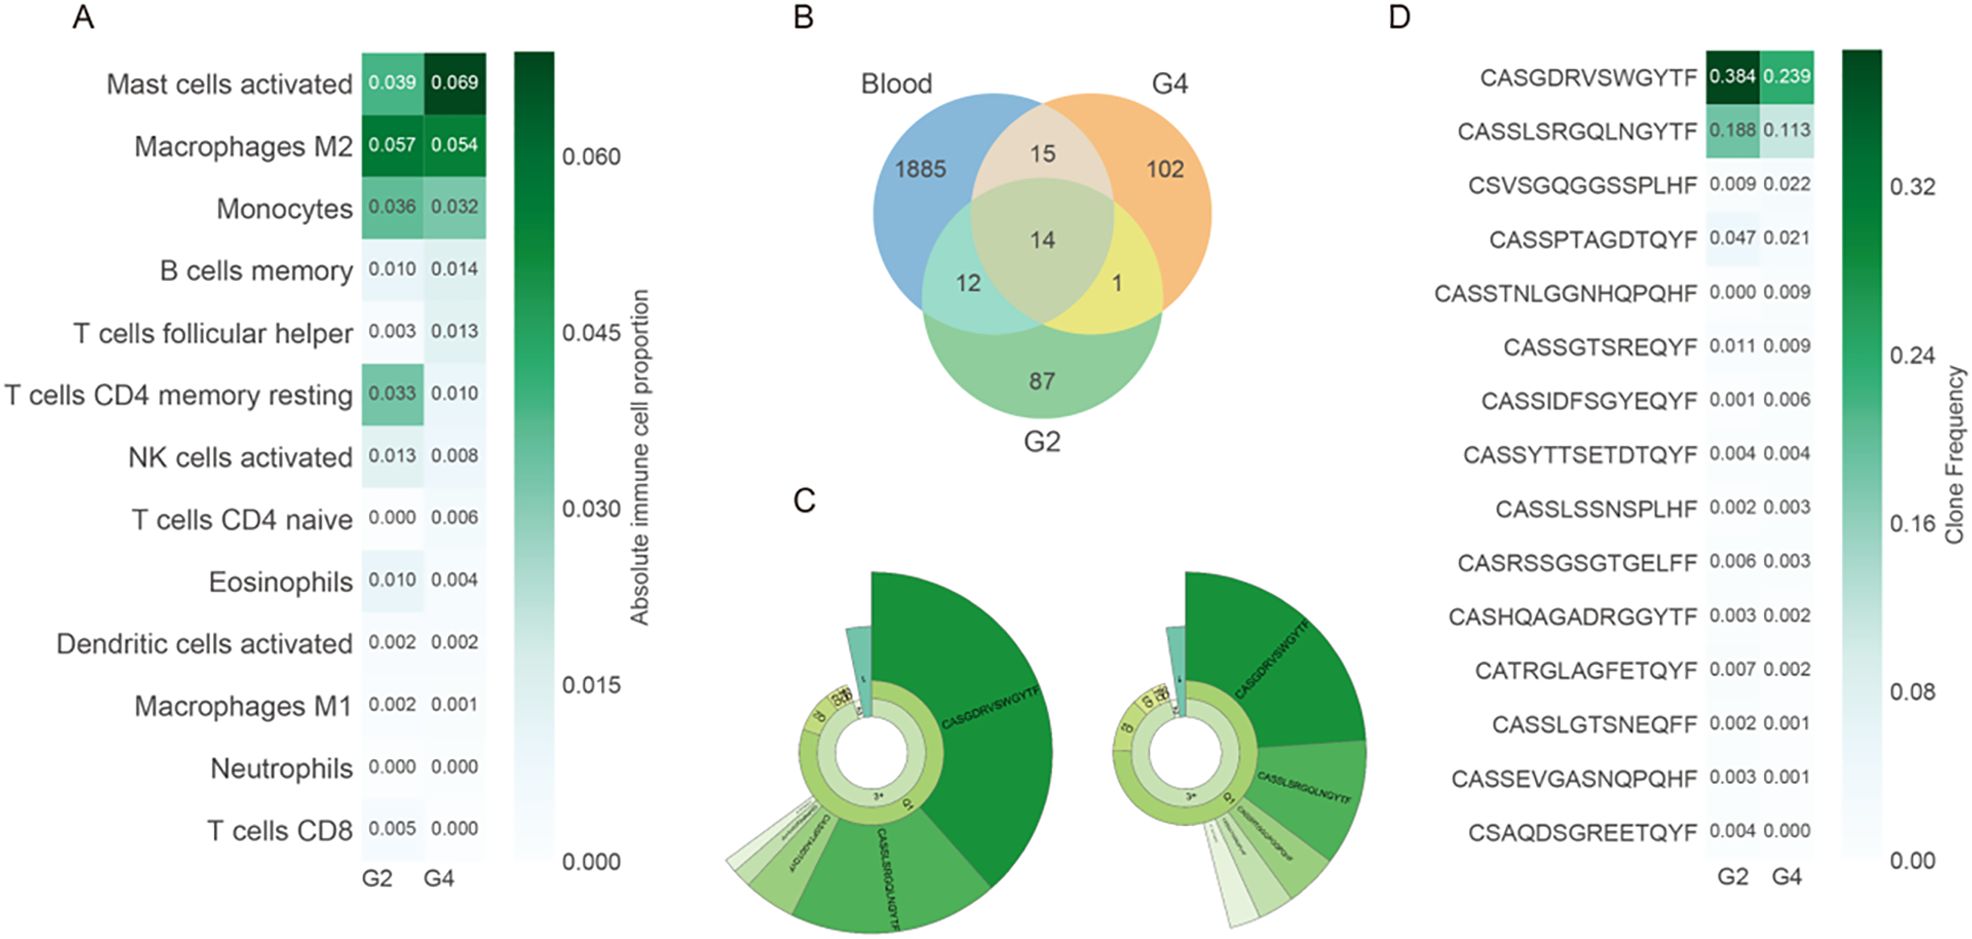
Figure 4. Immune microenvironment alterations during tumor progression. (A) Estimated absolute proportions of 13 immune cell types in G2 and G4 tumors using CIBERSORTx based on bulk RNA-seq data. Cell types are ordered by mean abundance. (B) Venn diagram showing the shared and unique T-cell receptor (TCR) clonotypes between G2, G4, and peripheral blood. (C) Donut chart representing clonal expansion in G2 and G4. The fan-shaped area indicates the clonal frequency. The radians of 1, 2, and 3+ represent the total frequency of TCR sequences with 1, 2, and 3 or more reads, respectively. The top 5 complementary determination region 3 (CDR3) amino acid sequences of TCR clones are displayed, with larger radians indicating higher clone frequencies. (D) Clone frequencies of the 15 shared clonotypes between G2 and G4. The greener colors represent higher clone frequencies. All immune cell and clonotype comparisons are descriptive and exploratory. Statistical testing was not performed due to the single-patient nature of this study.
Two clonotypes with the highest clone frequency, CASGDRVSWGYTF and CASSLSRGQLNGYTF, were present in grade 2, grade 4, and peripheral blood (Figures 4C, D), indicating clone persistence and expansion. VDJdb alignment identified four TCR clonotypes with known viral specificities: three against cytomegalovirus (CMV) and one against Epstein–Barr virus (EBV), the latter comprising 1.44% of the grade 4 repertoire (Supplementary Table S1). All results are descriptive and exploratory, and no formal statistical significance testing was conducted due to the single-patient design. These findings provide preliminary insights into the genomic evolution, immune remodeling, and pathway alterations associated with untreated progression from grade 2 to grade 4 astrocytoma.
Discussion
We report a case of a 67-year-old woman who carried an astrocytoma, IDH-mutant, CNS WHO grade 2, for over eight years without any surgical or pharmacologic intervention. This case is notable for the development of a spatially adjacent astrocytoma, IDH-mutant, CNS WHO grade 4, providing a rare opportunity to investigate the natural, untreated progression of IDH-mutant astrocytoma. Phylogenetic and molecular analyses confirmed that both tumor regions shared a common clonal origin, supporting the conclusion that the grade 4 astrocytoma evolved from the original grade 2 lesion.
The acquisition of additional mutations, including CIC, coincided with malignant progression and clonal expansion. Previous studies have implicated CIC alterations and activation of the RTK–RAS–PI3K pathway in recurrent high-grade gliomas (11, 12). One study has shown that 68% of recurrent glioma cases exhibited alterations in the RAS–ERK and PI3K–AKT pathways, often associated with treatment exposure (12). Our case supports the notion that RTK-RAS-PI3K pathway activation may also drive progression in untreated tumors. Notably, we observed enhanced inflammatory signaling and suppressed adaptive immunity accompanying progression. Compared to IDH wild-type lower-grade gliomas, IDH-mutant gliomas are associated with reduced expression of genes related to cytotoxic T cells and IFN-γ–inducible chemokines (13–15). In our case, hyperexpanded TCR clonotypes were detected. Although such expansions may reflect antigen-driven responses, three of the four dominant clonotypes matched viral epitopes (CMV, EBV), suggesting they may not be tumor-specific. Therefore, their relevance for immunotherapy remains uncertain in the absence of functional validation. Mohme et al. have found that dominant TCR clonotypes occupied substantial proportions of tumor-infiltrating lymphocytes in recurrent high-grade gliomas, with some clonotypes exceeding 15% frequency (16). In our case, the top two clonotypes reached 38% and 19% in grade 2 and 24% and 11% in grade 4, respectively. This may reflect prolonged tumor antigen exposure in a long-term tumor carrier. While the increased recruitment of mast cells and M2 macrophages during grade 4 progression is intriguing, this single-patient case is insufficient to establish causality or statistical significance. Observations regarding immune suppression, clonal evolution, and pathway involvement, such as MSP-RON and NF-κB signaling, should be considered hypothesis-generating. Larger cohorts with statistical modeling and mechanistic validation are needed.
Additionally, the absence of matched normal tissue limits our ability to distinguish somatic from germline variants. For example, the BRCA2 (M3217V) may represent a germline variant misclassified as somatic. While we cannot exclude this, the relatively high mutant allele frequency and localization within functional domains suggest potential biological relevance. Previous studies have reported both somatic and germline BRCA2 alterations in glioma, implicating this gene in DNA repair dysregulation (17). Nevertheless, in the absence of germline controls, mutational interpretations remain preliminary and require validation in future cohort studies. Furthermore, the absence of matched normal tissue may contribute to the elevated number of mutations detected in both tumor regions. Future studies incorporating normal-tissue controls and larger cohorts are essential to reliably distinguish somatic mutations and assess the significant immune cell dynamics in astrocytoma progression.
While our study used MRI for anatomical localization and clinical assessment, recent studies have applied radiomics-based analysis of MRI features to enhance glioma stratification. For example, a transfer learning–based model trained on MRI data from patients with astrocytoma, IDH–wildtype, CNS WHO grade 4, showed prognostic utility in IDH-mutant lower-grade gliomas (18). Additionally, XGBoost-based radiomics models have accurately predicted 1p/19q codeletion status in astrocytoma, IDH-mutant, and oligodendroglioma cases (19). These approaches highlight the complementary role of quantitative imaging in supporting non-invasive glioma classification alongside molecular profiling.
Conclusion
This case illustrates the untreated clinical progression of an IDH-mutant grade 2 astrocytoma into a grade 4 astrocytoma in the absence of therapeutic intervention. Molecular profiling confirmed a shared clonal origin, with CIC and BRCA2 mutations potentially contributing to malignant progression. Mutations in IDH, TP53, and ATRX were observed in both regions, supporting their role in early gliomagenesis. The grade 4 lesion exhibited enhanced inflammatory signals, reduced T-cell infiltration, and hyperexpanded TCR clonotypes, which may have implications for immune surveillance and potential immunotherapy. Although limited by its single-patient design, this case provides valuable insight into untreated glioma evolution and highlights candidate mechanisms that warrant validation in larger cohorts.
Data availability statement
The original contributions presented in the study are included in the article/Supplementary Material. Further inquiries can be directed to the corresponding author.
Ethics statement
The studies involving humans were approved by ethics committee of the First Affiliated Hospital of the PLA Army Military Medical University. The studies were conducted in accordance with the local legislation and institutional requirements. The participants provided their written informed consent to participate in this study.
Author contributions
XT: Conceptualization, Data curation, Investigation, Methodology, Writing – original draft, Writing – review & editing. WW: Conceptualization, Formal Analysis, Writing – review & editing. YH: Conceptualization, Formal Analysis, Writing – review & editing. YZ: Data curation, Formal Analysis, Investigation, Methodology, Writing – original draft, Writing – review & editing. YX: Data curation, Formal Analysis, Investigation, Methodology, Writing – original draft, Writing – review & editing. FL: Conceptualization, Data curation, Investigation, Methodology, Writing – original draft, Writing – review & editing.
Funding
The author(s) declare financial support was received for the research and/or publication of this article. This study was supported by a grant from the Chongqing Natural Science Foundation (Project Title: “Targeting FANCM to induce synthetic lethality in ATRX-deficient gliomas: mechanisms and therapeutic potential”; Project No. CSTB2023NSCQ-MSX0674). This research did not receive any specific grant from funding agencies in the public, commercial, or not-for-profit sectors.
Conflict of interest
The authors declare that the research was conducted in the absence of any commercial or financial relationships that could be construed as a potential conflict of interest.
Generative AI statement
The author(s) declare that no Generative AI was used in the creation of this manuscript.
Any alternative text (alt text) provided alongside figures in this article has been generated by Frontiers with the support of artificial intelligence and reasonable efforts have been made to ensure accuracy, including review by the authors wherever possible. If you identify any issues, please contact us.
Publisher’s note
All claims expressed in this article are solely those of the authors and do not necessarily represent those of their affiliated organizations, or those of the publisher, the editors and the reviewers. Any product that may be evaluated in this article, or claim that may be made by its manufacturer, is not guaranteed or endorsed by the publisher.
Supplementary material
The Supplementary Material for this article can be found online at: https://www.frontiersin.org/articles/10.3389/fonc.2025.1557245/full#supplementary-material
Supplementary Figure 1 | GO enrichment analysis of differentially expressed genes in grade 4 vs. grade 2 astrocytoma. Gene Ontology (GO) enrichment analysis was performed on differentially expressed genes (DEGs) between the grade 4 and grade 2 astrocytoma regions. Upregulated genes (n = 3,362; fold change > 1.5; p < 0.05) and downregulated genes were analyzed separately using the clusterProfiler R package. Enrichment was conducted for Biological Process (BP) and Molecular Function (MF) categories. P-values were calculated using a hypergeometric test and adjusted using the Benjamini–Hochberg false discovery rate (FDR) method. Dot size represents the number of DEGs per GO term, and color indicates the adjusted p-value.
References
1. Chen X, Cui Y, and Zou L. Treatment advances in high-grade gliomas. Front Oncol. (2024) 14:1287725. doi: 10.3389/fonc.2024.1287725
2. Barzegar Behrooz A, Talaie Z, Jusheghani F, Łos MJ, Klonisch T, and Ghavami S. Wnt and PI3K/Akt/mTOR survival pathways as therapeutic targets in glioblastoma. Int J Mol Sci. (2022) 23:1353. doi: 10.3390/ijms23031353
3. Luo J, Liu P, Lu C, Bian W, Su D, Zhu C, et al. Stepwise crosstalk between aberrant Nf1, Tp53 and Rb signalling pathways induces gliomagenesis in zebrafish. Brain. (2021) 144:615–35. doi: 10.1093/brain/awaa404
4. Johnson BE, Mazor T, Hong C, Barnes M, Aihara K, McLean CY, et al. Mutational analysis reveals the origin and therapy-driven evolution of recurrent glioma. Science. (2014) 343:189–93. doi: 10.1126/science.1239947
5. Gousias K, Theocharous T, and Simon M. Mechanisms of cell cycle arrest and apoptosis in glioblastoma. Biomedicines. (2022) 10:564. doi: 10.3390/biomedicines10030564
6. Weng J and Salazar N. DNA methylation analysis identifies patterns in progressive glioma grades to predict patient survival. Int J Mol Sci. (2021) 22:1020. doi: 10.3390/ijms22031020
7. Zhang K-N, Zhao Z, Chen J, Bao Z, Chai R-C, Sun Z, et al. MET fusions and splicing variants convergently define a subgroup of glioma sensitive to MET inhibitors. Holistic Integr Oncol. (2022) 1:18. doi: 10.1007/s44178-022-00014-9
8. Komori T. Grading of adult diffuse gliomas according to the 2021 WHO Classification of Tumors of the Central Nervous System. Lab Invest. (2022) 102:126–33. doi: 10.1038/s41374-021-00667-6
9. Verhaak RG, Hoadley KA, Purdom E, Wang V, Qi Y, Wilkerson MD, et al. Integrated genomic analysis identifies clinically relevant subtypes of glioblastoma characterized by abnormalities in PDGFRA, IDH1, EGFR, and NF1. Cancer Cell. (2010) 17:98–110. doi: 10.1016/j.ccr.2009.12.020
10. Paweł K and Maria Małgorzata S. CpG island methylator phenotype—a hope for the future or a road to nowhere? Int J Mol Sci. (2022) 23:830. doi: 10.3390/ijms23020830
11. Zhang L, Giuste F, Vizcarra JC, Li X, and Gutman D. Radiomics features predict CIC mutation status in lower grade glioma. Front Oncol. (2020) 10:937. doi: 10.3389/fonc.2020.00937
12. Bai H, Harmancı AS, Erson-Omay EZ, Li J, Coşkun S, Simon M, et al. Integrated genomic characterization of IDH1-mutant glioma Malignant progression. Nat Genet. (2016) 48:59–66. doi: 10.1038/ng.3457
13. Kohanbash G, Carrera DA, Shrivastav S, Ahn BJ, Jahan N, Mazor T, et al. Isocitrate dehydrogenase mutations suppress STAT1 and CD8+ T cell accumulation in gliomas. J Clin Invest. (2017) 127:1425–37. doi: 10.1172/JCI90644
14. Xiao G, Gao X, Li L, Liu C, Liu Z, Peng H, et al. An immune-related prognostic signature for predicting clinical outcomes and immune landscape in IDH-mutant lower-grade gliomas. J Oncol. (2021) 2021:3766685. doi: 10.1155/2021/3766685
15. Tang F, Pan Z, Wang Y, Lan T, Wang M, Li F, et al. Advances in the immunotherapeutic potential of isocitrate dehydrogenase mutations in glioma. Neurosci Bull. (2022) 38:1069–84. doi: 10.1007/s12264-022-00866-1
16. Mohme M, Schliffke S, Maire CL, Rünger A, Glau L, Mende KC, et al. Immunophenotyping of newly diagnosed and recurrent glioblastoma defines distinct immune exhaustion profiles in peripheral and tumor-infiltrating lymphocytes. Clin Cancer Res. (2018) 24:4187–200. doi: 10.1158/1078-0432.CCR-17-2617
17. Meimand SE, Pour-Rashidi A, Shahrbabak MM, Mohammadi E, Meimand FE, and Rezaei N. The prognostication potential of BRCA genes expression in gliomas: a genetic survival analysis study. World Neurosurg. (2022) 157:e123–8. doi: 10.1016/j.wneu.2021.09.107
18. Le VH, Minh TNT, Kha QH, and Le NQK. A transfer learning approach on MRI-based radiomics signature for overall survival prediction of low-grade and high-grade gliomas. Med Biol Eng Computing. (2023) 61:2699–712. doi: 10.1007/s11517-023-02875-2
Keywords: disease progression, glioma, astrocytoma, grade 4, isocitrate dehydrogenase, tumor-infiltrating lymphocytes, case reports
Citation: Tang X, Wei W, Huang Y, Zheng Y, Xu Y and Li F (2025) A case report on IDH-mutant astrocytoma, CNS WHO grade 4: multi-omic characterization of untreated clinical progression. Front. Oncol. 15:1557245. doi: 10.3389/fonc.2025.1557245
Received: 08 January 2025; Accepted: 22 August 2025;
Published: 26 September 2025.
Edited by:
Roman Sankowski, University of Freiburg Medical Center, GermanyReviewed by:
Nguyen Quoc Khanh Le, Taipei Medical University, TaiwanDanielle F. Miyagishima, Yale University, United States
Copyright © 2025 Tang, Wei, Huang, Zheng, Xu and Li. This is an open-access article distributed under the terms of the Creative Commons Attribution License (CC BY). The use, distribution or reproduction in other forums is permitted, provided the original author(s) and the copyright owner(s) are credited and that the original publication in this journal is cited, in accordance with accepted academic practice. No use, distribution or reproduction is permitted which does not comply with these terms.
*Correspondence: Fei Li, bGlmZWlAdG1tdS5lZHUuY24=