Abstract
Myeloid Leukemias (ML) are neoplastic disorders characterized by the abnormal production of myeloid blood cells and disrupted hematopoiesis. Limited research exists on regional and demographic trends in ML mortality. This study investigates ML mortality patterns in the U.S. from 1999 to 2022, focusing on geographic and demographic disparities using age-adjusted mortality rates (AAMR) and average annual percent change (AAPC). Data were obtained from the CDC WONDER database, with AAMRs calculated per 100,000 people and stratified by region, state, urbanicity, sex, and race. AAPCs were computed using the National Cancer Institute’s (NCI) Joinpoint Regression Program (Joinpoint V 4.9.0.0, NCI). Between 1999 and 2022, there were 299,221 ML-related deaths nationwide. While most U.S. regions showed a non-significant downward trend in mortality, the Midwest demonstrated a non-significant upward trend and consistently higher AAMRs. States with the highest AAMRs included Iowa, Kansas, Minnesota, and the Dakotas—predominantly rural states. Rural areas overall had higher AAMRs than urban areas. Males and White individuals had the highest mortality across all regions, with the Midwest showing the highest AAMRs for both sexes. Although ML mortality declined significantly from 1999 to 2007, it showed a non-significant increase from 2007 to 2022, despite therapeutic advancements. Persistent disparities—particularly among rural Midwestern populations, White patients, and males—highlight the need for targeted interventions and further research to address these geographic and demographic inequities.
Introduction
Myeloid Leukemias (ML) are neoplastic disorders that cause the production of abnormal myeloid blood cells and irregular hematopoiesis (1). Primarily divided into two major types, acute myeloid leukemia (AML) is more common than chronic myeloid leukemia (CML) (1). There are estimated to be 29,310 new cases of ML diagnosed in 2023, and 12,620 expected deaths in the U.S (2). This accounts for 15-20% of leukemias in the US (3). These clonal malignancies have had a relatively unchanged treatment regimen for the past 40 years, which consists of a combination of anthracyclines (3).
Previous studies have investigated various mortality trends in ML in the US (4, 5). However, these studies lacked a comprehensive analysis of geographic and regional variation. This study uses the Center for Disease Control and Prevention (CDC) WONDER database to comprehensively investigate differences in the age-adjusted mortality rates (AAMRs) for myeloid leukemias based on region, state, urban/rural residence, gender, and race in the U.S. from 1999-2022. With different primary affected age groups and clinical presentation, AML and CML diverge in epidemiological factors. Genetic and biological differences between AML and CML require them to have tailored treatment and management plans. However, when investigating overarching sociodemographic trends, we believe the combination of AML and CML into the extended category of ML provides more insight into cancer burden. This would contribute value in understanding the broader epidemiological trends and public health implications of ML. While there has been significant study of AML and CML, overarching ML trends have been studied and should be further explored in the literature (6). The (CDC) WONDER database allows the study of all subtypes of ML, and it is for these reasons our overall aim is to understand the trends and overall burden of ML on the healthcare system, as opposed to the individual subtypes of leukemia. By analyzing these trends, we aim to advocate for further database sharing and research on ML with the hope of enabling providers and healthcare officials to advance management plans and policies to address MLL disparities.
Methods
ML mortality was analyzed from 1999–2022 in the U.S. using the Centers for Disease Control and Prevention Wide-Ranging Online Data for Epidemiologic Research (CDC WONDER) database (7). CDC Wonder death certificate records and the Multiple Cause-of-Death Public Use Record were used to determine ML-related causes of death. Prior studies have used the CDC WONDER database to analyze ML mortality and its trends (5). The International Classification of Diseases, 10th Revision, Clinical Modification code C92 in patients one year or older was used to analyze ML-related mortality. The prevalence of ML in patients under one year of age was too low to include in the dataset. This study did not require Institutional Review Board approval because CDC WONDER is a publicly available database that contains anonymous data.
Data was extracted from 1999–2022 for ML-related deaths and population sizes. Demographic and regional group data, including gender, race/ethnicity, urban-rural classification, region, and states, were extracted. Racial/ethnicity groups were defined as White, Black, Asian/Pacific Islander, and Hispanic/Latino. Urban classifications were divided into large metropolitan areas (population ≥1 million), medium/small metropolitan areas (population 50,000 to 999,999), while rural had their classification (population <50,000), as per the 2013 United States census classification in the National Center for Health Statistics Urban-Rural Classification Scheme (8). Regions were separated into Northeast, Midwest, South, and West according to the Census Bureau definitions (9).
ML-related AAMRs were standardized using the 2000 U.S. standard population (10). The Joinpoint Regression Program (Joinpoint version 4.9.0.0 available from National Cancer Institute, Bethesda, Maryland) was used to determine mortality trends from 1999-2022 (11). Annual percent change (APC) and average annual percent change (AAPC) with 95% confidence intervals (CIs) for the AAMRs were calculated for the line segments linking a Joinpoint using the Monte Carlo permutation test. If the slope describing the change in mortality over time significantly differed from zero using a 2-tailed t-test, APC and AAPCs were considered increasing or decreasing. Statistical significance was set at p ≤0.05. Asterisks were used to denote significance.
Results
From 1999 to 2022, there were 299,221 deaths due to myeloid leukemia in the United States.
Overall age-adjusted mortality rates (AAMR) decreased during this period from 3.78 (95% CI 3.7 to 3.85) in 1999 to 3.71 (95% CI 3.65 to 3.77) in 2022 (Figure 1, Table 1). The annual percentage change (APC) showed a significant decrease at -0.66 (95% CI -2.80 to -0.07)* from 1999-2007, which increased to 0.14 (95% CI -0.06 to 1.15) from 2007-2022 (Figure 2). Overall, the AAMR was the lowest in 2015 and increased from 3.16 (95% CI 3.54 to 3.67) to 3.71 (95% CI 3.65 to 3.77) by 2022 (Figure 1).
Figure 1

Myeloid Leukemia cancer age-adjusted mortality rate per 100,000 people; overall and stratified by region, 1999-2022.
Table 1
| Year | Overall | Northeast | Midwest | South | West |
|---|---|---|---|---|---|
| 1999 | 3.78 | 3.65 | 4.09 | 3.60 | 3.86 |
| 2000 | 3.89 | 3.73 | 4.14 | 3.88 | 3.84 |
| 2001 | 3.93 | 3.76 | 4.13 | 3.91 | 3.84 |
| 2002 | 3.83 | 3.70 | 4.09 | 3.69 | 3.80 |
| 2003 | 3.76 | 3.61 | 4.12 | 3.69 | 3.69 |
| 2004 | 3.76 | 3.73 | 3.96 | 3.64 | 3.69 |
| 2005 | 3.65 | 3.55 | 4.02 | 3.52 | 3.64 |
| 2006 | 3.71 | 3.60 | 4.02 | 3.61 | 3.66 |
| 2007 | 3.63 | 3.45 | 4.13 | 3.41 | 3.67 |
| 2008 | 3.70 | 3.58 | 4.10 | 3.55 | 3.67 |
| 2009 | 3.76 | 3.75 | 4.15 | 3.53 | 3.76 |
| 2010 | 3.71 | 3.61 | 4.06 | 3.48 | 3.90 |
| 2011 | 3.76 | 3.74 | 4.11 | 3.57 | 3.73 |
| 2012 | 3.67 | 3.64 | 4.07 | 3.5 | 3.54 |
| 2013 | 3.66 | 3.53 | 4.05 | 3.41 | 3.86 |
| 2014 | 3.73 | 3.63 | 4.10 | 3.58 | 3.72 |
| 2015 | 3.61 | 3.64 | 3.99 | 3.45 | 3.51 |
| 2016 | 3.77 | 3.67 | 4.06 | 3.65 | 3.67 |
| 2017 | 3.75 | 3.68 | 4.24 | 3.59 | 3.65 |
| 2018 | 3.74 | 3.70 | 4.04 | 3.63 | 3.63 |
| 2019 | 3.70 | 3.67 | 4.04 | 3.56 | 3.57 |
| 2020 | 3.77 | 3.73 | 4.21 | 3.65 | 3.63 |
| 2021 | 3.82 | 3.56 | 4.21 | 3.68 | 3.91 |
| 2022 | 3.71 | 3.51 | 4.20 | 3.58 | 3.73 |
Myeloid Leukemia cancer age-adjusted mortality rate per 100,000 people; overall and stratified by region, 1999-2022.
Figure 2
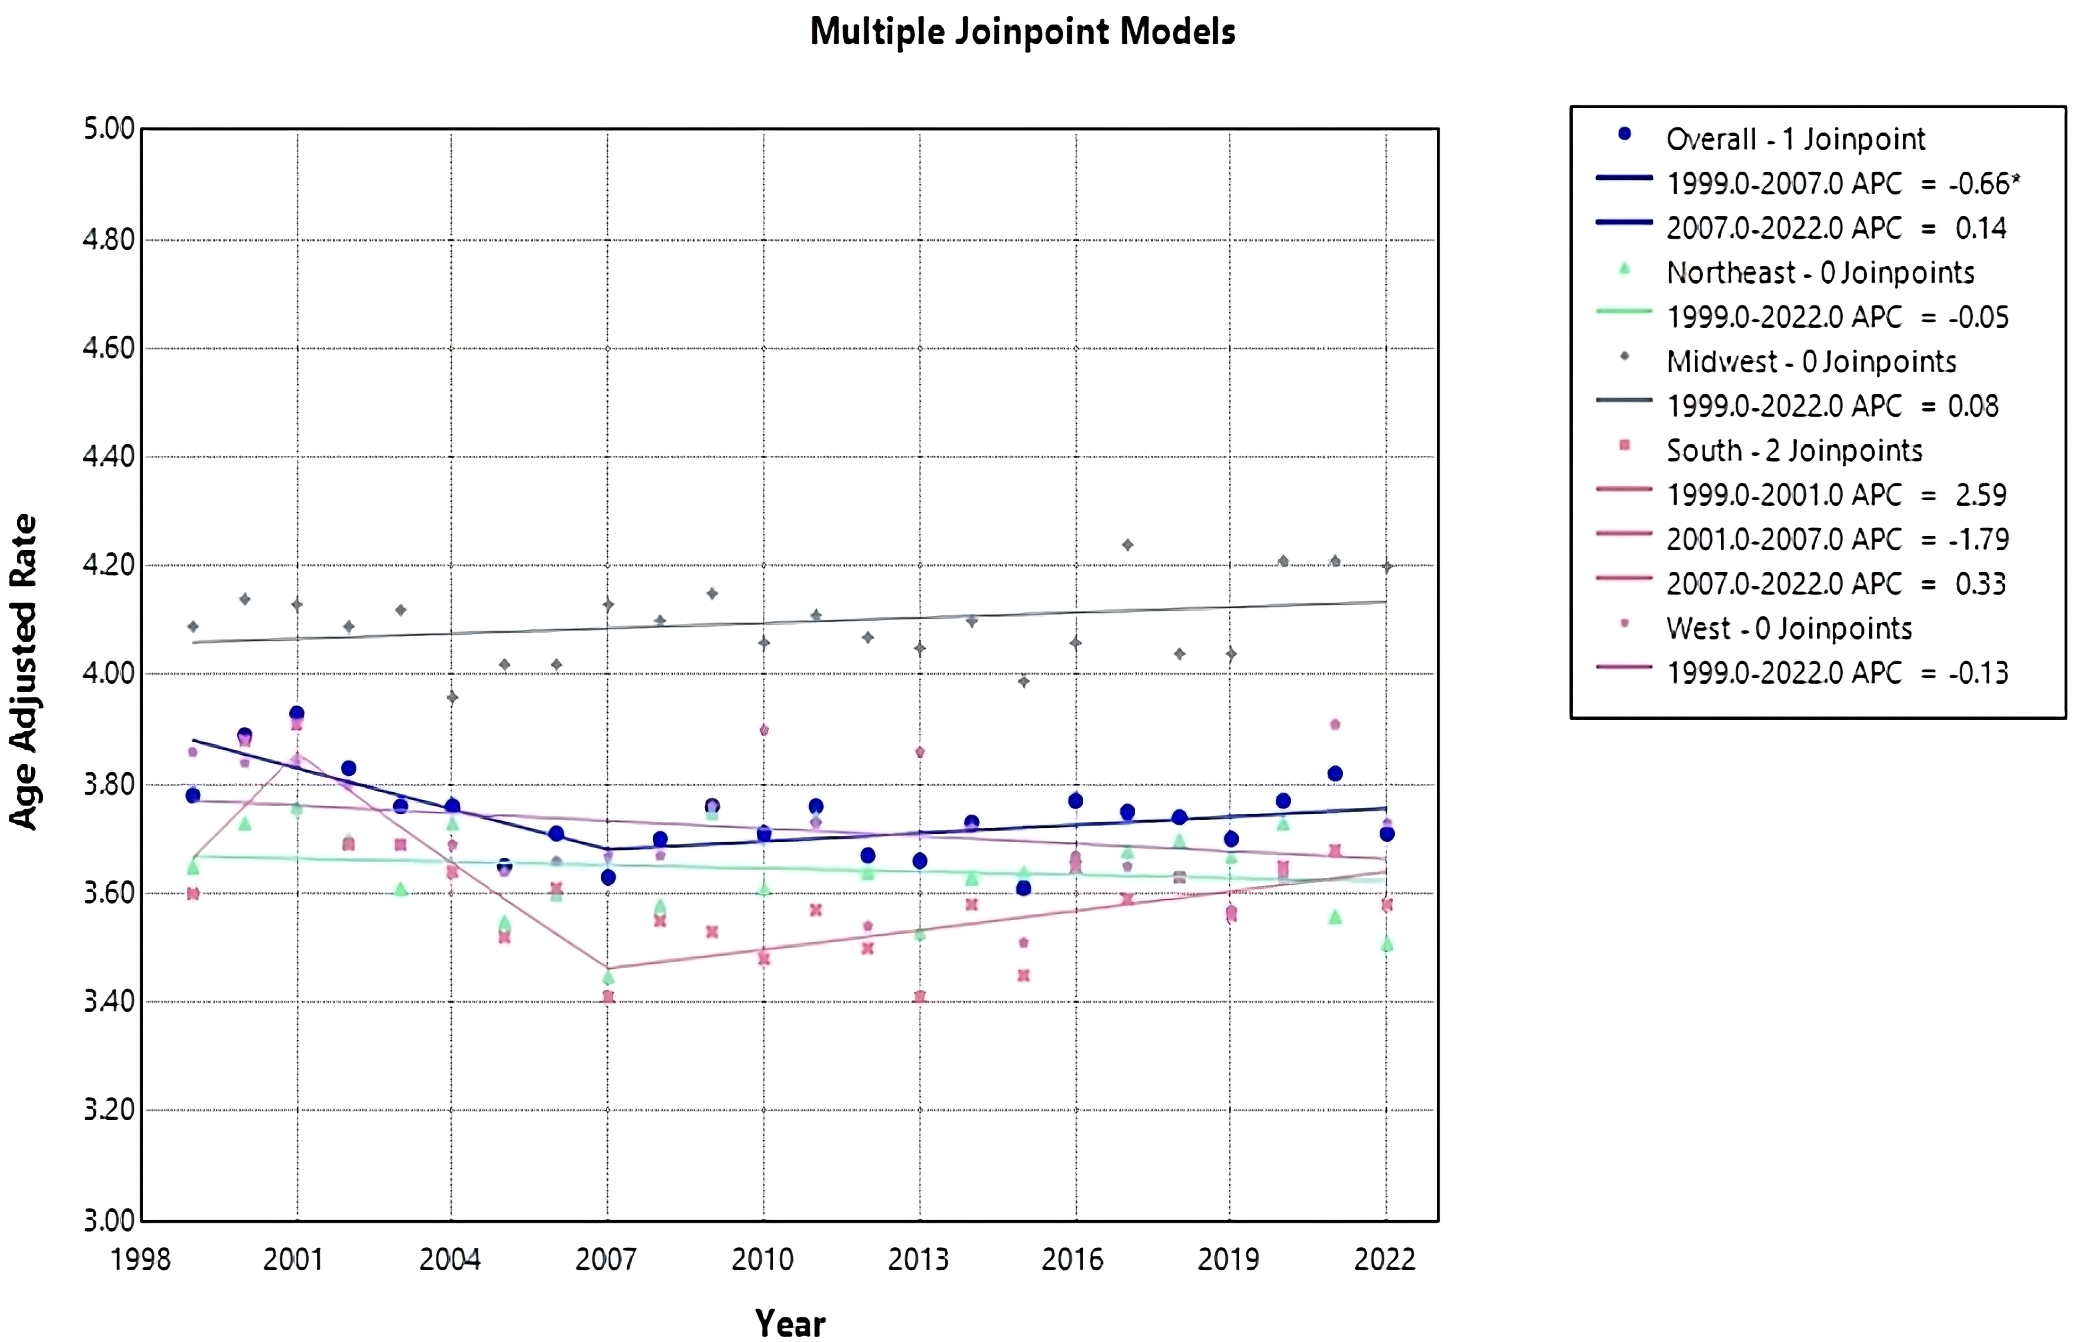
Joinpoint model of Myeloid Leukemia cancer-related AAMR per 100,000 people; overall and stratified by region, 1999-2022 (*indicates the APC is statistically significant).
Census regions
Each census region apart from the Midwest saw a decrease in AAMR from 1999-2022, with the Northeast having the largest reduction in AAMR from 3.65 (95% CI 3.49 to 3.81) in 1999 to 3.51 (95% CI 3.37 to 3.64) in 2022 (Table 1, Figure 1). The Northeast had a consistent AAPC and APC of 0.05 (95% CI -0.22 to 0.13) (Figure 2). The Midwest had an increase in AAMR from 4.09 (95% CI 3.93 to 4.24) in 1999 to 4.2 (95% CI 4.07 to 4.34) in 2022, with a consistent AAPC and APC of 0.08 (95% CI -0.06 to 0.22) (Table 1, Figures 1, 2). The South had a decrease in AAMR from 3.6 (95% CI 3.48 to 3.72) in 1999 to 3.58 (95% CI 3.48 to 3.67) in 2022 (Table 1, Figure 1). From 1999-2001, the South had an APC of 2.6 (95% CI -1.41 to 7.28), in 2001–2007 the APC became -1.79 (95% CI -4.26 to 2.34), and from 2007–2022 the APC became 0.33 (95% CI -2.22 to 1.29) (Figure 2). The West had a decrease in AAMR from 3.86 (95% CI 3.70 to 4.02) in 1999 to 3.73 (95% CI 3.61 to 3.86) in 2022, with a consistent AAPC and APC of -0.13 (95% CI -0.32 to 0.09) (Table 1, Figures 1, 2). From 1999-2022, the AAMR was highest in the Midwest at 4.24 (95% CI 4.09 to 4.38), followed by the South at 3.91 (95% CI 3.78 to 4.03), the West at 3.91 (95% CI 3.78 to 4.05), and the Northeast at 3.76 (95% CI 3.60 to 3.91) (Table 1, Figure 1). None of the regions saw a significant change in AAMR over time.
State-level difference
The Average AAMR for the duration of the study period varied widely from 2.61 (95% CI 1.89 to 3.51) in Nevada to 5.38 (95% CI 4.07 to 6.99) in South Dakota (Table 2). States with an AAMR greater than the 90th percentile included Iowa, Kansas, Minnesota, North Dakota, and South Dakota. Conversely, states with an AAMR less than the 10th percentile included Connecticut, Hawaii, Nevada, New Mexico, and Wyoming (Table 2).
Table 2
| State | 1999 | 2019 | 2020 | 2022 |
|---|---|---|---|---|
| Alabama | 2.97 | 2.79 | 3.79 | 3.29 |
| Alaska | * | 3.48 | 2.95 | * |
| Arizona | 3.09 | 3.11 | 3.41 | 3.39 |
| Arkansas | 3.31 | 3.62 | 3.06 | 2.99 |
| California | 3.77 | 3.49 | 3.54 | 3.67 |
| Colorado | 4.29 | 3.59 | 3.70 | 4.11 |
| Connecticut | 2.86 | 4.09 | 3.62 | 3.43 |
| Delaware | 4.01 | 4.19 | 3.61 | 3.81 |
| District of Columbia | * | * | 3.63 | 3.66 |
| Florida | 3.91 | 3.56 | 3.74 | 3.64 |
| Georgia | 3.42 | 3.07 | 3.19 | 3.20 |
| Hawaii | 3.33 | 2.65 | 3.82 | 4.04 |
| Idaho | 3.70 | 3.77 | 4.35 | 4.00 |
| Illinois | 3.93 | 3.65 | 3.91 | 3.60 |
| Indiana | 3.75 | 4.07 | 3.66 | 4.23 |
| Iowa | 5.26 | 4.20 | 4.29 | 4.27 |
| Kansas | 3.90 | 4.60 | 5.24 | 4.05 |
| Kentucky | 3.60 | 4.34 | 4.89 | 4.22 |
| Louisiana | 4.43 | 3.28 | 3.36 | 3.32 |
| Maine | 2.99 | 4.17 | 3.97 | 3.85 |
| Maryland | 3.25 | 3.93 | 3.35 | 3.65 |
| Massachusetts | 3.64 | 3.46 | 3.56 | 3.29 |
| Michigan | 3.47 | 3.98 | 4.20 | 4.10 |
| Minnesota | 4.66 | 4.35 | 4.66 | 5.12 |
| Mississippi | 3.25 | 3.36 | 3.49 | 3.54 |
| Missouri | 4.42 | 3.46 | 3.47 | 3.64 |
| Montana | 4.95 | 3.47 | 3.16 | 3.47 |
| Nebraska | 4.25 | 4.80 | 4.27 | 3.66 |
| Nevada | 2.61 | 3.67 | 3.09 | 2.92 |
| New Hampshire | 3.85 | 4.14 | 3.42 | 3.69 |
| New Jersey | 3.54 | 3.24 | 3.71 | 3.28 |
| New Mexico | 3.33 | 2.94 | 3.03 | 2.73 |
| New York | 3.85 | 3.59 | 3.54 | 3.33 |
| North Carolina | 3.63 | 3.91 | 3.77 | 3.93 |
| North Dakota | 4.64 | 3.82 | 5.17 | 3.68 |
| Ohio | 3.90 | 4.09 | 4.43 | 4.32 |
| Oklahoma | 3.88 | 4.26 | 4.11 | 3.53 |
| Oregon | 3.56 | 4.26 | 4.18 | 4.66 |
| Pennsylvania | 3.68 | 3.94 | 4.06 | 3.99 |
| Rhode Island | 3.50 | 4.29 | 3.69 | 3.61 |
| South Carolina | 3.48 | 3.73 | 4.08 | 3.77 |
| South Dakota | 4.89 | 4.47 | 4.00 | 5.38 |
| Tennessee | 3.65 | 3.58 | 3.73 | 4.03 |
| Texas | 3.43 | 3.45 | 3.45 | 3.28 |
| Utah | 4.46 | 3.87 | 3.64 | 3.81 |
| Vermont | 3.41 | 3.58 | 4.96 | 3.39 |
| Virginia | 3.41 | 3.55 | 3.53 | 3.66 |
| Washington | 5.03 | 4.13 | 4.05 | 4.18 |
| West Virginia | 3.98 | 3.98 | 4.51 | 4.06 |
| Wisconsin | 4.58 | 4.46 | 4.92 | 5.01 |
| Wyoming | 4.91 | 4.82 | 4.47 | 2.86 |
Myeloid Leukemia cancer age-adjusted mortality rate per 100,000 people; stratified by state, 1999, 2019-2022.
(* indicates unreliable data).
Connecticut had the largest increase in AAMR from 1999 to 2019, followed by Maine and Nevada (Table 2, Figure 3). Conversely, Montana had the largest decrease, followed by Louisiana and Iowa (Table 2, Figure 3).
Figure 3

Map of Myeloid Leukemia cancer age-adjusted mortality rate per 100,000 people; stratified by state, Alaska and the District of Columbia had unreliable data. (A) 1999 vs 2019. (B) 2019 vs 2022.
The states with the largest increase in AAMR from 2019–2022 included Hawaii, followed by South Dakota and Minnesota (Table 2, Figure 3). Conversely, the state with the largest decrease in AAMR from 2019–2022 included Wyoming, followed by Nebraska and Nevada (Table 2, Figure 3). Alaska and the District of Columbia had unreliable data.
Rural v. urban
Across populated regions, AAMRs were persistently higher in rural areas as compared to small, medium, and large urban centers. Rural regions had a range of AAMRs from 3.80 (95% CI 3.63 to 3.98) in 1999 to 3.95 (95% CI 3.80 to 4.11) in 2020 (Table 3, Figure 4). In the rural regions from 1999-2011, there was a significant decrease in the APC of -0.51 (95% CI -1.23 to -0.19)* (Figure 5). Conversely, in the rural regions from 2011-2020, there was a significant increase in the APC of 0.73 (95% CI 0.27 to 1.81)* (Figure 5).
Table 3
| Year | Urban | Rural |
|---|---|---|
| 1999 | 3.77 | 3.80 |
| 2000 | 3.86 | 4.08 |
| 2001 | 3.94 | 3.96 |
| 2002 | 3.81 | 3.88 |
| 2003 | 3.76 | 3.84 |
| 2004 | 3.76 | 3.68 |
| 2005 | 3.64 | 3.81 |
| 2006 | 3.70 | 3.74 |
| 2007 | 3.61 | 3.77 |
| 2008 | 3.72 | 3.78 |
| 2009 | 3.79 | 3.76 |
| 2010 | 3.72 | 3.74 |
| 2011 | 3.78 | 3.66 |
| 2012 | 3.66 | 3.71 |
| 2013 | 3.67 | 3.75 |
| 2014 | 3.71 | 3.91 |
| 2015 | 3.60 | 3.70 |
| 2016 | 3.73 | 3.87 |
| 2017 | 3.72 | 3.88 |
| 2018 | 3.71 | 3.79 |
| 2019 | 3.63 | 3.95 |
| 2020 | 3.74 | 3.95 |
Myeloid Leukemia cancer age-adjusted mortality rate per 100,000 people; stratified by urban vs rural, 1999-2020.
Figure 4
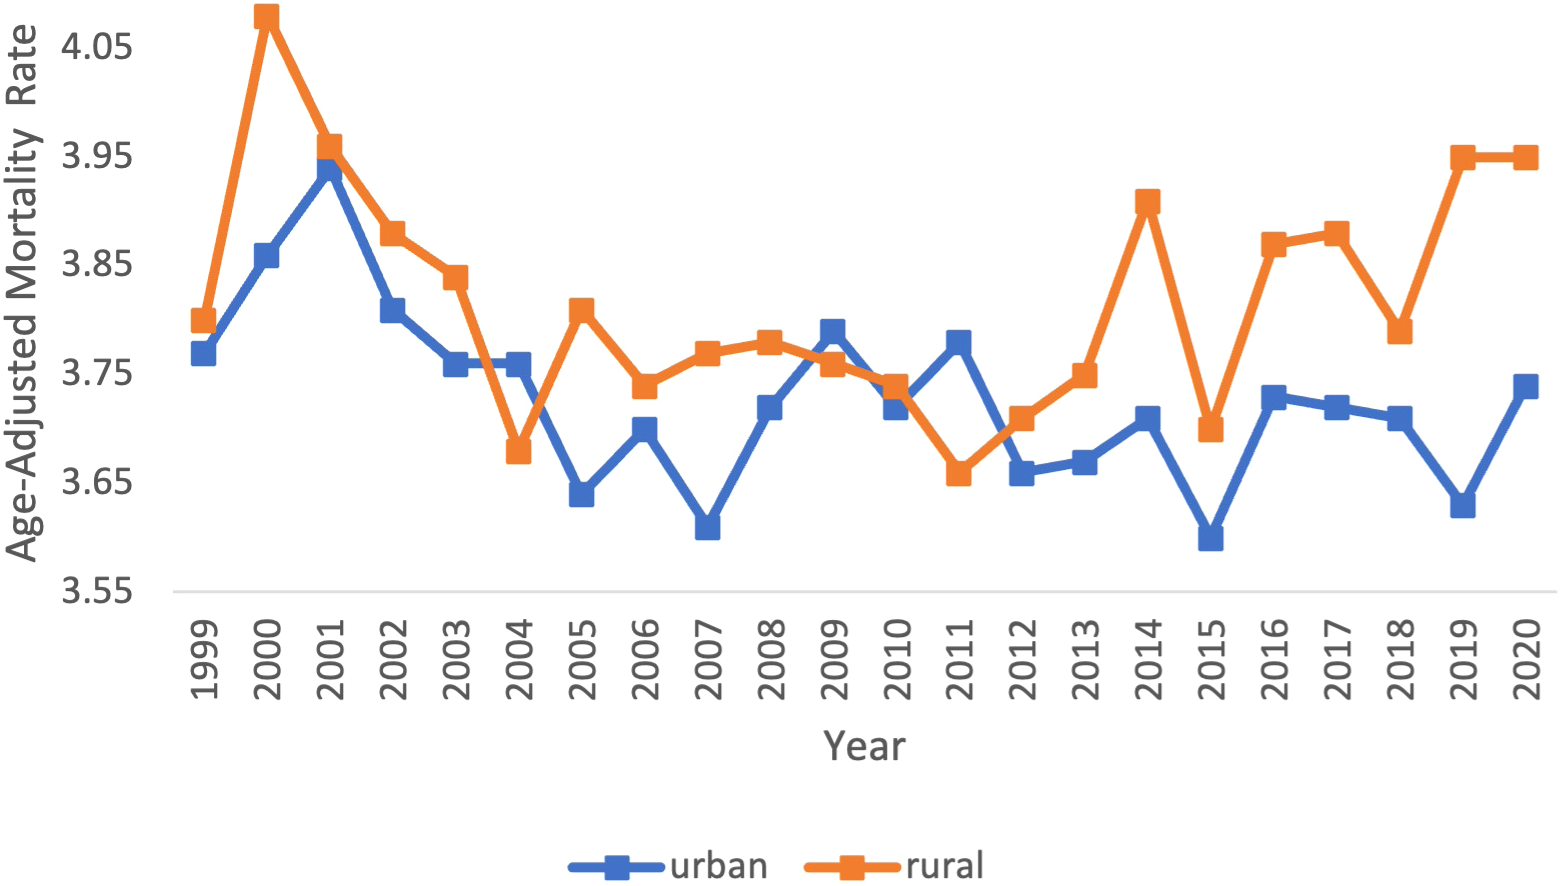
Myeloid Leukemia cancer age-adjusted mortality rate per 100,000 people; stratified by urban vs rural, 1999-2020.
Figure 5

Joinpoint model of Myeloid Leukemia cancer-related AAMR per 100,000 people; overall and stratified by urban vs rural, 1999-2020 (*indicates the APC is statistically significant).
Urban regions had a range of AAMRs from 3.77 (95% CI 3.68 to 3.85) in 1999 to 3.74 (95% CI 3.67 to 3.81) in 2020 (Table 3, Figure 4). In the urban regions from 1999 to 2020, there was a significant decrease in the APC and AAPC, of which both values were -0.16 (95% CI -0.29 to -0.01)* (Figure 5).
Region and gender
From 1999 to 2022, ML resulted in 158,472 (56.73%) deaths in males and 120,883 (43.27%) in females in the United States. During this period, males consistently had the highest AAMR overall and across each census region (Figure 6). Males had the highest rate in 2020 in the Midwest, at 5.61 (95% CI 5.37 to 5.85) (Figure 6, Table 4). The lowest AAMR for males was in 2007 and 2022 in the South and Northeast, respectively, both at 4.51 (95% CI 4.32 to 4.71, South) and (95% CI 4.28 to 4.74, Northeast) (Figure 6, Table 4). In females, the highest AAMR was in 2000 in the Midwest, at 3.36 (95% CI 3.18 to 3.55) (Figure 6, Table 4). The lowest AAMR for females was in 2013 in the South, at 2.54 (95% CI 2.42 to 2.66) (Figure 6, Table 4). For males in the Northeast region, the APC in AAMR was significant at 0.17 (95% CI 0.01 to 0.84)* from 1999-2020, which then significantly decelerated to -4.25 (95% CI -7.22 to -0.18)* from 2020-2022 (Figure 7). Northeast females saw a significant decrease in APC of -0.32 (95% CI -0.53 to -0.11)* (Figure 7). Males in the Midwest did not see a significant difference in APC over time (Figure 7). Midwestern females had a significant decrease in APC of -0.35 (95% CI -1.20 to -0.11)* from 1999 to 2018 (Figure 7). Males in the South did not see a significant difference in APC over time (Figure 7). For females in the South, the APC from 1999 to 2009 significantly decreased at -1.25 (95% CI -2.98 to -0.56)*, which then significantly increased to 0.48 from 2009 to 2022 (95% CI 0.05 to 1.54)* (Figure 7). Neither males nor females in the West saw a significant APC over time (Figure 7).
Figure 6
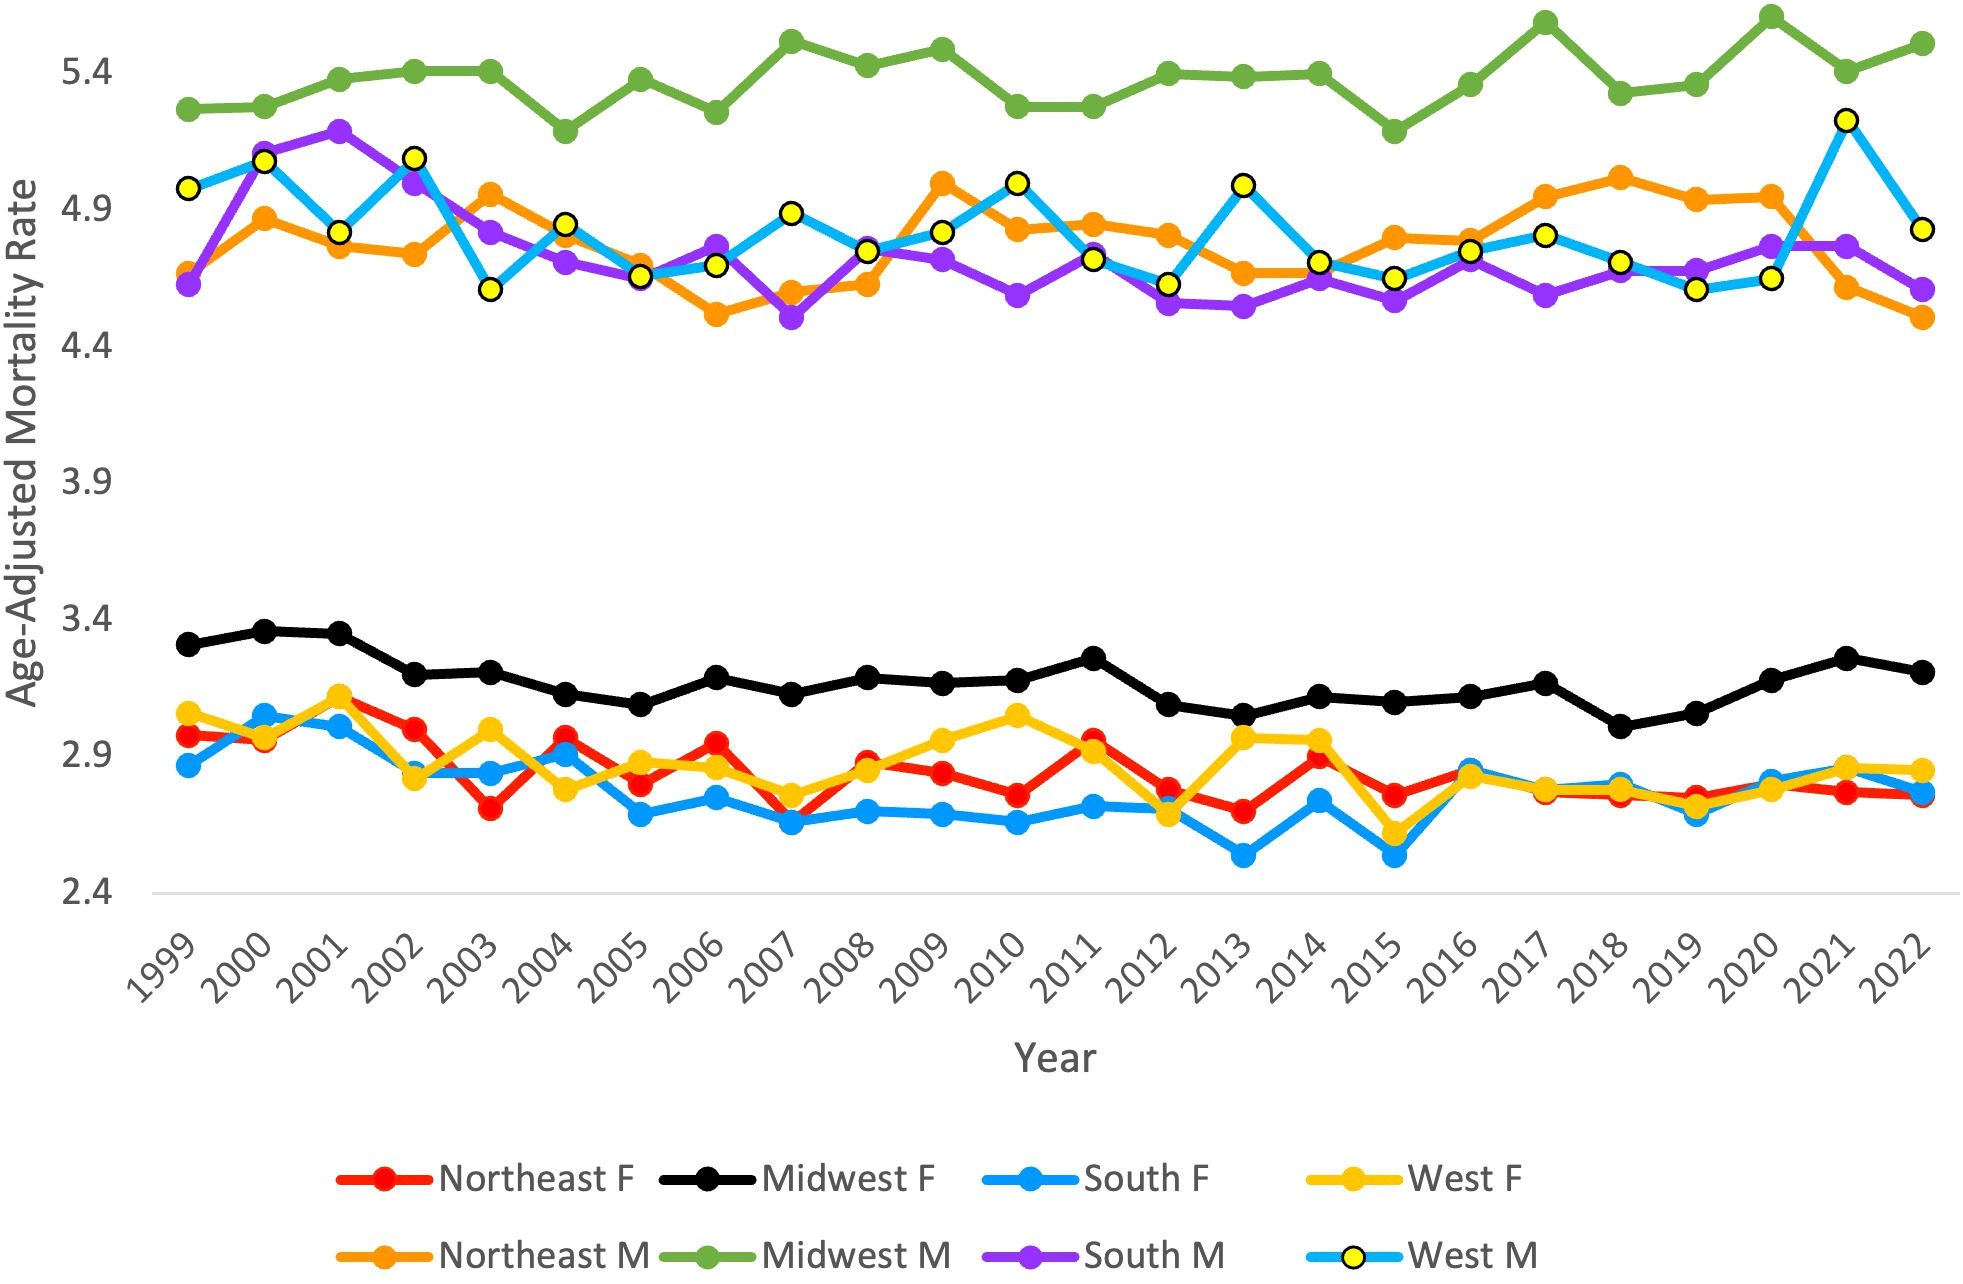
Myeloid Leukemia cancer age-adjusted mortality rate per 100,000 people; stratified by region and gender (F = Female, M = Male), 1999-2022.
Table 4
| Year | Overall | Northeast | Midwest | South | West | |||||
|---|---|---|---|---|---|---|---|---|---|---|
| Female | Male | Female | Male | Female | Male | Female | Male | Female | Male | |
| 1999 | 2.86 | 4.53 | 2.98 | 4.67 | 3.31 | 5.27 | 2.87 | 4.63 | 3.06 | 4.98 |
| 2000 | 2.92 | 4.80 | 2.96 | 4.87 | 3.36 | 5.28 | 3.05 | 5.11 | 2.97 | 5.08 |
| 2001 | 2.99 | 4.78 | 3.12 | 4.77 | 3.35 | 5.38 | 3.01 | 5.19 | 3.12 | 4.82 |
| 2002 | 2.79 | 4.77 | 3.00 | 4.74 | 3.20 | 5.41 | 2.84 | 5.00 | 2.82 | 5.09 |
| 2003 | 2.79 | 4.67 | 2.71 | 4.96 | 3.21 | 5.41 | 2.84 | 4.82 | 3.00 | 4.61 |
| 2004 | 2.80 | 4.58 | 2.97 | 4.81 | 3.13 | 5.19 | 2.91 | 4.71 | 2.78 | 4.85 |
| 2005 | 2.72 | 4.53 | 2.80 | 4.70 | 3.09 | 5.38 | 2.69 | 4.65 | 2.88 | 4.66 |
| 2006 | 2.77 | 4.54 | 2.95 | 4.52 | 3.19 | 5.26 | 2.75 | 4.77 | 2.86 | 4.70 |
| 2007 | 2.64 | 4.50 | 2.66 | 4.60 | 3.13 | 5.52 | 2.66 | 4.51 | 2.76 | 4.89 |
| 2008 | 2.72 | 4.59 | 2.88 | 4.63 | 3.19 | 5.43 | 2.70 | 4.76 | 2.85 | 4.75 |
| 2009 | 2.76 | 4.65 | 2.84 | 5.00 | 3.17 | 5.49 | 2.69 | 4.72 | 2.96 | 4.82 |
| 2010 | 2.71 | 4.58 | 2.76 | 4.83 | 3.18 | 5.28 | 2.66 | 4.59 | 3.05 | 5.00 |
| 2011 | 2.77 | 4.62 | 2.96 | 4.85 | 3.26 | 5.28 | 2.72 | 4.74 | 2.92 | 4.72 |
| 2012 | 2.68 | 4.53 | 2.78 | 4.81 | 3.09 | 5.40 | 2.71 | 4.56 | 2.69 | 4.63 |
| 2013 | 2.62 | 4.53 | 2.70 | 4.67 | 3.05 | 5.39 | 2.54 | 4.55 | 2.97 | 4.99 |
| 2014 | 2.74 | 4.49 | 2.90 | 4.67 | 3.12 | 5.40 | 2.74 | 4.65 | 2.96 | 4.71 |
| 2015 | 2.56 | 4.46 | 2.76 | 4.80 | 3.10 | 5.19 | 2.54 | 4.57 | 2.62 | 4.65 |
| 2016 | 2.76 | 4.51 | 2.85 | 4.79 | 3.12 | 5.36 | 2.85 | 4.72 | 2.83 | 4.75 |
| 2017 | 2.69 | 4.57 | 2.77 | 4.95 | 3.17 | 5.59 | 2.78 | 4.59 | 2.78 | 4.81 |
| 2018 | 2.63 | 4.53 | 2.76 | 5.02 | 3.01 | 5.33 | 2.80 | 4.68 | 2.78 | 4.71 |
| 2019 | 2.59 | 4.49 | 2.75 | 4.94 | 3.06 | 5.36 | 2.69 | 4.68 | 2.72 | 4.61 |
| 2020 | 2.62 | 4.41 | 2.80 | 4.95 | 3.18 | 5.61 | 2.81 | 4.77 | 2.78 | 4.65 |
| 2021 | 2.62 | 4.41 | 2.77 | 4.62 | 3.26 | 5.41 | 2.86 | 4.77 | 2.86 | 5.23 |
| 2022 | 2.63 | 4.28 | 2.76 | 4.51 | 3.21 | 5.51 | 2.77 | 4.61 | 2.85 | 4.83 |
Myeloid Leukemia cancer age-adjusted mortality rate per 100,000 people stratified by region and gender, 1999-2022.
Figure 7
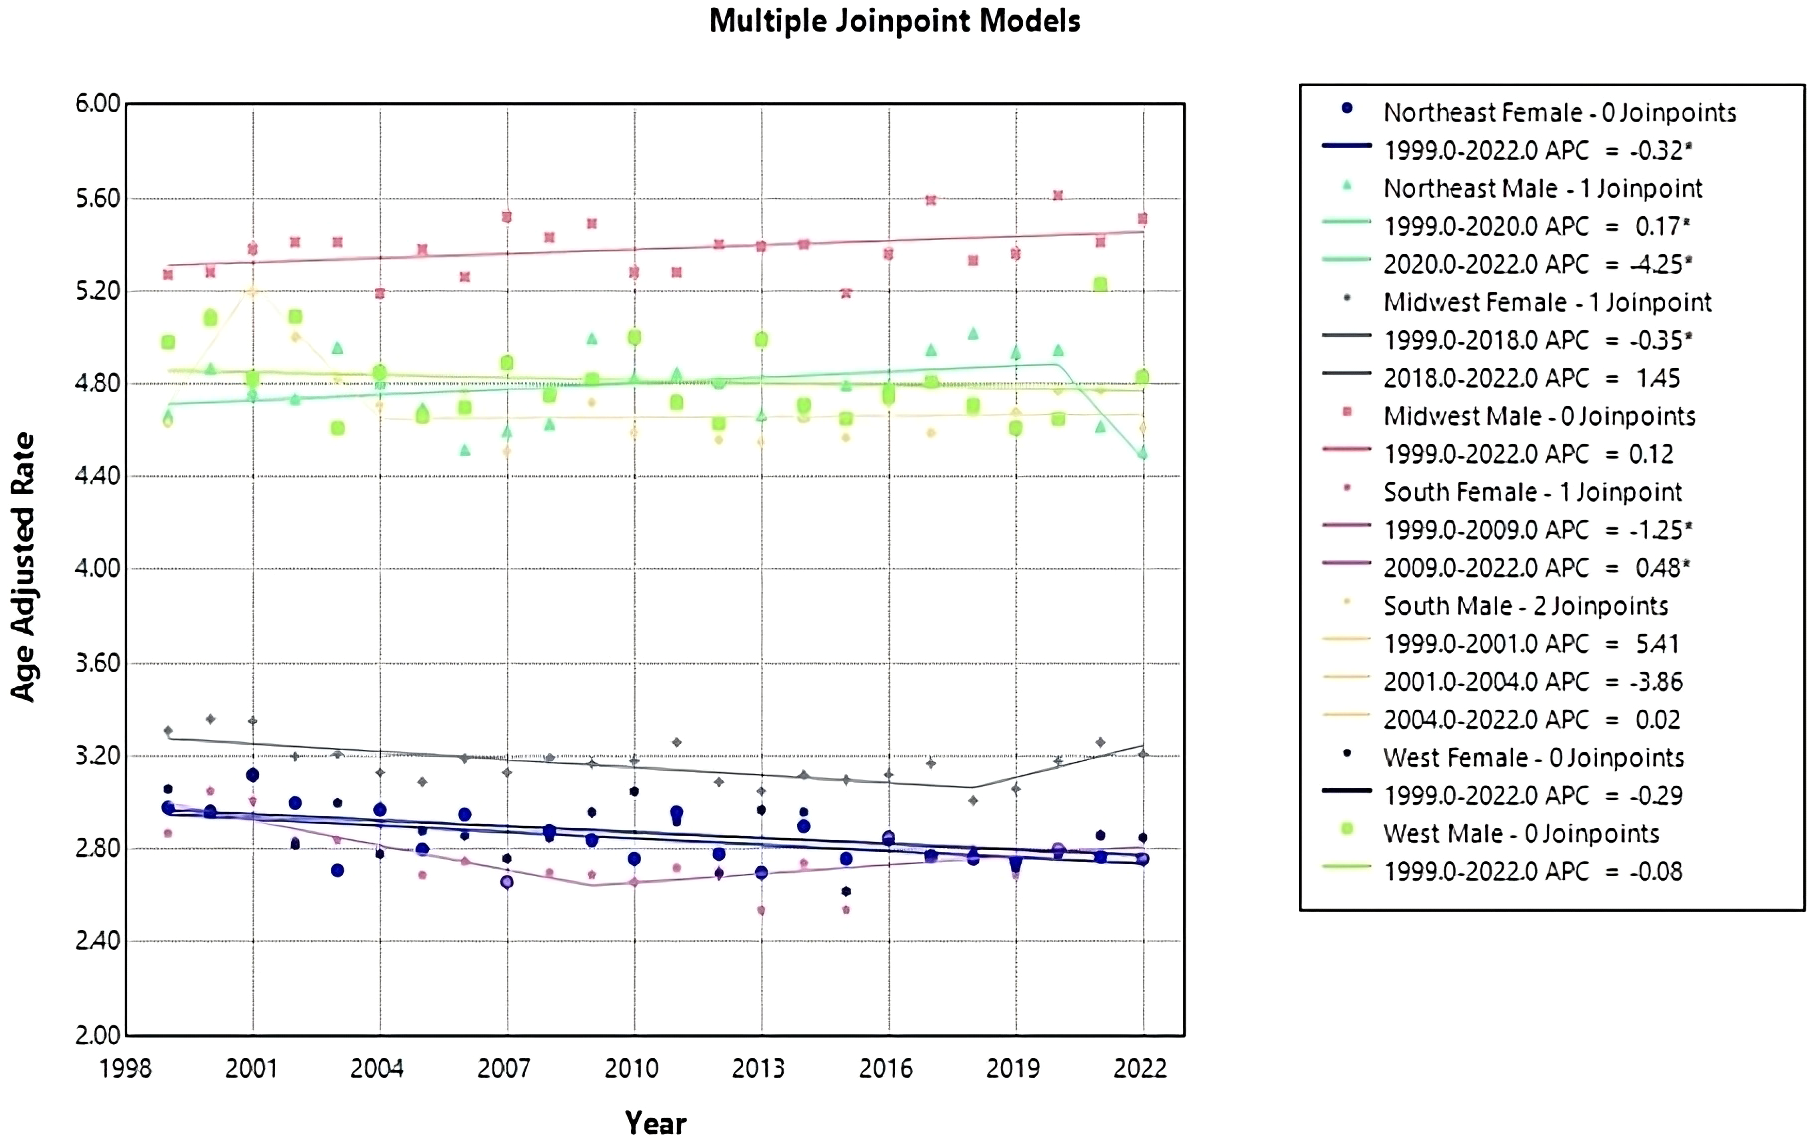
Joinpoint model of Myeloid Leukemia cancer-related AAMR per 100,000 people; stratified by region and gender, 1999-2022 (*indicates the APC is statistically significant).
Region and race
From 1999 to 2022, White people consistently had the highest AAMR across each region, with the highest rate in 2017 in the Midwest, at 4.41 (95% CI 4.25 to 4.57) (Table 5). The lowest AAMR was in 2003 in the Northeast Asian or Pacific Islanders, at 1.22 (95% CI 0.75 to 1.86) (Table 5).
Table 5
| Year | Northeast | Midwest | South | West | ||||||||||||
|---|---|---|---|---|---|---|---|---|---|---|---|---|---|---|---|---|
| Asian | Black | White | Latino | Asian | Black | White | Latino | Asian | Black | White | Latino | Asian | Black | White | Latino | |
| 1999 | 2.24 | 3.27 | 3.73 | 2.91 | 3.17 | 3.30 | 4.15 | 2.66 | 2.10 | 3.08 | 3.74 | 2.83 | 3.06 | 4.01 | 4.03 | 2.73 |
| 2000 | 2.46 | 3.26 | 3.77 | 3.02 | * | * | * | * | * | * | * | * | 2.39 | 3.41 | 4.08 | 3.18 |
| 2001 | 2.21 | 2.89 | 3.91 | 3.02 | 2.74 | 3.32 | 4.22 | 1.54 | 2.42 | 3.26 | 4.12 | 3.03 | 2.94 | 3.38 | 4.15 | 2.65 |
| 2002 | 2.36 | 3.09 | 3.81 | 2.38 | * | * | * | * | 2.28 | 3.24 | 3.90 | 2.55 | 2.73 | 3.74 | 4.11 | 2.37 |
| 2003 | 1.22 | 2.48 | 3.82 | 2.42 | * | * | * | * | 1.77 | 3.28 | 3.83 | 2.65 | 2.52 | 3.97 | 3.98 | 2.48 |
| 2004 | 1.72 | 2.98 | 3.95 | 2.23 | * | * | * | * | 1.59 | 3.31 | 3.81 | 2.43 | 2.67 | 3.30 | 3.98 | 2.51 |
| 2005 | 2.44 | 2.82 | 3.68 | 2.61 | * | * | * | * | 1.79 | 2.80 | 3.71 | 2.49 | 2.42 | 3.22 | 3.96 | 2.61 |
| 2006 | 1.75 | 2.46 | 3.88 | 1.95 | 2.69 | 3.91 | 4.11 | 2.69 | 2.56 | 3.04 | 3.83 | 2.33 | 2.76 | 3.54 | 3.97 | 2.44 |
| 2007 | 2.89 | 2.84 | 3.59 | 2.46 | 2.03 | 3.34 | 4.27 | 2.33 | 1.99 | 2.91 | 3.67 | 2.05 | 2.70 | 2.83 | 3.99 | 2.45 |
| 2008 | 1.46 | 3.14 | 3.84 | 2.11 | 2.49 | 2.96 | 4.24 | 1.99 | 2.04 | 2.88 | 3.80 | 2.50 | 2.80 | 3.51 | 3.98 | 2.49 |
| 2009 | 2.05 | 2.40 | 4.00 | 3.15 | 2.34 | 3.19 | 4.30 | 2.58 | 2.37 | 3.06 | 3.73 | 2.48 | 3.15 | 3.50 | 4.11 | 2.5 |
| 2010 | 1.67 | 2.86 | 3.82 | 2.53 | 2.81 | 3.20 | 4.17 | 2.80 | 2.66 | 2.61 | 3.75 | 2.65 | 3.48 | 3.65 | 4.15 | 2.71 |
| 2011 | 2.37 | 2.95 | 3.94 | 2.39 | 3.29 | 3.09 | 4.25 | 1.79 | 1.60 | 3.08 | 3.79 | 2.32 | 3.33 | 3.42 | 4.02 | 2.49 |
| 2012 | 2.42 | 2.71 | 3.83 | 2.42 | 2.86 | 3.39 | 4.19 | 2.69 | 2.63 | 2.94 | 3.73 | 2.30 | 2.86 | 3.06 | 3.84 | 2.60 |
| 2013 | 1.84 | 2.75 | 3.77 | 2.36 | 2.08 | 3.73 | 4.12 | 2.99 | 1.64 | 2.75 | 3.68 | 2.44 | 3.02 | 4.24 | 4.14 | 2.83 |
| 2014 | 1.96 | 2.80 | 3.83 | 2.53 | 2.16 | 3.07 | 4.27 | 2.22 | 2.08 | 2.92 | 3.85 | 2.48 | 2.61 | 3.63 | 4.10 | 2.71 |
| 2015 | 2.47 | 2.71 | 3.86 | 2.30 | 1.99 | 3.13 | 4.11 | 2.43 | 2.21 | 2.88 | 3.66 | 2.22 | 2.70 | 2.55 | 3.89 | 2.49 |
| 2016 | 1.92 | 3.26 | 3.83 | 2.73 | 2.09 | 3.4 | 4.23 | 2.81 | 2.20 | 3.02 | 3.94 | 2.53 | 2.86 | 4.22 | 4.02 | 2.67 |
| 2017 | 2.45 | 3.22 | 3.90 | 2.22 | 1.91 | 3.14 | 4.41 | 2.21 | 2.32 | 2.94 | 3.88 | 2.55 | 2.96 | 3.65 | 3.98 | 2.67 |
| 2018 | 2.59 | 3.00 | 3.91 | 2.62 | 2.06 | 3.71 | 4.15 | 1.86 | 2.23 | 3.07 | 3.87 | 2.49 | 2.88 | 3.32 | 4.02 | 2.61 |
| 2019 | 2.26 | 2.57 | 3.95 | 2.61 | 2.61 | 3.20 | 4.18 | 2.23 | 2.63 | 3.30 | 3.76 | 2.60 | 2.80 | 3.46 | 3.91 | 2.53 |
| 2020 | 2.24 | 3.17 | 3.95 | 2.45 | 1.94 | 3.52 | 4.38 | 2.78 | 2.34 | 3.29 | 3.92 | 2.53 | 2.82 | 3.58 | 4.02 | 2.45 |
| 2021 | 2.27 | 2.68 | 3.84 | 2.42 | 2.20 | 3.60 | 4.38 | 2.44 | 2.27 | 3.00 | 4.10 | 2.47 | 2.86 | 4.00 | 4.35 | 2.76 |
| 2022 | 1.88 | 2.89 | 3.80 | 2.51 | 2.14 | 3.55 | 4.37 | 2.02 | 2.84 | 3.09 | 3.91 | 2.34 | 2.88 | 3.78 | 4.10 | 2.85 |
Myeloid Leukemia cancer age-adjusted mortality rate per 100,000 people; stratified by region and race, 1999-2022.
(*indicates unreliable data).
In the Northeast region, Asian or Pacific Islanders had the lowest AAMR, with 2.24 (95% CI 1.46 to 3.28) in 1999 to 1.88 (95% CI 1.48 to 2.35) in 2022, and a non-significant AAPC and APC of 0.271 (95% CI -0.77 to 1.70) (Table 5, Figures 8, 9). In the Midwest region, the White race had a significant increase in APC at 0.17 (95% CI 0.03 to 0.31)* from 1999-2022 (Table 5, Figure 9). In the Midwest region, Asian or Pacific Islanders had the lowest AAMR, with 3.17 (95% CI 1.81 to 5.14) in 1999 to 2.14 (95% CI 1.54 to 2.89) in 2022, and a non-significant AAPC and APC of -1.54 (95% CI -2.80 to 0.01) (Table 5, Figures 8, 9). In the Southern region, White people from 1999–2010 had a significant decrease in APC at -0.62 (95% CI -2.99 to -0.07)*, and from 2010-2022, they had a significant increase in APC at 0.59 (95% CI 0.14 to 2.59)* (Figure 9). Asian or Pacific Islanders had the lowest AAMR in the South, with 2.10 (95% CI 1.18 to 3.47) in 1999 to 2.84 (95% CI 2.34 to 3.34) in 2022, and a significant increase in AAPC and APC at 1.13 (95% CI 0.11 to 2.56)* (Table 5, Figures 8, 9). Black and African Americans from 1999–2010 had a significant decrease in APC at -1.48 (95% CI -6.26 to -0.28)* and from 2010-2022, they had a significant increase in APC at 0.95 (95% CI 0.05 to 5.09)* (Figure 9). Hispanics and Latinos from 1999–2006 had a significant decrease in APC at -2.75 (95% CI -10.38 to -0.49)* and from 2006-2022, they had a non-significant APC of 0.34 (95% CI -0.21 to 2.87) (Figure 9). In the Western region, Hispanics or Latinos had the lowest AAMR, with 2.73 (95% CI 2.32 to 3.15) in 1999 and 2.85 (95% CI 2.58 to 3.12) in 2022 (Table 5, Figure 8). Hispanics or Latinos from 1999–2002 had a non-significant APC of -6.01 (95% CI -13.53 to 0.19) and from 2002–2022 had a non-significant APC of 0.40 (95% CI -0.23 to 2.77) (Figure 9). Asian or Pacific Islanders from 1999–2005 had a non-significant APC of -2.61 (95% CI -11.72 to 1.59), from 2005–2010 had a non-significant APC of 6.48 (95% CI -3.59 to 14.30), from 2010–2014 had a non-significant APC of -4.99 (95% CI -9.18 to 3.93), and from 2014–2022 had a non-significant APC of 0.63 (95% CI -1.02 to 6.36) (Figure 9).
Figure 8
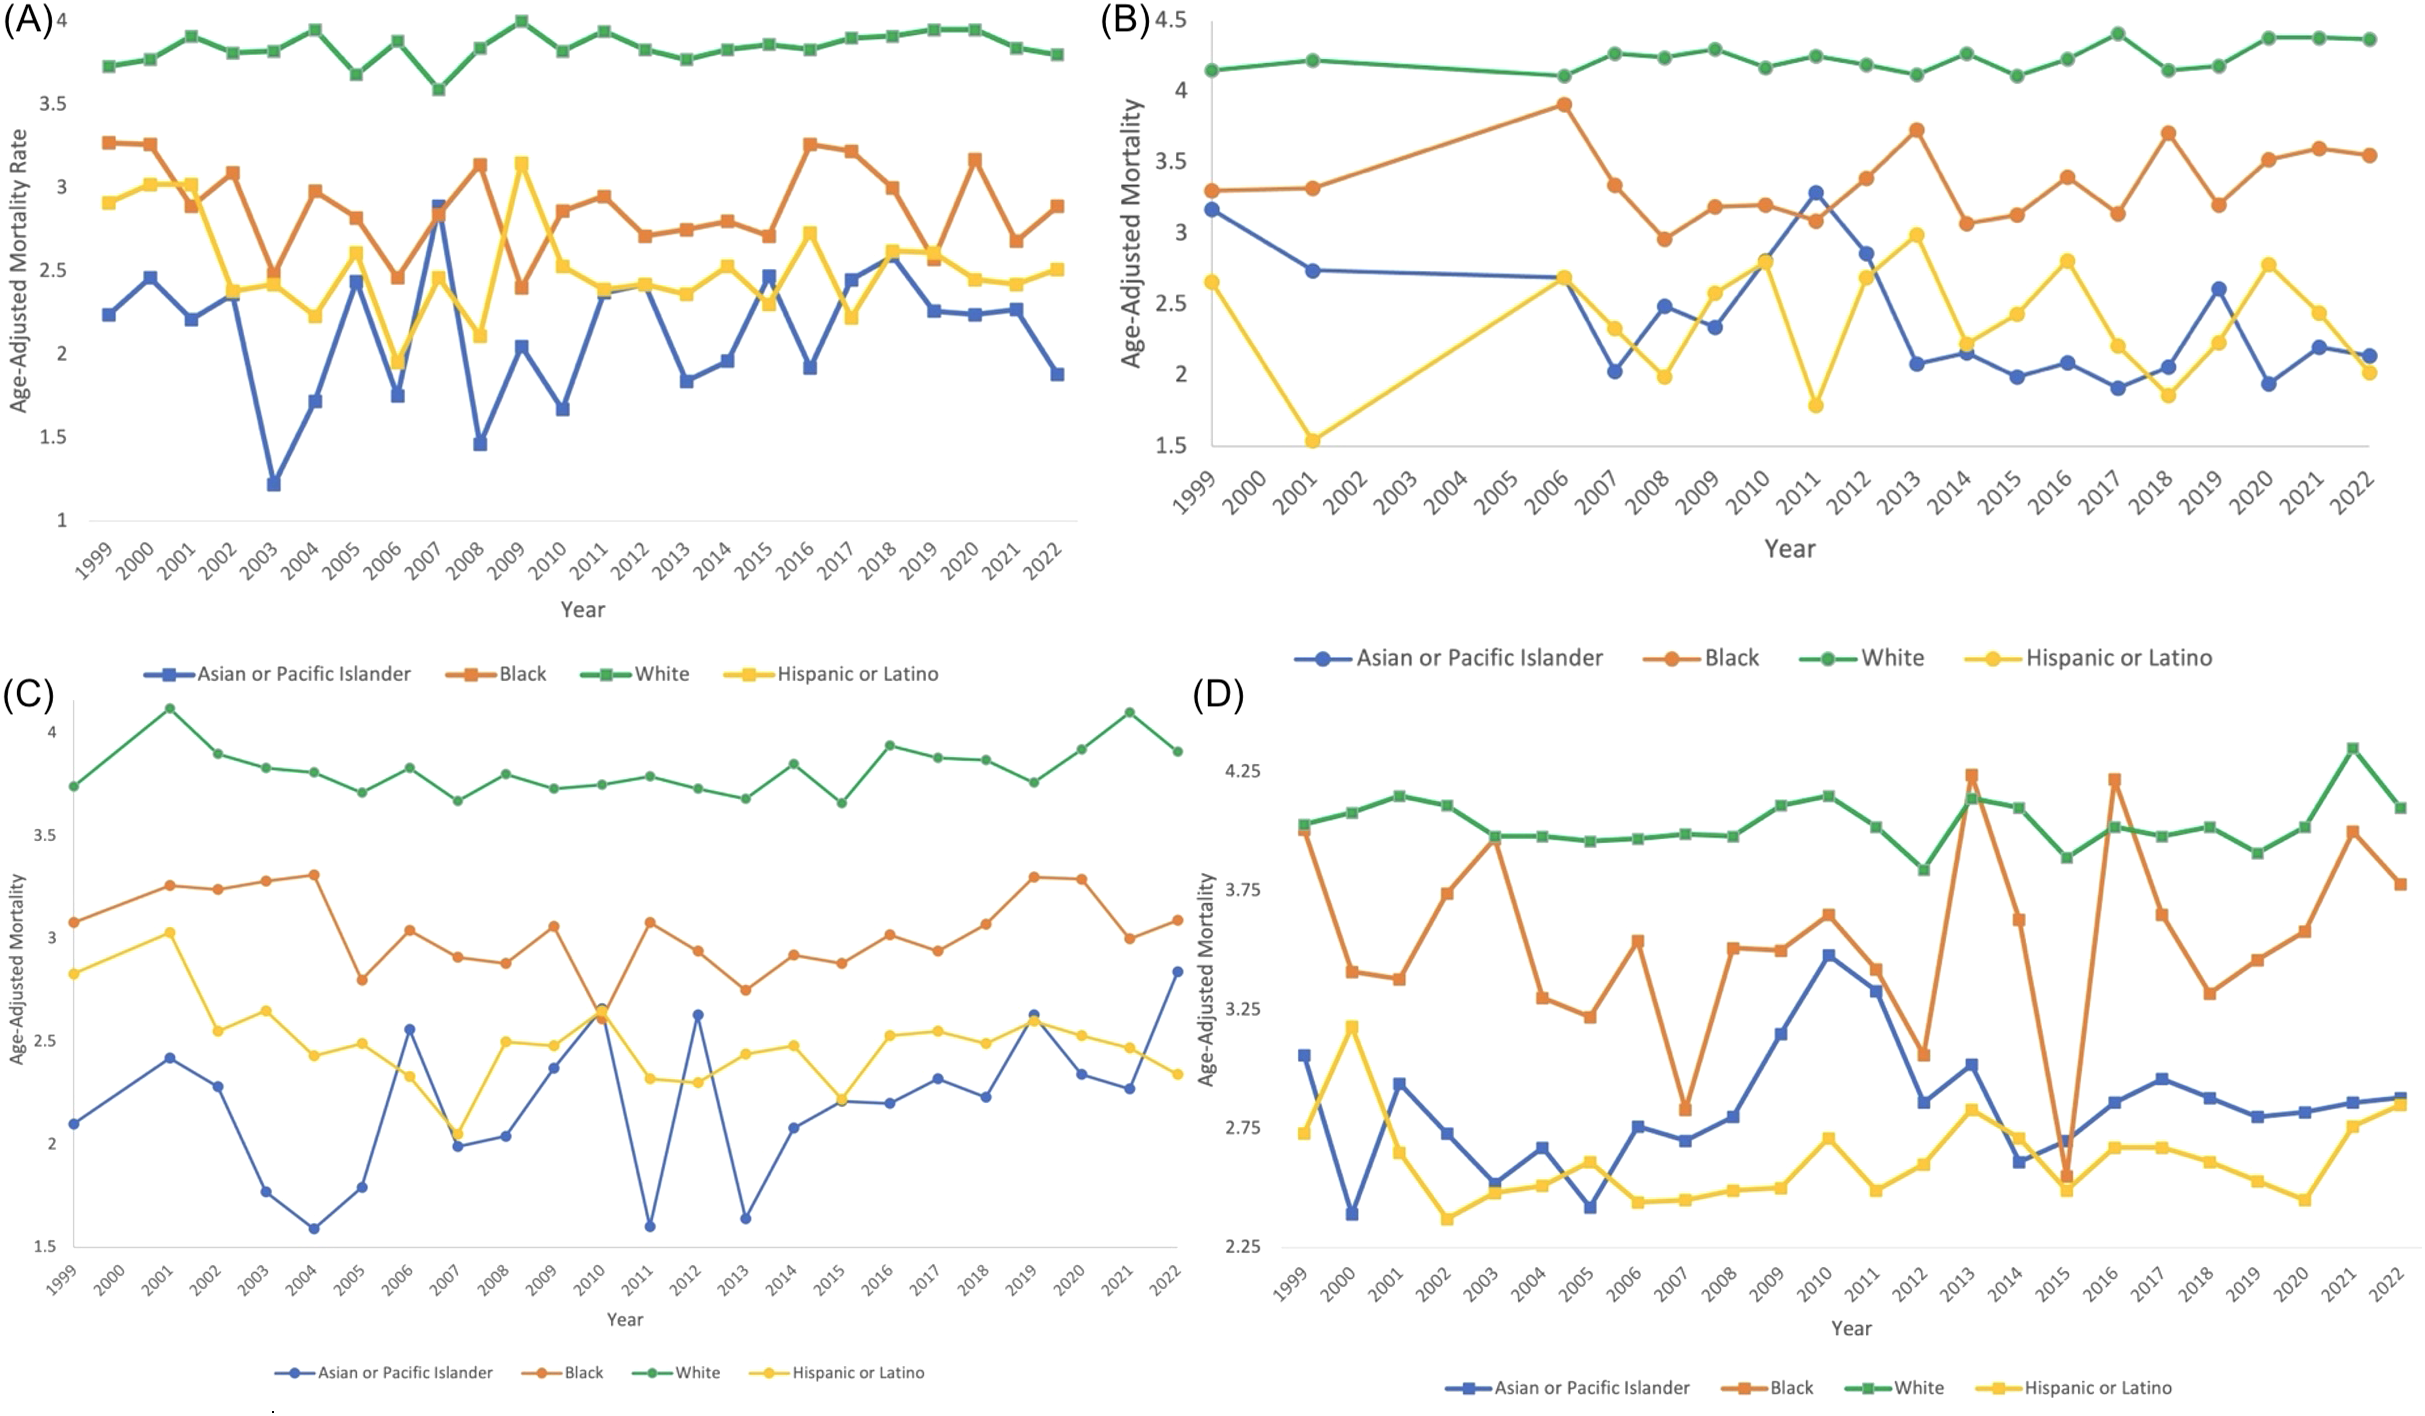
Myeloid Leukemia cancer age-adjusted mortality rate per 100,000 people; stratified by race, 1999-2022, in the (A) Northeast region, (B) Midwest region, (C) Southern region, and (D) Western region.
Figure 9
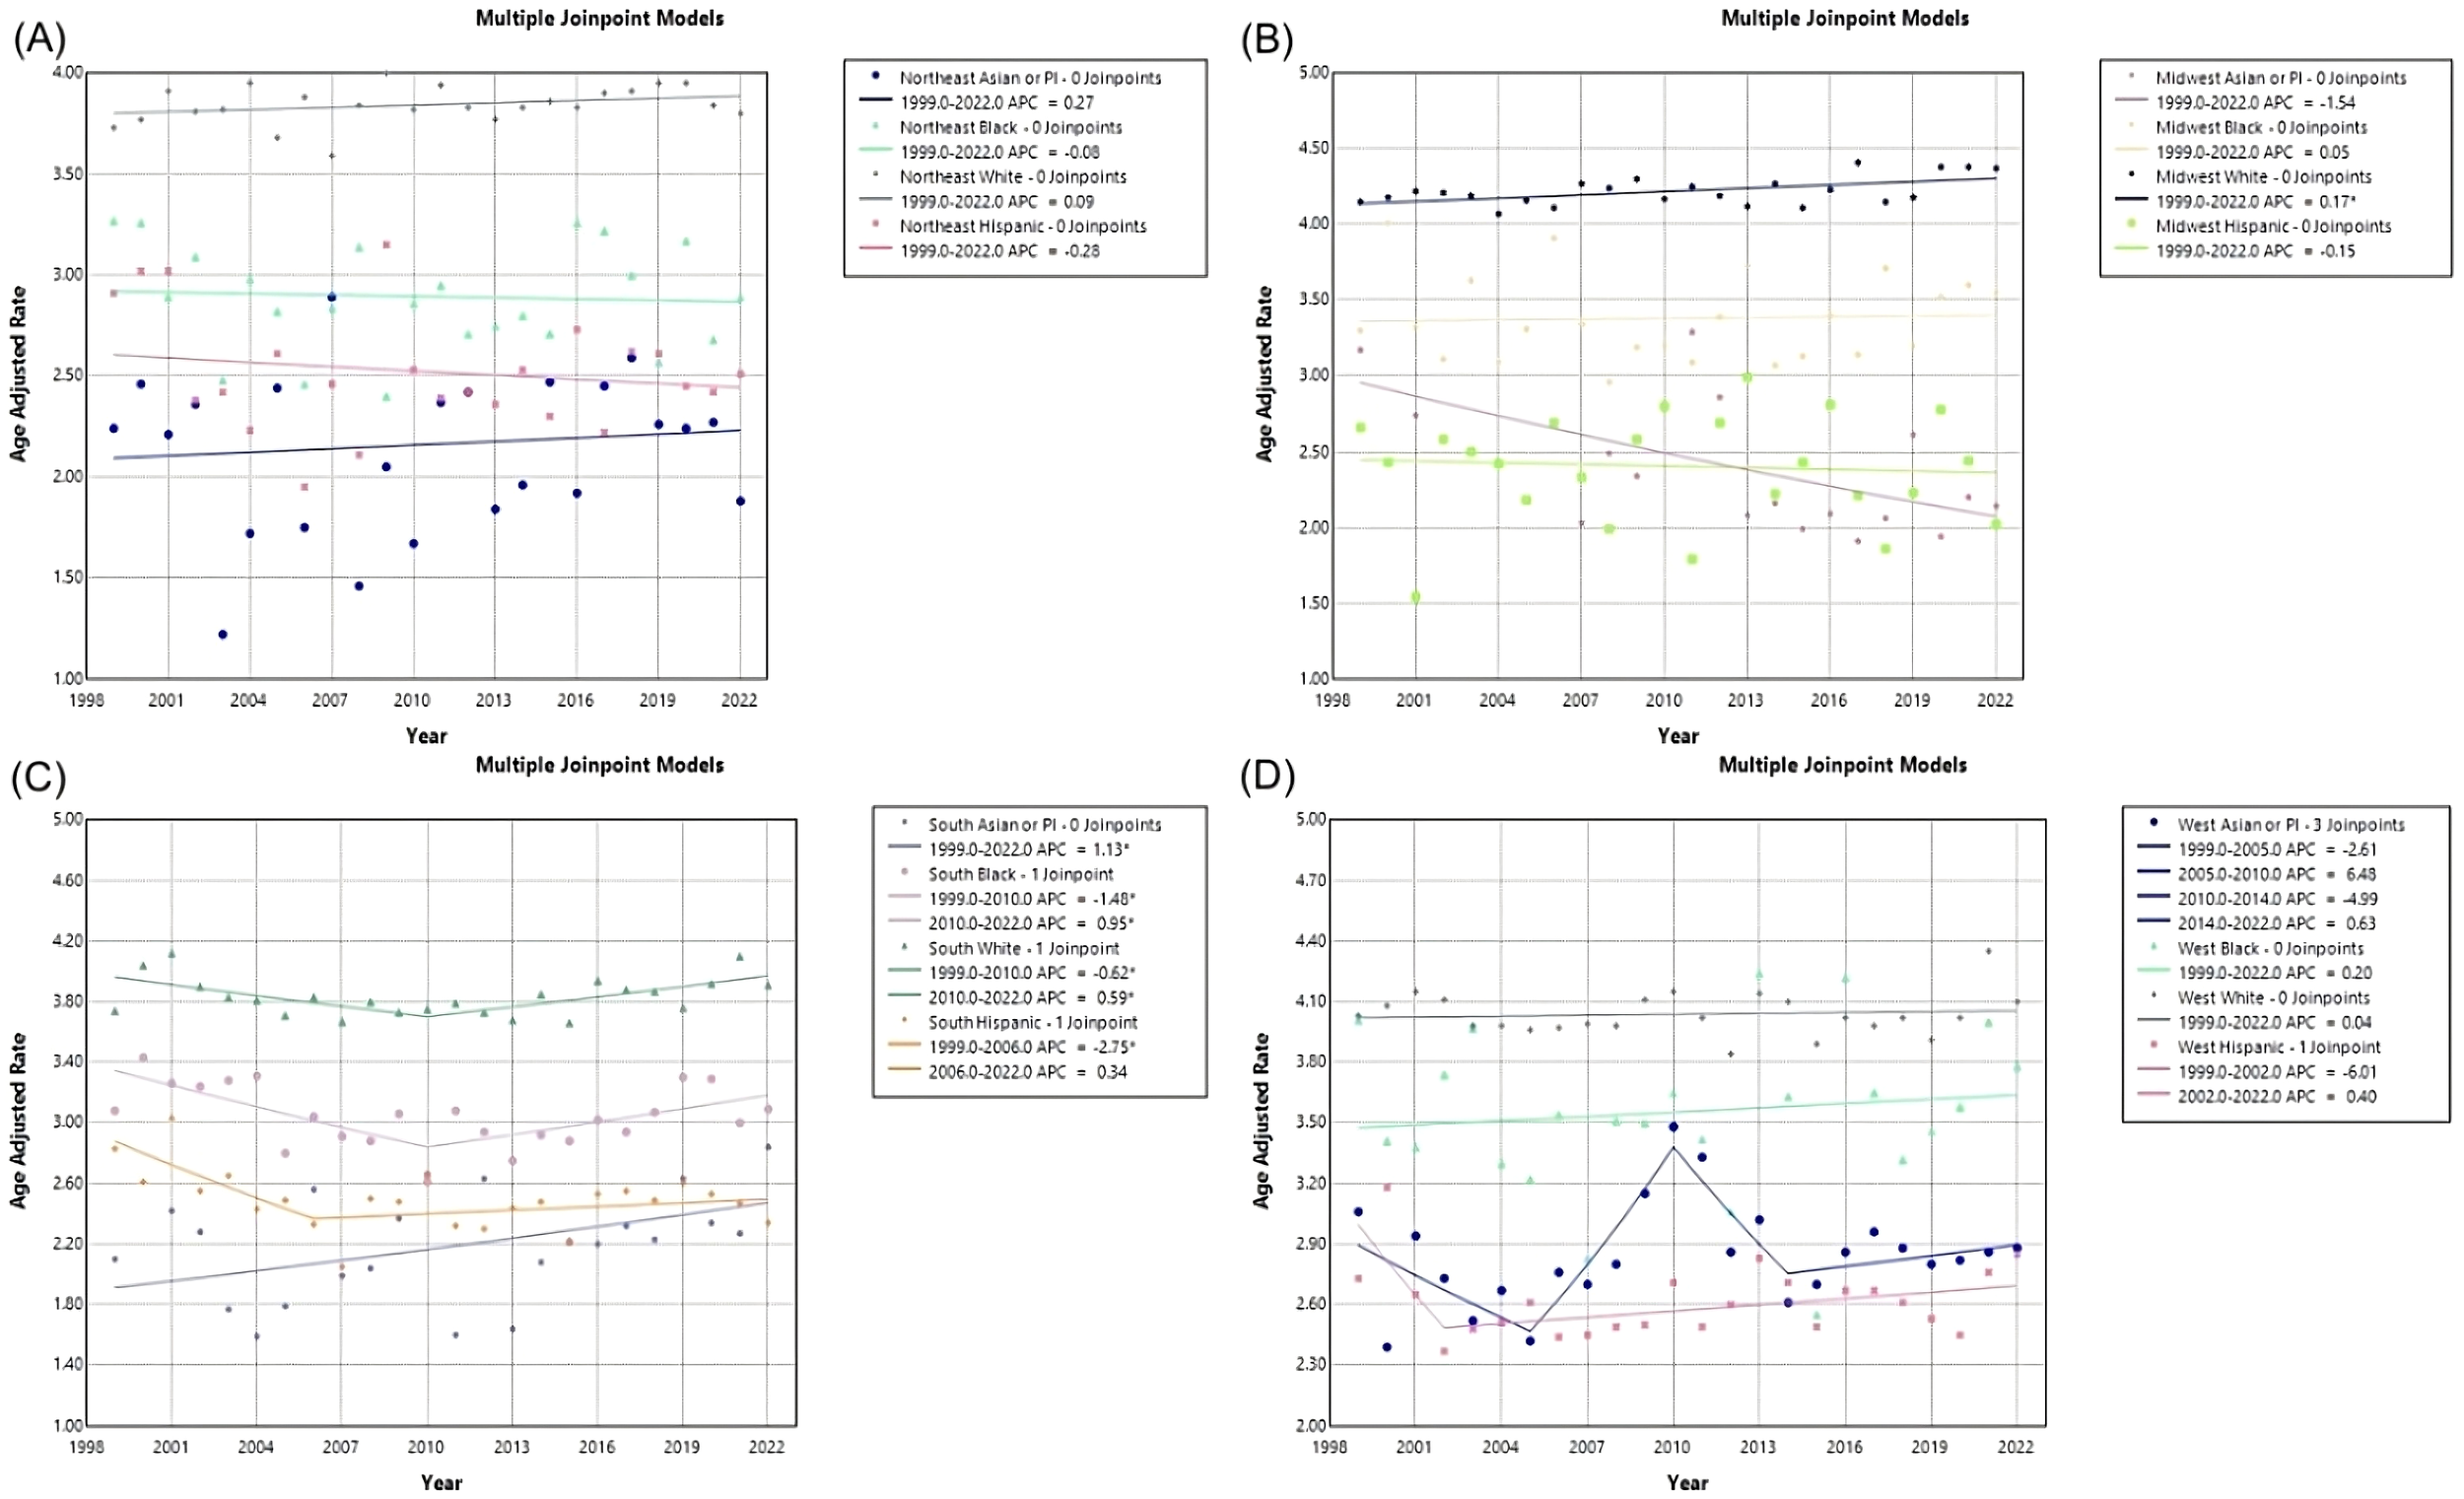
Joinpoint model of Myeloid Leukemia cancer-related AAMR per 100,000 people; stratified by race, 1999-2022, in the (A) Northeast region, (B) Midwest region, (C) Southern region, and (D) Western region. (*indicates the APC is statistically significant).
Discussion
From 1999–2007, ML-related mortality in the U.S. significantly declined, likely due to therapeutic advances such as the introduction of tyrosine kinase inhibitors for CML (3, 12). However, from 2007–2022, mortality showed a non-significant increase, despite newer therapies for AML like CPX-351 and Volasertib (3, 12). This plateau may reflect stagnation in treatment innovation for AML, which still relies heavily on the decades-old “3 + 7 regimen” (3, 12). The observed rise in mortality during recent years has been attributed in part to delayed diagnoses during the COVID-19 pandemic and growing resistance to therapies, particularly in older populations (6, 13).
Our analysis identified consistently higher AAMRs in the Midwest—a region that showed a non-significant upward mortality trend, in contrast to other U.S. regions. States like Iowa, Kansas, Minnesota, North Dakota, and South Dakota were among those with the highest mortality. Prior research has also highlighted this regional disparity, which may be linked to environmental exposures (e.g., agricultural chemicals), limited access to specialized care, and broader socioeconomic challenges (14–16). These structural factors may contribute to persistently high AAMRs, particularly in rural areas of the Midwest, where mortality has not improved over time.
Across all regions, rural areas experienced higher AAMRs than urban counterparts. Rural regions saw an initial decline in APC from 1999–2011, followed by a significant increase from 2011–2020. In contrast, urban areas experienced a sustained decline. These disparities may reflect differential access to healthcare resources, including proximity to cancer centers, availability of specialists, and socioeconomic conditions such as poverty and insurance coverage (16–19). Prior studies confirm that rural residence is independently associated with increased cancer mortality, even after adjusting for treatment and stage at diagnosis (20, 21).
Sex and race were also significant factors. Males had higher mortality rates than females in every region, with the highest rates in Midwestern males. This is consistent with previous literature (5, 14, 22). Similarly, the Midwest had the highest AAMRs for females. Racial disparities persisted: White individuals had the highest AAMRs, especially in the Midwest, while Asian or Pacific Islanders and Hispanic or Latino populations had the lowest. However, in the South, Asian or Pacific Islanders showed an increasing AAMR trend—highlighting a subgroup requiring further investigation.
The lack of consistent improvement in ML mortality, despite treatment advances, underscores systemic disparities. Enhanced access to novel therapies and specialized care—particularly in rural and underserved areas—should be a priority. In addition, culturally tailored interventions and regional public health strategies are needed to address worsening trends in specific demographic subgroups.
This study is limited by its reliance on aggregate mortality data from death certificates, which may be subject to misclassification and could obscure individual-level factors such as comorbidities or treatment adherence (23). Future studies should incorporate more granular, patient-level data to explore how environmental exposures, healthcare access, and socioeconomic conditions contribute to ML mortality across regions.
Conclusion
This study provides a comprehensive evaluation of age-adjusted mortality rates (AAMRs) for myeloid leukemias (ML) across the United States from 1999 to 2022, identifying significant trends and disparities by region, state, urban/rural residence, gender, and race. While overall ML-related mortality rates have remained relatively stable, notable regional variations emerged, with the Midwest experiencing persistently higher AAMRs compared to other regions. Urban-rural disparities were evident, with rural areas consistently reporting higher mortality rates and concerning recent increases in APCs. Gender disparities also persisted, with males exhibiting higher mortality rates than females across all regions. Racial trends revealed that White individuals bore the highest burden, though some minority groups, such as Black and Asian or Pacific Islander populations, showed significant fluctuations in AAMRs over time.
The findings underscore the need for targeted public health interventions, improved healthcare access in rural and high-burden regions, and further research to address demographic disparities in ML mortality. Enhancing data sharing and leveraging large-scale databases like CDC WONDER will be instrumental in reducing ML-related mortality and driving evidence-based strategies to improve outcomes for affected populations.
Statements
Data availability statement
The datasets presented in this study can be found in online repositories. The names of the repository/repositories and accession number(s) can be found below: https://wonder.cdc.gov/ Centers for Disease Control and Prevention Wide-Ranging Online Data for Epidemiologic Research (CDC WONDER), Accession number: C92.
Ethics statement
The studies involving humans were approved by Creighton’s School of Medicine Research Institutional Review Board (IRB). The studies were conducted in accordance with the local legislation and institutional requirements. Written informed consent for participation was not required from the participants or the participants’ legal guardians/next of kin in accordance with the national legislation and institutional requirements.
Author contributions
JL: Writing – original draft, Writing – review & editing. HF: Writing – original draft, Writing – review & editing. TB: Writing – original draft, Writing – review & editing. MM: Writing – original draft, Writing – review & editing.
Funding
The author(s) declare that no financial support was received for the research and/or publication of this article.
Conflict of interest
The authors declare that the research was conducted in the absence of any commercial or financial relationships that could be construed as a potential conflict of interest.
Generative AI statement
The author(s) declare that no Generative AI was used in the creation of this manuscript.
Publisher’s note
All claims expressed in this article are solely those of the authors and do not necessarily represent those of their affiliated organizations, or those of the publisher, the editors and the reviewers. Any product that may be evaluated in this article, or claim that may be made by its manufacturer, is not guaranteed or endorsed by the publisher.
References
1
Westers TM Houtenbos I van de Loosdrecht AA Ossenkoppele GJ . Principles of dendritic cell-based immunotherapy in myeloid leukemia. Immunobiology. (2006) 211:663–76. doi: 10.1016/j.imbio.2006.06.003. ISSN 0171-2985.
2
Siegel RL Miller KD Wagle NS Jemal A . Cancer statistics, 2023. CA Cancer J Clin. (2023) 73:17–48. doi: 10.3322/caac.21763
3
Sasaki K Ravandi F Kadia TM DiNardo CD Short NJ Borthakur G et al . De novo acute myeloid leukemia: A population-based study of outcome in the United States based on the Surveillance, Epidemiology, and End Results (SEER) database, 1980 to 2017. Cancer. (2021) 127(12):2049–61. doi: 10.1002/cncr.33458
4
Bhatt VR Shostrom V Giri S Gundabolu K Monirul Islam KM Appelbaum FR et al . Early mortality and overall survival of acute myeloid leukemia based on facility type. Am J Hematol. (2017) 92:764–71. doi: 10.1002/ajh.24767
5
Al Armashi AR Al Zubaidi A Elantably D Wang J Alkrekshi A . Racial disparities in mortality trends from acute myeloid leukemia: A population-based study in the United States between 2000 and 2019. Blood. (2022) 140:1438. doi: 10.1182/blood-2022-171171
6
Aziz N Nabi W Khan M Gulzar AHB Rath S Cheema AAA et al . Analyzing two decades of leukemia mortality in the U.S. (1999-2020). Clin Lymphoma Myeloma Leukemia. (2025) S2152-2650(25)00096-5. doi: 10.1016/j.clml.2025.03.006
7
CDC wonder. In: Centers for Disease Control and Prevention. Centers for Disease Control and Prevention. Available online at: wonder.cdc.gov/.
8
2013 NCHS urban–rural classification scheme for counties. Available online at: www.cdc.gov/nchs/data/series/sr_02/sr02_166.pdf (Accessed December 17 2024).
9
Multiple cause of death, 1999–2020 request. In: Centers for Disease Control and Prevention. Centers for Disease Control and Prevention. Available online at: wonder.cdc.gov/mcd-icd10.html.
10
Age standardization of death rates; implementation of the year 2000 standard. In: Centers for Disease Control and Prevention. Atlanta, GA: Centers for Disease Control and Prevention. (2024). Available online at: stacks.cdc.gov/view/cdc/13357.
11
Joinpoint trend analysis software. In: Joinpoint Regression Program. Bethesda, MD: Statistical Research and Applications Branch, National Cancer Institute. Available online at: surveillance.cancer.gov/joinpoint/.
12
Varughese T Koprivnikar J . Mortality rate and social disparity trends with tyrosine kinase inhibitory availability in chronic myelogenous leukemia: An analysis in the US from 1999 to 2020. J Clin Oncol. (2023) 41:7055–5. doi: 10.1200/jco.2023.41.16_suppl.7055
13
Hao T Li-Talley M Buck A Chen W . An emerging trend of rapid increase of leukemia but not all cancers in the aging population in the United States. Sci Rep. (2019) 9:12070. doi: 10.1038/s41598-019-48445-1
14
Ali Shah MD Saria HM Hussain A Malak I Amin MK Mushtaq MU et al . MDS-304 disparities in myelodysplastic syndromes mortality among older adults in the United States: A CDC WONDER database analysis. Clin Lymphoma Myeloma Leukemia. (2024) 24:S392. doi: 10.1016/S2152-2650(24)01355-7. ISSN 2152-2650.
15
Gerken J Vincent G Zapata D Barron IG Zapata I . Comprehensive assessment of pesticide use patterns and increased cancer risk. Front Cancer Control Soc. (2024) 2:1368086. doi: 10.3389/fcacs.2024.1368086
16
Ward E Jemal A Cokkinides V Singh GK Cardinez C Ghafoor A et al . Cancer disparities by race/ethnicity and socioeconomic status. CA Cancer J Clin. (2004) 54:78–93. doi: 10.3322/canjclin.54.2.78
17
Ansinelli H Robbins JR Hsu CC . Trends, disparities and outcomes of advanced radiation techniques for small cell lung cancer in the United States from 2004-2016: a national cancer database analysis. Int J Radiat Oncol Biol Phys. (2020) 108:e404–5. doi: 10.1016/j.ijrobp.2020.07.2455
18
Wakefield DV Carnell M Dove APH Delevega E Ozdenerol E Pisu M et al . Socioeconomic and geographic predictors for radiotherapy quality disparities in the Mid-Southern U.S. Cancer Epidemiol Biomarkers Prev. (2020) 29:A098. doi: 10.1158/1538-7755.DISP18-A098
19
Bhatia S Landier W Paskett ED Peters KB Merrill JK Phillips J et al . Rural-urban disparities in cancer outcomes: opportunities for future research. J Natl Cancer Inst. (2022) 114:940–52. doi: 10.1093/jnci/djac030
20
Bhesania S Anand S Dabria T Veliginti S Nadella S Kotla NK et al . Disparities in outcomes of hospitalizations due to multiple myeloma: a nationwide comparison. Blood. (2020) 136:5. doi: 10.1182/blood-2020-141723
21
Semprini J Gadag K Williams G Muldrow A Zahnd WE . Rural-urban cancer incidence and trends in the United States, 2000 to 2019. Cancer Epidemiol Biomarkers Prev. (2024) 33:1012–22. doi: 10.1158/1055-9965.EPI-24-0072
22
Doddi S Salichs O Hibshman T Alamir P Kunte S . Demographic disparities in acute myeloid leukemia mortality trends in the United States. Anticancer Res. (2024) 44:2211–7. doi: 10.21873/anticanres.17028
23
Howlader N Forjaz G Mooradian MJ Meza R Kong CY Cronin KA et al . The effect of advances in lung-cancer treatment on population mortality. N Engl J Med. (2020) 383:640–9. doi: 10.1056/NEJMoa1916623
Summary
Keywords
mortality, myeloid leukemia, database, region, demographic, trend
Citation
Lehn J, Fleming H, Billion T and Mirza M (2025) Regional, demographic, and temporal trends in myeloid leukemia mortality in the United States (1999-2022): a comprehensive analysis using CDC WONDER. Front. Oncol. 15:1560797. doi: 10.3389/fonc.2025.1560797
Received
15 January 2025
Accepted
25 June 2025
Published
11 July 2025
Volume
15 - 2025
Edited by
Ahmet Emre Eskazan, Istanbul University-Cerrahpasa, Türkiye
Reviewed by
Felicetto Ferrara, Hospital Antonio Cardarelli, Italy
Nathalia Lopez Duarte, Rio de Janeiro Municipal Health Secretariat (SMS-RJ), Brazil
Updates
Copyright
© 2025 Lehn, Fleming, Billion and Mirza.
This is an open-access article distributed under the terms of the Creative Commons Attribution License (CC BY). The use, distribution or reproduction in other forums is permitted, provided the original author(s) and the copyright owner(s) are credited and that the original publication in this journal is cited, in accordance with accepted academic practice. No use, distribution or reproduction is permitted which does not comply with these terms.
*Correspondence: Jenna Lehn, jle49770@creighton.edu
Disclaimer
All claims expressed in this article are solely those of the authors and do not necessarily represent those of their affiliated organizations, or those of the publisher, the editors and the reviewers. Any product that may be evaluated in this article or claim that may be made by its manufacturer is not guaranteed or endorsed by the publisher.