 Lixia Kuang1,2†
 Jingya Yu3†Yunyu Zhou4Yu Zhang1,3Guangman Wang1,3Fangmin Zhang5Grace Paka Lubamba5,6
 Xiaoqin Bi1,3*‡
- 1State Key Laboratory of Oral Diseases & National Center for Stomatology & National Clinical Research Center for Oral Diseases & Department of Orthognathic and Temporomandibular Joint (TMJ) Surgery, West China Hospital of Stomatology, Sichuan University, Chengdu, China
- 2Department of Hepatobiliary, Chongqing Fuling Hospital, School of Medicine, Chongqing University, Chongqing, China
- 3West China School of Nursing, Sichuan University, Chengdu, China
- 4School of Stomatology, North Sichuan Medical College, Nanchong, Sichuan, China
- 5State Key Laboratory of Oral Diseases & National Center for Stomatology & National Clinical Research Center for Oral Diseases & Department of Head and Neck Oncology, West China Hospital of Stomatology, Sichuan University, Chengdu, China
- 6Department of Oral and Maxillofacial Surgery, University Clinics of Kinshasa, Faculty of Dental Medicine, University of Kinshasa, Kinshasa, Democratic Republic of Congo
Background: Postoperative malnutrition, which significantly affects recovery and overall quality of life, is a critical concern for patients with oral cancer. Timely identification of patients at nutritional risk is essential for implementing appropriate interventions, thereby improving postoperative outcomes.
Methods: This prospective study, which was conducted at a tertiary hospital in China between August 2023 and May 2024, included 487 postoperative oral cancer patients. The dataset was divided into a training set (70%) and a validation set (30%). Predictive models were developed via four supervised machine learning algorithms: logistic regression (LR), support vector machine (SVM), light gradient boosting machine (LGBM), and extreme gradient boosting (XGBoost). Nutritional risk was assessed via the Nutritional Risk Screening 2002 (NRS-2002) tool and diagnosed via the Global Leadership Initiative on Malnutrition (GLIM) criteria. Model performance was evaluated on the basis of discrimination, calibration, and clinical applicability, with SHAP analysis used for interpretability. Statistical analysis was conducted via R software, with appropriate tests for continuous and categorical variables.
Results: Of the 487 oral cancer patients, 251 (51.54%) experienced postoperative malnutrition. The study cohort was split into a training set comprising 340 patients and a validation set comprising 147 patients. Seven key predictors were identified, including sex, T stage, repair and reconstruction, diabetes status, age, lymphocyte count, and total cholesterol (TC) level. The XGBoost model demonstrated an area under the curve (AUC) of 0.872 (95% CI: 0.836–0.909) in the training set and 0.840 (95% CI: 0.777–0.904) in the validation set. Calibration curves confirmed the model’s robust fit, and decision curve analysis (DCA) indicated substantial clinical benefit.
Conclusion: This study represents the first development of an XGBoost-based model for predicting postoperative malnutrition in patients with oral cancer. The integration of SHAP for model interpretability, along with the creation of an intuitive web tool, enhances the model’s clinical applicability. This approach can significantly reduce malnutrition-related complications and improve recovery outcomes for oral cancer patients.
1 Introduction
Oral cancer ranks among the most prevalent malignant tumors in the head and neck region (1), encompassing cancers that develop at various anatomical sites, including the tongue, cheeks, gums, hard palate, and floor of the mouth (2). According to global statistics, approximately 377,000 new cases of oral cancer are diagnosed globally each year, with approximately 50,000 of these cases occurring in China (3). Surgical intervention remains the primary treatment for oral cancer. However, owing to the unique anatomical location of the tumor, the metabolic changes associated with malignancy, and the functional impairments following surgery, patients are particularly vulnerable to malnutrition postoperatively. This condition is often compounded by nutrition-related symptoms, which can significantly affect the quality of life of oral cancer patients following surgery (4, 5).
Malnutrition is a critical concern among patients with head and neck cancer (HNC), with studies indicating that 46–49% of these individuals face a significantly greater risk of severe malnutrition than do those with other malignancies (6). The global burden of oropharyngeal cancer continues to rise, and malnutrition, along with associated nutritional deficiencies, represents a major contributor to the disease burden in patients with head and neck tumors (7). Postoperative malnutrition, in particular, is strongly associated with prolonged hospital stays, higher complication rates, diminished treatment efficacy, and delayed recovery among oral cancer patients (8–10). To address these challenges, effective nutritional risk screening and assessment are therefore essential components of perioperative care, forming the foundation of comprehensive nutritional support therapy. Timely identification of patients at high nutritional risk, combined with early nutritional interventions, can significantly enhance postoperative recovery and improve clinical outcomes.
Recent advancements in artificial intelligence (AI) technology have accelerated its application in the biomedical field, offering innovative solutions to complex clinical challenges (11). Machine learning (ML) models have demonstrated remarkable accuracy in predicting various diseases and clinical conditions (12). The incorporation of interpretability methods, such as Shapley Additive exPlanations (SHAP), offers valuable insights into the interpretability of prediction results generated by ML models, ensuring transparency and clinical applicability (13). In this study, we aimed to develop and validate an interpretable ML model for the early and precise prediction of postoperative malnutrition risk in patients with oral cancer. Additionally, the model will utilize SHAP to identify and explain the significance of predictive features, enhancing its usability for clinical decision-making. This approach seeks to facilitate efficient nutritional risk management, ultimately improving postoperative outcomes and advancing the quality of care for individuals with oral cancer.
2 Methods
2.1 Study design
A prospective study involving 487 postoperative patients diagnosed with oral cancer from the Department of Head and Neck Oncology was conducted between August 5, 2023, and May 25, 2024, at the West China Hospital of Stomatology. This study employed a cross-sectional design to collect data, ensuring that all patient information was deidentified before being shared with the investigators to maintain confidentiality. To facilitate model development and validation, the dataset was randomly divided into two subsets at a 7:3 ratio: a training set and a validation set. The training set was used to develop predictive models via various machine learning algorithms, whereas the validation set was employed to evaluate the models’ performance. A detailed summary of the study procedures is presented in Figure 1.
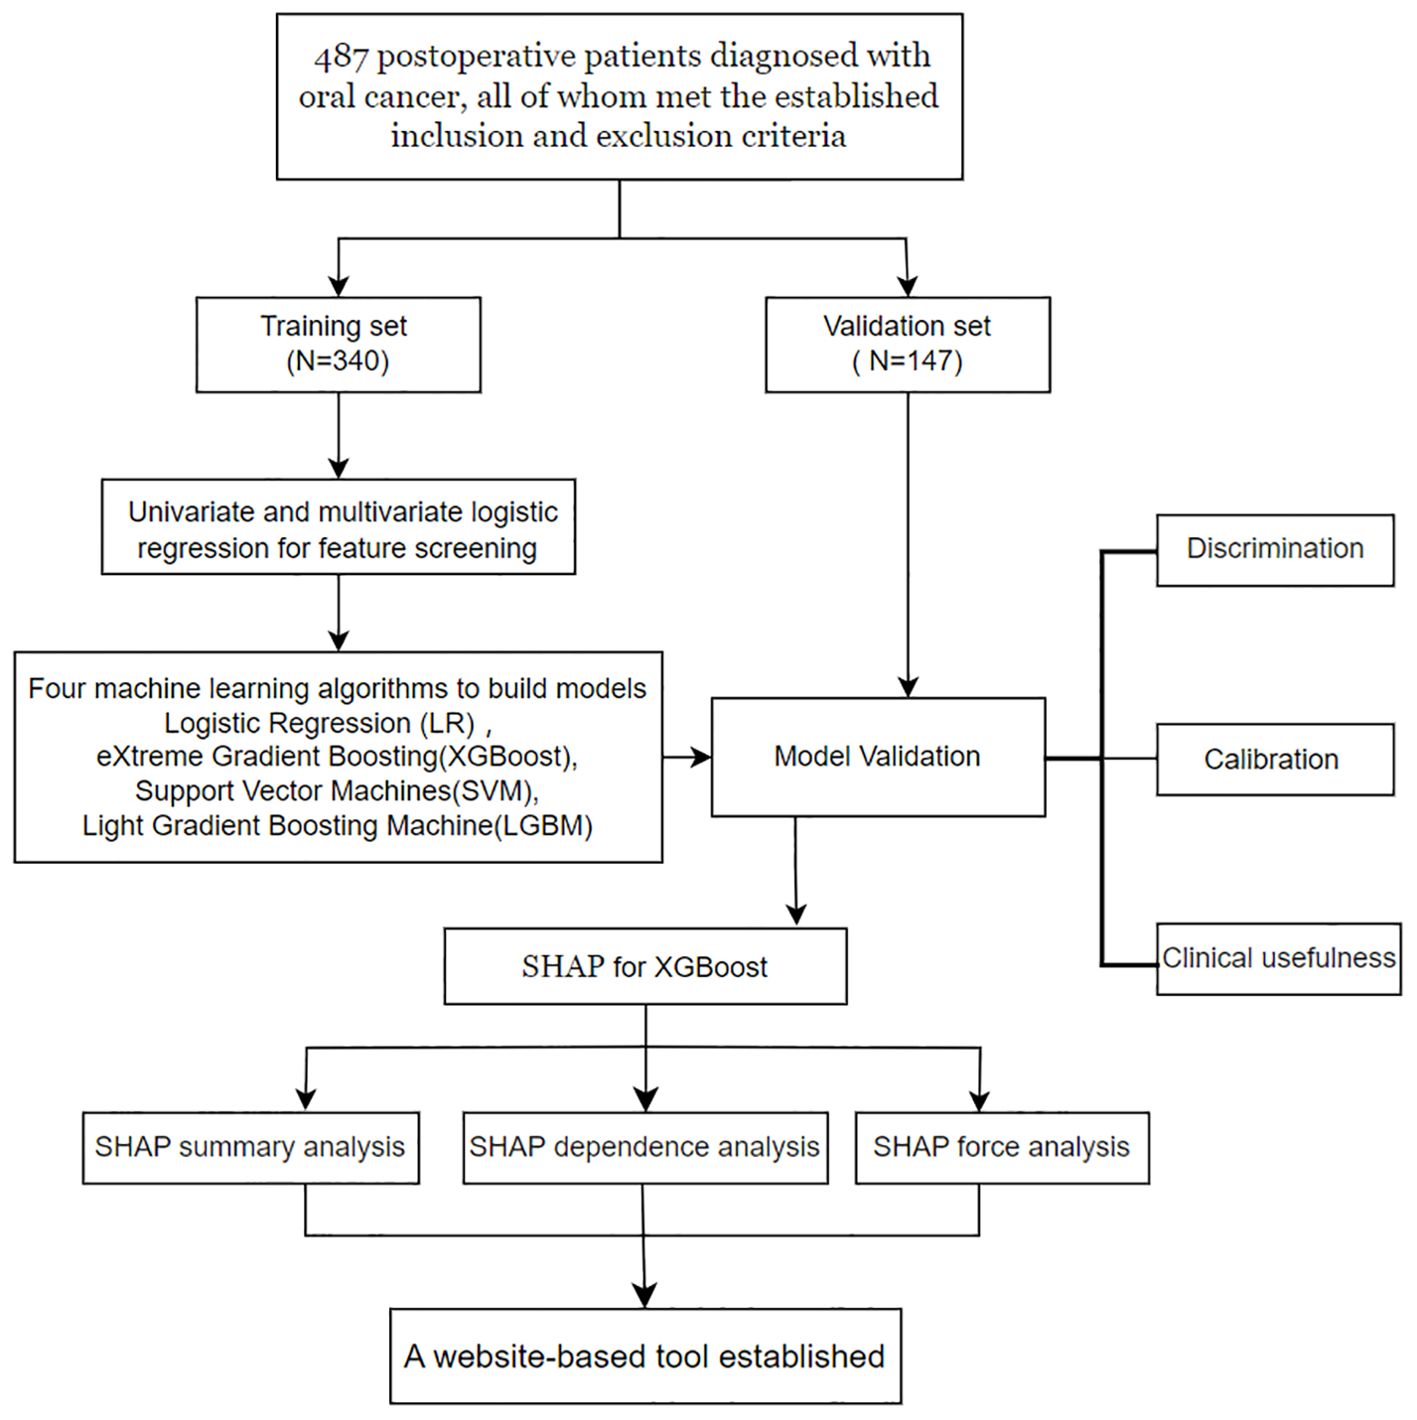
Figure 1. A schematic diagram of model development.
2.2 Study population
This study included 487 postoperative patients who were diagnosed with oral cancer and were selected on the basis of well-defined inclusion and exclusion criteria. The inclusion criteria were as follows: (1) age ≥ 18 years, (2) confirmed pathological diagnosis of oral cancer with surgical treatment, (3) no malnutrition risk identified through preoperative nutritional risk screening, and (4) clear consciousness of the ability to read and understand study-related information. The exclusion criteria were (1) a prior diagnosis of a psychiatric disorder and (2) evidence of preoperative malnutrition.
2.3 Data collection
The clinical data of the participants were collected prospectively by the researchers through a detailed review of medical records. To ensure patient privacy, all the data were processed anonymously before analysis. The collected data included the following: (1) demographic characteristics, including sex, age, and body mass index (BMI); (2) tumor-related details, such as T stage, tumor site, tumor-related factors, and recurrence; (3) surgical information, including procedures such as cervical lymphatic dissection, repair and reconstruction, and tracheotomy; (4) participants’ medical history, including smoking, alcohol use, hypertension, and diabetes; and (5) preoperative laboratory test results, including erythrocyte, leukocyte, neutrophil, monocyte, and lymphocyte levels. All the data were systematically recorded to ensure accuracy and completeness.
2.4 Nutritional risk screening and nutritional assessment
Malnutrition was diagnosed via the Global Leadership Initiative on Malnutrition (GLIM) criteria through a two-step approach (14). On the seventh postoperative day, patients first underwent screening with the Nutritional Risk Screening 2002 (NRS-2002) tool to assess nutritional risk (15). An NRS-2002 total score of less than 3 indicated the absence of nutritional risk, whereas a score of 3 or higher signified the presence of nutritional risk. Patients with an NRS-2002 score ≥ 3 proceeded to the next step of malnutrition diagnosis, which involved evaluating three phenotypic criteria (nonvolitional weight loss, low BMI, and reduced muscle mass) and two etiologic criteria (reduced food intake or assimilation and disease burden or inflammation).
For patients with oral cancer, the disease burden was automatically considered to meet one of the etiologic criteria for malnutrition. BMI thresholds were adjusted for age: in patients over 70 years, a BMI below 22 kg/m² was classified as low, whereas for those under 70 years, a BMI below 20 kg/m² indicated low BMI (16). Nonvolitional weight loss was defined as an unintentional reduction in body weight exceeding 5% within the preceding six months or more than 10% over a period longer than six months (17). Reduced muscle mass was determined on the basis of grip strength, with cutoff values defined by the Asian Working Group for Sarcopenia: <18 kg for females and <26 kg for males (18). Patients were diagnosed with GLIM-defined malnutrition if they met at least one phenotypic criterion and one etiologic criterion.
2.5 Model training and performance evaluation
Using random sampling techniques, patients were divided into a training set and a validation set at a ratio of 7:3. Four representative supervised machine learning algorithms were employed to construct predictive models: logistic regression (LR), support vector machine (SVM), light gradient boosting machine (LGBM), and extreme gradient boosting (XGBoost). These algorithms were selected for their demonstrated effectiveness in handling structured clinical datasets and their complementary strengths in model performance.
The evaluation of the model’s performance is conducted based on three essential indicators: model discrimination, calibration, and clinical utility. After identifying the optimal model, techniques such as SHAP summary analysis, SHAP dependence analysis, and SHAP force analysis were utilized to conduct a comprehensive examination of the model’s output results from both global and local perspectives.
2.6 Statistical analysis
Data analysis was performed via R software, version 4.4.2. Continuous variables are summarized as the means with standard deviations or medians with interquartile ranges, depending on the distribution of the data. Continuous variables were compared via either an independent-sample t test for normally distributed data or a Mann–Whitney U test for nonnormally distributed data. Categorical variables are presented as counts and percentages, with group comparisons made via either a chi-square test or Fisher’s exact test.
2.7 Ethical considerations
All procedures involving human participants were conducted according to the ethical standards outlined in the 1964 Helsinki Declaration and its subsequent amendments or equivalent ethical guidelines. Ethical approval for the study, including the acquisition of information from electronic medical records, was granted by the West China Hospital of Stomatology Ethics Committee (Grant Number: WCHSIRB-D-2024-107). Informed consent was obtained from all participants before their inclusion in the study.
3 Results
3.1 Characteristics of the study sample
A total of 487 oral cancer patients were included in this study, of whom 251 (51.54%) were identified as experiencing postoperative malnutrition, whereas 236 (48.46%) did not exhibit signs of malnutrition. The cohort included 282 males (58.0%) and 205 females (42.0%), with a median age of 61 years. For model development and validation, the study population was divided into a training set of 340 patients and a validation set of 147 patients. The distributions of malnourished and normally nourished patients were comparable between the two sets: 174 (51%) malnourished versus 166 (49%) normally nourished in the training set and 77 (52%) malnourished versus 70 (48%) normally nourished in the validation set. The detailed demographic and clinical characteristics of these subsets are presented in Table 1.
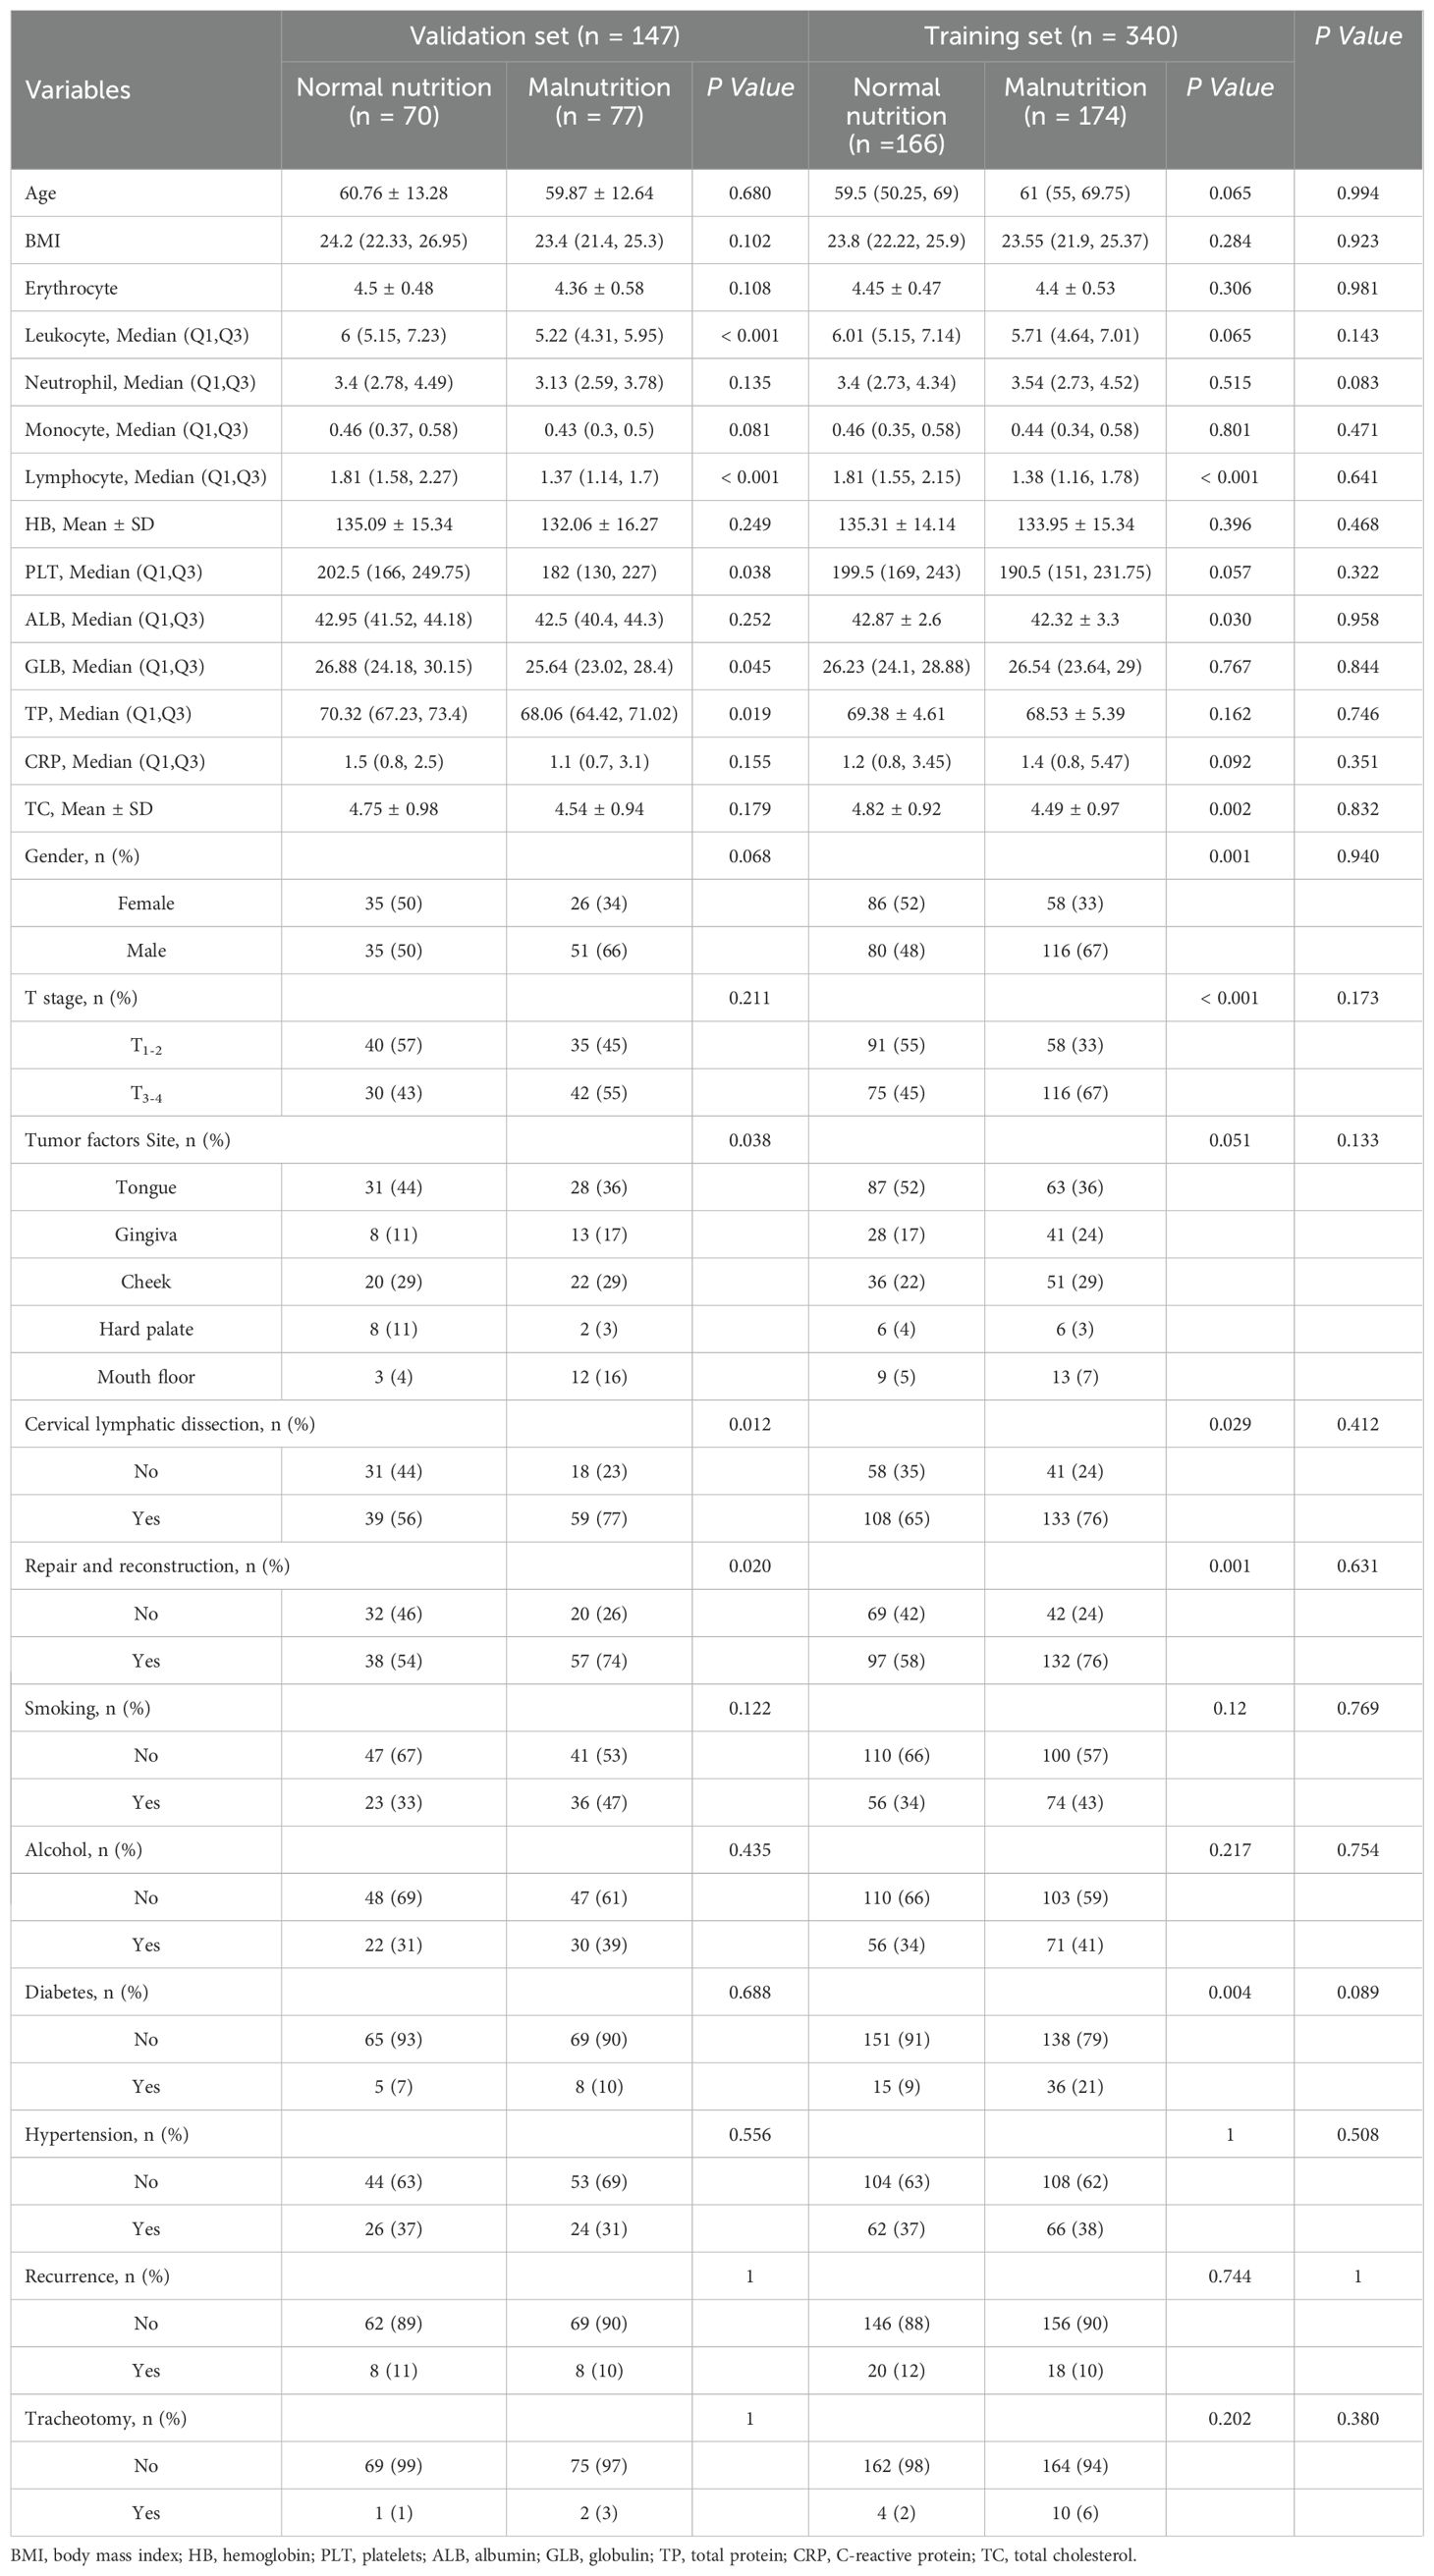
Table 1. Comparison of the training set and validation set.
3.2 Univariate and multivariate regression analyses
In the training set, predictors were initially analyzed via univariate logistic regression. Variables with statistical significance (p < 0.1) were subsequently incorporated into a stepwise multivariate regression model. Based on the Akaike Information Criterion (AIC), the predictive factors to be included in the model were selected. This criterion aims to minimize the AIC, allowing variables with P > 0.05 to be included, thereby ensuring the best balance between model complexity and goodness of fit. Ultimately, seven characteristic variables were identified as the key predictive factors for constructing the machine learning model. These variables included sex, T stage, repair and reconstruction, diabetes status, age, lymphocyte count, and total cholesterol (TC) level, as presented in Table 2.
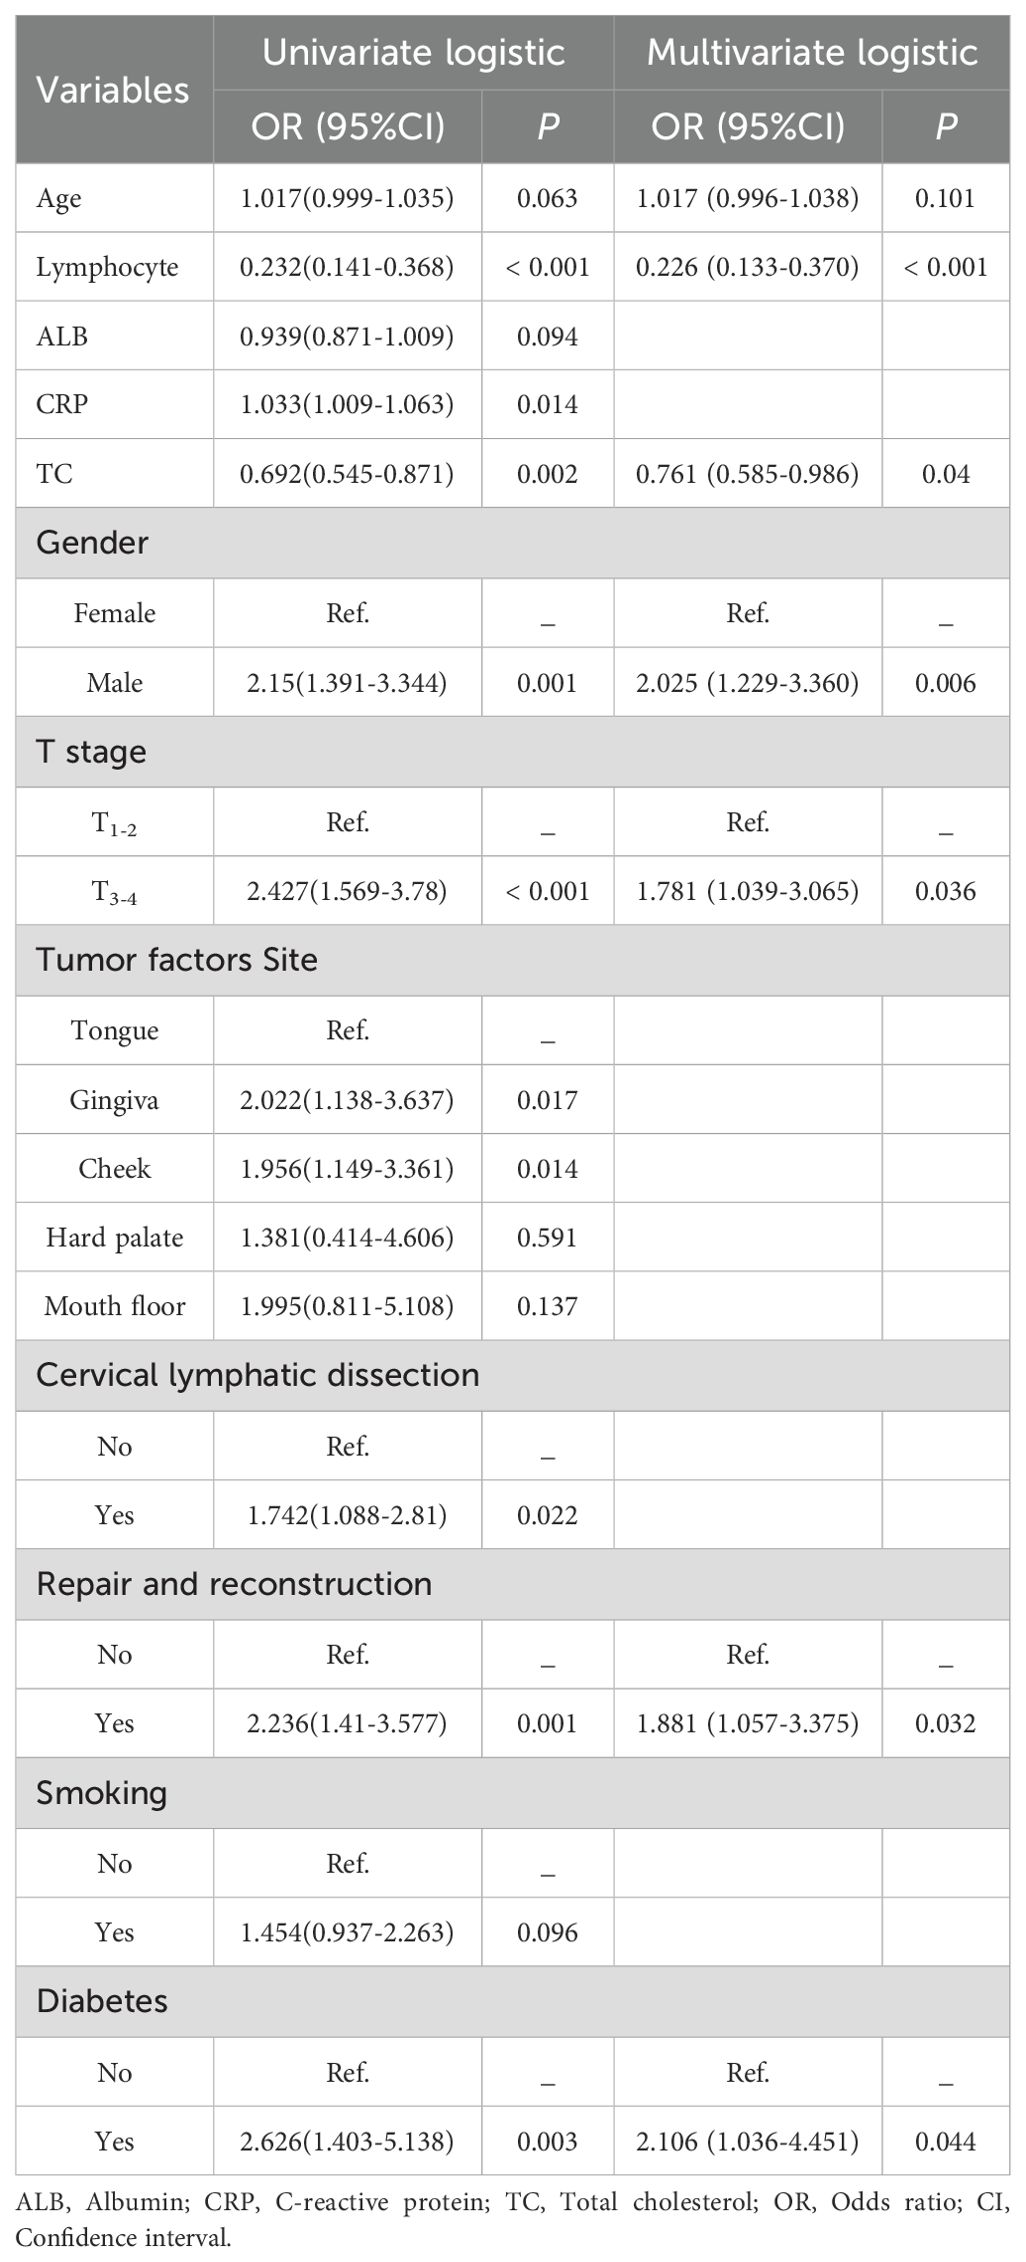
Table 2. Univariate and multivariate logistic regression analyses.
3.3 Comparative analysis of multiple models and validation of the optimal model
After the required feature variables for modeling were selected, four supervised machine learning algorithms, namely, LR, SVM, LGBM, and XGBoost, were employed to analyze the training set data. The predictive performance of the four models was thoroughly assessed from three perspectives: discrimination, calibration, and clinical utility.
Discrimination refers to the model’s capacity to accurately classify patients into low-risk and high-risk categories. In this study, a variety of indicators were employed to assess the classification performance of the model, including the receiver operating characteristic (ROC) curve, area under the curve (AUC), accuracy, specificity, precision, sensitivity, and F1 score. Based on the ROC curves of four different machine learning prediction models, the XGBoost model achieves the highest performance, with an AUC of 0.872 [95% confidence interval (CI): 0.836−0.909] on the training set and 0.840 (95% CI: 0.777–0.904) on the validation set (Figures 2A, B). Table 3 provides a comprehensive analysis of the discrimination evaluation metrics for four machine learning models, evaluated on both the training set and the validation set.
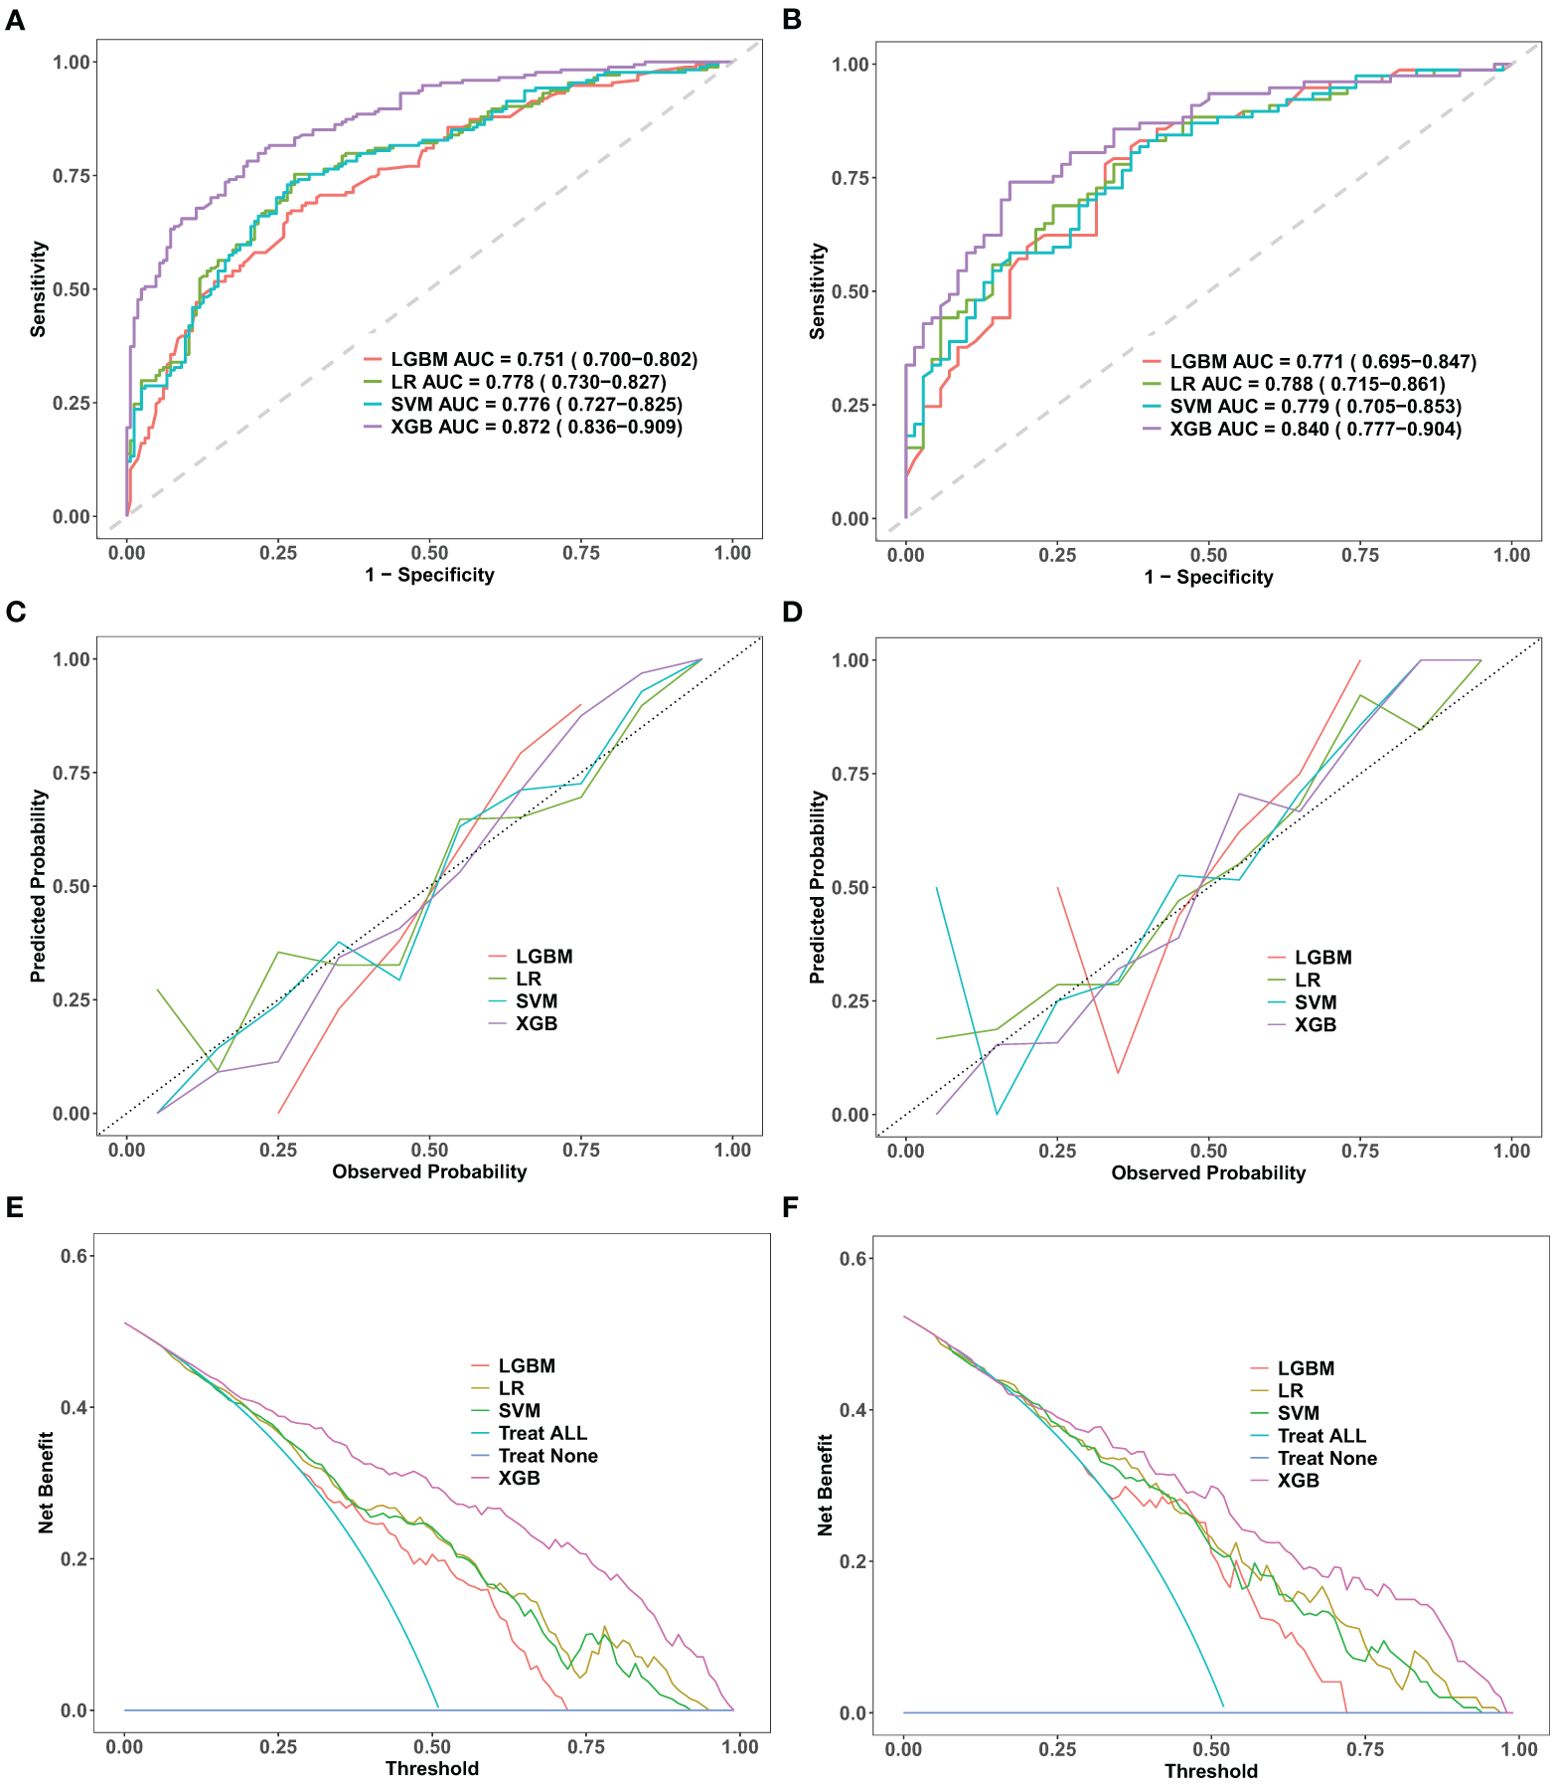
Figure 2. Comparative performance evaluation of machine learning models. Performance evaluation of four machine learning models—logistic regression (LR), support vector machine (SVM), light gradient boosting machine (LGBM), and extreme gradient boosting (XGBoost)—in the training and validation datasets. (A, B): ROC curves with AUC values, showing XGBoost’s superior discriminative performance. (C, D): Calibration curves indicating a strong fit and robust generalization for XGBoost. (E, F): DCA curves demonstrating XGBoost’s net clinical benefit. ROC, receiver operating characteristic; DCA, decision curve analysis; AUC, area under the curve; LR, logistic regression; SVM, support vector machine; LGBM, light gradient boosting machine; XGBoost, extreme gradient boosting.
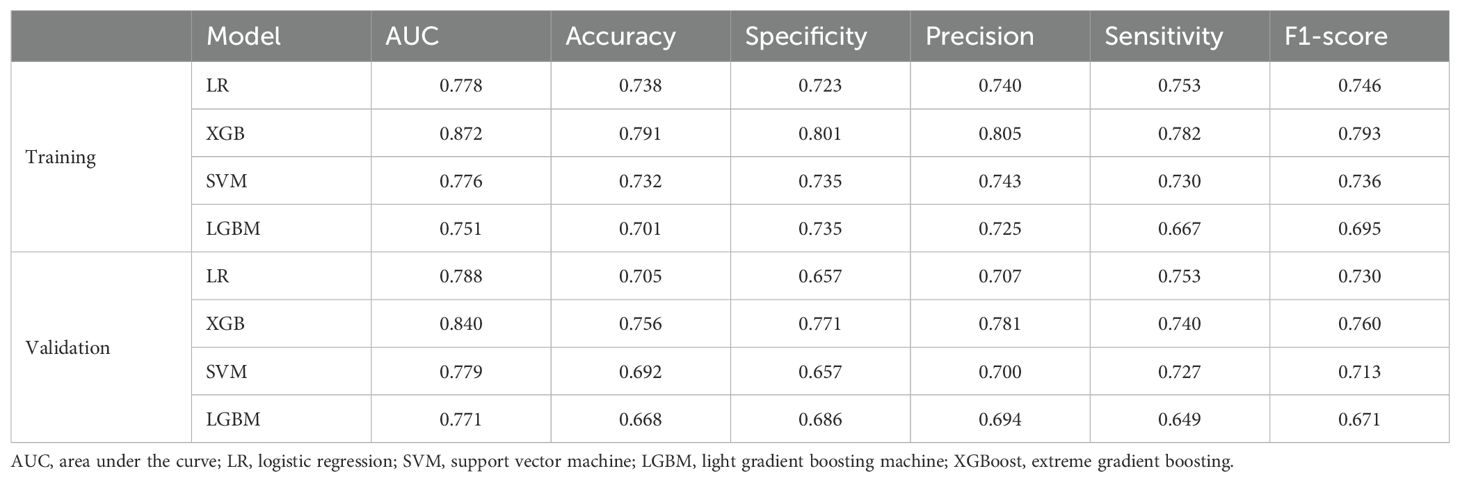
Table 3. Model discrimination assessment.
The calibration curve is employed to evaluate the consistency between the actual occurrence probabilities of postoperative malnutrition outcomes in oral cancer patients, as observed in both the training and validation sets, and the predicted probabilities generated by various models. Among these models, the calibration curve for the XGBoost model closely aligns with the ideal line, indicating that this model demonstrates the highest degree of correspondence between its predicted probabilities and actual outcomes (Figures 2C, D).
Under the condition of equivalent diagnostic efficacy, decision curve analysis (DCA) conducted on the training and validation sets of XGBoost provided a substantial net benefit for clinical decision-making across a wide range of threshold probabilities (Figures 2E, F). In the validation set, when the prediction threshold was established within the range of 0.2 to 0.98, the DCA results for the XGBoost model did not intersect with either of the two extreme curves. This finding suggests that, in comparison to strategies involving complete intervention or total non-intervention, the XGBoost model is capable of delivering greater net benefits across a wider spectrum of thresholds. Consequently, this further underscores its potential advantages in clinical practice. Therefore, we conclude that the XGBoost algorithm is the optimal model for this dataset, offering strong predictive accuracy and clinical applicability.
3.4 Model explanation and clinical significance analysis
To clarify the clinical significance of the XGBoost model, we used the SHAP method to elucidate its prediction process and results. Identify and elucidate the significance of predictive features through SHAP to improve its applicability in clinical decision-making. Two levels of explanations were provided: global explanations, which describe the overall functionality of the model, and local explanations, which interpret individual predictions.
The global explanation, illustrated by the SHAP summary in Figure 3A. The Bee Warm Map, provided by SHAP, is a visualization tool that illustrates the significance and influence of variables in a dataset. Each point on the map represents the SHAP value for a specific sample, allowing analysis of variable importance, effect directionality, and predictive accuracy. The Y-axis shows the average impact of these variables on model predictions, with rows organized for better visibility. The most critical variables are at the top. For the XGBoost postoperative malnutrition risk prediction model for oral cancer, feature importance ranks as follows: lymphocytes, age, free flap transplantation repair surgery, gender, tumor T stage, total cholesterol, and history of diabetes. The X-axis displays SHAP values quantifying each variable’s contribution to model predictions.
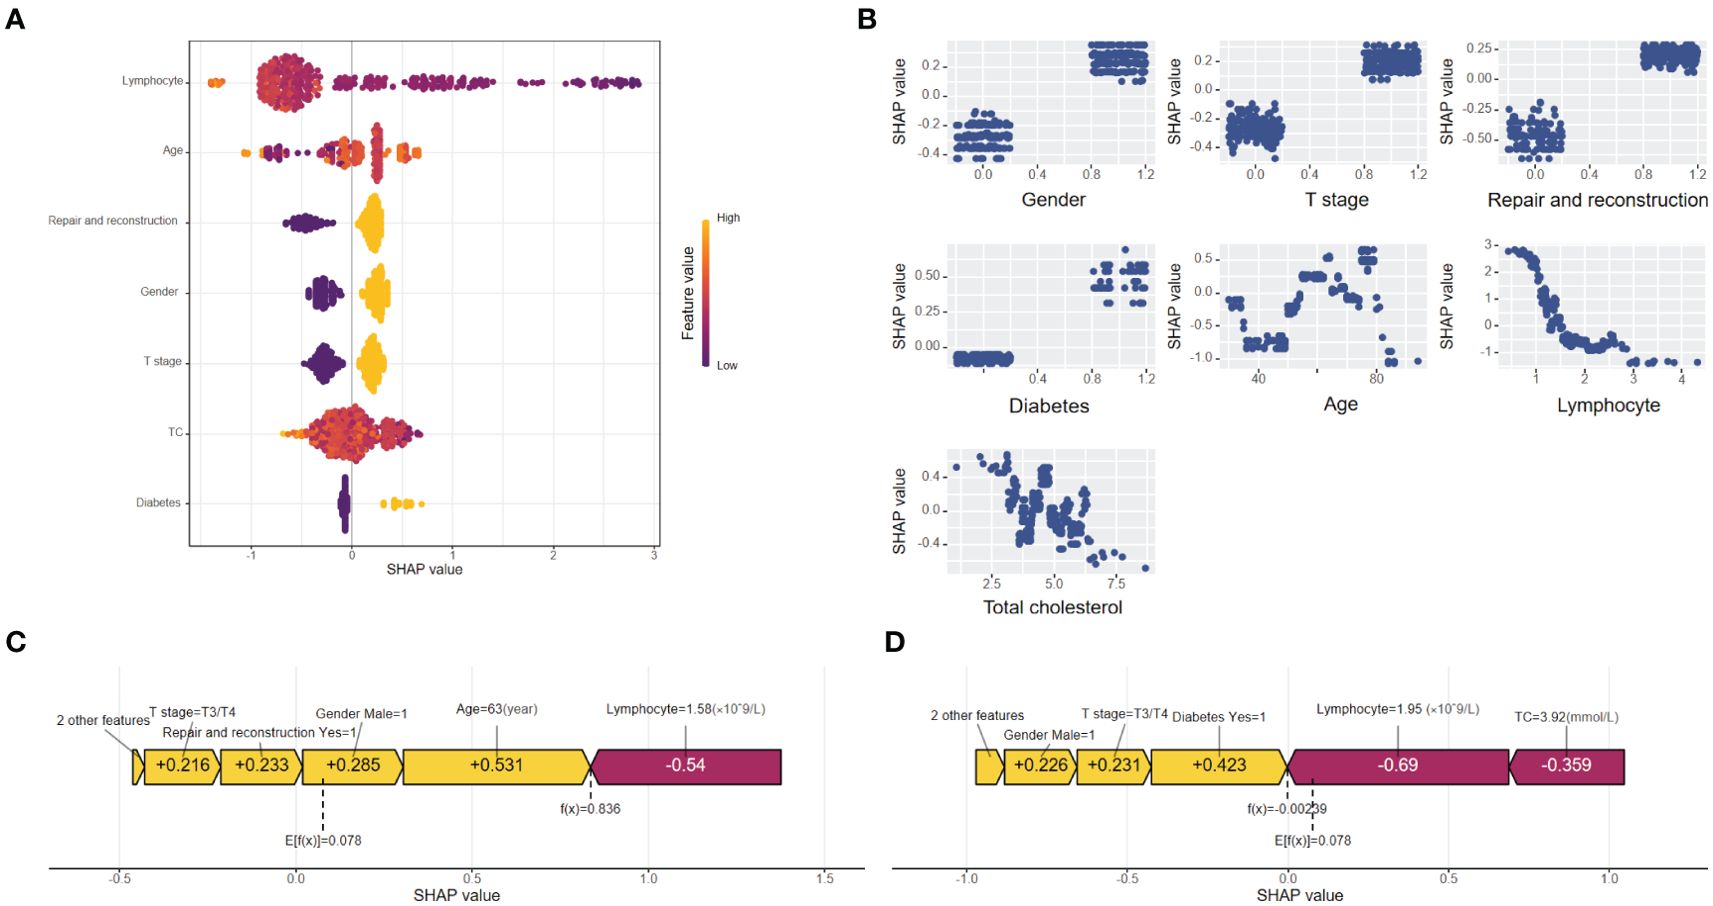
Figure 3. (A) Importance chart of the SHAP variables. The SHAP beeswarm plot ranks feature importance in the XGBoost model on the basis of average SHAP values. Lymphocyte count, age, and repair and reconstruction are the top predictors of postoperative malnutrition, with feature values indicated by color gradients (yellow for high, purple for low). (B) Dependence plot of the SHAP variables. The SHAP dependence plot delineates the marginal effects of seven features on the predictive outcomes of the machine learning model, emphasizing the relationship between malnutrition and its predictors. (C) SHAP force plot for a "true positive" patient. SHAP force plot for a "true positive" patient with a SHAP value of 0.836, above the baseline (E[f(x)] = 0.078). Positive contributions (yellow) from age, sex, and repair and reconstruction drive the prediction of malnutrition, whereas negative contributions (red) from lymphocyte levels reduce it. (D) SHAP force plot for a "true negative" patient. SHAP force plot for a "true negative" patient with a SHAP value of 0.00239, below the baseline (E[f(x)] = 0.078). Negative contributions (red) from lymphocyte levels and total cholesterol drive the prediction of no malnutrition, with minor positive contributions (yellow) from diabetes and sex.
Figure 3B shows a SHAP dependence plot that visualizes the impact of seven predictors on the XGBoost model’s predictions. The X-axis represents feature values, while the Y-axis displays SHAP values, which quantify each feature’s significance in relation to the prediction outcome. This plot clearly indicates whether a predictor has a positive or negative effect on predictions. A positive SHAP value suggests an increased likelihood of postoperative malnutrition, whereas a negative value indicates a decreased probability.
Local explanations were visualized via SHAP force plots to analyze individual patient predictions. In the XGBoost model, E[f(x)] represents the average predicted value and serves as the SHAP reference. Higher SHAP values indicate a greater likelihood of postoperative malnutrition. The color bar in the force plots reflects the feature contribution intensity: red (left arrow) signifies a negative impact (reduced SHAP value), whereas yellow (right arrow) denotes a positive impact (increased SHAP value). Figure 3C shows a “true positive” patient with a SHAP value of 0.836, above baseline, indicating malnutrition. Figure 3D depicts a “true negative” patient with a SHAP value of 0.00239, below baseline, indicating no malnutrition.
3.5 Implementation of the web calculator
As shown in Figure 4, the final prediction model was deployed as a web-based application to facilitate its use in clinical settings. By entering the actual values of the 7 features required for the model, the application automatically predicts the risk of postoperative malnutrition in individual patients with oral cancer. The web application is accessible online at the following link: https://pred-mod.shinyapps.io/XGBoost/.
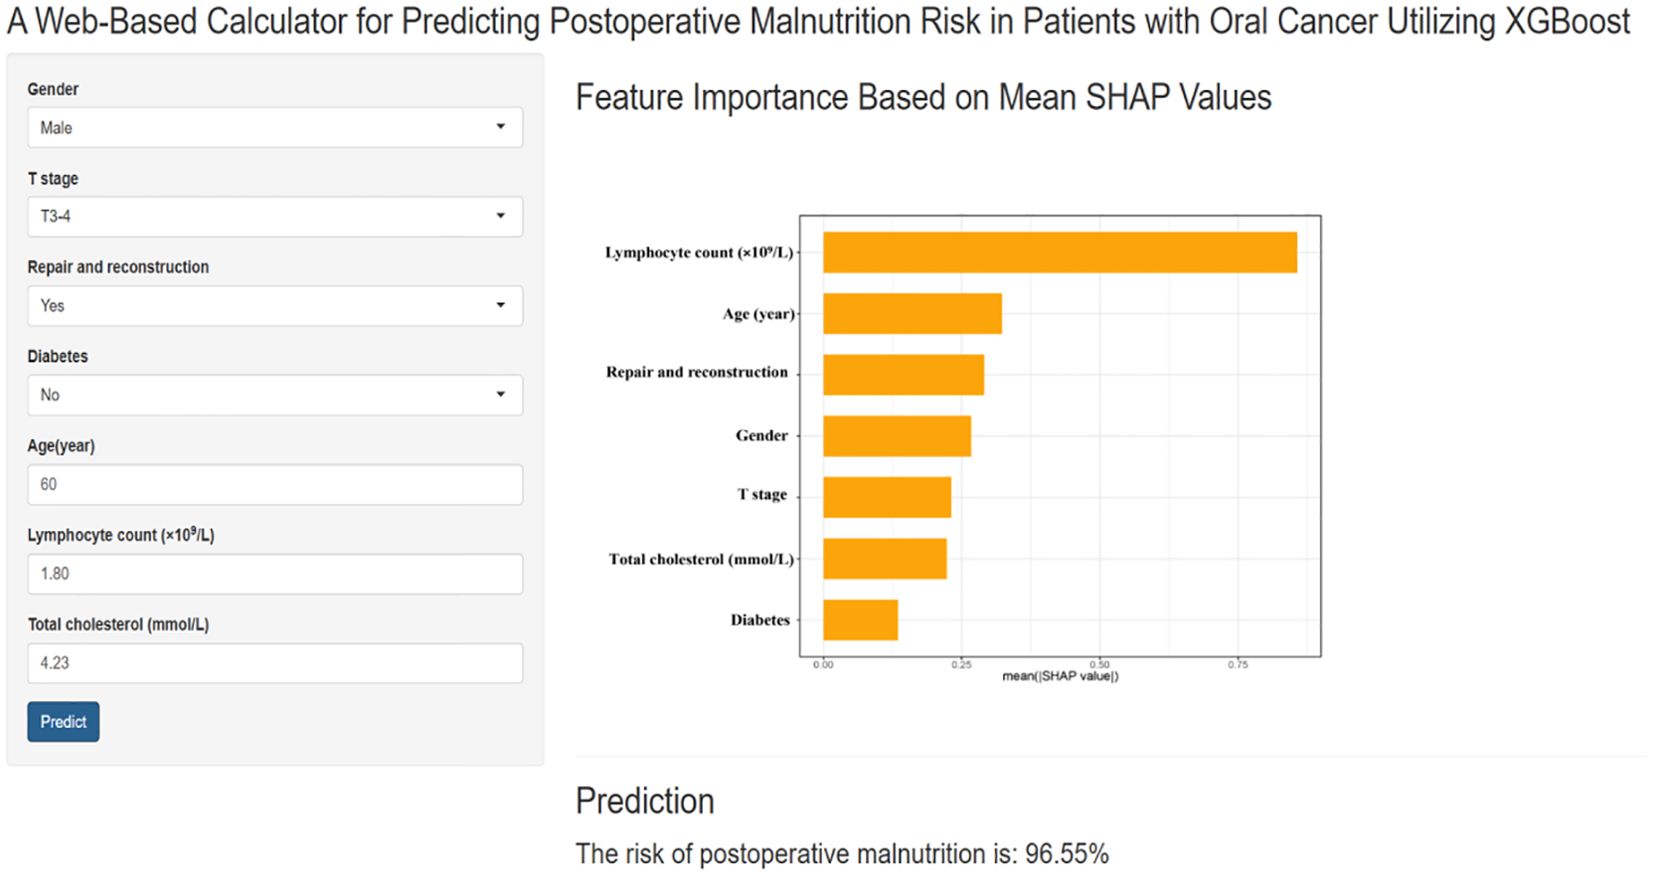
Figure 4. A website-based tool for predicting postoperative malnutrition risk in oral cancer. Web-based tool for predicting postoperative malnutrition risk in oral cancer patients. The application, developed via the final prediction model, allows users to input the seven required features and automatically predicts the risk of malnutrition. The feature importance is displayed on the basis of the mean SHAP values, and the prediction result is shown with a calculated malnutrition risk of 96.95%.
4 Discussion
Malnutrition significantly impacts both survival rates and quality of life in patients with oral cancer, serving as a major contributor to postoperative complications and mortality (19, 20). Previous studies have reported that the incidence of postoperative malnutrition in patients with oral cancer ranges from 37.3% to 60.68% (21, 22), findings that closely align with the results of this study. These data suggest that individuals with oral cancer are particularly vulnerable to malnutrition and face an elevated risk of developing nutritional deficiencies following surgical intervention. Therefore, clinical practitioners need to strengthen dynamic screening and assessment of nutritional risk in postoperative patients, ensuring timely identification of at-risk individuals and providing adequate nutritional support (23).
The traditional methods for nutritional screening are based on complex scales. While these approaches are beneficial, they contribute to an increased clinical workload and can only evaluate a patient’s current nutritional status without forecasting the risk of postoperative malnutrition (22, 24). This study utilizes the GLIM diagnostic criteria as a tool to assess postoperative malnutrition outcomes in patients with oral cancer, and it develops a risk prediction model employing machine learning algorithms. The findings indicate that the XGBoost model exhibits optimal performance, demonstrating high clinical utility by effectively predicting the likelihood of postoperative malnutrition in oral cancer patients. This provides a crucial foundation for the early identification of high-risk individuals and the implementation of targeted nutritional interventions. Therefore, developing and integrating predictive tools into clinical practice holds significant potential for enhancing patient outcomes and reducing the burden of malnutrition in this high-risk population.
In this study, we developed and evaluated four ML models for predicting postoperative malnutrition in patients with oral cancer. The models were assessed on the basis of their discrimination ability, accuracy, and clinical applicability. Ultimately, we successfully developed and validated a robust ML-based predictive model for postoperative malnutrition. This model utilized only preoperative and intraoperative data, which are readily accessible, allowing for the early identification of patients at risk of surgical malnutrition. We employed the SHAP method to generate feature density scatter plots and importance rankings on the basis of SHAP values to increase the interpretability and usability of the model in clinical settings. These visualizations clarify the contributions of individual features to the risk of malnutrition. SHAP force plots further demonstrated the predictive results for individual patients in the training set, making the model more transparent and clinically relevant. Additionally, we developed a user-friendly website-based application to support the practical implementation of this tool, enabling clinicians to assess the risk of postoperative malnutrition and guide interventions efficiently.
The XGBoost model developed in this study incorporated seven key predictive variables: lymphocyte count, age, repair and reconstruction status, sex, T stage, total cholesterol, and diabetes status. Among these factors, the lymphocyte count has emerged as a crucial indicator of nutritional status and immune function and serves as a prognostic factor in head and neck cancer patients because of its role in antitumor and immune responses (25, 26). Aging further exacerbates malnutrition risk by impairing physiological and immune functions, making elderly oral cancer patients particularly vulnerable to postoperative malnutrition (27), a finding that is consistent with prior research (21, 28). Additionally, surgical trauma from tumor resection and subsequent repair significantly compromise eating function, prolong recovery, and reduce oropharyngeal efficiency, contributing to the risk of malnutrition (29, 30). Our findings highlight the need for targeted nutritional support for high-risk patients undergoing surgical treatment (23, 31). Furthermore, sex differences play a role in malnutrition risk, with male patients showing greater susceptibility than females do, which is consistent with previous research (32–34). The T stage of a tumor reflects its development, with advanced stages associated with larger tumors, more extensive surgeries, and an increased risk of malnutrition. Thus, the T stage independently affects both the postoperative prognosis and nutritional status of oral cancer patients (28, 35).
Additionally, our study revealed a significant association between low preoperative total cholesterol levels and postoperative malnutrition. This may be due to cholesterol’s role in cell membrane structure, signal transduction, nutrient absorption, glucose metabolism, and stress response (36, 37). Previous studies indicate that cholesterol metabolism affects dietary intake (38); individuals with higher preoperative total cholesterol have a lower risk of postoperative malnutrition (39). Additionally, the preoperative total cholesterol level is associated with the prognosis of oral cancer patients (40), highlighting its potential as an indicator for assessing postoperative nutritional status and predicting clinical outcomes. Diabetes is another critical predictor, as patients with diabetes are more likely to experience stress-related metabolic disruptions following surgery, further increasing their risk of malnutrition (41). These findings highlight the critical need to integrate multiple clinical variables, including preexisting comorbidities, into predictive models to facilitate the early identification of patients at risk of malnutrition (42).
This study conducted a comprehensive literature review to summarize the key influencing factors associated with postoperative malnutrition in patients with oral cancer, as identified in prior research. Given the challenges related to identifying predictive factors, cost-effectiveness, clinical applicability, and operability, we ultimately selected and included 23 potential variables for further analysis. Based on these variables, a survey instrument was developed. Following established guidelines for developing machine learning prediction models (43) and employing appropriate statistical methods, we refined our selection to seven clinically accessible and objectively reliable variables as predictive factors. This refinement facilitated the construction of four distinct machine learning prediction models. Among these models, the XGBoost model exhibited superior performance by effectively predicting the risk of postoperative malnutrition in patients with oral cancer. The model demonstrated excellent and stable predictive capabilities across both training and testing datasets, indicating its robust generalization ability. Utilizing the XGBoost model, we created a web-based calculator designed to predict the risk of postoperative malnutrition in patients with oral cancer. This tool not only aids in early identification of high-risk individuals but also enables precise nutritional interventions and effective clinical risk management strategies.
This study has several limitations. First, the XGBoost model was trained and validated on data from a single center, which may raise concerns regarding its generalizability to other centers or regions. In particular, regional and ethnic variations in nutritional status, dietary habits, healthcare access, and other socio-economic factors can significantly influence the accuracy and applicability of the model. However, the model incorporates objective variables and indicators, enhancing its reliability and potential for broader applicability. Second, the study focused primarily on predicting short-term malnutrition risk in oral cancer patients following surgery, without addressing long-term changes in nutritional status postintervention. To address these limitations, future research should focus on external validation across diverse geographic and ethnic populations to assess the model’s robustness and adaptability. Additionally, adopting a longitudinal design will allow for the monitoring of nutritional status over time post-surgery, enabling a more comprehensive understanding of malnutrition risk. This will help refine the model’s performance and enhance its clinical applicability, providing a strong foundation for future implementation in clinical environments.
5 Conclusions
We developed the XGBoost machine learning model to predict the risk of malnutrition in patients with oral cancer following surgery. To enhance interpretability, we employed the SHAP method and created a web interface for ease of use by clinical staff. By leveraging this model to assess malnutrition risk during the early postoperative phase and implementing targeted nutritional strategies, we aim to enhance the postoperative nutritional status of patients diagnosed with oral cancer and to facilitate their recovery.
Data availability statement
The datasets presented in this study can be found in online repositories. The names of the repository/repositories and accession number(s) can be found in the article/supplementary material.
Ethics statement
All procedures involving human participants were conducted in accordance with the ethical standards outlined in the 1964 Helsinki Declaration and its subsequent amendments or equivalent ethical guidelines. Ethical approval for the study, including the acquisition of information from electronic medical records, was granted by the West China Hospital of Stomatology Ethics Committee (Grant Number: WCHSIRB-D-2024-107). Informed consent was obtained from all participants prior to their inclusion in the study.
Author contributions
LXK: Data curation, Formal analysis, Methodology, Writing – original draft. JYY: Data curation, Software, Supervision, Writing – original draft. YYZ: Formal analysis, Software, Writing – review & editing. YZ: Formal analysis, Software, Writing – review & editing. GMW: Data curation, Supervision, Writing – review & editing. FMZ: Data curation, Supervision, Writing – review & editing. GPL: Data curation, Supervision, Writing – review & editing. XQB: Conceptualization, Funding acquisition, Supervision, Writing – review & editing.
Funding
The author(s) declare that financial support was received for the research and/or publication of this article. This work was supported by the Sichuan Science & Technology Project [Grant number 2022JDKP0007] and the Medical Research Project of the Chengdu Health Commission [Grant number 2022015]. Medical Research Topic in Sichuan Province [Grant number S23099].
Acknowledgments
We would like to thank the staff of the Department of Head and Neck Oncology for their support and the patients who contributed clinical data to this study.
Conflict of interest
The authors declare that the research was conducted in the absence of any commercial or financial relationships that could be construed as a potential conflict of interest.
Generative AI statement
The author(s) declare that no Generative AI was used in the creation of this manuscript.
Publisher’s note
All claims expressed in this article are solely those of the authors and do not necessarily represent those of their affiliated organizations, or those of the publisher, the editors and the reviewers. Any product that may be evaluated in this article, or claim that may be made by its manufacturer, is not guaranteed or endorsed by the publisher.
References
1. Siegel RL, Miller KD, Fuchs HE, Jemal A. Cancer statistics, 2022. CA Cancer J Clin. (2022) 72:7–33. doi: 10.3322/caac.21708
2. Borggreven PA, Aaronson NK, Verdonck-de Leeuw IM, Muller MJ, Heiligers ML, Bree R, et al. Quality of life after surgical treatment for oral and oropharyngeal cancer: a prospective longitudinal assessment of patients reconstructed by a microvascular flap. Oncol. (2007) 43:1034–42. doi: 10.1016/j.oraloncology.2006.11.017
3. Sung H, Ferlay J, Siegel RL, Laversanne M, Soerjomataram I, Jemal A, et al. Global cancer statistics 2020: GLOBOCAN estimates of incidence and mortality worldwide for 36 cancers in 185 countries. CA Cancer J Clin. (2021) 71:209–49. doi: 10.3322/caac.21660
4. Jehn P, Spalthoff S, Lentge F, Zeller AN, Tavassol F, Neuhaus MT, et al. Postoperative quality of life and therapy-related impairments of oral cancer in relation to time-distance since treatment. J Cancer Surviv. (2022) 16:1366–78. doi: 10.1007/s11764-021-01118-3
5. Matsuda Y, Okui T, Karino M, Aoi N, Okuma S, Hayashida K, et al. Postoperative oral dysfunction following oral cancer resection and reconstruction: A preliminary cross-sectional study. Oncol. (2021) 121:105468. doi: 10.1016/j.oraloncology.2021.105468
6. Pressoir M, Desné S, Berchery D, Rossignol G, Poiree B, Meslier M, et al. Prevalence, risk factors and clinical implications of malnutrition in French Comprehensive Cancer Centres. Br J Cancer. (2010) 102:966–71. doi: 10.1038/sj.bjc.6605578
7. Martinovic D, Tokic D, Puizina Mladinic E, Usljebrka M, Kadic S, Lesin A, et al. Nutritional management of patients with head and neck cancer-A comprehensive review. Nutrients. (2023) 15(8):1864. doi: 10.3390/nu15081864
8. Nett H, Steegmann J, Tollkühn-Prott B, Hölzle F, Modabber A. A prospective randomized comparative trial evaluating postoperative nutritional intervention in patients with oral cancer. Sci Rep. (2022) 12:14213. doi: 10.1038/s41598-022-18292-8
9. Stojanović MZ, Krasić D, Radović P, Trajkovic M, Ćosić A, Petrović V, et al. Nutritional status and quality of life in patients with oral squamous cell carcinoma before and after surgical oncological treatment: A single-center retrospective study. Med Sci Monit. (2024) 30:e943844. doi: 10.12659/MSM.943844
10. Bao X, Liu F, Lin J, Chen Q, Chen L, Chen F, et al. Nutritional assessment and prognosis of oral cancer patients: a large-scale prospective study. BMC Cancer. (2020) 20:146. doi: 10.1186/s12885-020-6604-2
11. Xie LF, Lin XF, Xie YL, Wu QS, Qiu ZH, Lan Q, et al. Development of a machine learning-based model to predict major adverse events after surgery for type A aortic dissection complicated by malnutrition. Front Nutr. (2024) 11:1428532. doi: 10.3389/fnut.2024.1428532
12. Saria S, Butte A, Sheikh A. Better medicine through machine learning: What’s real, and what’s artificial? PloS Med. (2018) 15:e1002721. doi: 10.1371/journal.pmed.1002721
13. Shi H, Yang D, Tang K, Hu C, Li L, Zhang L, et al. Explainable machine learning model for predicting the occurrence of postoperative malnutrition in children with congenital heart disease. Clin Nutr. (2022) 41:202–10. doi: 10.1016/j.clnu.2021.11.006
14. de van der Schueren MAE, Keller H, Cederholm T, Barazzoni R, Compher C, Correia M, et al. Global Leadership Initiative on Malnutrition (GLIM): Guidance on validation of the operational criteria for the diagnosis of protein-energy malnutrition in adults. Clin Nutr. (2020) 39:2872–80. doi: 10.1016/j.clnu.2019.12.022
15. Kondrup J, Allison SP, Elia M, Vellas B, Plauth M. ESPEN guidelines for nutrition screening 2002. Clin Nutr. (2003) 22:415–21. doi: 10.1016/S0261-5614(03)00098-0
16. Yan X, Zhu J, Wang J, Lu Y, Ye X, Sun X, et al. Development and validation of a novel prognostic prediction system based on GLIM-defined malnutrition for colorectal cancer patients post-radical surgery. Front Nutr. (2024) 11:1425317. doi: 10.3389/fnut.2024.1425317
17. Cederholm T, Jensen GL, Correia M, Gonzalez MC, Fukushima R, Higashiguchi T, et al. GLIM criteria for the diagnosis of malnutrition - A consensus report from the global clinical nutrition community. J Cachexia Sarcopenia Muscle. (2019) 10:207–17. doi: 10.1002/jcsm.12383
18. Chen LK, Woo J, Assantachai P, Auyeung TW, Chou MY, Iijima K, et al. Asian working group for sarcopenia: 2019 consensus update on sarcopenia diagnosis and treatment. J Am Med Dir Assoc. (2020) 21:300–7.e2. doi: 10.1016/j.jamda.2019.12.012
19. Barrios R, Tsakos G, García-Medina B, Martínez-Lara I, Bravo M. Oral health-related quality of life and malnutrition in patients treated for oral cancer. Support Care Cancer. (2014) 22:2927–33. doi: 10.1007/s00520-014-2281-5
20. Guo CB, Ma DQ, Zhang KH, Hu XH. Relation between nutritional state and postoperative complications in patients with oral and maxillofacial Malignancy. Br J Maxillofac Surg. (2007) 45:467–70. doi: 10.1016/j.bjoms.2006.11.014
21. Luo T, Xu M. Construction of a risk nomogram model of postoperative malnutrition in patients with oral cancer. J Clin Med Pract. (2024) 28:31–5. doi: 10.7619/jcmp.20240979
22. Morioka R, Matsuda Y, Kato A, Okui T, Okuma S, Tatsumi H, et al. Oral functional impairment may cause malnutrition following oral cancer treatment in a single-center cross-sectional study. Sci Rep. (2022) 12:14787. doi: 10.1038/s41598-022-19177-6
23. Wang G, Ou M, Chen H, Zhu S, Chen Y, Xu X. Perioperative nutritional risk and its influencing factors in patients with oral cancer: a longitudinal study. Front Nutr. (2023) 10:1200820. doi: 10.3389/fnut.2023.1200820
24. XY CHEN, CL LI, XJ QIN, ZHANG JF. Factors influencing nutrition trajectories of patients with oral cancer. China J Maxillofacial Surg. (2023) 21:538–47. doi: 10.19438/j.cjoms.2023.06.002
25. Badoual C, Hans S, Rodriguez J, Peyrard S, Klein C, Agueznay Nel H, et al. Prognostic value of tumor-infiltrating CD4+ T-cell subpopulations in head and neck cancers. Clin Cancer Res. (2006) 12:465–72. doi: 10.1158/1078-0432.CCR-05-1886
26. Lin B, Du L, Li H, Zhu X, Cui L, Li X. Tumor-infiltrating lymphocytes: Warriors fight against tumors powerfully. BioMed Pharmacother. (2020) 132:110873. doi: 10.1016/j.biopha.2020.110873
27. Zheng FJ, Liu W, Li JN, Zhao JQ, Jiang GC. Research progress of nutritional assessment and influencing factors in elderly cancer patients. Electron J Metab Nutr Cancer. (2020) 7:126–30. doi: 10.16689/j.cnki.cn11-9349/r.2020.01.023
28. Maierhaba M, Bai J, Rusitanmu Y, Yao ZT. Influencing factors of nutritional status and change in 50 patients with oral squamous cell carcinoma during treatment. Shanghai J Stomatol. (2022) 31:205–10. doi: 10.19439/j.sjos.2022.02.018
29. Zhang DS, Zheng JW, Zhang CP, Cai ZG, Li LJ, Liao GQ, et al. Multidisciplinary team model for patients with oral cancer and systemic diseases: an expert consensus. Hua Xi Kou Qiang Yi Xue Za Zhi. (2020) 38:603–15. doi: 10.7518/hxkq.2020.06.001
30. Dattilo LW, Russell TI, Warinner CB, Starmer H, Annino DJ Jr., Goguen LA, et al. Patient experience of head and neck surgery with free flap reconstruction. JAMA Otolaryngol Head Neck Surg. (2024) 150:311–7. doi: 10.1001/jamaoto.2023.4750
31. Li CY, Xiang Y, Dong XQ, Zhao WR, Jiang XN, Guo XM, et al. Analysis of the current situation and influencing factors of malnutrition in patients with oral cancer. Modern Nurs. (2024) 31:147–50. doi: 10.19791/j.cnki.1006-6411.2024.25.034
32. Wie GA, Cho YA, Kim SY, Kim SM, Bae JM, Joung H. Prevalence and risk factors of malnutrition among cancer patients according to tumor location and stage in the National Cancer Center in Korea. Nutrition. (2010) 26(3):263–8. doi: 10.1016/j.nut.2009.04.013
33. Chen J, Du C, Ding ZY, Zhang DS, Zheng ZD. The analysis of cancer patients’ nutritional status and related factors analysis. Moder Noncol. (2018) 26:91–4. doi: 10.3969/j.issn.1672-4992.2018.01.024
34. Zhang HF, Zhang MF, Zhao AD, Li RR. Correlation between nutritional status before radiotherapy and dietary intake in patients with oral cancers. Shanghai J Stomatol. (2019) 28:288–92. doi: 10.19439/j.sjos.2019.03.013
35. Kim MJ, Ahn KM. Prognostic factors of oral squamous cell carcinoma: the importance of recurrence and pTNM stage. Maxillofac Plast Reconstr Surg. (2024) 46:8. doi: 10.1186/s40902-024-00410-3
36. Soliman GA. Dietary cholesterol and the lack of evidence in cardiovascular disease. Nutrients. (2018) 10:780. doi: 10.3390/nu10060780
37. Soffientini U, Graham A. Intracellular cholesterol transport proteins: roles in health and disease. Clin Sci. (2016) 130:1843–59. doi: 10.1042/CS20160339
38. Zhang Z, Pereira SL, Luo M, Matheson EM. Evaluation of blood biomarkers associated with risk of malnutrition in older adults: a systematic review and meta-analysis. Nutrients. (2017) 9:829. doi: 10.3390/nu9080829
39. Wilms T, Boldrup L, Gu X, Coates PJ, Sgaramella N, Nylander K. High levels of low-density lipoproteins correlate with improved survival in patients with squamous cell carcinoma of the head and neck. Biomedicines. (2021) 9(5):506. doi: 10.3390/biomedicines9050506
40. Tsai Y-T, Tsai M-H, Kudva A, De Vito A, Lai C-H, Liao C-T, et al. The prognostic value of preoperative total cholesterol in surgically treated oral cavity cancer. Biomedicines. (2024) 12:2898. doi: 10.3390/biomedicines12122898
41. Ma XD, Wei LH, Wu R, Zheng XY, Z. PL. Analysis of postoperative complications and blood glucose levels in patients with oral cancer and diabetes mellitus under the surgical concept of accelerated rehabilitation. Guide China Med. (2022) 20:93–5. doi: 10.15912/j.cnki.gocm.2022.33.008
42. Fang SM, Wang YR. Analysis of influencing factors of perioperative malnutrition in elderly patients with oral cancer and effects of immunonutrition support. Geriatr Health Care. (2024) 30:650–4+70. doi: 10.3969/j.issn.1008-8296.2024.03.01
Keywords: malnutrition, oral neoplasms, machine learning, Shapley Additive exPlanations (SHAPs), postoperative complications
Citation: Kuang L, Yu J, Zhou Y, Zhang Y, Wang G, Zhang F, Lubamba GP and Bi X (2025) Predicting postoperative malnutrition in patients with oral cancer: development of an XGBoost model with SHAP analysis and web-based application. Front. Oncol. 15:1564459. doi: 10.3389/fonc.2025.1564459
Received: 21 January 2025; Accepted: 14 April 2025;
Published: 12 May 2025.
Edited by:
Oreste Iocca, University of Turin, ItalyReviewed by:
Silvio Pires Gomes, University of São Paulo, BrazilSaraswati Patel, Saveetha University, India
Copyright © 2025 Kuang, Yu, Zhou, Zhang, Wang, Zhang, Lubamba and Bi. This is an open-access article distributed under the terms of the Creative Commons Attribution License (CC BY). The use, distribution or reproduction in other forums is permitted, provided the original author(s) and the copyright owner(s) are credited and that the original publication in this journal is cited, in accordance with accepted academic practice. No use, distribution or reproduction is permitted which does not comply with these terms.
*Correspondence: Xiaoqin Bi, aHhieHFAMTYzLmNvbQ==
†These authors have contributed equally to this work and share first authorship
‡ORCID: Xiaoqin Bi, orcid.org/0000-0002-2746-8127