 Guoqing Ren
 Jian Zhou2
- 1Department of Orthopedics, Qilu Hospital of Shandong University, Jinan, Shandong, China
- 2Department of Orthopedics, Qingdao Hospital, University of Health and Rehabilitation Sciences (Qingdao Municipal Hospital), Qingdao, China
- 3Qingdao Hospital, University of Health and Rehabilitation Sciences (Qingdao Municipal Hospital), Qingdao, China
Background: Multiple studies have shown that the transferrin receptor (TFRC) is highly expressed in various tumors, and it has been recognized as a cancer biomarker. However, its role in osteosarcoma(OS) has rarely been studied. The purpose of this study was to explore the role and mechanism of TFRC in the proliferation, invasion, and migration of osteosarcoma cells.
Methods: First, we analyzed the expression of TFRC in OS and normal cells with an open database and evaluated the correlation between TFRC expression and overall survival in OS patients. Quantitative real-time PCR (qRT–PCR), Western blotting, and immunohistochemical staining were used to determine the expression level of TFRC in OS cell lines and tissues. TFRC was knocked down by lentivirus-mediated short hairpin RNA (shRNA) in 143B and U2OS cells. The effects of TFRC knockdown on OS cell proliferation, migration, and invasion, as well as its mechanism related to ribonucleotide reductase M2 (RRM2), were explored through a series of experiments. Nude mice were inoculated with xenogeneic OS cells to study the influence of TFRC knockdown on tumor growth in vivo.
Results: TFRC was highly expressed in osteosarcoma, and its high level of expression was associated with poor overall survival in osteosarcoma patients. After TFRC was knocked down, the proliferation, migration and invasion ability of OS cells were significantly reduced, and TFRC knockdown effectively inhibited the growth of OS cells in xenograft experiments with nude mice. The knockdown of TFRC led to a decrease in the total intracellular iron content and a significant decrease in the protein expression of RRM2. The decrease in the proliferation, migration and invasion of osteosarcoma cells caused by TFRC knockdown was reversed by the addition of FAC or plasmids to overexpress RRM2.
Conclusion: OS cells regulate proliferation, migration, and invasion by overexpressing TFRC, which increases the transport of iron into cells and increases the expression and activity of RRM2.
Introduction
Osteosarcoma (OS) is a highly aggressive mesenchymal malignant bone tumor that affects mainly children and adolescents, with a second peak in people aged 60–80 years (1–3), and the incidence during adolescence is approximately 4.4 cases per million people per year (4). Given that current standardized neoadjuvant chemotherapy, extensive surgical resection, and adjuvant chemotherapy are widely used, the quality of life of OS patients has improved, with the 5-year survival rate increasing to 70% (5, 6). However, there has been no substantial breakthrough in treatment since the 1980s (1), and over the past four decades, there has been limited progress in terms of the OS survival rate due to early metastasis and chemotherapy resistance (6, 7). The 5-year overall survival rate of patients with metastatic OS is only approximately 20–40% (8), whereas for patients with recurrence, the prognosis is poor, with a survival rate of less than 20% (1). Therefore, further exploration of the new mechanisms involved in the occurrence and development of osteosarcoma and the search for new therapeutic targets have become topics of great interest in current osteosarcoma research.
Iron is an essential element for cellular activities, especially for rapidly proliferating tumor cells where the demand for iron significantly increases, also known as “iron addiction” (9, 10). Iron is involved in a variety of biological processes, including cellular respiration, energy metabolism, DNA synthesis, and redox reactions (11–13), and the dysregulation of iron metabolism often leads to the occurrence and development of tumors (9, 10, 14, 15). To meet the high demand for iron, tumor cells reshape iron metabolism pathways, resulting in the dysregulation of key proteins involved in iron metabolism and the overexpression of some iron uptake-related genes (16, 17).
Transferrin receptor 1 (TFR1) is an important transmembrane glycoprotein encoded by the TFRC gene that mainly regulates iron absorption by binding to transferrin (Tf), which is a key molecule in iron metabolism (13, 18–20). The expression level of TFRC is closely related to the iron demand of cells. Studies have shown that TFRC is highly expressed in a variety of tumors, including breast cancer, glioma, ovarian cancer, lung cancer, hepatocellular carcinoma, and colon cancer, and is considered a universal cancer marker (15, 21–25). This high expression of TFRC is closely related to the malignancy, invasiveness, metastasis and prognosis of tumors (13, 16, 26). However, its role in osteosarcoma has not been fully demonstrated.
Ribonucleotide reductase M2 (RRM2) is a subunit that regulates the activity of the enzyme ribonucleotide reductase (RNR), which is involved in the synthesis of DNA and is the rate-limiting step in the process of DNA synthesis (27, 28). RRM2 is known to be overexpressed in ovarian, bladder and colorectal cancer (29–31). Elevated RRM2 expression is a feature of many cancers, and a series of RNR inhibitors with different mechanisms can serve as effective drugs for cancer treatment (27). Iron is an essential metal cofactor for RRM2 to form tyrosine radicals on Tyr122, which play a key role in the reductase activity of RNR (32). Therefore, we speculated that TFRC may play an important role in regulating the biological functions of tumor cells by modulating iron uptake and affecting the activity of RRM2.
We conducted experiments on the expression of TFRC in osteosarcoma, its influences on proliferation, migration, and invasion, and its mechanisms in vitro and in vivo to provide new ideas for the treatment of osteosarcoma. Our results revealed that TFRC is clearly overexpressed in osteosarcoma cells and tissues and that the knockdown of TFRC inhibits the transport of iron into osteosarcoma cells, reduces the total intracellular iron content, and inhibits the expression and activity of RRM2, thus inhibiting the proliferation, migration and invasion of osteosarcoma cells. Therefore, TFRC is a very promising target for osteosarcoma therapy.
Materials and methods
Bioinformatics database selection and analysis
We obtained bioinformatics data from multiple public databases. The GSE42352 dataset from the GEO platform (https://www.ncbi.nlm.nih.gov/geo) contains RNA sequences of 19 osteosarcoma cell lines and 12 mesenchymal stem cell samples (33, 34). We also used the GEPIA (http://gepia2.cancer-pku.cn/#survival) online platform to analyze the impact of TFRC and RRM2 on overall survival in the sarcoma (SARC) dataset (35). The TARGET database (https://portal.gdc.cancer.gov/projects/TARGET-OS) provided the osteosarcoma (TARGET-OS) dataset, which contains comprehensive genomic features and survival information of 88 clinically annotated patients. The GTEx project (https://www.gtexportal.org/home/) provided 396 cases of genome expression and survival information of normal human bone and muscle tissue (36) for comparison with TARGET-OS. R software (v4.4) and the Limma software package were used to process the acquired data and perform differential expression analysis and survival analysis of target genes.
Cell lines and cell culture
The human osteosarcoma cell lines (MNNG/HOS, U2OS, MG-63, and 143B) were gifted by Dr. Zhang from the laboratory of Jinan Central Hospital. The human osteoblast cell line hFOB1.19 was obtained from Procell Life Science & Technology Co., Ltd. The human osteosarcoma cell lines MNNG/HOS, MG-63, and 143B were cultured in Dulbecco’s modified Eagle medium (Gibco, Biochemical Products (Beijing) Co., Ltd.) supplemented with 10% fetal bovine serum (PAN, made in Germany) and 1% penicillin–streptomycin (Cytiva, Austria) at 37°C in a humidified incubator with 5% CO2. The human osteosarcoma cell line U2OS was maintained in complete McCoy’s 5A medium containing 10% fetal bovine serum (PAN, made in Germany) and 1% penicillin–streptomycin (Cytiva, Austria) at 37°C with 5% CO2. The human cell line hFOB1.19 was cultured in specialized culture medium for hFOB1.19 from Procell Life Science & Technology Co., Ltd., at 34°C with 5% CO2. The medium contained DMEM/F12 (PM150312), 0.3 mg/mL G418 (PB180125), 10% FBS (164210-50) and 1% P/S (PB180120).
Establishment of stable TFRC-knockdown cell lines, plasmid construction and cell transfection
TFRC-shRNA and TFRC-shCtrl were synthesized and packaged into lentiviruses by OBiO Technology Corp., Ltd. (Shanghai, China). 143B and U2OS cells were transfected with synthetic lentivirus and 5 µg/mL polybrene (OBiO Technology, Shanghai, China) according to the manufacturer’s instructions, and the cells were observed under a fluorescence microscope (Nikon Ti2-U, Japan) and photographed 72 hours after transfection. The stably transfected cells were subsequently screened with 3 µg/ml puromycin (Sparkjade, Shandong, China), and related experiments were subsequently performed. The sequence of TFRC-shRNA was 5’-GCTGGTCAGTTCGTGATTAAA-3’, and the sequence of TFRC-shCtrl was 5’-CCTAAGGTTAAGTCGCCCTCG-3’. The cells were transfected with the RRM2 overexpression plasmid and control plasmid (Nanjing Zebrafish Biotechnology Co., Ltd.) via KeygenMax 2000 Transfection Reagent (KeyGEN BioTECH, Nanjing, China) according to the instructions, and the medium was replaced with fresh medium 6 hours later. After 48 hours, the cells were observed under a fluorescence microscope, photographed, and harvested for assessment and subsequent related experiments.
RNA isolation and quantitative real time PCR
Total RNA was isolated and purified from cells/tissues via the FastPure Cell/Tissue Total RNA Isolation Kit V2 (Vazyme, Nanjing, China) according to the manufacturer’s instructions. The RNA was reverse-transcribed into cDNA via HiScript III RT SuperMix for qPCR (Vazyme, Nanjing, China). The qRT–PCR was subsequently performed via ChamQ Universal SYBR qPCR Master Mix (Vazyme, Nanjing, China), and an ABI QuantStudio 3 Real-time PCR Detection System (Life Technologies) was used to obtain the data. Human GAPDH was chosen as an internal control for normalization to analyze the expression of target genes (37). All primers for these genes were synthesized by Sangon Biotech Co., Ltd. (Shanghai, China). The primers used were as follows: GAPDH-F[5’-GATTCCACCCATGGCAAATTC-3’], GAPDH-R[5’-CTGGAAGATGGTGATGGGATT-3’], TFRC-F[5’-TGAGGGAGGAGCCAGGAGAGG-3’], TFRC-R[5’-CTTGATGGTGCCGGTGAAGTCTG-3’]. The relative fold change in expression with respect to a reference sample was calculated via the 2-ΔΔCt method.
Western blotting analysis
The cells and comminuted tissues were lysed in ice-cold RIPA buffer containing 1 mM PMSF (Sparkjade, Shandong, China) and phosphatase inhibitor (Solarbio, Beijing, China) for 30 minutes, and the lysates were subsequently centrifuged at 12,000 rpm for 10 minutes at 4°C. The liquid supernatant was collected, and protein concentrations were quantified via an Enhanced BCA Protein Assay Kit (Beyotime, Shanghai, China) according to the manufacturer’s instructions. The protein samples were mixed with 5× loading buffer and heated at 100°C for 10 minutes. Equal amounts of protein samples were subjected to 7.5% SDS–PAGE (Sparkjade, Shandong, China), separated, and transferred onto 0.2 μm PVDF membranes (PALL, USA) via standard procedures. The membranes were blocked in 5% nonfat milk for 1 hour at room temperature, incubated overnight at 4°C with specific primary antibodies diluted (anti-TFRC, 1:1000; anti-RRM2, 1:1500) with SuperKine™ Enhanced Antibody Dilution Buffer (Abbkine, Wuhan, China), and then incubated with goat anti-rabbit IgG (H+L) HRP or goat anti-mouse IgG (H+L) HRP (Sparkjade, Shandong, China) for 1 hour at room temperature. Protein bands were detected via a SuperFemto ECL Chemiluminescence Kit (Vazyme, Nanjing, China), and band intensities were quantified via ImageJ software. The primary antibodies against TFRC and RRM2 were purchased from Abcam (Shanghai, China), and the primary antibodies against β-actin and GAPDH were purchased from Proteintech (Wuhan, China).
Human tissue specimens and immunohistochemical staining analysis
Paraffin sections of human osteosarcoma and osteoblastoma samples were obtained from 30 osteosarcoma patients and 12 osteoblastoma patients admitted to Qilu Hospital of Shandong University from 2013 to –2022 and were used for immunohistochemical staining experiments. Written informed consent was obtained from all participants or their guardians. All study protocols were approved by the Ethics Committee on Scientific Research of Shandong University Qilu Hospital (permit number KYLL2023-06-090) and complied with the principles expressed in the Declaration of Helsinki. For immunohistochemical staining, paraffin sections were incubated overnight at 4°C with an anti-TFRC antibody (AB214039, Abcam; 1:500 for IHC staining analysis) or anti-RRM2 antibody (AB172476, Abcam; 1:1000 for IHC staining analysis) after deparaffinization, rehydration, antigen retrieval, and endogenous peroxidase blockade. The paraffin sections were incubated with the secondary antibody (ZSBG-BIO, PV6000) at room temperature for 30 minutes and then developed with a DAB kit. The immunoreactivity of each tissue slice was assessed by two separate experienced pathologists. The IHC staining score was determined according to the staining intensity and degree of the Fromowitz criterion (38).
Cell proliferation assay
143B or U2OS cells (4 × 10⁴/ml) were seeded into 96-well plates. Then, 90 μl of fresh culture medium without FBS and 10 μl of Cell Counting Kit-8 (CCK-8) solution (Dojindo, Japan) were added to each well at 37°C for 1.5 hours. The absorbance values were measured at 450 nm via a microplate reader (SpectraMax Plus384, Molecular Devices, USA). For the ferric ammonium citrate (FAC)-related assays, complete media with or without 100 µM FAC was replaced for each well 6 hours after these cells were seeded, and the remaining experimental steps were the same as before. All the experiments were repeated three times, and the average values were taken.
Plate colony formation
Approximately 1500 U2OS cells or 143B cells per well were seeded into six-well plates with 1.5 ml of complete medium. Fresh medium was gently replaced approximately every 4 days. After 12 days, the cells were fixed with 4% paraformaldehyde (Servicebio, Wuhan, China) and stained with 0.1% crystal violet (Solarbio, Beijing, China) for 20 minutes. Clonal clusters containing more than 50 cells were manually counted. The experiments were repeated three times.
Wound healing assay
143B or U2OS cells were seeded into a six-well plate with 3 horizontal lines marked with useful markers on the back and cultured in a cell incubator for 24 hours to spread the cells throughout the whole six-well plate. A sterile 200 µl pipette tip was then used to make 2 scratches perpendicular to the marking line. The medium was gently replaced with fresh medium, and the cells were cultured for another 24 hours (39). The widths of the wounds in the different treatment groups were observed and photographed under a microscope (Nikon Ti2-U, Japan) at 0 and 24 hours after scratching. The wound healing rate was calculated as the percentage of gap closure: (0 hours−24 hours)/0 hours × 100%. For the assays related to FAC, the medium in each well was replaced with medium with or without 100 µM FAC after the scratch was completed. The other experimental steps were the same as before, and all the experiments were repeated three times.
Transwell invasion and migration assays
NEST culture inserts (Wuxi NEST Biotechnology Co., Ltd.) with 8.0 µm pore size polycarbonate membrane 24-well plates were used in Transwell invasion and Transwell migration assays. For the invasion assay, 30 µg of Matrigel matrix (Corning, USA) was added to each upper chamber. Two hundred microliters of serum-free 143B or U2OS (5 × 10⁴) cell suspension was seeded into each upper chamber, and 600 µL of complete medium containing 10% FBS was added to the lower chamber and cultured in an incubator for 24 hours. The cells were fixed with 4% paraformaldehyde (Servicebio, Wuhan, China) and stained with 0.1% crystal violet (Solarbio, Beijing, China). The cells that did not cross the chamber membrane were removed, and three fields of view were randomly selected under a microscope at 100× magnification to take pictures and count the number of cells. For the assays related to FAC, 600 µL of complete medium with or without 100 µM FAC was added to the lower chamber, and the remaining steps were the same as before. For the Transwell migration assay, the cell seeding concentration was 2 × 10⁴ per well, no Matrigel matrix was added to the upper chamber, and the remaining experimental steps were the same as those for the Transwell invasion assay. All the experiments were repeated independently three times (39).
Total iron quantification
A total iron colorimetric assay kit (E-BC-K880-M, Elabscience, Wuhan, China) was used to assess total intracellular iron. Approximately 1 × 10⁶ cells were collected, lysed on ice, and centrifuged at 15000×g for 10 minutes, after which the supernatant was collected. The supernatant and chromogenic solution were mixed, added to a 96-well plate and incubated at 37°C for 40 minutes. The OD value of each well was measured at 593 nm via a microplate reader (SpectraMax Plus384, Molecular Devices, USA), and the total iron content of each well was calculated via a standard fitting curve.
In vivo xenograft experiments
The animal experiment was approved by the Ethics Committee on Animal Experiments of Shandong University Qilu Hospital (permit number DWLL-2023-011). Five-week-old (17–20 g) male BALB/c nude mice were purchased from Zhejiang Vital River Laboratory Animal Technology Co., Ltd. (Zhejiang, China) and maintained in a specific pathogen-free (SPF) environment with free access to food and water. One week later, the mice were randomly divided into a Lenti-shCtrl group and a Lenti-shTFRC group. A 100 µl 1:1 mixture of PBS and Matrigel matrix (Corning, USA) containing approximately 5 ×10⁶ TFRC-knockdown or nonknockdown 143B cells was subcutaneously injected into the right flank of each nude mouse. Tumor size and mouse body weight were measured every 5 days after injection. All the mice were euthanized 3 weeks later, and the tumor tissues were removed, weighed, snap-frozen in liquid nitrogen and stored at -80°C. Harvested samples were subjected to Western blotting and qRT–PCR analysis. The volume of the tumor was calculated via the following formula: V=length × width2/2.
Statistical analysis
All the data are expressed as the mean ± standard error of the mean (SEM) unless otherwise indicated. All in vitro experiments were independently repeated at least 3 times under the same conditions. Statistical significance was assessed via the unpaired two-tailed Student’s t test or repeated measurement analysis of variance or nonparametric test, and P<0.05 was considered statistically significant. SPSS 22.0 was used for statistical analysis of all the data, and GraphPad Prism 9 was used for graphical presentation of the data.
Results
TFRC is overexpressed in osteosarcoma and is associated with poor overall survival
Several studies have suggested that TFRC is abundantly expressed in liver, breast, lung and colon cancer cells and that this increased expression may be associated with poor prognosis in different types of cancer (13, 15). First, we analyzed the data from several publicly available databases. The results revealed that in the GSE42352 dataset, the expression of TFRC in osteosarcoma cell lines (n=19) was significantly greater than that in mesenchymal stem cells (n=12) (P<0.001; Figure 1A). In the integrated datasets of TARGET-OS (n=88) and GTEx (n=396), TFRC was also significantly overexpressed in osteosarcoma tissues compared with normal skeletal muscle tissues (P<0.0001; Figure 1B). In addition, by using the GEPIA online data analysis platform, we found that in the sarcoma dataset (SARC, n=262), patients with high TFRC gene expression had significantly shorter overall survival than did those with low TFRC gene expression (P=0.035; Figure 1C). The overall survival status of the 88 patients in the TARGET-OS dataset was analyzed by R software, and the results indicated that the overall survival of patients with low TFRC expression was better (P=0.002; Figure 1D).
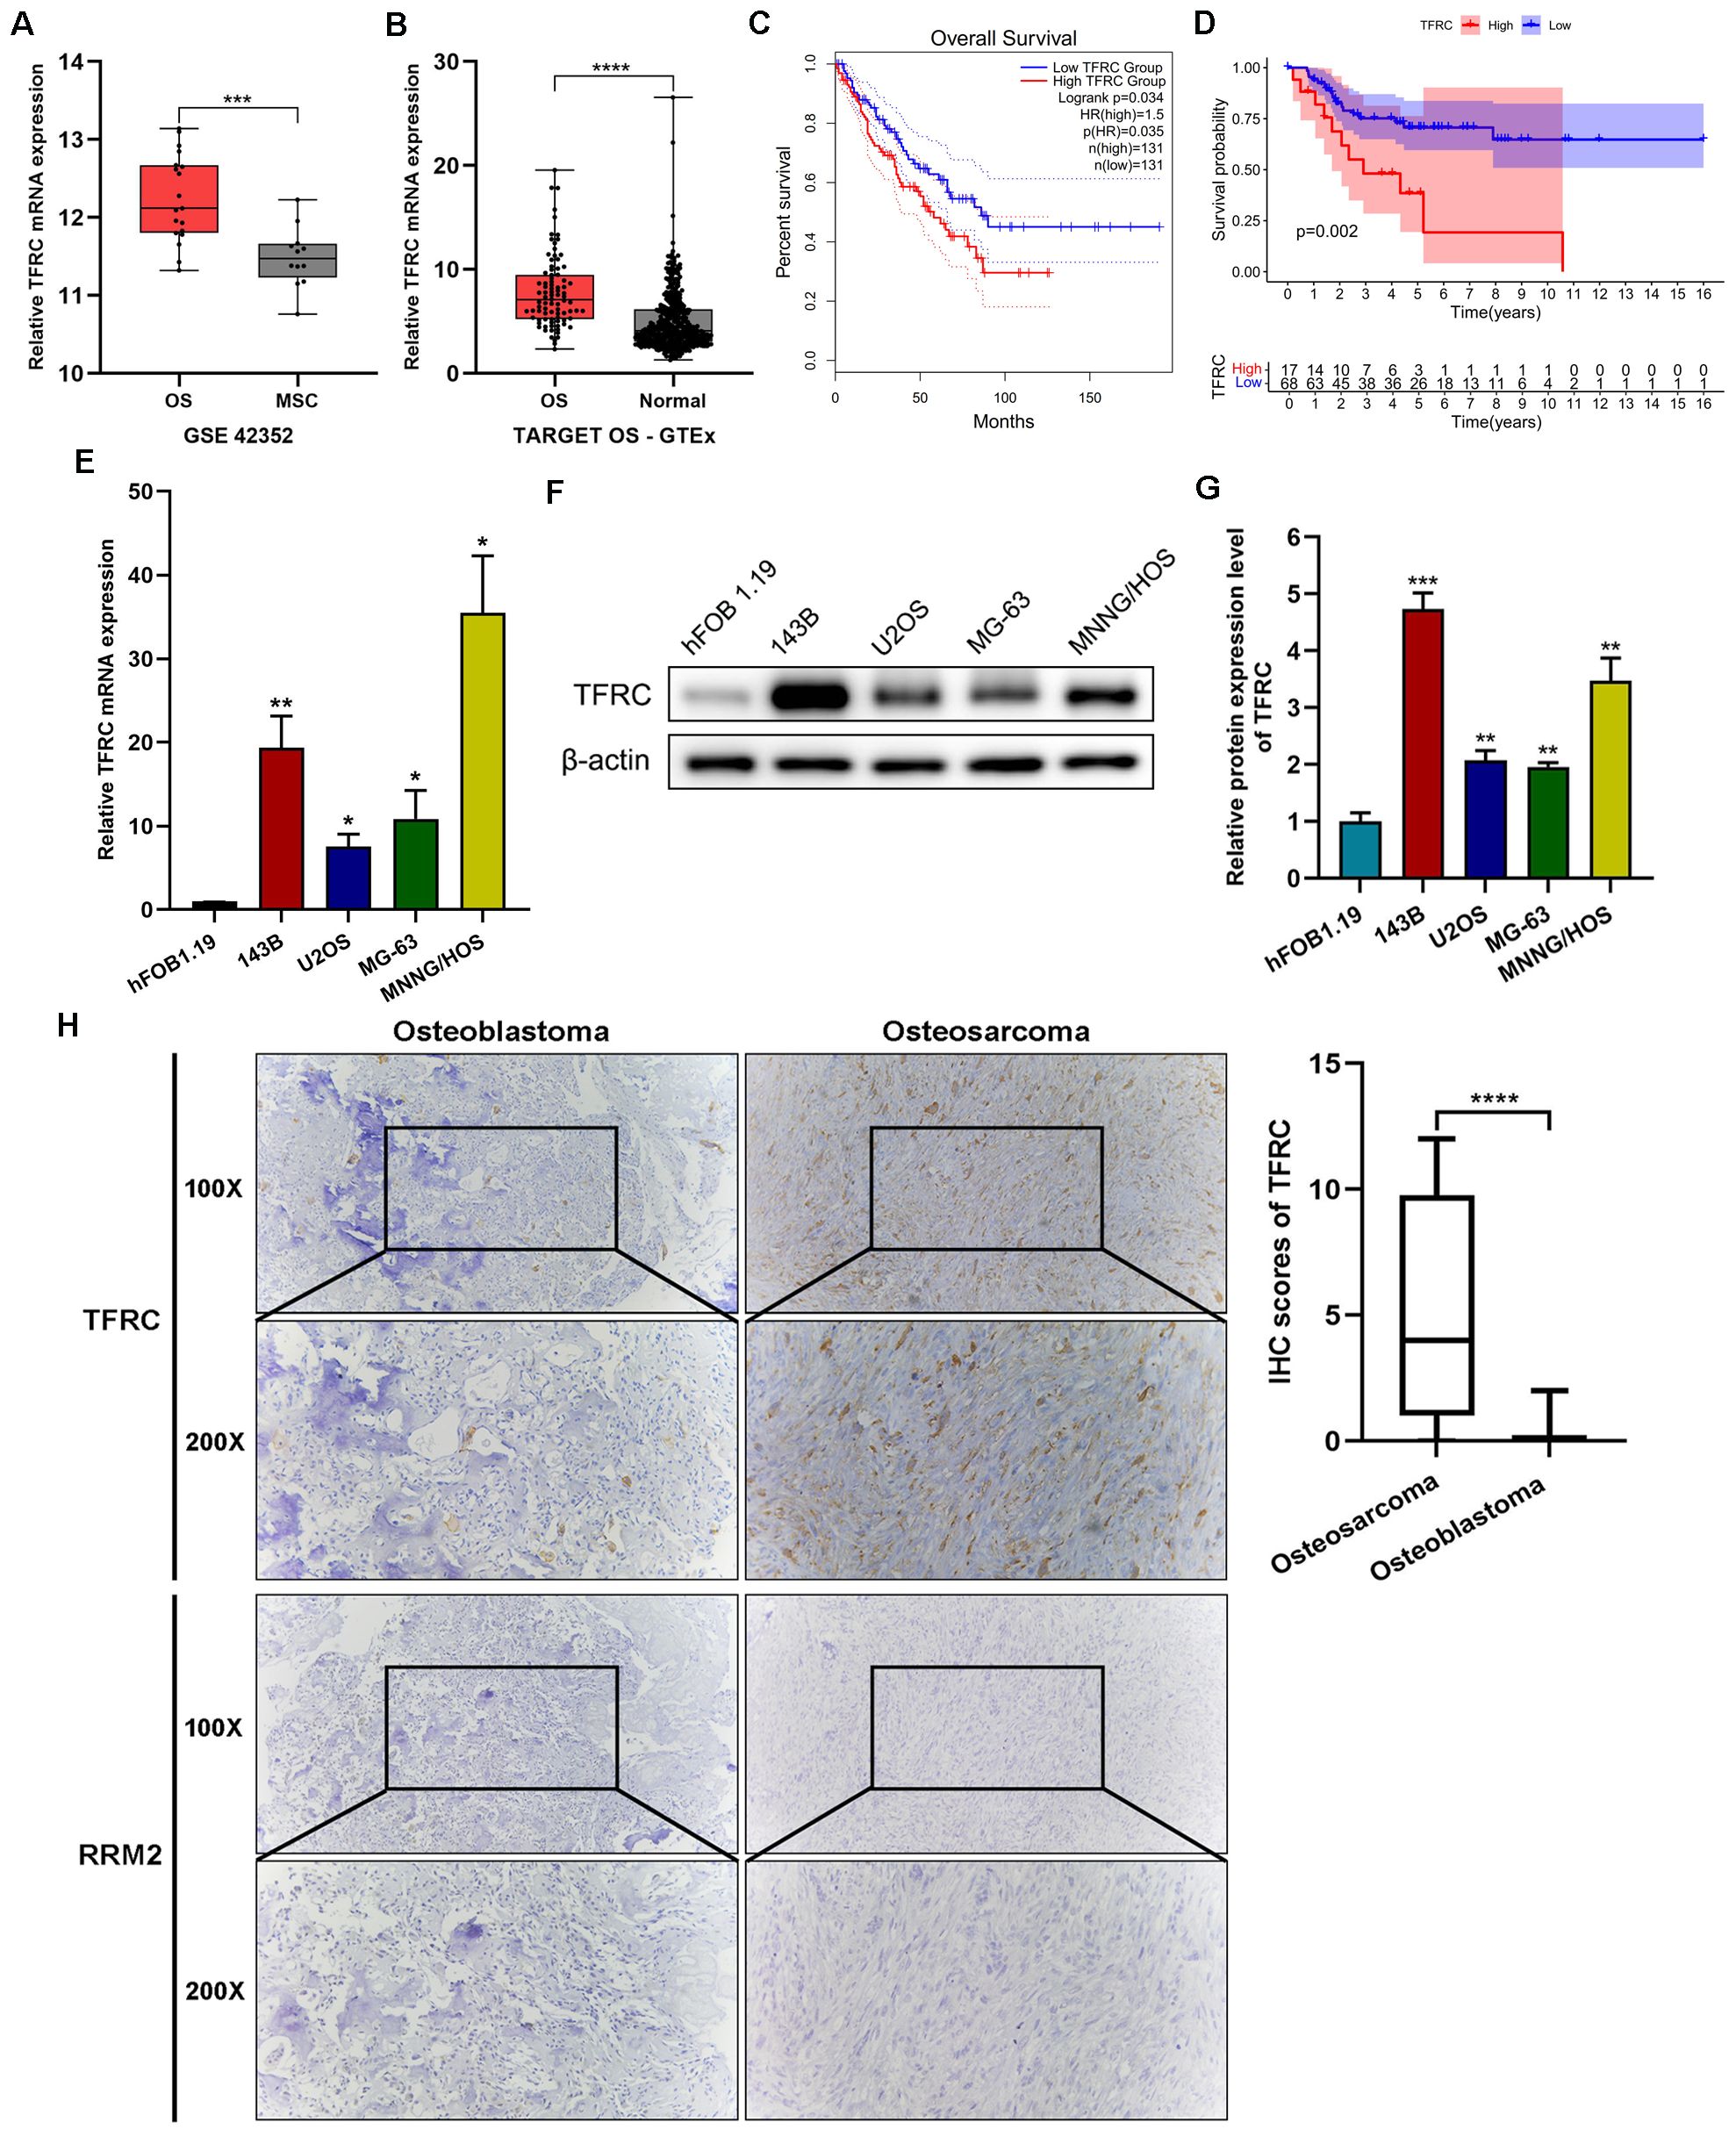
Figure 1. TFRC is overexpressed in osteosarcoma and is associated with poor overall survival. (A) The expression of TFRC in osteosarcoma cell lines (OS, n=19) was significantly greater than that in mesenchymal stem cells (MSCs, n=12) in the GSE42352 dataset. (B) The expression of TFRC in the integrated datasets of TARGET-OS (n=88) and GTEx (n=396). (C) Sarcoma patients (n=262) with high TFRC gene expression had significantly shorter overall survival than those with low TFRC gene expression according to the GEPIA online data analysis platform. (D) The TARGET-OS dataset (n=88) indicated that the overall survival of OS patients with low TFRC expression was better than that of those with high TFRC expression. (E-G) Compared with the human osteoblast cell line hFOB1.19, the human osteosarcoma cell lines 143B, U2OS, MG-63 and MNNG/HOS presented greater expression of TFRC at the protein and mRNA levels, as determined by quantitative real−time PCR (qRT–PCR) and Western blotting analysis (n=3). (H) Immunohistochemical (IHC) staining of human osteosarcoma tissues (n=30) and human osteoblastoma tissues (n=12) revealed that the staining intensity and degree of TFRC were significantly greater in osteosarcoma tissues than in osteoblastoma tissues. There was a significant difference in the IHC staining scores of TFRC between the two groups. However, RRM2-specific staining was notably weak in both osteosarcoma and osteoblastoma tissues. All the data are presented as the means ± SEMs. *P< 0.05, **P< 0.01, ***P< 0.001, ****P< 0.0001.
To confirm the expression and function of TFRC in osteosarcoma cell lines and tissues, qRT–PCR and Western blotting were performed on 4 kinds of human osteosarcoma cell lines (143B, U2OS, MG-63 and MNNG/HOS) and the human osteoblast cell line hFOB1.19. The results revealed significantly greater expression of TFRC mRNA and protein in osteosarcoma cell lines than in the human osteoblast cell line hFOB1.19 (Figures 1E-G). In addition, we used IHC staining to assess the protein expression of TFRC and RRM2 in human osteosarcoma tissues (n=30) and osteoblastoma tissues (n=12) as controls. Compared with that in control tissues, the expression of TFRC in osteosarcoma tissues was significantly greater, and the IHC staining score significantly differed (P<0.0001; Figure 1H). These data indicate that TFRC is overexpressed at the mRNA and protein levels in osteosarcoma cells. However, to our surprise, IHC experiments showed that RRM2-specific staining was notably weak in both osteosarcoma and osteoblastoma tissues (Figure 1H).
TFRC knockdown inhibits the proliferation, migration, and invasion of human OS cells
In previous experiments, we reported that TFRC was abnormally overexpressed in human osteosarcoma cells. Therefore, to investigate the role of TFRC in OS, we selected the 143B and U2OS cell lines, which have relatively high TFRC expression, for further experiments. We transfected 143B and U2OS cells with shRNAs and screened stable TFRC-knockdown cell lines. qRT–PCR and Western blotting analysis revealed that the mRNA and protein levels of TFRC were successfully decreased in these two OS cell lines (Figures 2A, B). We subsequently conducted CCK-8 and colony formation assays to investigate the effect of TFRC knockdown on OS cell proliferation. As shown in Figure 2C, the absorbance of TFRC-knockdown cells was significantly lower than that of control cells. Moreover, the number of colonies formed in the TFRC-knockdown groups was significantly lower than that in the control groups (P<0.05; Figure 2D). These findings suggest that the knockdown of TFRC attenuates the proliferation of OS cells. Wound healing and Transwell migration assays were used to assess the migration ability of the cells. The results revealed that, after TFRC knockdown, migration was significantly weakened compared with that of control cells (all P < 0.01; Figures 2E, F). In addition, a Transwell invasion assay with Matrigel was used to assess the invasive ability of human OS cells. The number of invasive cells in the experimental group was also significantly lower than that in the control group (Figure 2G). Taken together, these findings indicate that TFRC knockdown inhibits the proliferation, migration and invasion ability of human OS cells.
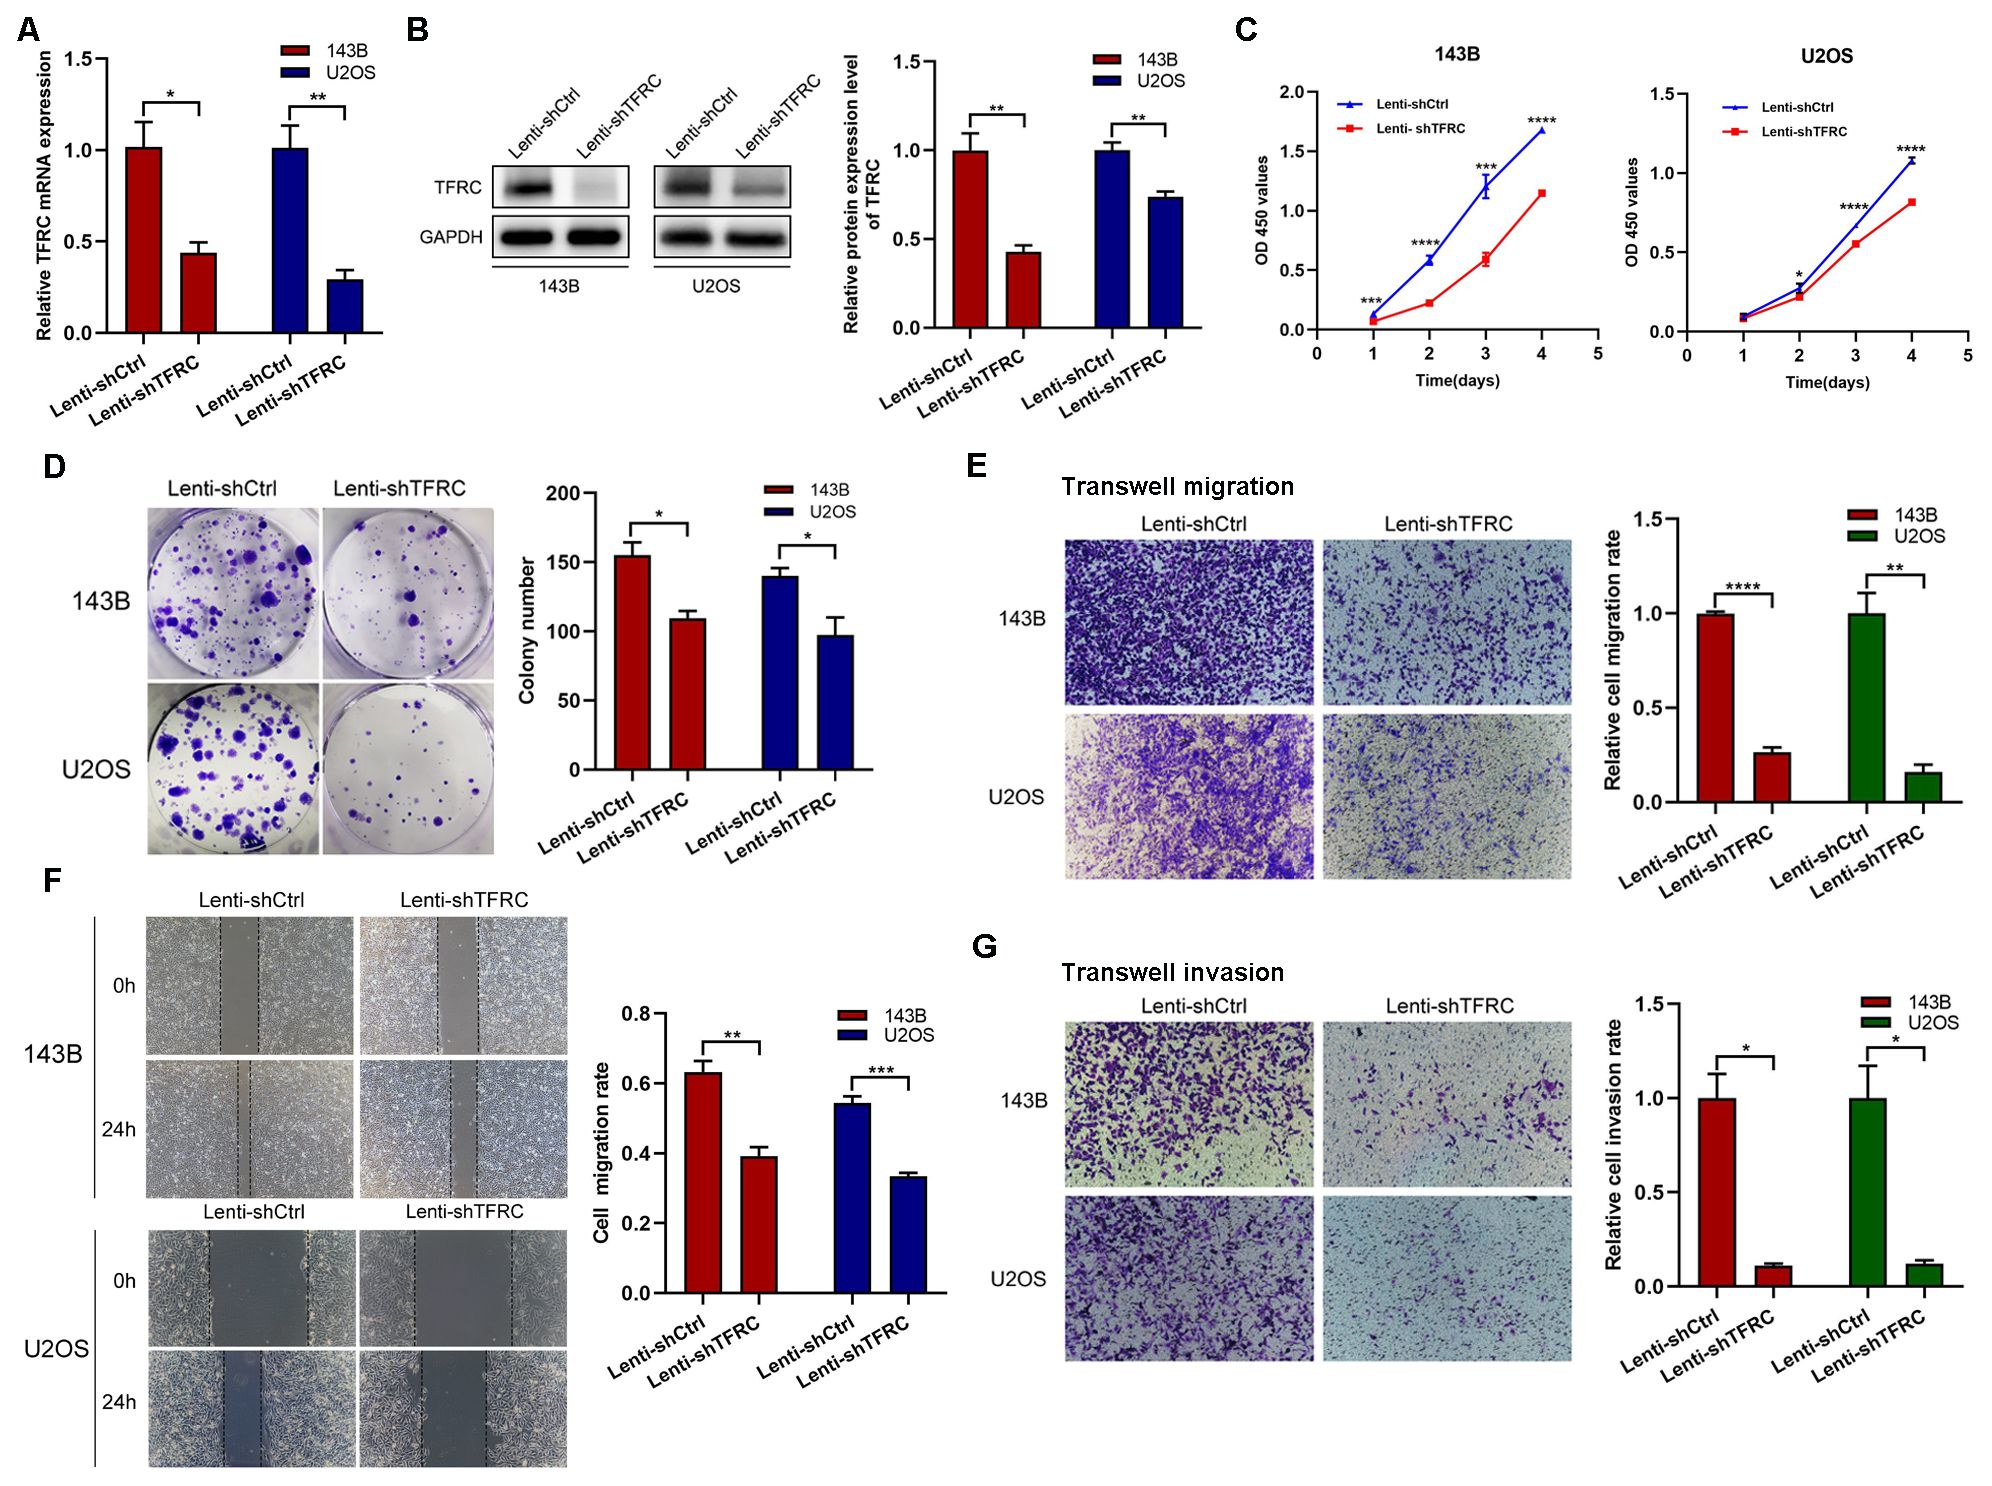
Figure 2. TFRC knockdown inhibits the proliferation, migration, and invasion of human OS cells. (A, B) qRT–PCR and Western blotting confirmed that the mRNA and protein levels of TFRC were successfully decreased in the 143B and U2OS cell lines by lentivirus-mediated TFRC small hairpin RNA (shRNA). (C, D) Cell Counting Kit-8 (CCK-8) and plate colony formation assays revealed that, compared with that in control cells, TFRC knockdown significantly suppressed cell proliferation (n=3). (E, F) Wound healing and Transwell migration assays were used to assess the migration ability of the cells, and the results revealed that, compared with the control conditions, the knockdown of TFRC significantly decreased the wound healing rate and number of migrated cells (n=3). (G) Knockdown of TFRC significantly inhibited the invasion ability of 143B and U2OS cells, as determined by a Transwell invasion assay (n=3). Except for the CCK-8 assay data, which are presented as the means ± SDs, all other experimental data are presented as the means ± SEMs. *P< 0.05, **P< 0.01, ***P< 0.001, ****P< 0.0001.
RRM2 is positively correlated with TFRC and is related to the poor prognosis of sarcoma patients
TFR1 is a crucial carrier for iron transport into cells (21), and iron is an indispensable metal element for the synthesis of activated RRM2. As a subunit of RNR, RRM2 plays important roles in DNA synthesis, cell proliferation and cancer development (28). Therefore, we used the GEPIA platform to explore the correlation between TFRC and RRM2, and the results, shown in Figure 3A, indicated a significant positive correlation between RRM2 and TFRC. We then analyzed the expression of RRM2 and its relationship with survival through public databases. The results showed that in the GSE42352 dataset, the expression of RRM2 in osteosarcoma cell lines (n=19) was significantly greater than that in mesenchymal stem cells (n=12) (P<0.0001; Figure 3B). In the integrated datasets of TARGET-OS (n=88) and GTEx (n=396), RRM2 was also significantly overexpressed in osteosarcoma tissues compared with normal skeletal muscle tissues (P<0.0001; Figure 3C). In addition, by using the GEPIA online data analysis platform, we found that in the sarcoma dataset (SARC, n=262), patients with high RRM2 gene expression had significantly shorter overall survival than did those with low RRM2 gene expression (P=0.042; Figure 3D).
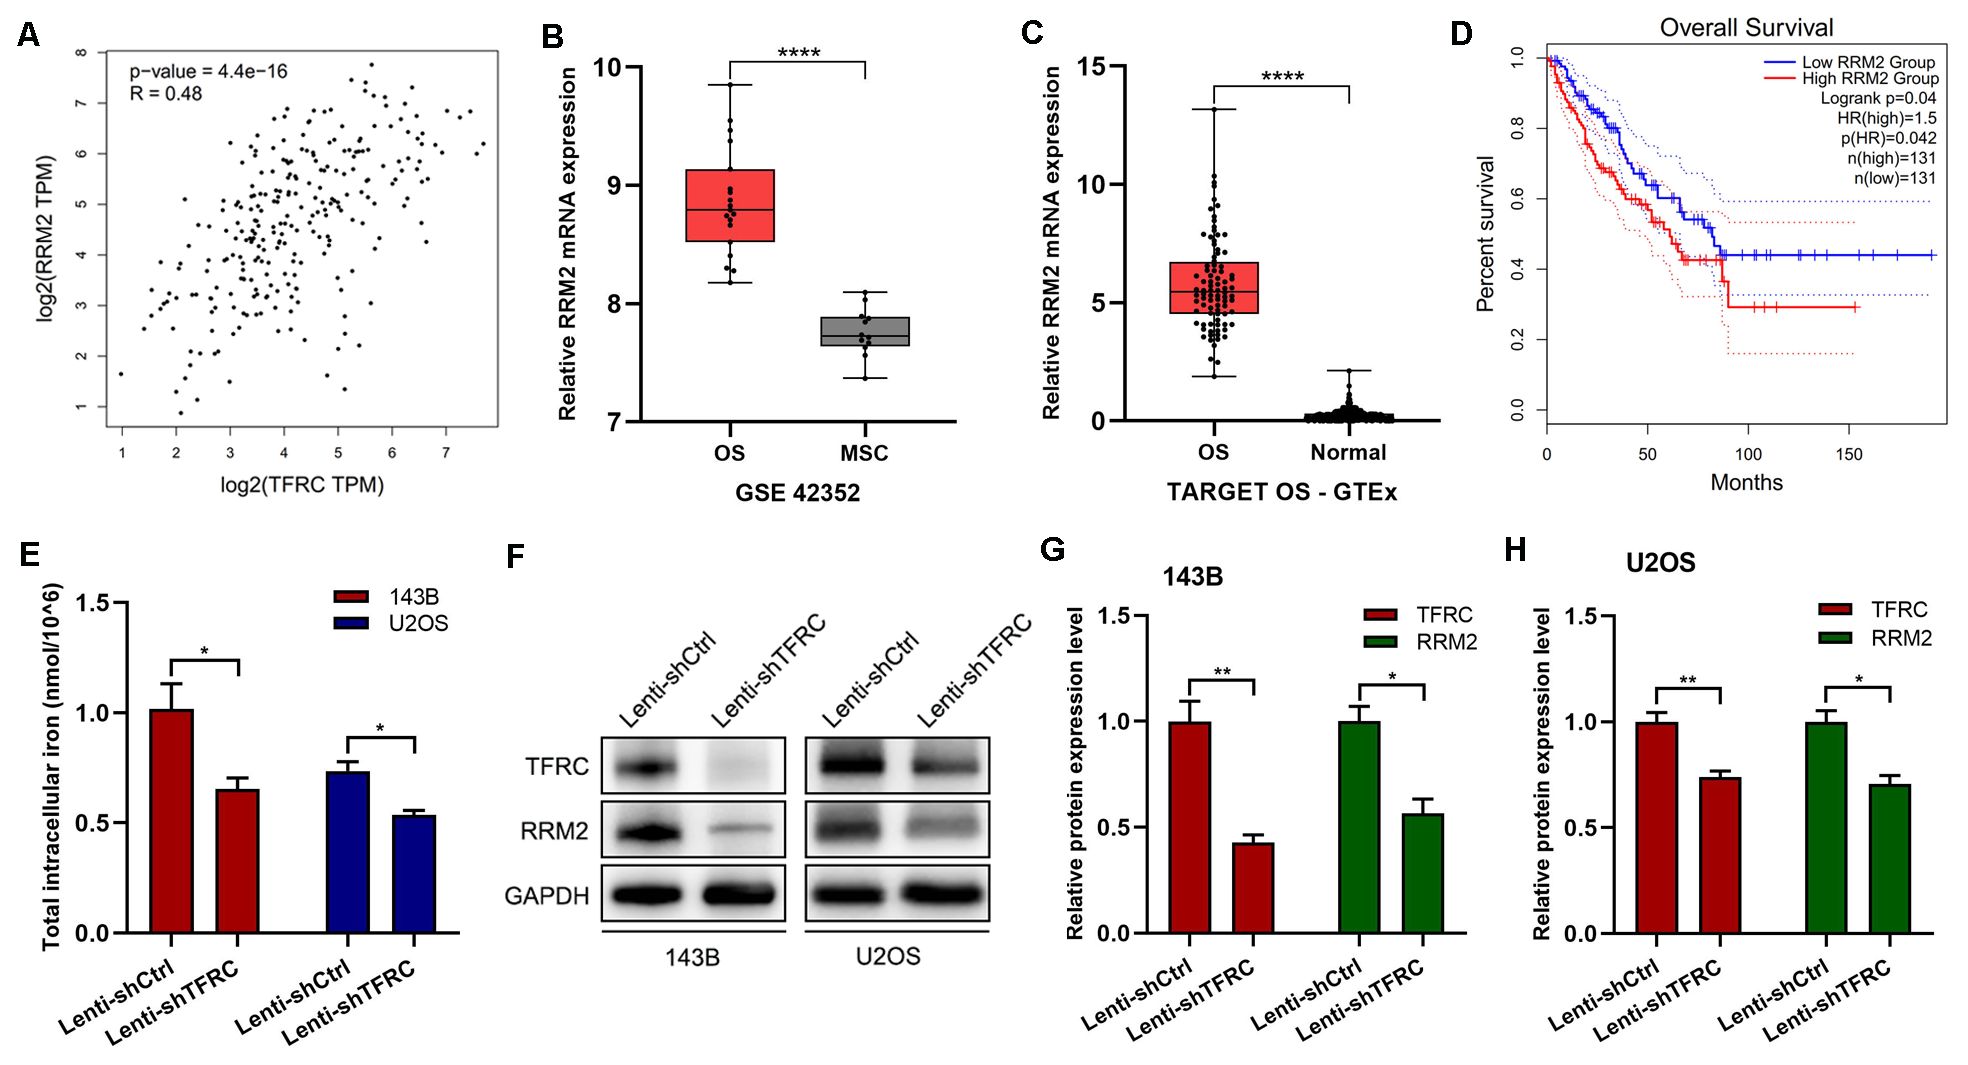
Figure 3. RRM2 and TFRC are significantly positively correlated. (A) The GEPIA platform revealed a positive correlation between TFRC and RRM2. (B-C) The GSE42352 (n=19) and TARGET OS-GTEx (n=88) datasets revealed that the expression of RRM2 in osteosarcoma cells was significantly greater than that in control cells. (D) The GEPIA online data analysis platform revealed that in the sarcoma dataset (SARC, n=262), high RRM2 gene expression was associated with poor overall survival. (E) A total iron colorimetric assay kit was used to assess total intracellular iron, and the OD value was measured at 593 nm via a microplate reader. Knockdown of TFRC significantly reduced the total intracellular iron content in 143B and U2OS cells. (F-H) Western blotting results also revealed that with the knockdown of TFRC, RRM2 was significantly downregulated at the protein level. All the data are presented as the means ± SEMs, *P< 0.05, **P< 0.01, ***P< 0.001, ****P< 0.0001.
Knockdown of TFRC can lead to a decrease in the total intracellular iron content and the downregulation of RRM2 expression
To further investigate the mechanism of the decreased proliferation, migration and invasion of human OS cells caused by the knockdown of TFRC, we assessed the total intracellular iron content and RRM2 expression in OS cells. The results revealed that the total intracellular iron concentration in 143B cells after TFRC knockdown was 0.654 ± 0.051 nmol/106 and that in control cells was 1.016 ± 0.115 nmol/106, which was a significant difference (P=0.045). Similar results were obtained in the U2OS cell line: 0.537 ± 0.020 nmol/106 for Lenti-shTFRC cells vs. 0.736 ± 0.042 nmol/106 for Lenti-shCtrl cells (P=0.013). These results indicated that the knockdown of TFRC significantly reduced the total iron content in the cytoplasm of human OS cells (Figure 3E). In addition, the Western blotting results revealed that with the knockdown of TFRC, RRM2 was significantly downregulated at the protein level (Figures 3F–H).
Upregulation of RRM2 rescues the decrease in the proliferation, migration, and invasion of human OS cells after TFRC knockdown
To demonstrate the role of RRM2 in human OS cells, we constructed an RRM2 overexpression plasmid and a control plasmid and successfully transfected the plasmid into OS cells. The Western blotting results revealed that RRM2 protein expression was increased after transfection with the RRM2 overexpression plasmid, especially in TFRC-knockdown OS cells (Figure 4A). We subsequently performed a series of related experiments. The results of the CCK-8 assay revealed that, in OS cells with TFRC knockdown, the absorbance of the RRM2-overexpressing group was greater than that of the RRM2-untreated group, especially on days 3 and 4 (Figure 4B). A wound healing assay revealed that when RRM2 was overexpressed, cell mobility after TFRC knockdown was also significantly improved (all P < 0.01; Figure 4C). In addition, we used a Matrigel Transwell invasion assay to assess changes in invasion ability. As shown in Figure 4D, the RRM2-overexpressing group had more invasive OS cells than did the control group after TFRC knockdown. In summary, these findings further confirm that the upregulation of RRM2 rescues the decrease in the proliferation, migration and invasion of OS cells after TFRC knockdown.
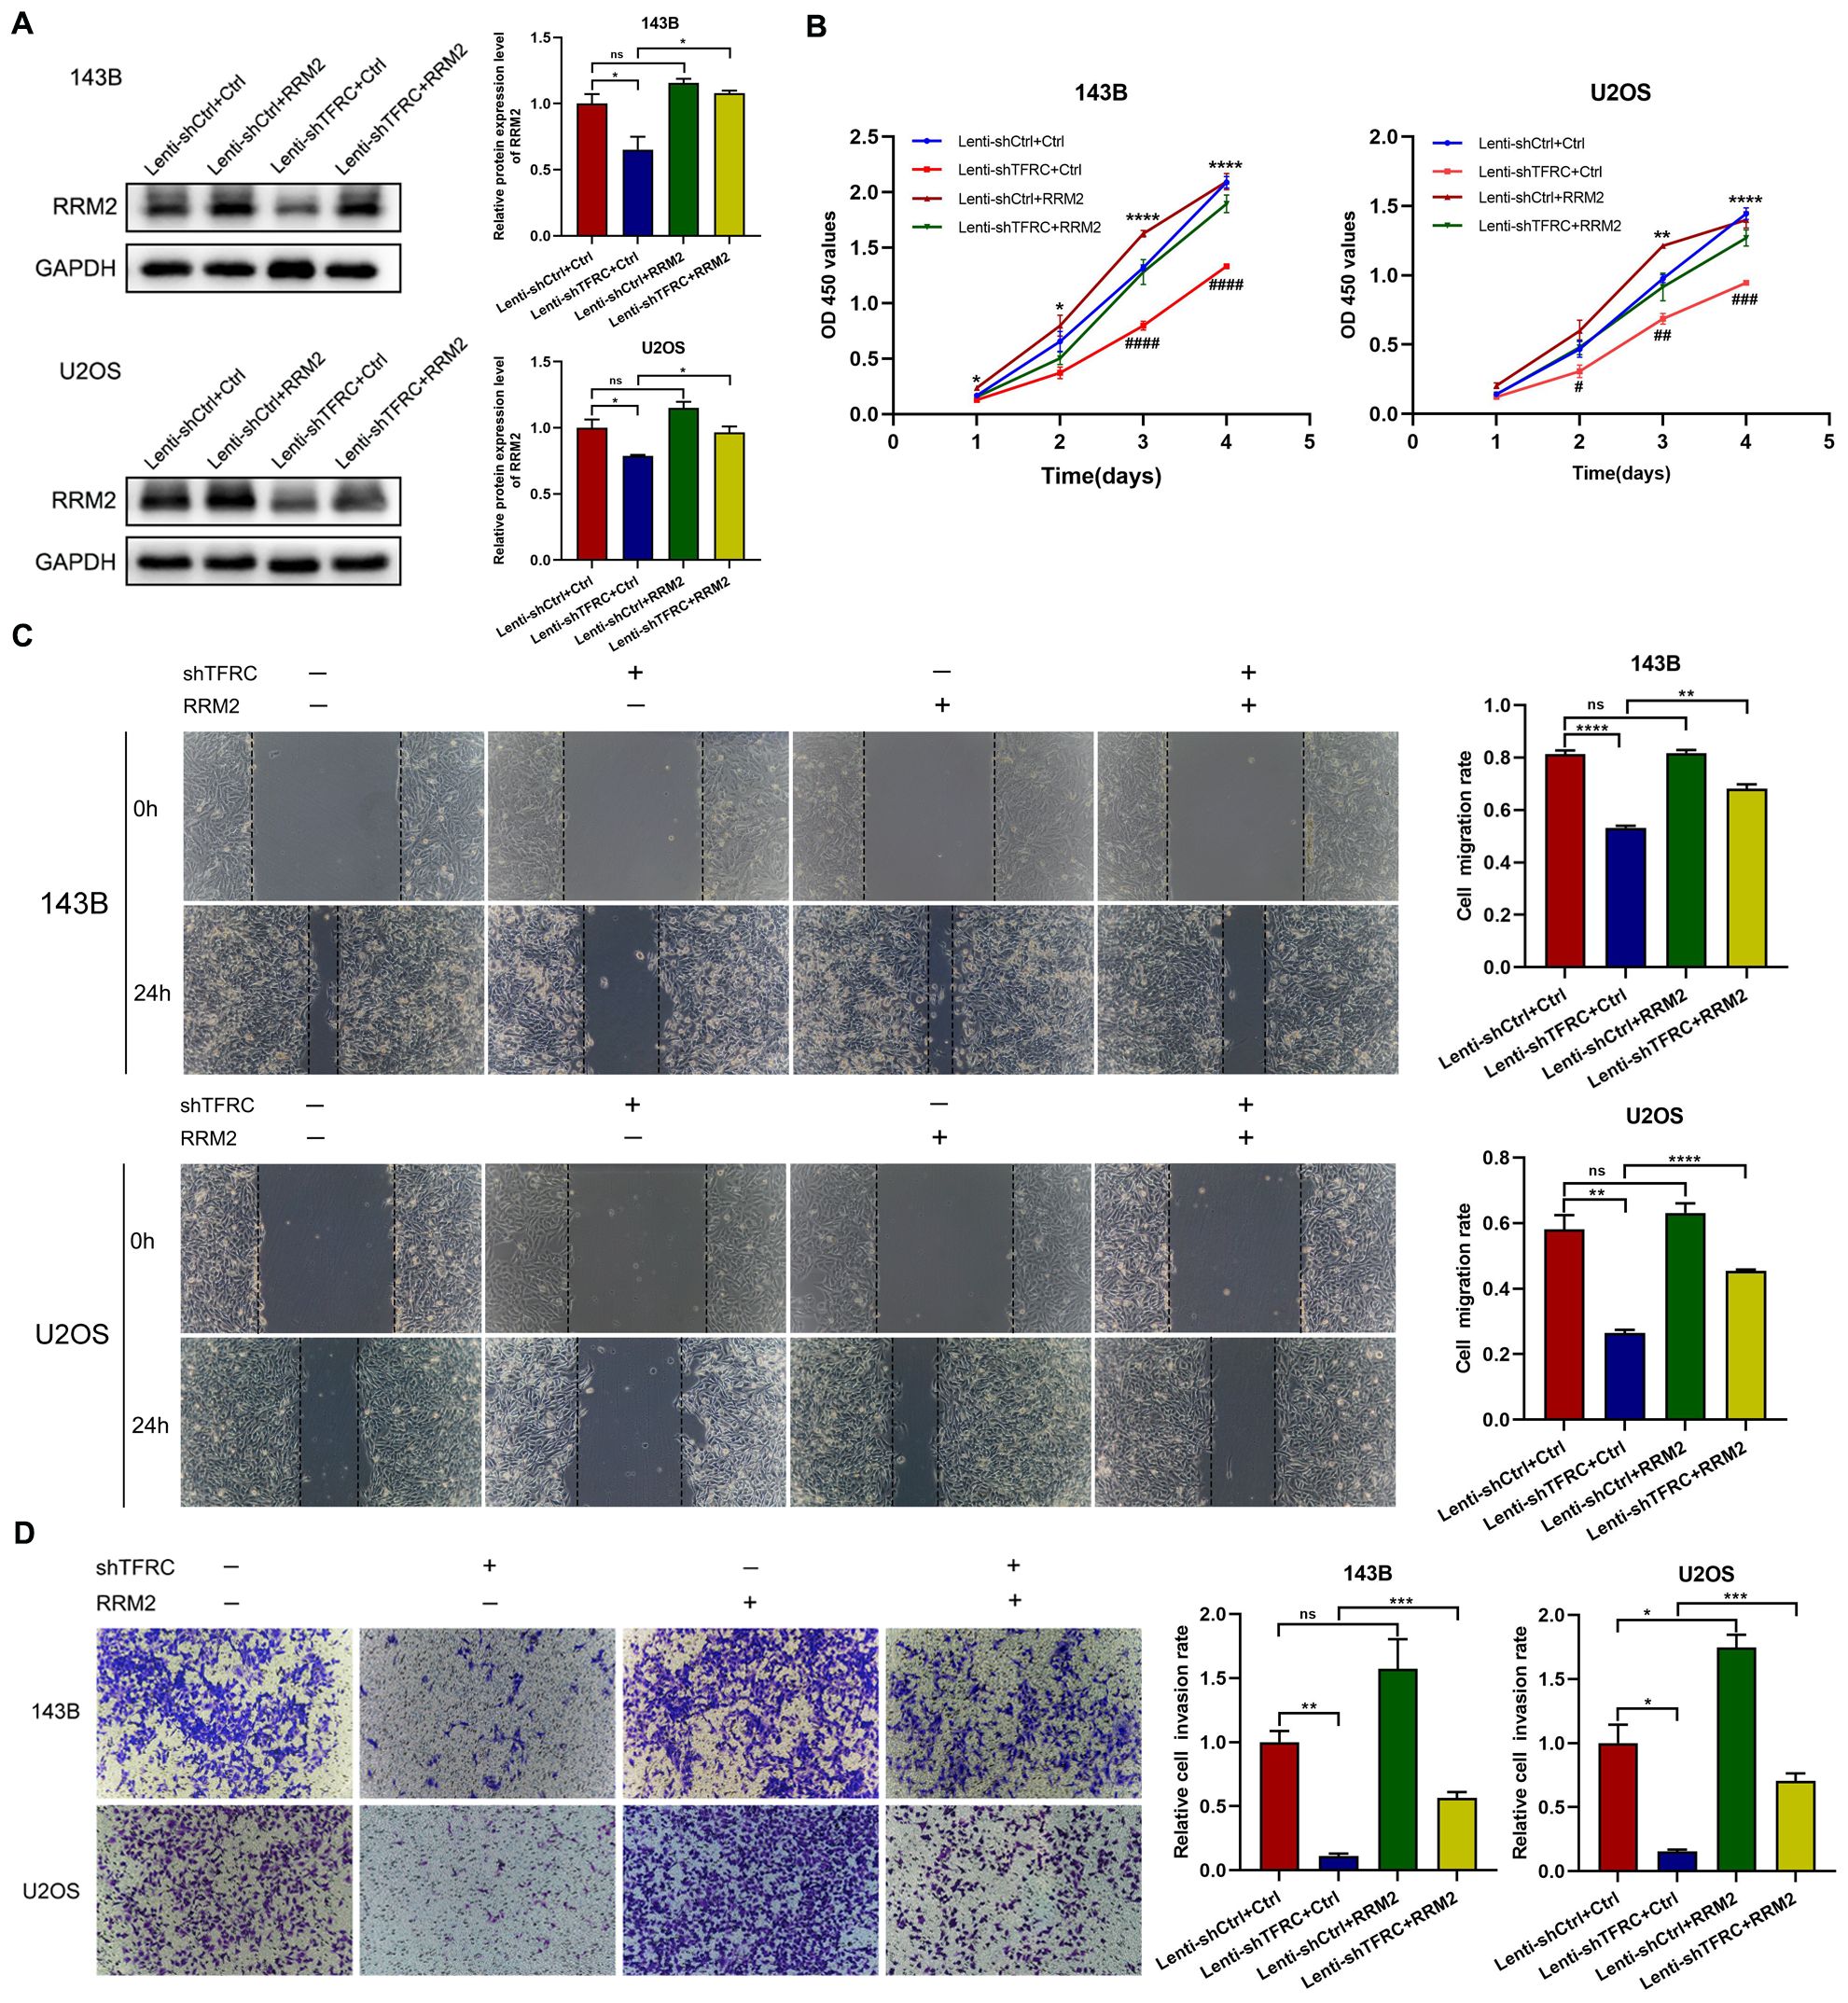
Figure 4. The upregulation of RRM2 rescues the decreases in the proliferation, migration, and invasion of human OS cells after TFRC knockdown. (A) Cells in the Lenti-shTFRC group (TFRC knockdown) and Lenti-shCtrl group (no TFRC knockdown) were transfected with the RRM2 overexpression plasmid or control plasmid. The Western blotting results revealed that RRM2 was upregulated by the RRM2 overexpression plasmid. (B) CCK-8 assays revealed that RRM2 upregulation significantly increased the proliferation ability of OS cells with TFRC knockdown compared with that of nonupregulated cells, especially on days 3 and 4. The asterisks indicate comparisons between the Lenti-shCtrl+Ctrl plasmid group and the Lenti-shTFRC+Ctrl plasmid group, and the pound signs indicate comparisons between the Lenti-shTFRC+Ctrl plasmid group and the Lenti-shTFRC+RRM2 plasmid group. (C) Wound healing assays revealed that by overexpressing RRM2, cell mobility after TFRC knockdown was also significantly improved. (D) The RRM2-overexpressing group had more invasive OS cells than did the control group after TFRC knockdown. Except for the CCK-8 assay data, which are presented as the means ± SDs, all other experimental data are presented as the means ± SEMs. *P< 0.05, **P< 0.01, ***P< 0.001, ****P< 0.0001, #P< 0.05, ##P< 0.01, ###P< 0.001, ####P< 0.0001.
FAC upregulates RRM2 expression and promotes the proliferation, migration, and invasion of OS cells after TFRC knockdown
To explore the interactions among TFRC, iron and RRM2 and their effects on OS cell function in depth, we further investigated the role of iron in human OS cells on the basis of our existing experiments. Because knockdown of TFRC reduced the total iron content in OS cells, we treated the cells with complete medium with or without 100 μM FAC. Compared with that in OS cells without FAC, total intracellular iron in OS cells was increased 48 hours after the addition of FAC (Figure 5A). The results of the CCK-8 assay revealed that, in OS cells with TFRC knockdown, the absorbance of cells treated with FAC was significantly greater than that of cells without FAC (Figure 5B). A wound healing assay revealed that the migration of cells after TFRC knockdown was also significantly improved by supplementation with exogenous iron (Figure 5C). Moreover, the Transwell invasion assay results revealed that the addition of FAC increased the invasion ability of OS cells after TFRC knockdown (Figure 5D). To our surprise, Western blotting revealed that the addition of FAC increased the protein expression level of RRM2 after TFRC knockdown (Figure 5E). These findings suggest that supplementation with exogenous iron may increase the expression of RRM2, leading to increased proliferation, migration, and invasion of TFRC-knockdown OS cells.
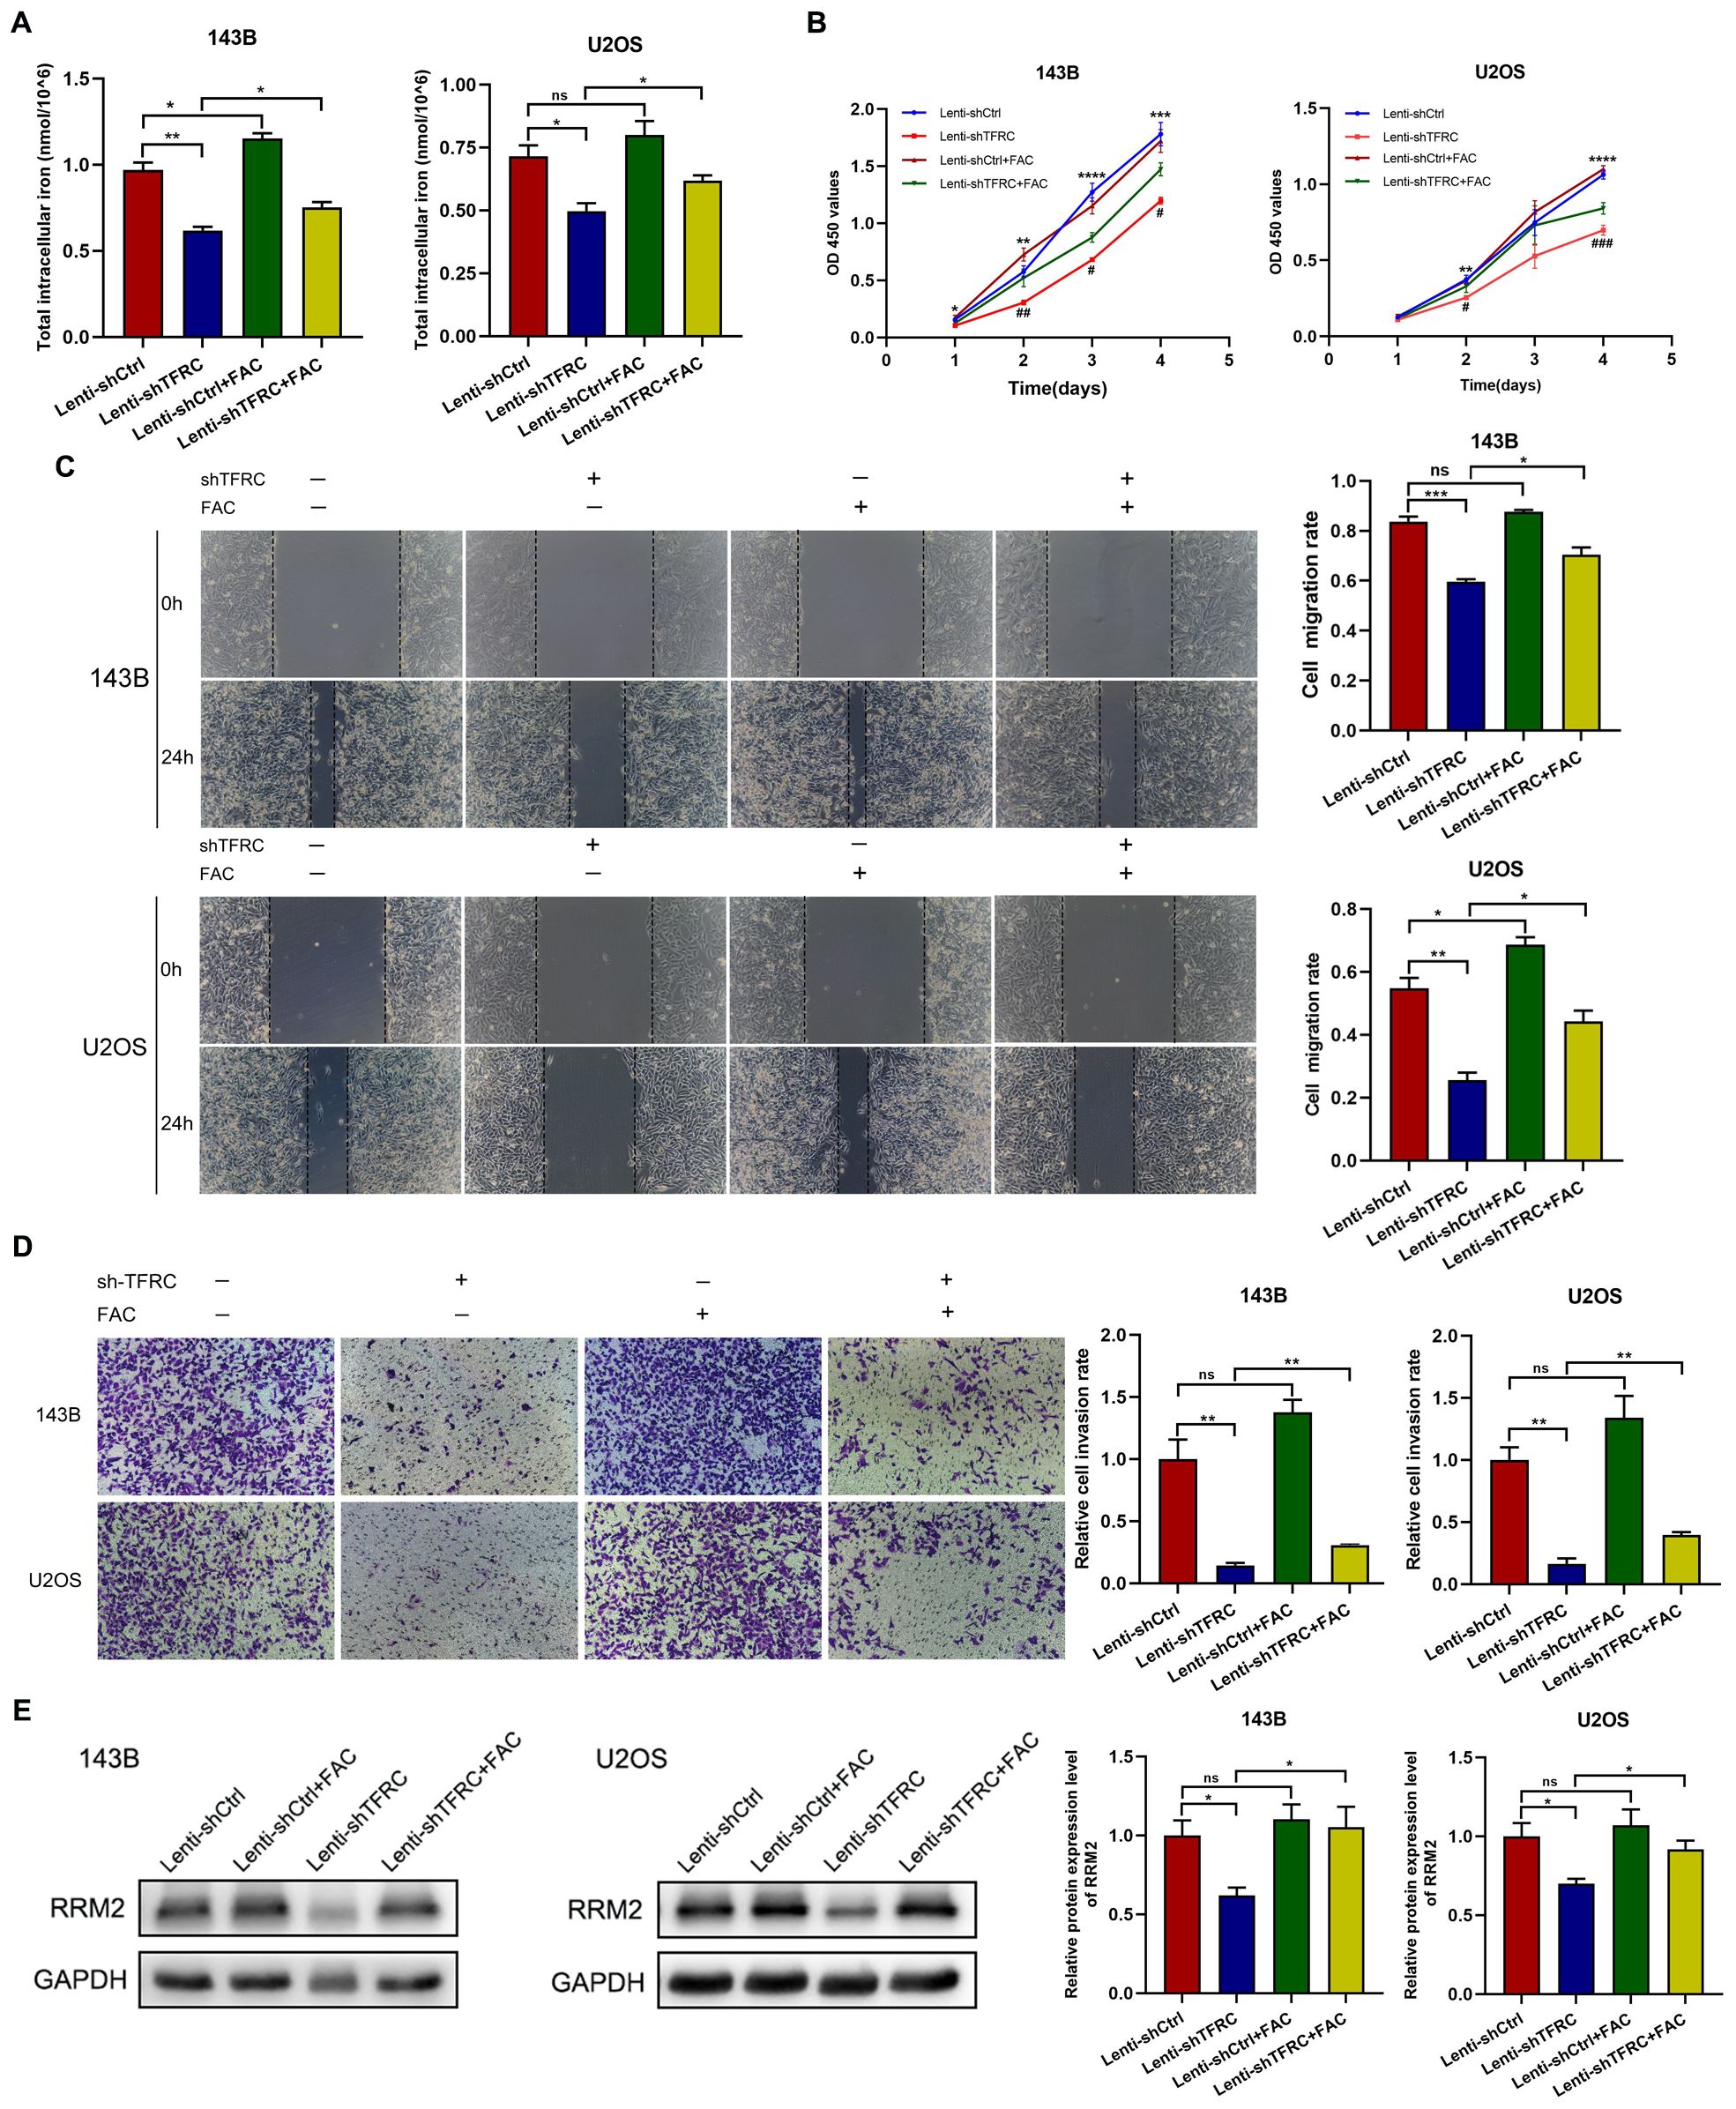
Figure 5. Ferric ammonium citrate (FAC) upregulates RRM2 expression in OS cells after TFRC knockdown and promotes proliferation, migration, and invasion. (A) Cells were incubated with complete medium supplemented with or without 100 μM FAC, and the total intracellular iron concentration was increased 48 hours after the addition of FAC compared with that in the absence of FAC. (B) CCK-8 assays revealed that, compared with the absence of FAC, the addition of FAC increased the proliferation of OS cells with TFRC knockdown. The asterisks indicate comparisons between the Lenti-shCtrl group and the Lenti-shTFRC group, and the pound signs indicate comparisons between the Lenti-shTFRC group and the Lenti-shTFRC+FAC group. (C) Wound healing assays revealed that the addition of FAC increased the mobility of OS cells after TFRC knockdown. (D) The group treated with FAC had more invasive OS cells than did the control group after TFRC knockdown. (E) The addition of FAC increased the protein expression level of RRM2, as determined by Western blotting, after TFRC knockdown. Except for the CCK-8 assay data, which are presented as the means ± SDs, all other experimental data are presented as the means ± SEMs. *P< 0.05, **P< 0.01, ***P< 0.001, ****P< 0.0001, #P< 0.05, ## P< 0.01, ### P< 0.001.
Knockdown of TFRC suppresses tumor formation in nude mice
To assess whether the proliferation of human OS cells in vivo was affected by TFRC knockdown, stable TFRC-knockdown or nonknockdown 143B cells (5 × 10⁶/mouse) were injected subcutaneously into nude mice, and all the mice were euthanized 3 weeks later. The results revealed that all of the mice had an increase in body weight, but there was no significant difference between the two groups (Figure 6A). Through measurement and calculation, the tumor volume in the control group was significantly greater than that in the TFRC-knockdown group, especially after day 15 (Figures 6B–D). The weights of the tumors in the control group (379.70 ± 95.44 mg) were also notably greater than those in the TFRC-knockdown group (137.62 ± 35.03 mg) (Figure 6E). Finally, qRT–PCR and Western blotting were performed on the removed tumors, and the results revealed that TFRC was still downregulated at the protein and mRNA levels in the TFRC-knockdown group (Figures 6F, G). Meanwhile, Western blotting assay revealed that RRM2 was also downregulated at the protein level (Figure 6G). These results suggest that the knockdown of TFRC inhibits the tumorigenicity of human OS cells in vivo.
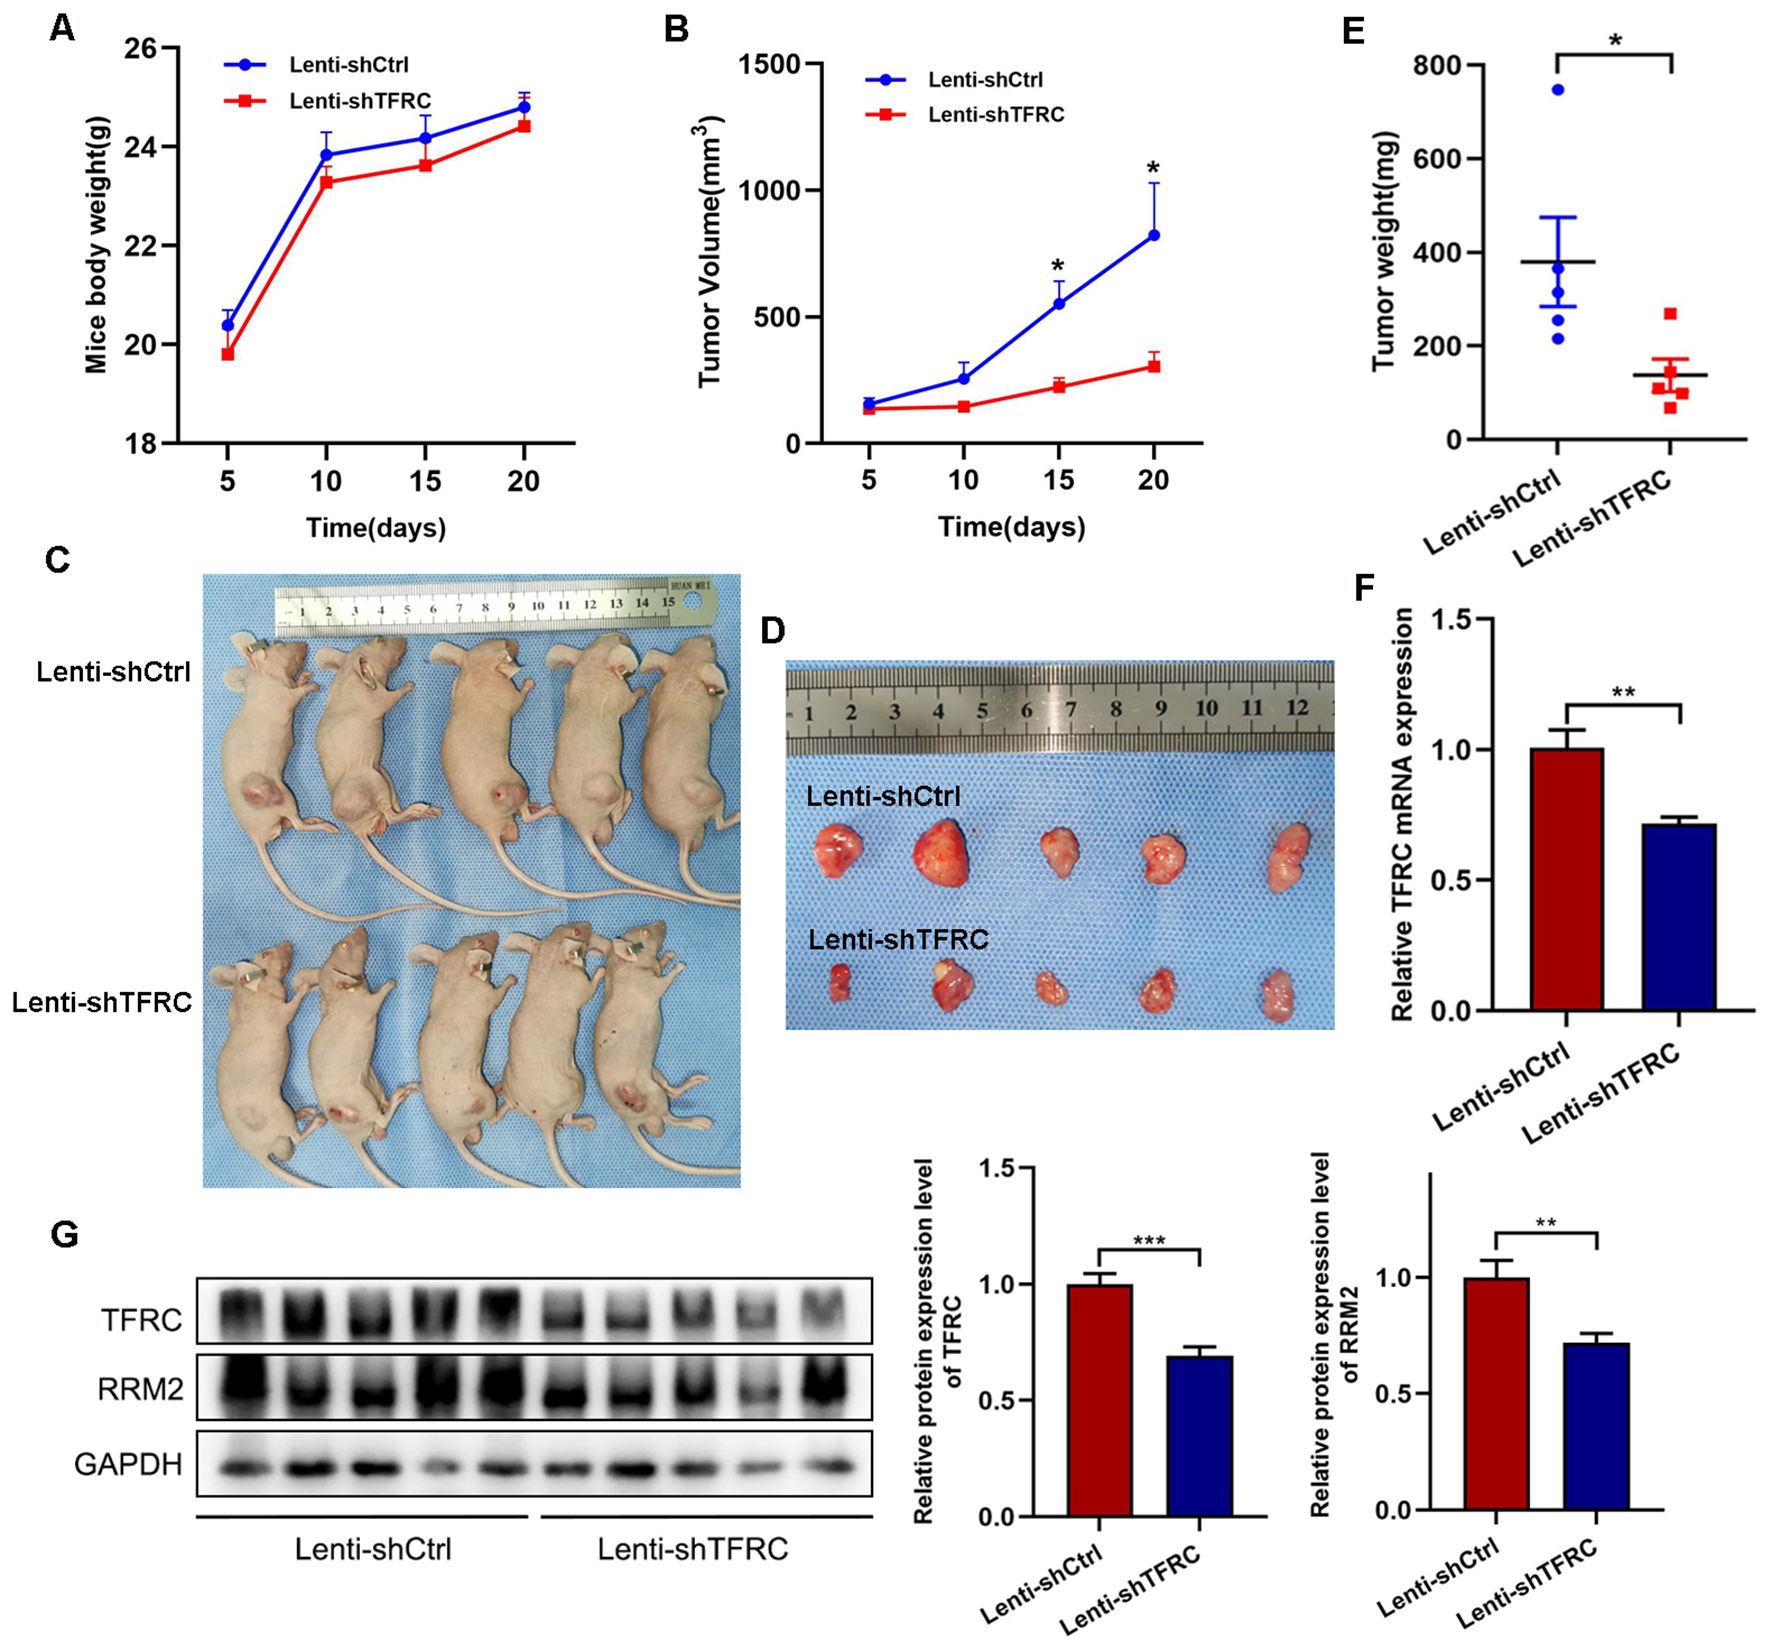
Figure 6. Xenograft tumor formation of 143B cells with TFRC knockdown in nude mice. (A) There was no significant difference in body weight among the groups of mice (n=5). (B, E) Compared with the control treatment, TFRC knockdown reduced the tumor volume and weight (n=5). (C, D) Each nude mouse was subcutaneously injected with 5 × 10⁶ TFRC-knockdown or nonknockdown 143B cells (n=5 per group). The mice were euthanized 3 weeks later, and the tumors were removed and photographed. (F, G) qRT–PCR and Western blotting were performed on the removed tumors (n=5). All the data are presented as the means ± SEMs, *P< 0.05, **P< 0.01, ***P< 0.001.
Discussion
Despite some progress in surgical interventions and neoadjuvant chemotherapy in recent years, the prognosis of osteosarcoma is still unsatisfactory. For patients diagnosed with metastasis, mainly lung metastasis (40), the 5-year survival rate sharply decreases to 20% (7) because of early metastasis of osteosarcoma and chemotherapy resistance (6). Therefore, exploring new molecular mechanisms and new therapeutic targets is still the focus of osteosarcoma research. Through various experiments, we found that TFRC is generally highly expressed in osteosarcoma cells and affects the proliferation, migration and invasion of osteosarcoma cells by regulating the total intracellular iron level and RRM2 expression.
TFRC has been confirmed to be highly expressed in a variety of malignant tumors and provides a sufficient iron source to support the rapid proliferation of tumor cells by promoting iron endocytosis, which is also considered an important promoting factor for tumor cell growth and poor prognosis (16, 41, 42). Several previous studies have successfully inhibited the proliferation and invasion of various tumor cells, such as glioblastoma, lymphoma, ovarian cancer, and hepatocellular carcinoma cells, by inhibiting the TFRC gene (43–46). In this study, we analyzed several public databases and reported that TFRC is overexpressed in osteosarcoma and that this overexpression is associated with poor overall survival in osteosarcoma patients. Our subsequent experiments confirmed that TFRC is overexpressed at the mRNA and protein levels in four osteosarcoma cell lines: MNNG/HOS, U2OS, MG-63, and 143B. Compared with 12 samples of osteoblastoma tissues, 30 samples of clinical osteosarcoma tissues also presented high expression level of TFRC as determined by immunohistochemical staining. Moreover, after TFRC knockdown via lentivirus-mediated shRNA, the proliferation, migration and invasion ability of OS cells were significantly reduced, and TFRC knockdown effectively inhibited the tumorigenicity of OS cells in in vivo xenograft experiments. Similar results have also been reported by other scientists. Feng et al. knocked down TFRC in nasopharyngeal carcinoma, which inhibited the proliferation, migration, invasion and epithelial–mesenchymal transition of nasopharyngeal carcinoma cells (47). These findings provide an experimental basis for TFRC as a potential therapeutic target for OS. Surprisingly, in addition to the above conclusions, we observed an unexpected phenomenon during the research process. We unexpectedly detected the significant upregulation of TFRC in osteoclasts from osteoblastoma tissues. As an important cell type in bone, osteoclasts directly participate in calcium metabolism and bone remodeling, and the dysfunction of osteoclasts may be closely related to osteoporosis. Whether TFRC regulates the function of osteoclasts through certain mechanisms, affecting bone metabolism balance and leading to the development of osteoporosis, rheumatoid arthritis, Paget’s disease of bone, etc., is also a topic worthy of further in-depth research.
The mammalian RNR contains two subunits, α and β, which are encoded by RRM1 and RRM2 (or P53R2) genes respectively. The α subunit contains a catalytic site (C), an activity site (A) and a specificity site (S) for substrate selection. Within each β subunit resides both a μ-oxo-bridged di-nuclear iron cluster (Fe-O-Fe) and a tyrosyl radical (Y-O•), which constitutes the core structure essential for RNR catalytic activity (27, 28, 48, 49). However, due to its long half-life, RRM1 protein levels remain constant throughout the cell cycle, whereas RRM2 levels fluctuate (27, 28, 50, 51). RRM2 is an important enzyme involved in DNA synthesis and repair and plays crucial roles in cell proliferation, DNA replication, and maintenance of normal growth (52). RRM2 has been confirmed to be overexpressed in hepatocellular carcinoma, breast cancer, Ewing sarcoma and atypical teratoid rhabdoid tumors which is related to tumor progression and poor prognosis, and can also be used as a key marker for aggressive tumors (53–56). Inhibiting the expression or activity of RRM2, or both, can interfere with the dNTP pool, hinder DNA repair and replication, and thus increase the anticancer activity of chemotherapeutics, especially DNA-damaging drugs (52). Souglakos et al. reported that RRM2 mRNA expression in lung adenocarcinoma patients was positively correlated with the response to gemcitabine combination therapy, and compared with patients with high RRM2 mRNA expression, those with low RRM2 expression had greater drug sensitivity (57). Some scientists have also reported that the application of the antitumor drug didox, a derivative of hydroxyurea, can target RRM2 and inhibit its activity by quenching tyrosine free radicals at the enzyme active site, thereby suppressing the proliferation of liver cancer cells. However, the addition of ferric ammonium citrate reduced the inhibitory activity of didox in a dose-dependent manner (32). Our analysis of public databases revealed that RRM2 is overexpressed in osteosarcoma and that this overexpression is associated with poor overall survival in osteosarcoma patients. Western blotting revealed that RRM2 protein expression was also significantly reduced after TFRC was knocked down in OS cells. The transfection of RRM2-overexpressing plasmids partially reversed the decrease in the proliferation, migration, and invasion ability of osteosarcoma cells caused by TFRC knockdown. These findings suggest that there is a certain regulatory relationship between TFRC and RRM2, which may be one of the important pathways regulating the biological functions of OS cells. However, to our surprise, IHC experiments showed that RRM2-specific staining was notably weak in both osteosarcoma and osteoblastoma tissues. We evaluated several potential explanations for this finding. First, differences in cellular structure and physiological state across tissues can significantly impact epitope accessibility. In some tissue types, target epitopes may become masked or undergo post-translational modifications, preventing effective antibody binding and consequently reducing immunohistochemical detection sensitivity (58, 59). Our study included 30 OS specimens without pathological subtype classification and potential differences in RRM2 antigen status across various OS subtypes may account for this result. Secondly, the antibody we used may have exhibited weak antigen-binding affinity in IHC assays, resulting in poor tissue staining and making it unsuitable for immunohistochemical applications. Additionally, we cannot rule out potential technical influences from tissue processing, fixation, or antigen retrieval procedures. However, we recommend exercising caution when selecting IHC methodologies for future RRM2 studies in osteosarcoma.
As an essential metal cofactor for RRM2, iron plays a key role in the metabolism, proliferation and growth of tumor cells (16). Iron deficiency reduces the bioavailability of iron-related cofactors, thereby reducing the catalytic activity of many iron-dependent enzymes, including RNR (60). In their study on Parkinson’s disease, Key et al. reported that iron deprivation reduced RRM2 mRNA expression in mouse and human fibroblasts, leading to decreased availability of dNTPs for mtDNA repair and increased release of superoxide from uncoupled mitochondria, resulting in mtDNA damage (61). Our research revealed that TFRC knockdown leads to a decrease in the total intracellular iron content, while the addition of FAC increases not only the total intracellular iron content in OS cells after TFRC knockdown but also the expression of RRM2, effectively rescuing the decrease in OS cell proliferation, migration, and invasion caused by TFRC knockdown. Although the physiological correlation of RRM2 downregulation with low-iron conditions is not yet clear, Puig S et al. suggested that this is a cellular strategy to reduce the level of apo-RRM2 dimers (60).
However, this study also has some limitations. The utilization and regulation of iron in eukaryotic cells involves a complex network of proteins. While our study focused on TFRC, it did not account for other critical components of iron regulation, including ferritin, transferrin, ferroportin, iron regulatory proteins (IRPs), iron-responsive elements (IREs), and divalent metal transporter 1 (DMT1), etc., all of which play essential roles in cellular iron metabolism (9, 62, 63). In addition, there are biological and genetic differences between cell line models and patient populations. Although we used widely recognized osteosarcoma cell lines such as 143B and U2OS, these cells may lose tumor heterogeneity characteristics in long-term passaging (64). The growth microenvironment of xenografted OS cells in nude mice differs from the tumor microenvironment in humans, which also plays a crucial role in tumor progression, invasion, metastasis, and angiogenesis (65, 66). Consequently, the generalizability and translational applicability of the findings from the cell line models and xenograft models to patient populations are worth considered. Moreover, our clinical sample size was limited, and we did not classify the pathological subtypes of osteosarcoma, which may have affected the accuracy of the IHC results.
Conclusion
Taken together, our experimental results suggested that OS cells regulate proliferation, migration, and invasion by overexpressing TFRC, which increases the transport of iron into the cell and increases the expression and activity of RRM2 (Figure 7). In this study, we not only verified the overexpression of TFRC in osteosarcoma and its important role in iron metabolism but also discovered that TFRC can participate in the proliferation, migration, and invasion activities of osteosarcoma by regulating RRM2, which provides potential molecular targets and new therapeutic strategies for the treatment of osteosarcoma. However, TFRC may also regulate the biological functions of OS cells through many other complex pathways. How does TFRC affect DNA replication and repair in the absence of iron? Are there any other iron-dependent enzymes that act simultaneously? What specific role does iron play in different DNA metabolism steps? All these aspects need to be further studied.
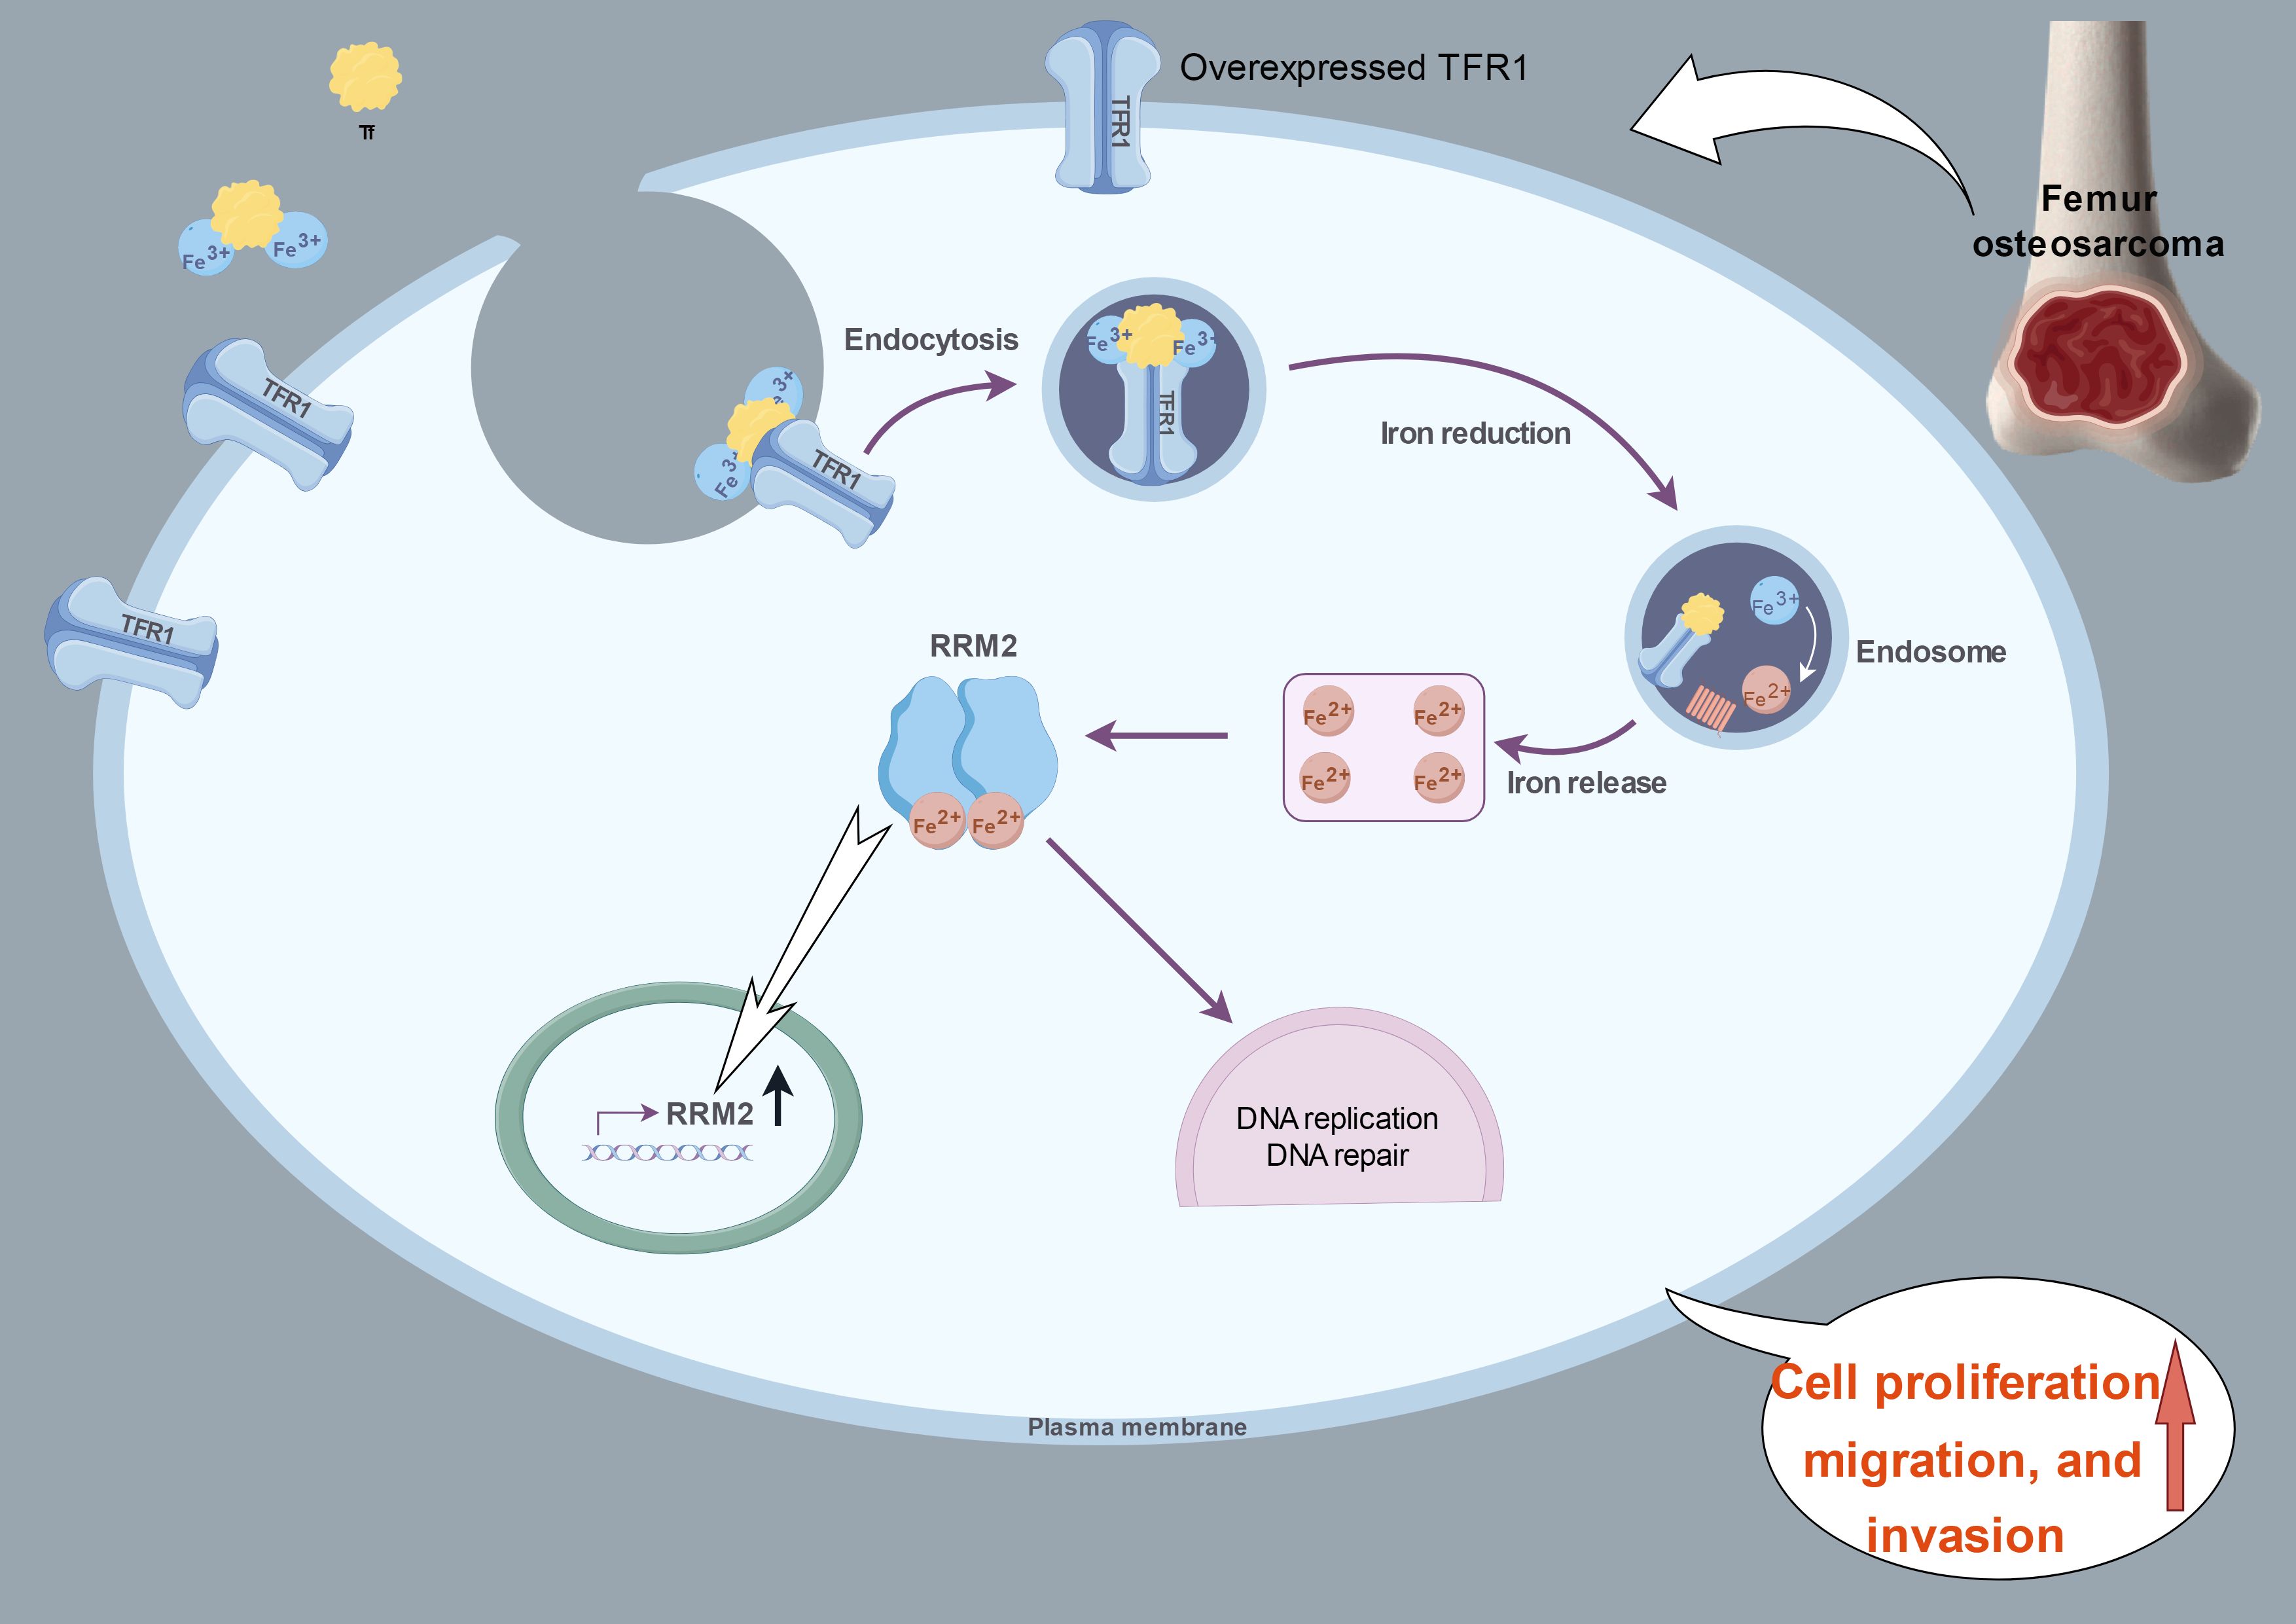
Figure 7. A proposed schematic model: in OS cells, TFRC is overexpressed and increases the intracellular iron content and RRM2 expression. This image summarizing this mechanism was created at www.figdraw.com.
Data availability statement
The datasets presented in this article are readily available, and requests to access the datasets should be directed to bWVkZG9jcmdxQDE2My5jb20=.
Ethics statement
The studies involving humans were approved by Ethics Committee on Scientific Research of Shandong University Qilu Hospital. The studies were conducted in accordance with the local legislation and institutional requirements. Written informed consent for participation in this study was provided by the participants’ legal guardians/next of kin. The animal study was approved by Ethics Committee on Animal Experiments of Shandong University Qilu Hospital. The study was conducted in accordance with the local legislation and institutional requirements.
Author contributions
GR: Methodology, Writing – original draft, Writing – review & editing, Visualization. JZ: Project administration, Writing – original draft. YS: Data curation, Formal Analysis, Investigation, Software, Writing – review & editing. QY: Methodology, Project administration, Resources, Writing – review & editing. JL: Conceptualization, Methodology, Project administration, Supervision, Writing – review & editing.
Funding
The author(s) declare that no financial support was received for the research, and/or publication of this article.
Acknowledgments
We thank Qilu Hospital of Shandong University for its help with the clinical samples and the laboratory, and the Key Laboratory of Cardiovascular Remodeling and Function Research, Chinese Ministry of Health, for providing a good experimental platform.
Conflict of interest
The authors declare that the research was conducted in the absence of any commercial or financial relationships that could be construed as a potential conflict of interest.
Generative AI statement
The author(s) declare that no Generative AI was used in the creation of this manuscript.
Publisher’s note
All claims expressed in this article are solely those of the authors and do not necessarily represent those of their affiliated organizations, or those of the publisher, the editors and the reviewers. Any product that may be evaluated in this article, or claim that may be made by its manufacturer, is not guaranteed or endorsed by the publisher.
References
1. Isakoff MS, Bielack SS, Meltzer P, and Gorlick R. Osteosarcoma: current treatment and a collaborative pathway to success. J OF Clin Oncol. (2015) 33:3029–U127. doi: 10.1200/JCO.2014.59.4895
2. Strauss SJ, Frezza AM, Abecassis N, Bajpai J, Bauer S, Biagini R, et al. Bone sarcomas: ESMO-EURACAN-GENTURIS-ERN PaedCan Clinical Practice Guideline for diagnosis, treatment and follow-up. Ann OF Oncol. (2021) 32:1520–36. doi: 10.1016/j.annonc.2021.08.1995
3. Brookes MJ, Chan CD, Baljer B, Wimalagunaratna S, Crowley TP, Ragbir M, et al. Surgical advances in osteosarcoma. Cancers. (2021) 13. doi: 10.3390/cancers13030388
4. Mirabello L, Troisi RJ, and Savage SA. Osteosarcoma incidence and survival rates from 1973 to 2004 data from the surveillance, epidemiology, and end results program. CANCER. (2009) 115:1531–43. doi: 10.1002/cncr.v115:7
5. Gill J and Gorlick R. Advancing therapy for osteosarcoma. Nat Rev Clin Oncol. (2021) 18:609–24. doi: 10.1038/s41571-021-00519-8
6. Belayneh R, Fourman MS, Bhogal S, and Weiss KR. Update on osteosarcoma. Curr Oncol REPORTS. (2021) 23. doi: 10.1007/s11912-021-01053-7
7. Marchandet L, Lallier M, Charrier C, Baud’huin M, Ory B, and Lamoureux F. Mechanisms of resistance to conventional therapies for osteosarcoma. Cancers. (2021) 13. doi: 10.3390/cancers13040683
8. Subramaniam D, Angulo P, Ponnurangam S, Dandawate P, Ramamoorthy P, Srinivasan P, et al. Suppressing STAT5 signaling affects osteosarcoma growth and stemness. Cell Death Dis. (2020) 11. doi: 10.1038/s41419-020-2335-1
9. Manz DH, Blanchette NL, Paul BT, Torti FM, and Torti SV. Iron and cancer: recent insights. Ann N Y Acad Sci (2016). 1368(1):149–61. doi: 10.1111/nyas.13008
10. Torti SV and Torti FM. Iron: The cancer connection. Mol Aspects Of Medicine. (2020) 75. doi: 10.1016/j.mam.2020.100860
11. Zhang C. Essential functions of iron-requiring proteins in DNA replication, repair and cell cycle control. Protein Cell. (2014) 5:750–60. doi: 10.1007/s13238-014-0083-7
12. Fillebeen C, Charlebois E, Wagner J, Katsarou A, Mui J, Vali H, et al. Transferrin receptor 1 controls systemic iron homeostasis by fine-tuning hepcidin expression to hepatocellular iron load. BLOOD. (2019) 133:344–55. doi: 10.1182/blood-2018-05-850404
13. Candelaria PV, Leoh LS, Penichet ML, and Daniels-Wells TR. Antibodies targeting the transferrin receptor 1 (TfR1) as direct anti-cancer agents. Front IN Immunol. (2021) 12. doi: 10.3389/fimmu.2021.607692
14. Kerins MJ and Ooi A. The roles of NRF2 in modulating cellular iron homeostasis. ANTIOXIDANTS Redox Signaling. (2018) 29:1756–73. doi: 10.1089/ars.2017.7176
15. Shen Y, Li X, Dong D, Zhang B, Xue Y, and Shang P. Transferrin receptor 1 in cancer: a new sight for cancer therapy. Am J OF Cancer Res. (2018) 8:916–31.
16. Jung M, Mertens C, Tomat E, and Bruene B. Iron as a central player and promising target in cancer progression. Int J OF Mol Sci. (2019) 20. doi: 10.3390/ijms20020273
17. Morales M and Xue X. Targeting iron metabolism in cancer therapy. THERANOSTICS. (2021) 11:8412–29. doi: 10.7150/thno.59092
18. Zhang D, Duque-Jimenez J, Facchinetti F, Brixi G, Rhee K, Feng WW, et al. Transferrin receptor targeting chimeras for membrane protein degradation. NATURE. (2025) 638:787–95. doi: 10.1038/s41586-024-07947-3
19. Das BK, Wang L, Fujiwara T, Zhou J, Aykin-Burns N, Krager KJ, et al. Transferrin receptor 1-mediated iron uptake regulates bone mass in mice via osteoclast mitochondria and cytoskeleton. Elife. (2022) 11. doi: 10.7554/eLife.73539.sa2
20. Kim H, Villareal LB, Liu Z, Haneef M, Falcon DM, Martin DR, et al. Transferrin receptor-mediated iron uptake promotes colon tumorigenesis. Advanced Sci. (2023) 10. doi: 10.1002/advs.202207693
21. Adachi M, Kai K, Yamaji K, Ide T, Noshiro H, Kawaguchi A, et al. Transferrin receptor 1 overexpression is associated with tumour de-differentiation and acts as a potential prognostic indicator of hepatocellular carcinoma. Histopathology. (2019) 75:63–73. doi: 10.1111/his.2019.75.issue-1
22. Rychtarcikova Z, Lettlova S, Tomkova V, Korenkova V, Langerova L, Simonova E, et al. Tumor-initiating cells of breast and prostate origin show alterations in the expression of genes related to iron metabolism. Oncotarget. (2017) 8:6376–98. doi: 10.18632/oncotarget.14093
23. Horniblow RD, Bedford M, Hollingworth R, Evans S, Sutton E, Lal N, et al. BRAF mutations are associated with increased iron regulatory protein-2 expression in colorectal tumorigenesis. Cancer Sci. (2017) 108:1135–43. doi: 10.1111/cas.2017.108.issue-6
24. Wang B, Zhang J, Song F, Tian M, Shi B, Jiang H, et al. EGFR regulates iron homeostasis to promote cancer growth through redistribution of transferrin receptor 1. Cancer LETTERS. (2016) 381:331–40. doi: 10.1016/j.canlet.2016.08.006
25. Rosager AM, Sorensen MD, Dahlrot RH, Hansen S, Schonberg DL, Rich JN, et al. Transferrin receptor-1 and ferritin heavy and light chains in astrocytic brain tumors: Expression and prognostic value. PloS One. (2017) 12. doi: 10.1371/journal.pone.0182954
26. Daniels TR, Delgado T, Rodriguez JA, Helguera G, and Penichet ML. The transferrin receptor part I: Biology and targeting with cytotoxic antibodies for the treatment of cancer. Clin Immunol. (2006) 121:144–58. doi: 10.1016/j.clim.2006.06.010
27. Aye Y, Li M, Long MJC, and Weiss RS. Ribonucleotide reductase and cancer: biological mechanisms and targeted therapies. Oncogene. (2015) 34:2011–21. doi: 10.1038/onc.2014.155
28. Zuo Z, Zhou Z, Chang Y, Liu Y, Shen Y, Li Q, et al. Ribonucleotide reductase M2 (RRM2): Regulation, function and targeting strategy in human cancer. Genes Diseases. (2024) 11:218–33. doi: 10.1016/j.gendis.2022.11.022
29. Wang L-m, Lij F-f, Zhang S-y, Yao R-y, Xing X-m, and Wei Z-m. Overexpression of catalytic subunit M2 in patients with ovarian cancer. Chin Med J. (2012) 125:2151–6. doi: 10.1111/j.1365-2559.2010.03725.x
30. Morikawa T, Maeda D, Kume H, Homma Y, and Fukayama M. Ribonucleotide reductase M2 subunit is a novel diagnostic marker and a potential therapeutic target in bladder cancer. Histopathology. (2010) 57:885–92. doi: 10.1111/j.1365-2559.2010.03725.x
31. Liu X, Zhang H, Lai L, Wang X, Loera S, Xue L, et al. Ribonucleotide reductase small subunit M2 serves as a prognostic biomarker and predicts poor survival of colorectal cancers. Clin Sci. (2013) 124:567–78. doi: 10.1042/CS20120240
32. Asperti M, Cantamessa L, Ghidinelli S, Gryzik M, Denardo A, Giacomini A, et al. The antitumor didox acts as an iron chelator in hepatocellular carcinoma cells. Pharmaceuticals. (2019) 12. doi: 10.3390/ph12030129
33. Kuijjer ML, Rydbeck H, Kresse SH, Buddingh EP, Lid AB, Roelofs H, et al. Identification of osteosarcoma driver genes by integrative analysis of copy number and gene expression data. Genes Chromosomes CANCER. (2012) 51:696–706. doi: 10.1002/gcc.21956
34. Kuijjer ML, Peterse EFP, van den Akker BEWM, Briaire-de Bruijn IH, Serra M, Meza-Zepeda LA, et al. IR/IGF1R signaling as potential target for treatment of high-grade osteosarcoma. BMC Cancer. (2013) 13. doi: 10.1186/1471-2407-13-245
35. Tang Z, Li C, Kang B, Gao G, Li C, and Zhang Z. GEPIA: a web server for cancer and normal gene expression profiling and interactive analyses. Nucleic Acids Res. (2017) 45:W98–W102. doi: 10.1093/nar/gkx247
36. GTEx Consortium. The genotype-tissue expression (GTEx) project. Nat Genet. (2013) 45:580–5. doi: 10.1038/ng.2653
37. Rienzo M, Schiano C, Casamassimi A, Grimaldi V, Infante T, and Napoli C. Identification of valid reference housekeeping genes for gene expression analysis in tumor neovascularization studies. Clin Trans Oncol. (2013) 15:211–8. doi: 10.1007/s12094-012-0904-1
38. Fromowitz FB, Viola MV, Chao S, Oravez S, Mishriki Y, Finkel G, et al. ras p21 expression in the progression of breast cancer. Hum pathol. (1987) 18:1268–75. doi: 10.1016/S0046-8177(87)80412-4
39. Kramer N, Walzl A, Unger C, Rosner M, Krupitza G, Hengstschlaeger M, et al. In vitro cell migration and invasion assays. Mutat Research-Reviews IN Mutat Res. (2013) 752:10–24. doi: 10.1016/j.mrrev.2012.08.001
40. Pakos EE, Nearchou AD, Grimer RJ, Koumoullis HD, Abudu A, Bramer JAM, et al. Prognostic factors and outcomes for osteosarcoma: An international collaboration. Eur J Of Cancer. (2009) 45:2367–75. doi: 10.1016/j.ejca.2009.03.005
41. Cao J, Hu C, Xu J, Han J, Zhang R, Cao M, et al. Aberrant expression TFR1/CD71 in gastric cancer identifies a novel potential prognostic marker and therapeutic target. Evidence-Based Complementary and Altern Med. (2022) 2022. doi: 10.1155/2022/4257342
42. Arora R, Haynes L, Kumar M, McNeil R, Ashkani J, Nakoneshny SC, et al. NCBP2 and TFRC are novel prognostic biomarkers in oral squamous cell carcinoma. Cancer Gene Ther. (2023) 30:752–65. doi: 10.1038/s41417-022-00578-8
43. Chitambar CR, Al-Gizawiy MM, Alhajala HS, Pechman KR, Wereley JP, Wujek R, et al. Gallium maltolate disrupts tumor iron metabolism and retards the growth of glioblastoma by inhibiting mitochondrial function and ribonucleotide reductase. Mol Cancer Ther. (2018) 17:1240–50. doi: 10.1158/1535-7163.MCT-17-1009
44. Crepin R, Goenaga A-L, Jullienne B, Bougherara H, Legay C, Benihoud K, et al. Development of human single-chain antibodies to the transferrin receptor that effectively antagonize the growth of leukemias and lymphomas. Cancer Res. (2010) 70:5497–506. doi: 10.1158/0008-5472.CAN-10-0938
45. Huang Y, Huang J, Huang Y, Gan L, Long L, Pu A, et al. TFRC promotes epithelial ovarian cancer cell proliferation and metastasis via up-regulation of AXIN2 expression. Am J OF Cancer Res. (2020) 10:131–47.
46. Xiao C, Fu X, Wang Y, Liu H, Jiang Y, Zhao Z, et al. Transferrin receptor regulates Malignancies and the stemness of hepatocellular carcinoma-derived cancer stem-like cells by affecting iron accumulation. . PloS One. (2020) 15. doi: 10.1371/journal.pone.0243812
47. Feng G, Arima Y, Midorikawa K, Kobayashi H, Oikawa S, Zhao W, et al. Knockdown of TFRC suppressed the progression of nasopharyngeal carcinoma by downregulating the PI3K/Akt/mTOR pathway. Cancer Cell Int. (2023) 23. doi: 10.1186/s12935-023-02995-7
48. Zhang Y, Li H, Zhang C, An X, Liu L, Stubbe J, et al. Conserved electron donor complex Dre2-Tah18 is required for ribonucleotide reductase metallocofactor assembly and DNA synthesis. Proc of the Natl Acad OF Sci Of the United States of America. (2014) 111:E1695–E704. doi: 10.1073/pnas.1405204111
49. Fairman JW, Wijerathna SR, Ahmad MF, Xu H, Nakano R, Jha S, et al. Structural basis for allosteric regulation of human ribonucleotide reductase by nucleotide-induced oligomerization. Nat Struct Mol Biol. (2011) 18:316–U102. doi: 10.1038/nsmb.2007
50. Håkansson P, Hofer A, and Thelander L. Regulation of mammalian ribonucleotide reduction and dNTP pools after DNA damage and in resting cells. J OF Biol Chem. (2006) 281:7834–41. doi: 10.1074/jbc.M512894200
51. Engstrom Y, Eriksson S, Jildevik I, Skog S, Thelander L, and Tribukait B. Cell cycle-dependent expression of mammalian ribonucleotide reductase - differential regulation of the 2 subunits. J Biol Chem. (1985) 260:9114–6.
52. Zhan Y, Jiang L, Jin X, Ying S, Wu Z, Wang L, et al. Inhibiting RRM2 to enhance the anticancer activity of chemotherapy. Biomed Pharmacother. (2021) 133. doi: 10.1016/j.biopha.2020.110996
53. Putluri N, Maity S, Kommangani R, Creighton CJ, Putluri V, Chen F, et al. Pathway-centric integrative analysis identifies RRM2 as a prognostic marker in breast cancer associated with poor survival and tamoxifen resistance. Neoplasia. (2014) 16:390–402. doi: 10.1016/j.neo.2014.05.007
54. Yang Y, Lin J, Guo S, Xue X, Wang Y, Qiu S, et al. RRM2 protects against ferroptosis and is a tumor biomarker for liver cancer. Cancer Cell Int. (2020) 20. doi: 10.1186/s12935-020-01689-8
55. Ohmura S, Marchetto A, Orth MF, Li J, Jabar S, Ranft A, et al. Translational evidence for RRM2 as a prognostic biomarker and therapeutic target in Ewing sarcoma. Mol Cancer. (2021) 20. doi: 10.1186/s12943-021-01393-9
56. Giang LH, Wu K-S, Lee W-C, Chu S-S, Do AD, Changou CA, et al. Targeting of RRM2 suppresses DNA damage response and activates apoptosis in atypical teratoid rhabdoid tumor. J Of Exp Clin Cancer Res. (2023) 42. doi: 10.1186/s13046-023-02911-x
57. Souglakos J, Boukovinas I, Taron M, Mendez P, Mavroudis D, Tripaki M, et al. Ribonucleotide reductase subunits M1 and M2 mRNA expression levels and clinical outcome of lung adenocarcinoma patients treated with docetaxel/gemcitabine. Br J Of Cancer. (2008) 98:1710–5. doi: 10.1038/sj.bjc.6604344
58. Li Z and Dabbs DJ. Avoiding “False positive” and “False negative” Immunohistochemical results in breast pathology. Pathobiology. (2022) 89:309–23. doi: 10.1159/000521682
59. Gown AM. Diagnostic immunohistochemistry what can go wrong and how to prevent it. Arch Of Pathol Lab Medicine. (2016) 140:893–8. doi: 10.5858/arpa.2016-0119-RA
60. Puig S, Ramos-Alonso L, Maria Romero A, and Teresa Martinez-Pastor M. The elemental role of iron in DNA synthesis and repair. Metallomics. (2017) 9:1483–500. doi: 10.1039/C7MT00116A
61. Key J, Sen NE, Arsovic A, Kramer S, Hulse R, Khan NN, et al. Systematic surveys of iron homeostasis mechanisms reveal ferritin superfamily and nucleotide surveillance regulation to be modified by PINK1 absence. Cells. (2020) 9. doi: 10.20944/preprints202009.0108.v1
62. Vashisht AA, Zumbrennen KB, Huang X, Powers DN, Durazo A, Sun D, et al. Control of iron homeostasis by an iron-regulated ubiquitin ligase. Science. (2009) 326:718–21. doi: 10.1126/science.1176333
63. Zhou L, Zhao B, Zhang L, Wang S, Dong D, Lv H, et al. Alterations in cellular iron metabolism provide more therapeutic opportunities for cancer. Int J Of Mol Sci. (2018) 19. doi: 10.3390/ijms19051545
64. Sayaman RW, Saad M, Thorsson V, Hu D, Hendrickx W, Roelands J, et al. Germline genetic contribution to the immune landscape of cancer. Immunity. (2021) 54:367. doi: 10.1016/j.immuni.2021.01.011
65. Nirala BK, Yamamichi T, Petrescu DI, Shafin TN, and Yustein JT. Decoding the impact of tumor microenvironment in osteosarcoma progression and metastasis. Cancers. (2023) 15. doi: 10.3390/cancers15205108
Keywords: TFRC, osteosarcoma, iron, RRM2, proliferation, migration, invasion
Citation: Ren G, Zhou J, Su Y, Yang Q and Li J (2025) TFRC promotes the proliferation, migration, and invasion of osteosarcoma cells by increasing the intracellular iron content and RRM2 expression. Front. Oncol. 15:1567216. doi: 10.3389/fonc.2025.1567216
Received: 26 January 2025; Accepted: 12 May 2025;
Published: 29 May 2025.
Edited by:
Iju Yeh, Indiana University, United StatesReviewed by:
Sivapar V. Mathan, All India Institute of Medical Sciences, IndiaMichela Asperti, University of Brescia, Italy
Copyright © 2025 Ren, Zhou, Su, Yang and Li. This is an open-access article distributed under the terms of the Creative Commons Attribution License (CC BY). The use, distribution or reproduction in other forums is permitted, provided the original author(s) and the copyright owner(s) are credited and that the original publication in this journal is cited, in accordance with accepted academic practice. No use, distribution or reproduction is permitted which does not comply with these terms.
*Correspondence: Jianmin Li, cWlsdWJvbmV0dW1vckBmb3htYWlsLmNvbQ==; Qiang Yang, eWFuZ3FpYW5nXzAxQDEyNi5jb20=
†These authors have contributed equally to this work