 Grace Folino1*
 Isabella Zent1†
 Lillian Eason1†
 Vikram Murugan1
 Taylor Billion1
 Ali Bin Abdul Jabbar2
 Mohsin Mirza2Abubakar Tauseef2
- 1Department of Internal Medicine, Creighton University School of Medicine, Omaha, NE, United States
- 2Internal Medicine Department, Creighton University School of Medicine, Omaha, NE, United States
Introduction: Despite advancements in cervical cancer screening and HPV vaccines, demographic disparities perpetuate the burden of cervical cancer. The aim of this study is to utilize the most up-to-date CDC WONDER data of cervical cancer mortality to provide a comprehensive temporal analysis of demographic variables and account for patients missed in other database studies. In doing so, temporal trends found in this study may be used to guide future efforts and studies to understand nuanced barriers to cervical cancer screening and prevention.
Methods: With CDC WONDER Data, cervical cancer-related mortality was assessed in the U.S. from 1999 to 2023. Using age-adjusted mortality rates (AAMR), temporal trends were analyzed using the Joinpoint Regression Program for women 25 years and older across race, census regions, urban/rural residence, and states. Annual percentage change (APC) and average annual percentage change (AAPC) were calculated with 95% confidence intervals.
Results: Cervical cancer-related mortality declined over the study period with an AAPC of –1.043*. Between 2015 and 2023, there was a concerning positive change in AAMR [APC of 0.1272 (95% CI –0.3393 to 1.7502)], though not statistically significant. Black or African American patients experienced the highest AAMR across races but maintained a decrease in mortality rate over the study period [AAPC of -2.670* (95% CI -2.931 to -2.356)]. Region and race analysis demonstrated Black or African American patients in the Northeast held the largest decline in AAMR [AAPC of –3.218* (95% CI –3.708 to –2.390)], while Hispanic or Latino and Black or African American patients in the South closely followed AAPC of –1.347* (–1.898 to –0.824) and –2.656* (95% CI –2.939 to -2.350), respectively]. Rural areas (NonCore and Micropolitan) and the Southern region displayed a concerning positive trend after 2009 and 2010, though not statistically significant [APC values of 0.772 (95% CI -0.328 to 4.888), 0.986 (95% CI –0.252 to 4.887), and 0.286 (95% CI –0.061 to 0.772), respectively].
Conclusion: These findings underscore the need for targeted interventions with consideration of regional and racial temporal disparities in cervical cancer-related mortality.
Introduction
Until recent innovation in screening and prevention, cervical cancer was one of the most common causes of cancer related deaths in women (1, 2). The development of the Pap smear significantly reduced the incidence of cervical cancer through early detection, with later improvements such as liquid based cytology and HPV DNA testing (3). Beginning in 2006, vaccination efforts against Human Papillomavirus (HPV) through the evolving Gardasil vaccines provided increasing strain coverage in the United States and offered another tool for prevention (4). Despite these advancements, demographic disparities continue to significantly influence the cervical cancer burden. For instance, minority populations, specifically Black patients, are shown to have a higher cervical cancer incidence and mortality (5). In addition, patients with lower socioeconomic status and residing in remote areas have worse outcomes due to varying vaccination and screening rates (6).
Current literature on cervical cancer demographics and prognostic factors focus on the analysis of the data derived from the Surveillance, Epidemiology, and End Results Database (SEER), the National Program for Cancer Registries (NPCR), the US Cancer Statistics Public Use Database, the Behavioral Risk Factor Surveillance System, the North American Association of Central Cancer Registries, and the Center for Disease Control and Prevention Wide ranging Online Data for Epidemiological Research (CDC WONDER) (4, 7–17). One of the most recent database studies used data from the NPCR and SEER from 2001 to 2014 to determine cervical cancer incidence before and after the introduction of HPV vaccination in US females aged from 15 to 34 years old. This age range excludes ages 35 to 44, the most frequent age range to be diagnosed with cervical cancer, and US females who may have not received the HPV vaccination (4). CDC WONDER has been used to compare non-Hispanic African American and White women, but this does not account for the diversity seen in the US population (5). Another study investigated age-adjusted mortality rates across gynecological cancer-related deaths from 1999 to 2020; however, this study did not stratify types of gynecological cancers and therefore does not provide age-adjusted mortality rates specific to cervical cancer (17).
This study aims to analyze the most recent cervical cancer data derived from the CDC WONDER database to evaluate temporal trends in mortality, which may be used to guide future, demographically targeted efforts against cervical cancer mortality. Demographic factors such as race, ethnicity, age groups, region, state, and urbanization will be included in this analysis to provide a more comprehensive understanding of underlying disparities in the cervical cancer population. Utilizing the CDC WONDER database from 1999 to 2023 will allow this study to capture patients excluded from previous studies.
Materials and methods
CDC WONDER was used to identify malignant neoplasm of the cervix uteri related deaths within the United States from 1999 to 2023. Data within the CDC WONDER is derived from cancer registries based on healthcare provider oncology reports and updated annually (18). Using mortality data extracted from death certificate records and the International Classification of Diseases, 10th Revision (ICD-10) codes is consistent with current literature investigating nationwide mortality trends (19, 20). Malignant neoplasm of the cervix related mortality was identified using ICD10, Clinical Malignant codes (C53). This analysis includes age groups 25 years and older, as malignant neoplasm of the cervix in individuals younger than 25 provides insufficient data through CDC WONDER, and current guidelines for cervical cancer screening begin at age 21 (3). CDC WONDER excludes any data that represents fewer than ten persons (18). All other cervical cancer patient data was included in this study to ensure comprehensive analysis of demographic trends. The study was exempt from institutional review board approval because CDC WONDER contains anonymized, publicly available data.
CDC WONDER stratifies data by race/ethnicity (non-Hispanic White, non-Hispanic Black or African American, non-Hispanic American Indian/Alaskan Native, non-Hispanic Asian/Pacific Islander, and Hispanic or Latino), ten-year age intervals (25-34, 35-44, 45-54, 55-64, 65-74, 75-84, 85 and above), urban-rural classification (utilizing the National Center for Health Statistics Urban-Rural Classification Scheme), and census regions (Northwest, Midwest, South, and West) as defined by the Census Bureau (21, 22).
The total number of subjects was 114,751. Malignant neoplasm of the cervix uteri-related crude and age-adjusted mortality rates (AAMR) were calculated. AAMR was reported for overall trends and for demographic subgroups such as race/ethnicity, region, and urban-rural classification to allow comparisons across populations with differing age structures. However, when stratified by specific age groups, only crude mortality rates were analyzed, as the CDC WONDER platform does not support the calculation of age-adjusted rates within age-restricted subgroups. This limitation likely arises from the incompatibility of adjusting age-specific groups against a standard population. Despite this, crude rates remain valuable for highlighting raw mortality patterns and were calculated by dividing the number of cervical cancer related deaths by the United States female population. The control for AAMR to allow for comparison of data was standardized using the United States population in the year 2000 (23). The Joinpoint Regression program (Joinpoint version 4.9.0.0 available from the National cancer Institute, Bethesda, Maryland) was used to analyze temporal trends in mortality and identify statistically significant changes in mortality trends by fitting linear models that best describe the data. This program applies a log-linear model to detect statistically significant changes in trend over time, automatically selecting the number and locations of Joinpoints using the Monte Carlo Permutation method to optimize model/best fit. The final model reports annual percentage (APC) with 95% confidence interval (CIs) for each segment between a Joinpoint and showcases the AAMRs calculated using the Monte Carlo Permutation test. Average Annual Percent Change (AAPC) and 95% CIs were calculated via the Joinpoint Regression Program by taking the weighted average of APC values. AAPCs demonstrated the reported mortality trend over the entire time period analyzed. APC and AAPCs were determined to be significant by using a two tailed t test with statistical significance set at p ≤ 0.05 (represented by asterisks ‘*’ in tables and figures). This study followed suit of previous CDC WONDER studies to calculate the AAMR and form Joinpoint Regressions (24–26).
Results
Overall
From 1999 to 2023, there were a total of 114,751 deaths from cervical cancer in the United States (Figure 1). Overall cervical cancer age-adjusted mortality rates (AAMR) declined significantly between 1999 and 2004 and again between 2004 and 2015 [APC of -3.472* (95% CI -4.808 to -2.690) and –0.771* (95% CI –1.975 to –0.467), respectively]. Between 2015 and 2023, there was no significant overall change in AAMR [APC of 0.127 (95% CI –0.339 to 1.750)] (Supplementary Table 1). Over the whole study timeframe, there was a significant average annual percent change (AAPC) of -1.043* (95% CI -1.179 to -0.897) (Table 1), demonstrating an overall consistent decreasing trend in age-adjusted mortality.
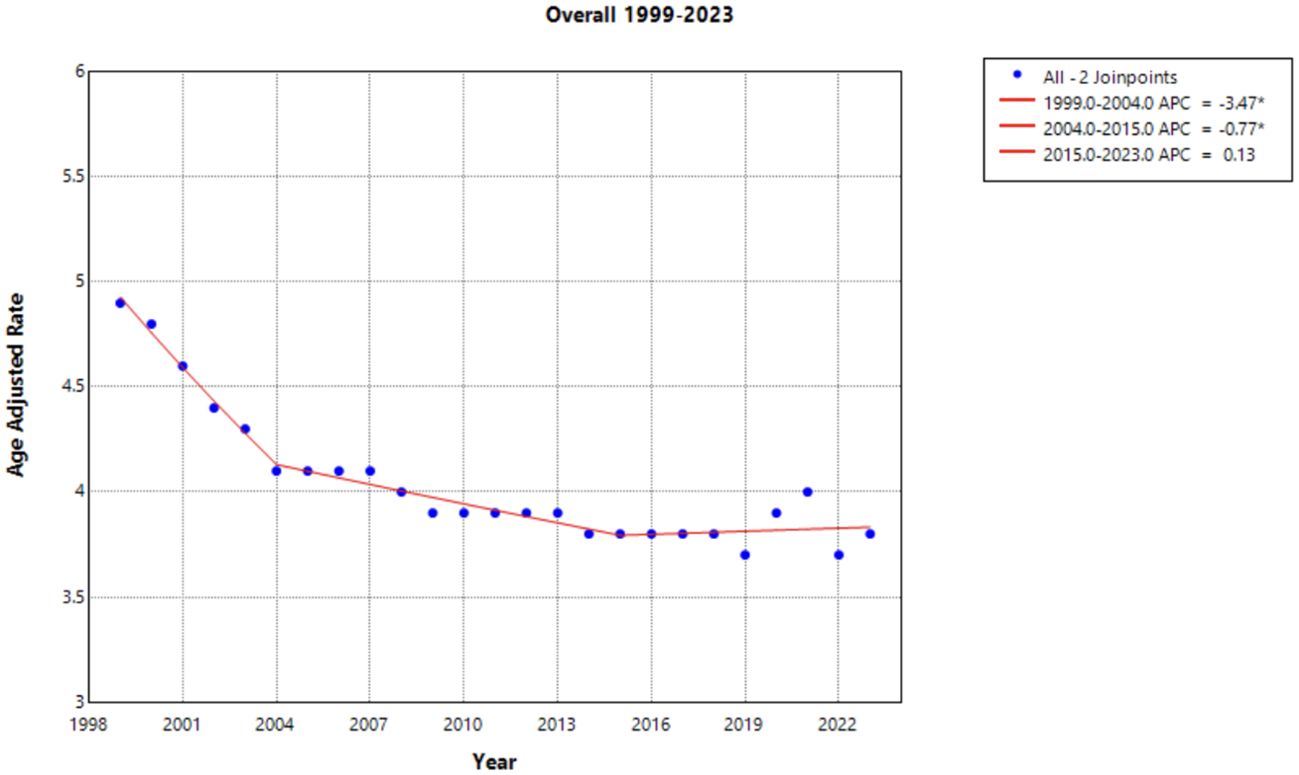
Figure 1. Joinpoint Model of Malignant Neoplasm of Cervix Uteri AAMR per 100,000 Residents, 1999-2023. Temporal trend segments are represented by APC values. (*APC Significant).
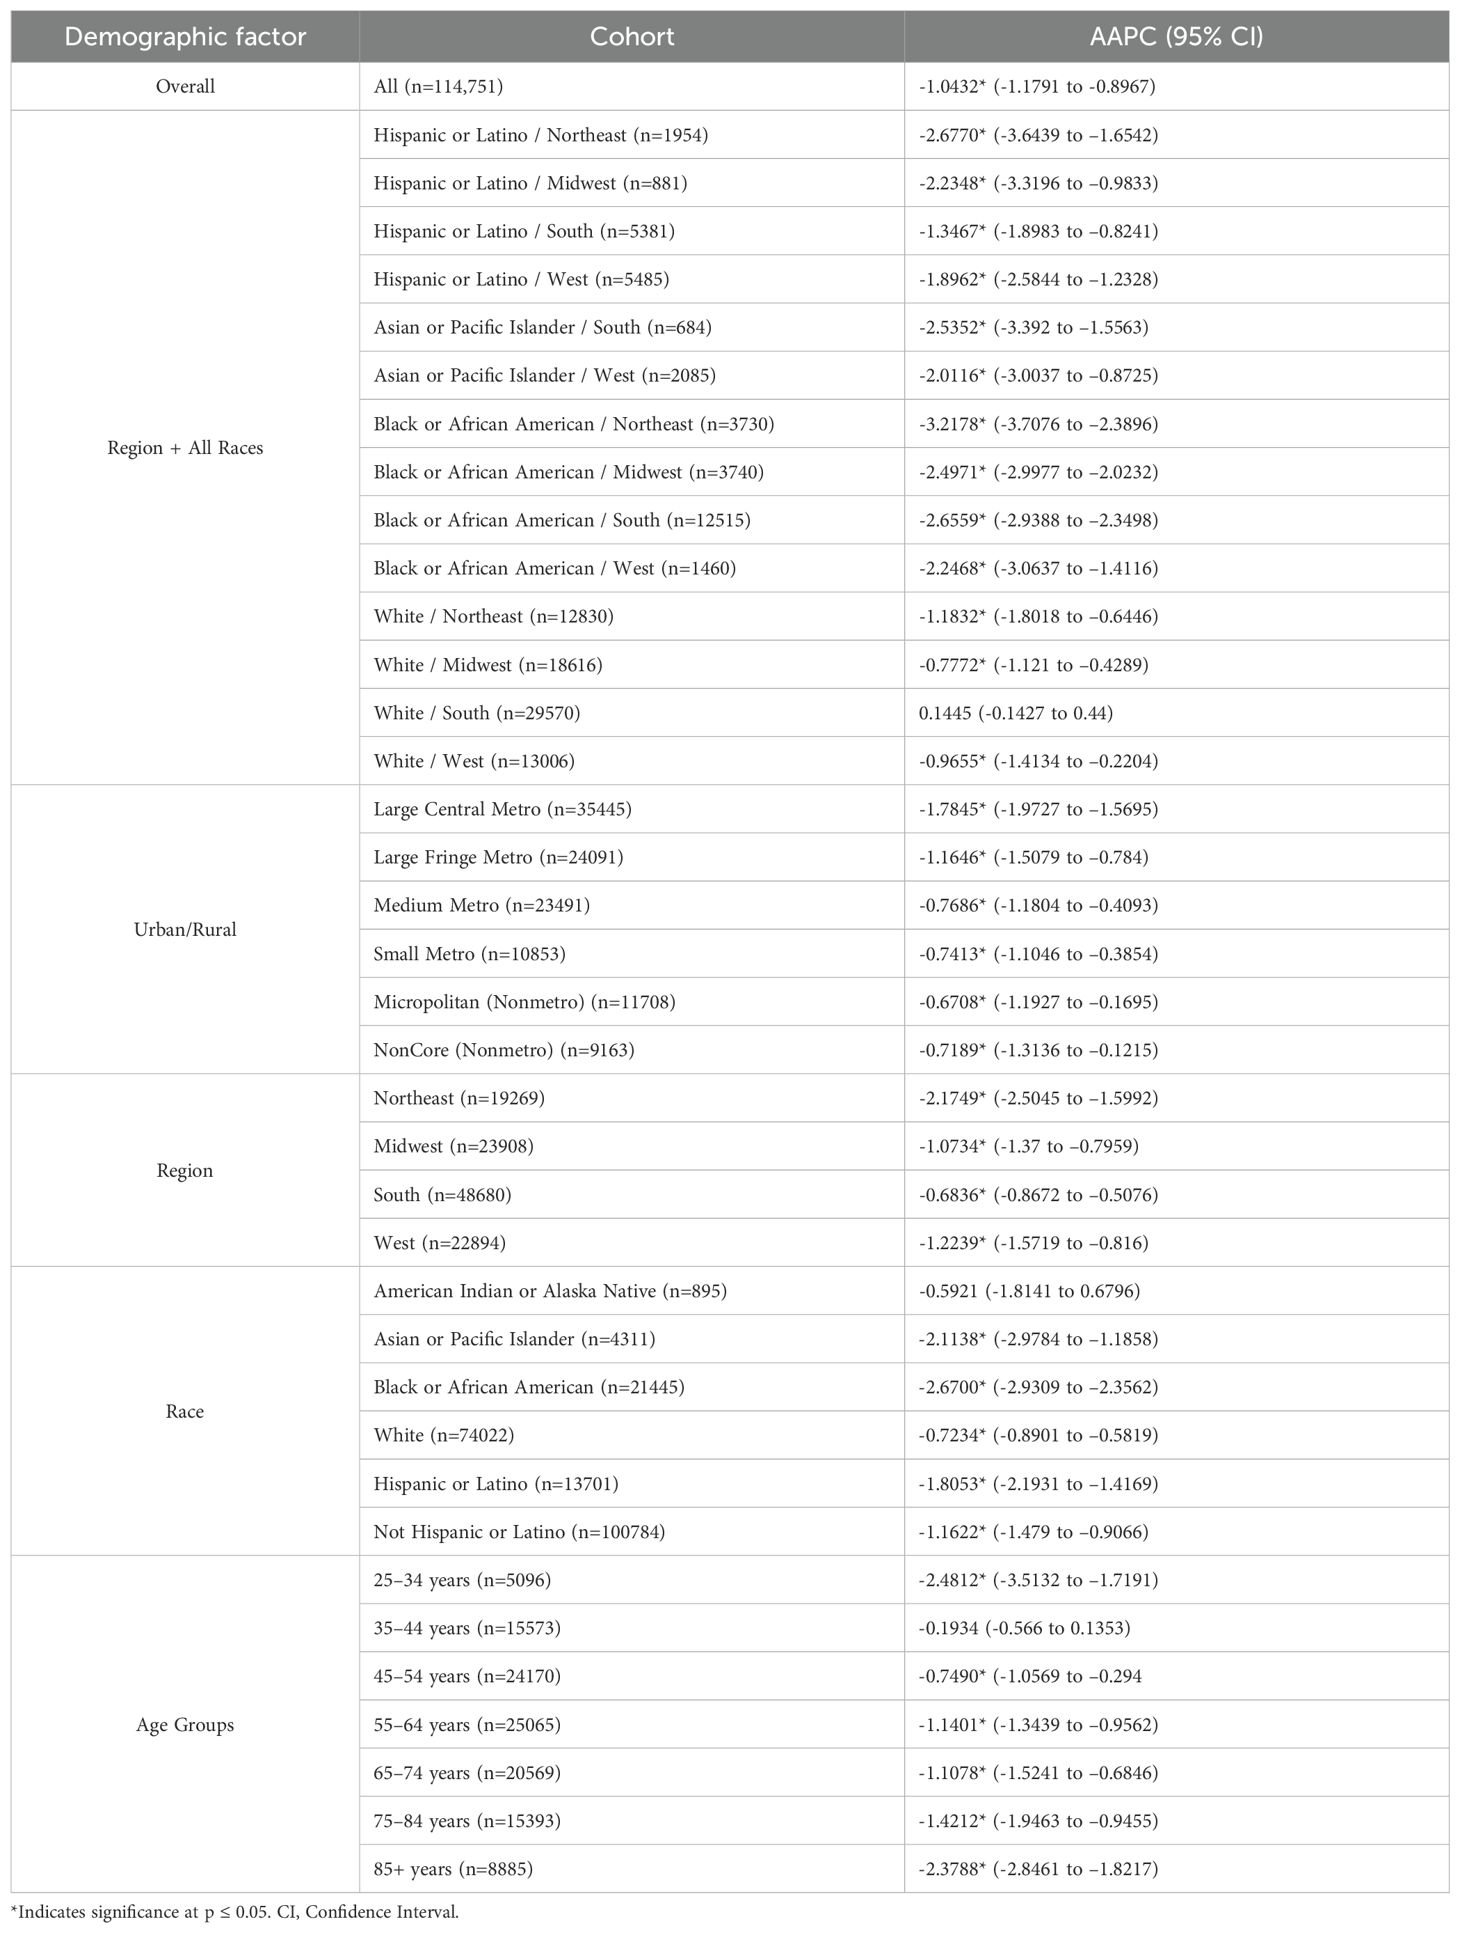
Table 1. Malignant neoplasms of cervix uteri AAPC values of investigated demographic factors.
Race
When the data was stratified by race, the Black or African American population experienced the largest decline in AAMR across the study period, yet this same population consistently had the highest AAMR in comparison to other racial categories (Figure 2). This decline in AAMR is reflected in an AAPC of -2.670* (95% CI -2.931 to -2.356) (Table 1), which is the largest AAPC by race. Like the overall trend in data, the declining AAMR for the Black or African American population was steepest between 1999 and 2004 with an APC of -4.413* (95% CI -8.543 to -2.759) (Figure 2). This trend of significant decline continued between 2004 and 2023 with an APC of –2.206* (95% CI –2.486 to –1.297) (Supplementary Table 1). In contrast, the Asian or Pacific Islander population had many of the lowest AAMR values by race across this study period (Figure 2). This population experienced a significant decline in AAMR from 1999 to 2009 with an APC of -4.349* (95% CI -12.868 to -2.164); however, there was no significant decline following 2009 for the rest of the study period (Figure 2, Supplementary Table 1).
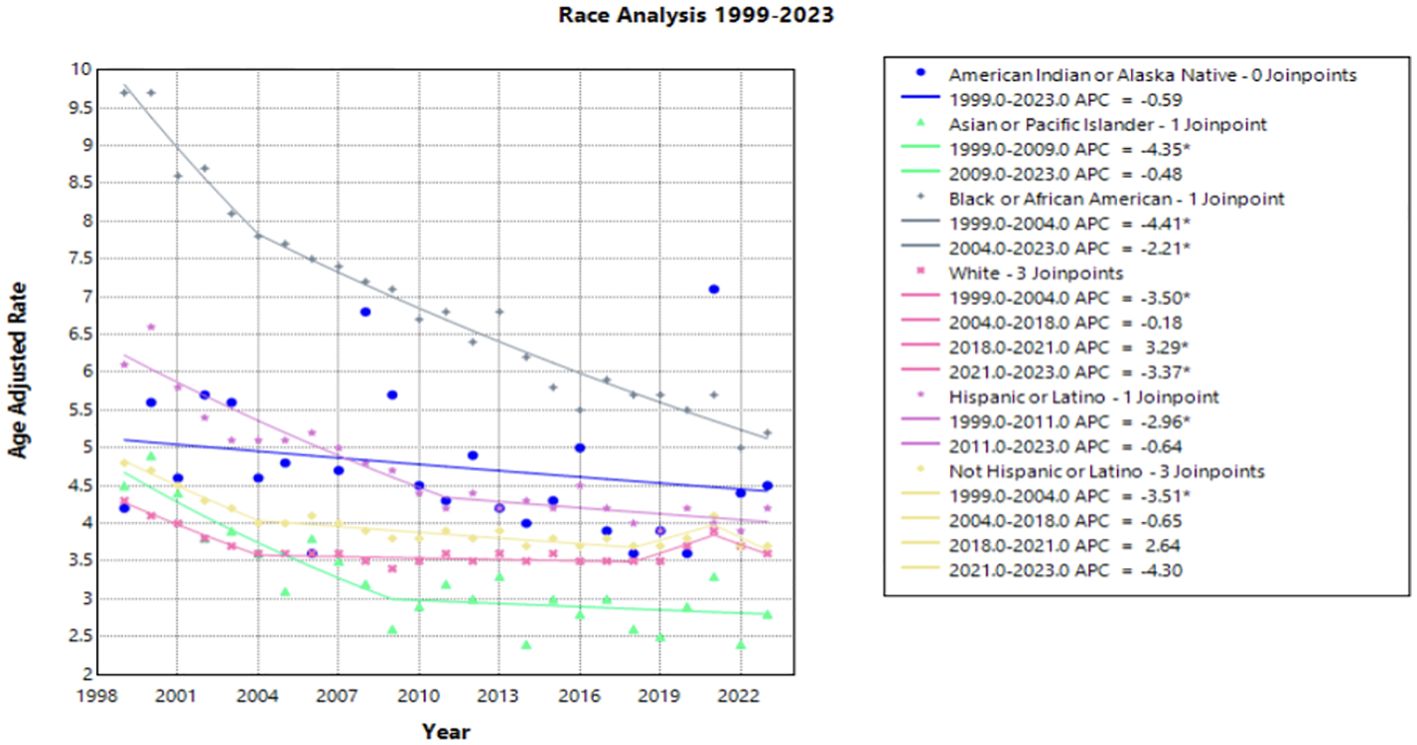
Figure 2. Joinpoint Model of Malignant Neoplasm of Cervix Uteri AAMR per 100,000 Residents by Race, 1999-2023. Temporal trend segments are represented by APC values. (*APC Significant).
The White population experienced both significant declines and significant increases in AAMR over this time interval. Significant declines occurred between 1999 to 2004 and 2021 to 2023 [APC values of -3.498* (95% CI -4.703 to -2.696) and -3.370* (95% CI -0.5449 to -0.862), respectively]. However, from 2018 to 2021, this population experienced a significant increase in AAMR with an APC of 3.286* (95% CI 1.568 to 4.212) (Figure 2). The Hispanic or Latino population experienced a significant decline in AAMR between 1999 and 2011 with an APC of -2.957* (95% CI -5.339 to -2.170), followed by nonsignificant increases and decreases through 2023 [APC of –0.640 (95% CI –1.424 to 1.867] (Figure 2, Supplementary Table 1).
Interestingly, the only group by race that did not have an overall significant AAPC during the study period was the American Indian or Alaska Native population. In fact, there was no period during the timeframe of this study where the American Indian or Alaska Native population experienced a significant decline in AAMR (Figure 2).
Race and region
When stratifying race by region, each subset demonstrates a gradual decline in mortality rate over the time interval. Notably, Black and African American patients in the Northeast held the largest decline in AAMR, with an AAPC of –3.218* (95% CI –3.708 to –2.390) from 1999 to 2023. Hispanic or Latino patients in the Northeast and Black or African American patients in the South followed, with an AAPC of –2.677* (95% CI –3.644 to –1.654) and –2.656* (95% CI –2.939 to -2.350), respectively. All other race by region categories experienced a slight decline in mortality from 1999 to 2023, except for White women in the Midwest, South, and the West, in which the AAPC was less than one representing minimal to no change (Figure 3, Table 1). Black or African American patients in the South, Midwest, and Northeast maintained the highest AAMR across the period analyzed (Figure 3).
Figure 3. Joinpoint Model of Malignant Neoplasm of Cervix Uteri AAMR per 100,000 Residents by Region and Race, 1999-2023. Temporal trend segments are represented by APC values. (*APC Significant).
Urban/Rural
Of the Urban/Rural populations analyzed, most communities experienced a similar trend of a significant decline from 1999 to the 2000’s, ranging from 2003 to 2010, followed by a relative plateau until 2020 (Figure 4). Notably, NonCore (Nonmetro) and Micropolitan (Nonmetro) displayed a positive trend after 2009 and 2010, though not statistically significant [APC values of 0.772 (95% CI -0.328 to 4.888) and 0.986 (95% CI –0.252 to 4.887), respectively] (Figure 4, Supplementary Table 1). The Large Central Metro population demonstrates a rapid decline from 1999 to 2003, followed by smaller, but significant decline until 2020 (Figure 4). This area also showed the largest decline overall with an AAPC of –1.784* (95% CI –1.973 to –1.570) from 1999 to 2020 (Table 1). This analysis is limited to the time frame of 1999 to 2020 due to the availability of CDC WONDER data.
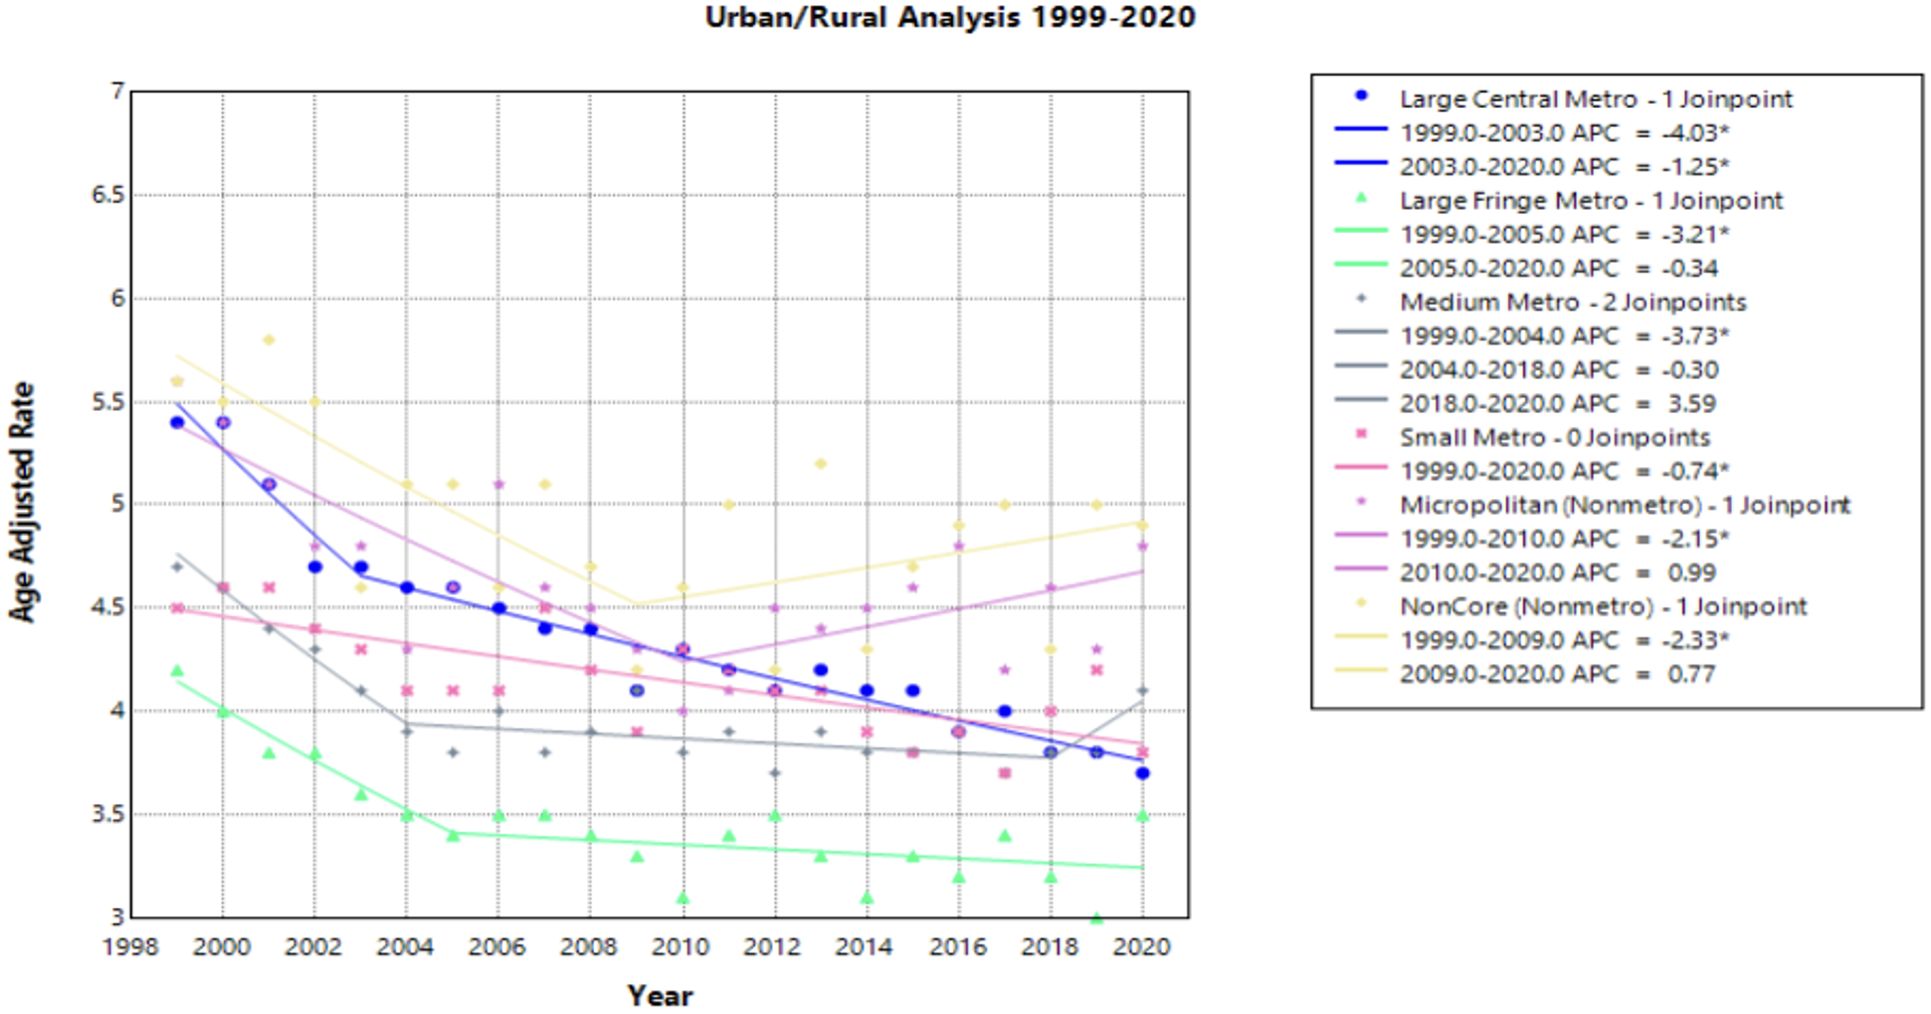
Figure 4. Joinpoint Model of Malignant Neoplasm of Cervix Uteri AAMR per 100,000 Residents by Urban or Rural, 1999-2023. Temporal trend segments are represented by APC values. (*APC Significant).
Census regions
Each census region saw a decline in AAMR from 1999 to 2023, with the Northeast seeing the greatest decline [AAPC of –2.175* (95% CI –2.504 to –1.599)] (Figure 5, Table 1). This region was the only one to experience a continuous significant decline throughout the time interval analyzed. The South demonstrated a significantly negative trend in AAMR until 2009, when the APC became positive at a nonsignificant rate [APC of 0.286 (95% CI –0.061 to 0.772)]. This is the only region to experience a positive APC over the study period. All other regions have a slight decline of similar magnitude followed by a relative plateau until 2023 (Figure 5).
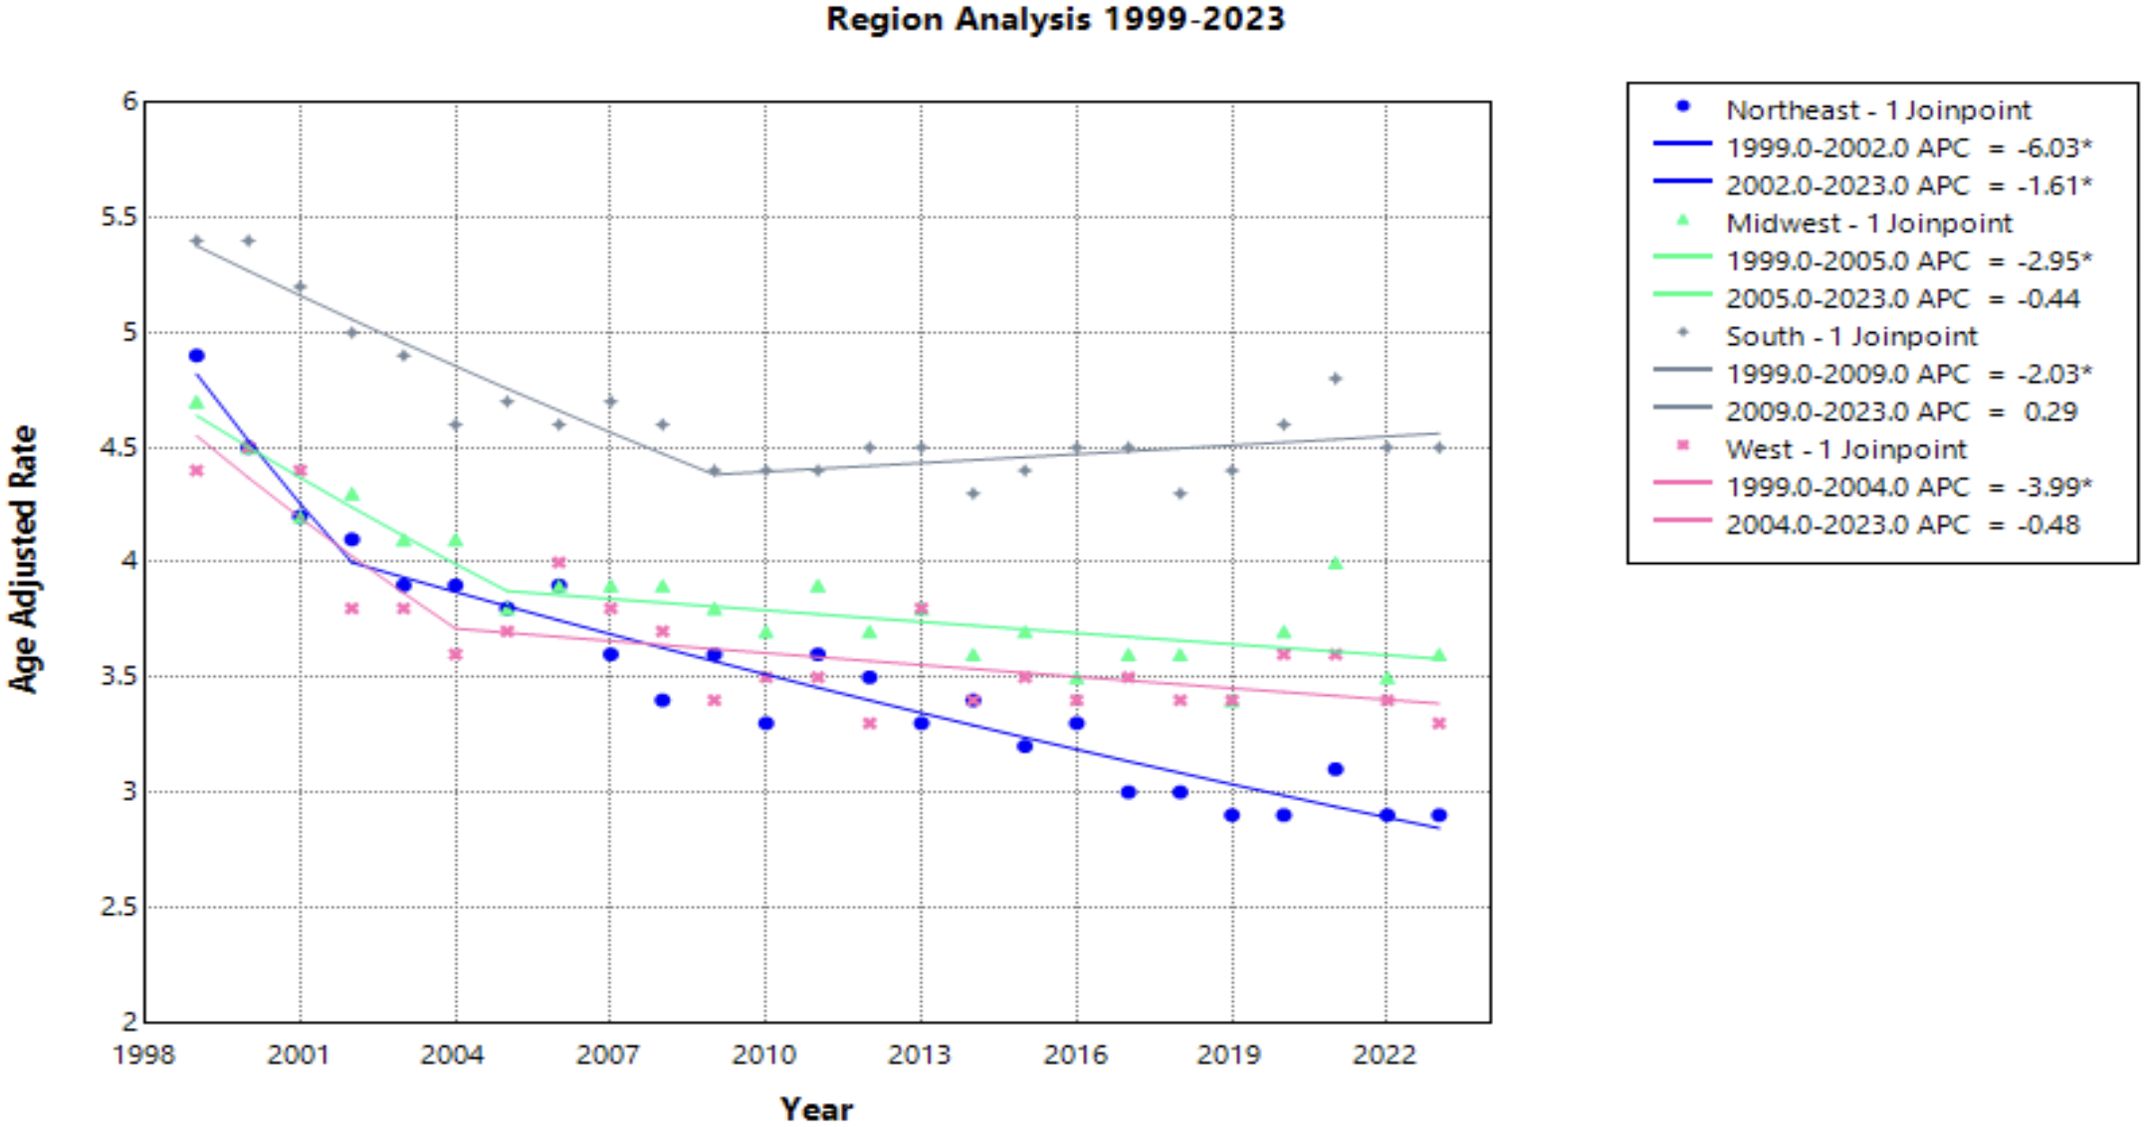
Figure 5. Joinpoint Model of Malignant Neoplasm of Cervix Uteri AAMR per 100,000 Residents by Census Regions, 1999-2023. Temporal trend segments are represented by APC values. (*APC Significant).
Age groups
Progressing age groups demonstrated higher crude mortality rate from 1999 to 2023 (Figure 6, Table 1). Crude mortality rate analysis was conducted on this data as Joinpoint Regression program prevents age adjusted mortality rate on the age group variable. The significance in AAPC values across this demographic variable may be attributed to lower prevalence of cervical cancer in younger age ranges, therefore skewing the statistical analysis. With understanding of low prevalence as a limitation in Joinpoint analysis, this result is not considered relevant to the aim of this study.
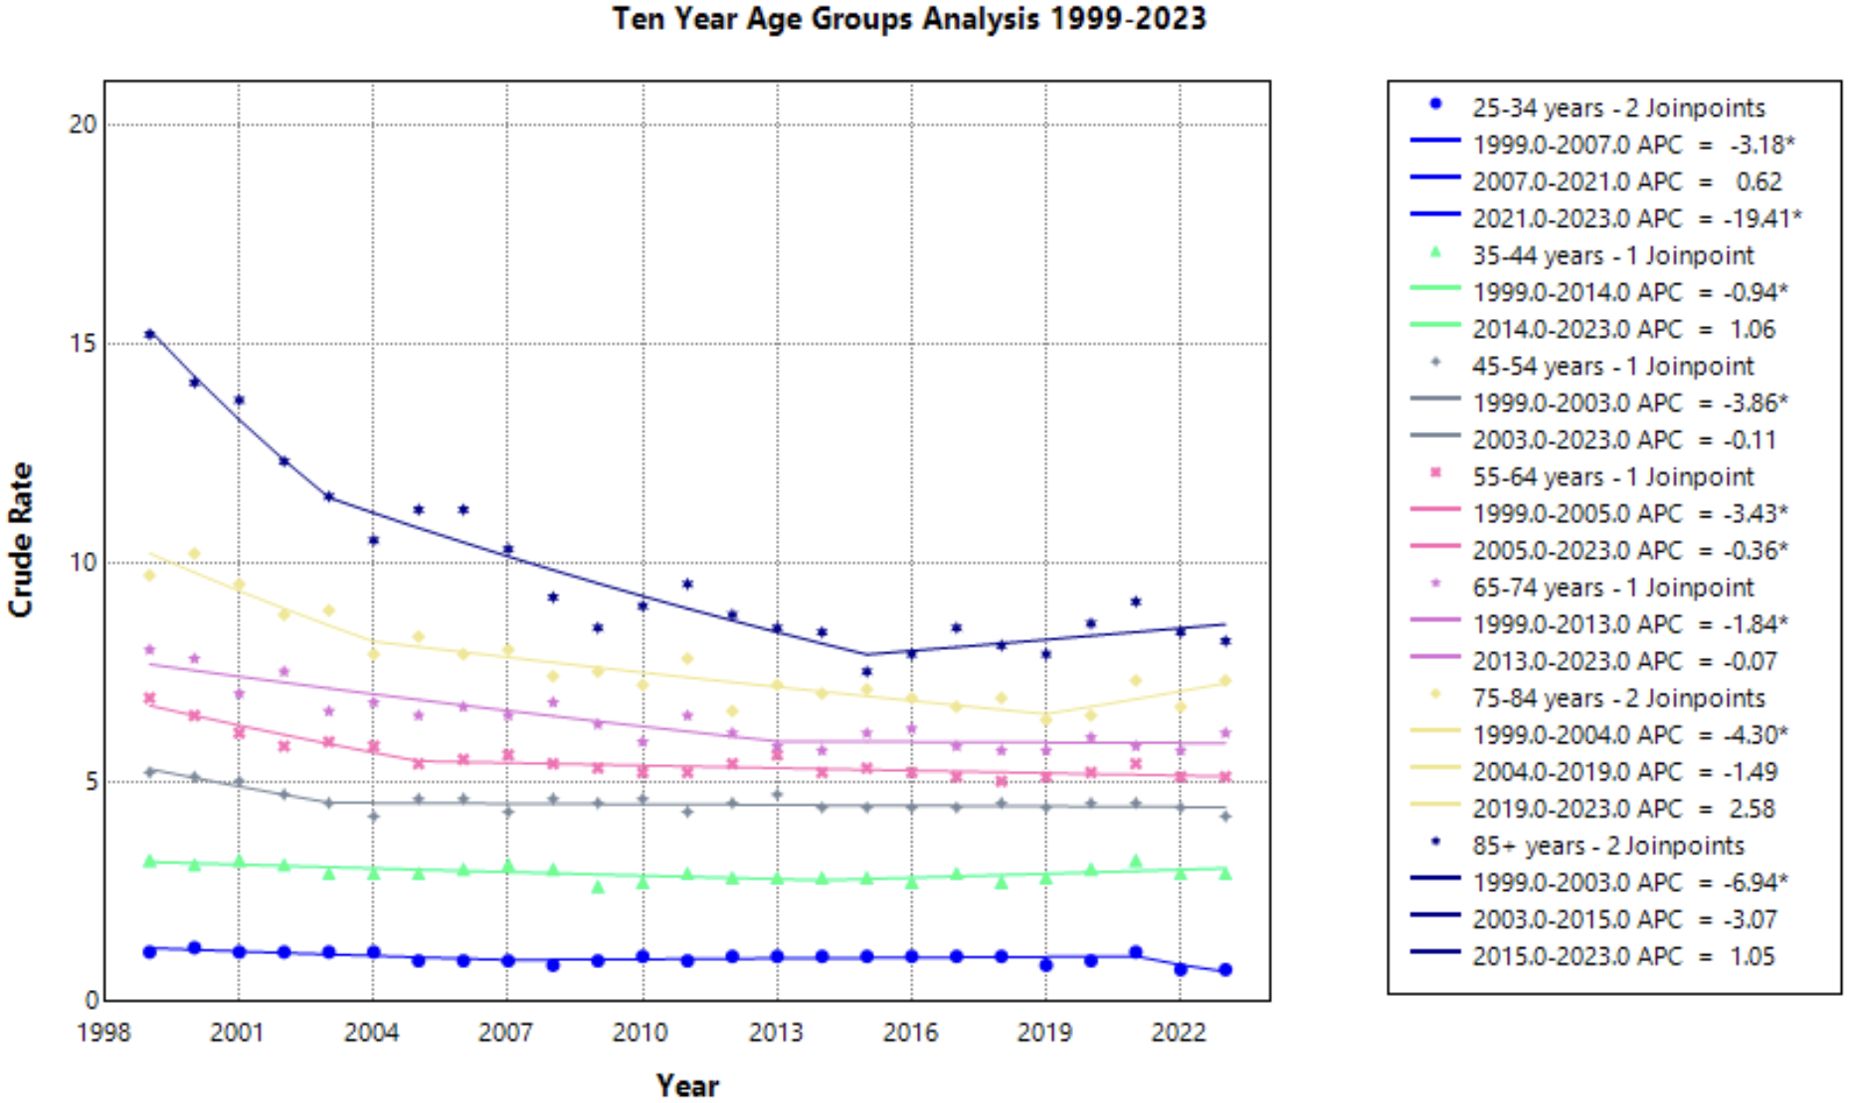
Figure 6. Joinpoint Model of Malignant Neoplasm of Cervix Uteri AAMR per 100,000 Residents by Age Group, 1999-2023. Temporal trend segments are represented by APC values. (*APC Significant).
Discussion
This study analyzed cervical cancer mortality data provided by the CDC WONDER database to determine temporal trends in demographic factors from 1999 to 2023. Overall average annual mortality rates of cervical cancer decreased from 1999 to 2015, with a notable change in the rate of decline from 1999 to 2004 (APC of –3.472; 95% CI –4.808 to –2.690) and 2004 to 2015 (APC of –0.771; 95% CI –1.975 to –0.467) (Figure 1, Supplementary Table 1). The sharp decline prior to 2004 may be due to the previous innovation in screening, as the development of the Pap smear and cytology allowed for detection of cervical cancer at earlier stages (27). The rate may have plateaued in recent years as the current screening tools may attained their efficacious value, indicating that other screening protocols may be needed to further advance early identification. Additionally, efforts to reduce the HPV burden through prophylactic vaccines demonstrated success in the cervical cancer population, but impact on mortality rates will likely be seen in the future (4, 28). Age groups of 25-34, 35-44, and 45–54 years old did not experience a notable decline in mortality (Figure 6). As established in previous literature, the median age for cervical cancer mortality is 60 years old (29). Therefore, it is less likely to see cervical cancer mortality impact these age groups.
Notable differences in cervical cancer mortality were found across racial populations. Black or African American individuals demonstrated significantly higher mortality than any other race each year, apart from 2021 (Figure 2). Previous studies indicate that Black or African American patients may have a higher rate of high-risk HPV positivity and advanced stage cervical cancer at the time of diagnosis, which may contribute to this trend (30–32). In recent years, studies have found that Black or African American patients attain equal or higher levels of cervical cancer screening, a trend that has shifted likely from targeted screening efforts of diverse communities (33–35). However, lower rates of follow up after abnormal Pap smears may contribute to the higher rate of mortality seen in this patient population (32, 33). Lack of follow up could be the consequence of structural, educational, or belief factors towards cervical cancer screening and detection. Previous studies demonstrate that African American, Hispanic, and publicly insured patients missed appointments more frequently than White and privately insured women (34, 36). Additionally, one study found that there was less knowledge among Black women of the characteristics of HPV and its role in cervical cancer (37). Establishing strong patient-provider communication may yield a path to providing education to this patient population. However, Black or African American women have a history of medical mistrust, which perpetuates barriers to receiving reproductive care and education (38, 39). Utilizing methods of culturally competent communication and creating a foundation of trust between patient and provider may assist in increasing education among Black and African American patients and deconstructing barriers to care (37).
In addition, a previous study found that providers who cared for larger proportions of Black patients were significantly more likely to practice in locations, such as community health centers, that were less likely to use liquid-based cytology, an innovation in cervical cancer screening that accounts for many Pap smears conducted in the United States. Other providers in this study who cared for a patient population of more than 25% Black patients and uninsured patients were significantly less likely to use HPV DNA testing (40, 41). Future efforts should be made to improve follow up protocol after an abnormal Pap smear across diverse patient populations to ensure equitable management of cervical cancer. Additionally, measures should be taken to equip providers managing diverse patient populations with adequate screening tools to fully utilize adequate diagnostic care (3).
Regionality and race were analyzed in a single Joinpoint to highlight structural barriers extending between race and region. Black or African American patients in the Northeast experienced the highest mortality in 1999, followed by Black or African American patients in the South after 2001 (Figure 3). Southern states previously reported less cervical cancer screening, which may be a result of lower socioeconomic status, limited healthcare access, and structural racism perpetuating both regional and racial cervical cancer disparities (6, 42). This finding is in accordance with previous studies investigating associations between race and region, where it was suggested that focused community interventions and targeted efforts in the older, Black patient population may reduce cervical cancer mortality (43, 44).
In contrast, the Asian or Pacific Islander communities experienced many of the lowest mortality rates across this timeframe, although demonstrated no significant decline (Figure 2). It should be acknowledged that the classification of Asian and Pacific Islander groups includes diverse subgroups; therefore, the CDC WONDER database may create a generalization of these statistics.
American Indian and Alaskan Native demonstrated a large amount of variance across this timeframe. This may be attributed to inconsistencies and misclassification on death certificates and could impact the data drawn from the CDC WONDER database (45). Training should be made available to providers in the future to correct these misclassifications, as recommended by the Department of Indigenous Health at the University of North Dakota (46).
NonCore (Nonmetro) and Micropolitan (Nonmetro) areas demonstrate a concerning trend towards increasing mortality after 2009 and 2010, respectively, though not statistically significant in this study (Figure 4). This is in accordance with recent literature, which demonstrated high incidence and mortality of cervical cancer in rural areas when compared to urban areas (47). Interestingly, the Southern region of the United States and rural areas (NonCore and Micropolitan) are the only demographic factors to demonstrate increasing mortality APC values after 2009 and 2010 (Figures 4, 5). This could be attributed to socioeconomic factors impacting at-risk areas. One study reported an acceleration of rural hospital closures after 2010, likely from economic factors impacting profitability and staffing resources (48). The impact of rural hospital closure widens the gap to healthcare access in rural settings, perpetuating barriers to receiving both preventative screening and early management of cervical cancer (49–52). One study found that the regions most affected by these closures include rural communities in the East South Central and West South Central (53). Another study found that approximately 9% of women may experience a barrier to gynecologic malignancy care due to a geographic barrier (54). This is not an isolated issue in the United States, as studies have shown lower socioeconomic status and rural communities are less likely to receive a Pap smear and obtain established access to care (55). Distance to care and lack of access to specialty care services may negatively influence the prognosis of cervical cancer patients.
To address disparities in cervical cancer mortality, targeted efforts should be made to reduce barriers to care. Existing infrastructure in the South should be expanded upon to account for the persistently high mortality rate, with focused efforts among Black or African American patients to deconstruct the existing structural racism (56). Additionally, further initiatives to promote screening among underserved patients can reduce mortality through early identification. Studies demonstrate that programs such as HPV self-collection can increase cervical cancer screening among under screened patient populations (57–60). Furthermore, additional support for patients traveling to care centers and establishing gynecologic oncologist in rural settings may address the healthcare disparity experienced by rural patients (61–63). Existing healthcare centers should continue to focus efforts on building patient-provider relationships and forming strong communication to establish trust among all patient populations.
This study is limited by the reported data to CDC WONDER database, which may not fully represent the cervical cancer population and the individual factors impacting cervical cancer disparities. Additionally, this study examined all-cause mortality with malignant neoplasm of the cervix uteri rather than cervical cancer specific mortality. Analysis of age groups is limited to crude mortality by the Joinpoint regression program. Race and region analysis was limited by insufficient data provided by the CDC WONDER database.
Conclusion
This study identifies temporal trends in cervical cancer across demographic factors from 1999 to 2023. The stark decrease in cervical cancer mortality has plateaued in recent years, which may indicate that previous innovation in screening has begun to reach its efficacious potential. Continued development of new screening techniques may address the slowing decline of mortality among the cervical cancer population. Variance of mortality rates demonstrates that the benefit experienced by the innovation in cervical cancer prevention and treatment is not equally shared across different populations. Black or African American patients, the Southern population, and rural communities are experiencing greater mortality, with a concerning turn towards an increasing mortality potentially as the result of barriers to care. These regional and racial disparities emphasize the crucial need for equitable screening and population-based research to guide protocols specific to diverse patient populations. The temporal trends highlighted in this study may be used as a guide to influence future studies and efforts in cervical cancer screening and prevention.
Data availability statement
Publicly available datasets were analyzed in this study. This data can be found here: https://wonder.cdc.gov/mcd.html.
Ethics statement
Ethical approval was not required for the study involving humans in accordance with the local legislation and institutional requirements. Written informed consent to participate in this study was not required from the participants or the participants’ legal guardians/next of kin in accordance with the national legislation and the institutional requirements.
Author contributions
GF: Conceptualization, Data curation, Investigation, Supervision, Visualization, Writing – original draft, Writing – review & editing. IZ: Data curation, Investigation, Visualization, Writing – original draft, Writing – review & editing. LE: Data curation, Investigation, Visualization, Writing – original draft, Writing – review & editing. VM: Writing – review & editing, Conceptualization, Data curation, Formal analysis, Investigation, Methodology, Project administration, Supervision, Visualization, Writing – original draft. TB: Methodology, Supervision, Writing – original draft, Writing – review & editing. AA: Methodology, Supervision, Writing – original draft, Writing – review & editing. MM: Methodology, Supervision, Writing – original draft, Writing – review & editing. AT: Methodology, Supervision, Writing – original draft, Writing – review & editing.
Funding
The author(s) declare that no financial support was received for the research and/or publication of this article.
Conflict of interest
The authors declare that the research was conducted in the absence of any commercial or financial relationships that could be construed as a potential conflict of interest.
Generative AI statement
The author(s) declare that no Generative AI was used in the creation of this manuscript.
Publisher’s note
All claims expressed in this article are solely those of the authors and do not necessarily represent those of their affiliated organizations, or those of the publisher, the editors and the reviewers. Any product that may be evaluated in this article, or claim that may be made by its manufacturer, is not guaranteed or endorsed by the publisher.
Supplementary material
The Supplementary Material for this article can be found online at: https://www.frontiersin.org/articles/10.3389/fonc.2025.1567305/full#supplementary-material
References
1. American Cancer Society. Cervical cancer statistics(2025). Available online at: https://www.cancer.org/cancer/types/cervical-cancer/about/key-statistics.html (Accessed June 9, 2025).
2. Petry KU. HPV and cervical cancer. Scand J Clin Lab Invest. (2014) 74:59–62. doi: 10.3109/00365513.2014.936683
3. ACOG. Updated cervical cancer screening guidelines(2021). Available online at: https://www.acog.org/clinical/clinical-guidance/practice-advisory/articles/2021/04/updated-cervical-cancer-screening-guidelines (Accessed June 9, 2025).
4. Guo F, Cofie LE, and Berenson AB. Cervical cancer incidence in young U.S. Females after human papillomavirus vaccine introduction. Am J Prev Med. (2018) 55:197–204. doi: 10.1016/j.amepre.2018.03.013
5. Gopalani SV, Janitz AE, and Campbell JE. Cervical cancer incidence and mortality among non-hispanic African American and white women, United States, 1999–2015. J Natl Med Assoc. (2020) 112:632–8. doi: 10.1016/j.jnma.2020.06.007
6. Buskwofie A, David-West G, and Clare CA. A review of Cervical Cancer: Incidence and disparities. J Natl Med Assoc. (2020) 112:229–32. doi: 10.1016/j.jnma.2020.03.002
7. Ward KK, Shah NR, Saenz CC, McHale MT, Alvarez EA, and Plaxe SC. Changing demographics of cervical cancer in the United States (1973–2008). Gynecol Oncol. (2012) 126:330–3. doi: 10.1016/j.ygyno.2012.05.035
8. Tota JE, Isidean SD, and Franco EL. Defining benchmarks for tolerable risk thresholds in cancer screening: Impact of HPV vaccination on the future of cervical cancer screening. Int J Cancer. (2020) 147:3305–12. doi: 10.1002/ijc.33178
9. Sheppard CS, El-Zein M, Ramanakumar AV, Ferenczy A, and Franco EL. Assessment of mediators of racial disparities in cervical cancer survival in the United States. Int J Cancer. (2016) 138:2622–30. doi: 10.1002/ijc.29996
10. Del Carmen MG, Montz FJ, Bristow RE, Bovicelli A, Cornelison T, and Trimble E. Ethnic differences in patterns of care of Stage 1A1 and Stage 1A2 cervical cancer: a SEER Database study. Gynecol Oncol. (1999) 75:113–7. doi: 10.1006/gyno.1999.5543
11. Watson M, Saraiya M, Benard V, Coughlin SS, Flowers L, Cokkinides V, et al. Burden of cervical cancer in the United States, 1998–2003. Cancer. (2008) 113:2855–64. doi: 10.1002/cncr.23756
12. Horner MJ, Altekruse SF, Zou Z, Wideroff L, Katki HA, and Stinchcomb DG. U.S. geographic distribution of prevaccine era cervical cancer screening, incidence, stage, and mortality. Cancer Epidemiol Biomarkers Prev. (2011) 20:591–9. doi: 10.1158/1055-9965.epi-10-1183
13. Benard VB, Watson M, Saraiya M, Harewood R, Townsend JS, Stroup AM, et al. Cervical cancer survival in the United States by race and stage (2001–2009): Findings from the CONCORD-2 study. Cancer. (2017) 123:5119–37. doi: 10.1002/cncr.30906
14. Amboree TL, Damgacioglu H, Sonawane K, Adsul P, Montealegre JR, and Deshmukh AA. Recent trends in cervical cancer incidence, stage at diagnosis, and mortality according to county-level income in the United States, 2000–2019. Int J Cancer. (2024) 154:1549–55. doi: 10.1002/ijc.34860
15. Liao CI, Francoeur AA, Kapp DS, Caesar MAP, Huh WK, and Chan JK. Trends in human papillomavirus–associated cancers, demographic characteristics, and vaccinations in the US, 2001–2017. JAMA Netw Open. (2022) 5:e222530. doi: 10.1001/jamanetworkopen.2022.2530
16. Pruitt SL and Schootman M. Geographic disparity, area poverty, and human papillomavirus vaccination. Am J Prev Med. (2010) 38:525–33. doi: 10.1016/j.amepre.2010.01.018
17. Doddi S, Salichs O, Mushuni M, and Kunte S. Demographic disparities in trend of gynecological cancer in the United States. J Cancer Res Clin Oncol. (2023) 149:11541–7. doi: 10.1007/s00432-023-05030-4
18. CDC WONDER. (2024). Available online at: https://wonder.cdc.gov/ (Accessed October 11, 2024).
19. Wang Y, Huang Y, Antwi SO, Taner CB, and Yang L. Racial disparities in liver disease mortality trends among Black and White populations in the United States, 1999–2020: an analysis of CDC WONDER database. Am J Gastroenterol. (2023) 119:682–9. doi: 10.14309/ajg.0000000000002561
20. Ghazwani Y, Alghafees M, Suheb MK, Shafqat A, Sabbah BN, Arabi TZ, et al. Trends in genitourinary cancer mortality in the United States: analysis of the CDC-WONDER database 1999–2020. Front Public Health. (2024) 12:1354663. doi: 10.3389/fpubh.2024.1354663
21. Ingram DD and Franco SJ. NCHS urban–rural classification scheme for counties. National Center for Health Statistics. Vital Health Stat. (2013) 2014):2(166).
22. U.S. Census Bureau, Geography Division. Census regions and divisions of the United States. U.S. Department of Commerce Economics and Statistics Administration. Available at: https://www2.census.gov/geo/pdfs/maps-data/maps/reference/us_regdiv.pdf. (Accessed January 15, 2025)
23. Anderson RN and Rosenberg HM. Age standardization of death rates: implementation of the year 2000 standard. Natl Vital Stat Rep. (1998) 47:1–16.
24. Baral N, Jabbar ABA, Noor A, Mirza M, DeVrieze B, Hildenbrand A, et al. Demographic and geographical trends in chronic lower respiratory diseases mortality in the United States, 1999 to 2020. Respir Res. (2024) 25:258. doi: 10.1186/s12931-024-02880-5
25. Shah MDA, Ibarra S, Ali H, and Khan ZH. Trends in mortality among older adults with esophageal carcinoma in the United States: A CDC WONDER database analysis. Am J Gastroenterol. (2024) 119:S493. doi: 10.14309/01.ajg.0001032212.54030.31
26. Rahman HAU, Fahim MAA, Salman A, Kumar S, Raja A, Raja S, et al. Investigating gender, race, and geographic disparities in bronchus and lung cancer mortality in the United States: a comprehensive longitudinal study (1999–2020) utilizing CDC WONDER data. Ann Med Surg. (2024) 86:5361–9. doi: 10.1097/ms9.0000000000002387
27. Fontham ETH, Wolf AMD, Church TR, Etzioni R, Flowers CR, Herzig A, et al. Cervical cancer screening for individuals at average risk: 2020 guideline update from the American Cancer Society. CA Cancer J Clin. (2020) 70:321–46. doi: 10.3322/caac.21628
28. Luckett R and Feldman S. Impact of 2-, 4- and 9-valent HPV vaccines on morbidity and mortality from cervical cancer. Hum Vaccin Immunother. (2015) 12:1332–42. doi: 10.1080/21645515.2015.1108500
29. SEER*Explorer. An interactive website for SEER cancer statistics. Surveillance Research Program, National Cancer Institute(2025). Available online at: https://seer.cancer.gov/statistics-network/explorer/. Data source(s): SEER Incidence Data, November 2024 Submission (1975-2022), SEER 21 registries. (Accessed June 10, 2025).
30. Bansal M and Zhao C. Prevalence of high-risk human papillomavirus in women with abnormal and normal vaginal ThinPrep Papanicolaou cytology. J Low Genit Tract Dis. (2011) 15:105–9. doi: 10.1097/lgt.0b013e3181f41ee4
31. Banister CE, Messersmith AR, Cai B, Spiryda LB, Glover SH, Pirisi L, et al. Disparity in the persistence of high-risk human papillomavirus genotypes between African American and European American women of college age. J Infect Dis. (2014) 211:100–8. doi: 10.1093/infdis/jiu394
32. Holt HK, Peterson CE, David SM, Abdelaziz A, Sawaya GF, Guadamuz JS, et al. Mediation of racial and ethnic inequities in the diagnosis of advanced-stage cervical cancer by insurance status. JAMA Netw Open. (2023) 6:e232985. doi: 10.1001/jamanetworkopen.2023.2985
33. Ford S, Tarraf W, Williams KP, Roman LA, and Leach R. Differences in cervical cancer screening and follow-up for Black and White women in the United States. Gynecol Oncol. (2021) 160:369–74. doi: 10.1016/j.ygyno.2020.11.027
34. Boitano TKL, Ketch P, Maier JG, Nguyen CT, Huh WK, Straughn JM, et al. Increased disparities associated with Black women and abnormal cervical cancer screening follow-up. Gynecol Oncol Rep. (2022) 42:101041. doi: 10.1016/j.gore.2022.101041
35. Maxwell AE, Lucas-Wright A, Santifer RE, Vargas C, Gatson J, and Chang LC. Promoting cancer screening in partnership with health ministries in 9 African American churches in South Los Angeles: an implementation pilot study. Prev Chronic Dis. (2019) 16:190135. doi: 10.5888/pcd16.190135
36. Luckett R, Pena N, Vitonis A, Bernstein MR, and Feldman S. Effect of Patient Navigator program on no-show rates at an academic referral colposcopy clinic. J Womens Health. (2015) 24:608–15. doi: 10.1089/jwh.2014.5111
37. Ojeaga A, Alema-Mensah E, Rivers D, Azonobi I, and Rivers B. Racial disparities in HPV-related knowledge, attitudes, and beliefs among African American and white women in the US. J Cancer Educ. (2020) 34:66–72. doi: 10.1007/s13187-017-1268-6
38. Treder K, White KO, Woodhams E, Pancholi R, and Yinusa-Nyahkoon L. Racism and the reproductive health experiences of U.S.-born black women. Obstet Gynecol. (2022) 139:407–16. doi: 10.1097/AOG.0000000000004675
39. Ho IK, Sheldon TA, and Botelho E. Medical mistrust among women with intersecting marginalized identities: a scoping review. Ethn Health. (2022) 27:1733–51. doi: 10.1080/13557858.2021.1990220
40. Gibb RK and Martens MG. The impact of liquid-based cytology in decreasing the incidence of cervical cancer. Rev Obstet Gynecol. (2011) 4:S2–S11.
41. Hoover K, Koumans EH, Montaño D, Kasprzyk D, Freeman C, Greek A, et al. Access of Black, Hispanic, and nonprivately insured women to liquid-based cytology, human papillomavirus DNA testing, and on-site colposcopy in the United States. J Low Genit Tract Dis. (2009) 13:17–27. doi: 10.1097/LGT.0b013e318194b87e
42. Miller CE and Vasan RS. The southern rural health and mortality penalty: A review of regional health inequities in the United States. Soc Sci Med. (2021) 268:113443. doi: 10.1016/j.socscimed.2020.113443
43. Yoo W, Kim S, Huh WK, Dilley S, Coughlin SS, Partridge EE, et al. Recent trends in racial and regional disparities in cervical cancer incidence and mortality in the United States. PloS One. (2017) 12:e0172548. doi: 10.1371/journal.pone.0172548
44. Scarinci IC, Garcia FAR, Kobetz E, Partridge EE, Brandt HM, Bell MC, et al. Cervical cancer prevention: New tools and Old Barriers. Cancer. (2011) 116:2531–42. doi: 10.1002/cncr.25065
45. Arias E, Xu J, Curtin S, Bastian B, and Tejada-Vera B. Mortality profile of the non-hispanic American Indian or Alaska native population, 2019. Natl Vital Stat Rep. (2021) 70:1–27.
46. Nadeau M, Colbert-Lyon A, Carter M, Manuelito K, Belgarde M, and Martin R. Racial misclassification of American Indian and Alaskan natives on death certificates in the United States: report for national network of public health institutes. Am J Public Health. (2014) 104 Suppl 3:S295–302. doi: 10.2105/AJPH.2014.301933
47. Amboree TL, Damgacioglu H, Chiao EY, Schmeler KM, Sonawane K, Deshmukh AA, et al. Rural-urban disparities in cervical cancer incidence and mortality among US women. JAMA Netw Open. (2025) 8:e2462634. doi: 10.1001/jamanetworkopen.2024.62634
48. Kaufman BG, Thomas SR, Randolph RK, Perry JR, Thompson KW, Holmes GM, et al. The rising rate of rural hospital closures. J Rural Health. (2016) 32:35–43. doi: 10.1111/jrh.12128
49. Moss JL, Liu B, and Feuer EJ. Urban/rural differences in breast and cervical cancer incidence: the mediating roles of socioeconomic status and provider density. Womens Health Issues. (2017) 27:683–91. doi: 10.1016/j.whi.2017.09.008
50. Steele EM, Robertson SE, and Holmes JA. Distance from cancer facility as a barrier to timely treatment among patients with non-metastatic cervical cancer. Eur J Gynecol Oncol. (2024) 45:24–33. doi: 10.22514/ejgo.2024.091
51. Sauer AG, Bandi P, Saslow D, Islami F, Jemal A, and Fedewa SA. Geographic and sociodemographic differences in cervical cancer screening modalities. Prev Med. (2020) 33:106014. doi: 10.1016/j.ypmed.2020.106014
52. Yu L, Sabatino SA, and White MC. Rural-urban and racial/ethnic disparities in invasive cervical cancer incidence in the United States, 2010-2014. Prev Chronic Dis. (2019) 16:E70. doi: 10.5888/pcd16.180447
53. McCarthy S, Moore D, Smedley WA, Crowley BM, Stephens SW, Griffin RL, et al. Impact of rural hospital closures on health-care access. J Surg Res. (2021) 258:170–8. doi: 10.1016/j.jss.2020.08.055
54. Shalowitz DI, Vinograd AM, and Giuntoli RL 2nd. Geographic access to gynecologic cancer care in the United States. Gynecol Oncol. (2015) 138:115–20. doi: 10.1016/j.ygyno.2015.04.025
55. Singh GK, Azuine RE, and Siahpush M. Global inequalities in cervical cancer incidence and mortality are linked to deprivation, low socioeconomic status, and human development. Int J MCH AIDS. (2012) 1:17–30. doi: 10.21106/ijma.12
56. Yearby R, Clark B, and Figueroa JF. Structural racism in historical and modern US health care policy. Health AFF (Millwood). (2022) 41:187–94. doi: 10.1377/hlthaff.2021.01466
57. Arbyn M, Smith SB, Temin S, Sultana F, and Castle P. Collaboration on Self-Sampling and HPV Testing. Detecting cervical precancer and reaching underscreened women by using HPV testing on self samples: updated meta-analyses. BMJ. (2018) 363:k4823. doi: 10.1136/bmj.k4823
58. Fullerton MM, Ford C, D’Silva C, Chiang B, Onobrakpor SI, Dievert H, et al. HPV self-sampling implementation strategies to engage under screened communities in cervical cancer screening: a scoping review to inform screening programs. Front Public Health. (2024) 12:1430968. doi: 10.3389/fpubh.2024.1430968
59. Reiter PL, Shoben AB, Cooper S, Ashcraft AM, McKim Mitchell E, Dignan M, et al. A mail-based HPV self-collection program to increase cervical cancer screening in appalachia: results of a group randomized trial. Cancer Epidemiol Biomarkers Prev. (2025) 34:159–65. doi: 10.1158/1055-9965.EPI-24-0999
60. Montealegre JR, Hilsenbeck SG, Bulsara S, Parker SL, Amboree TL, Anderson ML, et al. Self-collection for cervical cancer screening in a safety-net setting: the PRESTIS randomized clinical trial. JAMA Intern Med. (2025):e252971. doi: 10.1001/jamainternmed.2025.2971
61. Barrington DA, Dilley SE, Landers EE, Thomas ED, Boone JD, Straughn JM Jr, et al. Distance from a Comprehensive Cancer Center: A proxy for poor cervical cancer outcomes? Gynecol Oncol. (2016) 143:617–21. doi: 10.1016/j.ygyno.2016.10.004
62. Swayze EJ, Strzyzewski L, Avula P, Zebolsky AL, and Hoekstra AV. The impact of expanding gynecologic oncology care to ovarian cancer patients in small cities and rural communities. Gynecol Oncol. (2021) 161:852–7. doi: 10.1016/j.ygyno.2021.04.021
63. Speed LP, Brewster WR, Varia MA, Weinberger M, Baggett C, Zhou X, et al. Examining Urban and Rural Differences in How Distance to care Influences the Initiation and Completion of Treatment among Insured Cervical Cancer Patients. Cancer Epidemiol Biomarkers Prev. (2019) 28:882–9. doi: 10.1158/1055-9965.EPI-18-0945
Keywords: CDC WONDER, cervical cancer, HPV, demographics, health disparities
Citation: Folino G, Zent I, Eason L, Murugan V, Billion T, Abdul Jabbar AB, Mirza M and Tauseef A (2025) Temporal trends of cervical cancer demographics: a CDC WONDER database study. Front. Oncol. 15:1567305. doi: 10.3389/fonc.2025.1567305
Received: 27 January 2025; Accepted: 19 June 2025;
Published: 18 July 2025.
Edited by:
Mona Pathak, University of North Texas Health Science Center, United StatesReviewed by:
Atar Singh Kushwah, Icahn School of Medicine at Mount Sinai, United StatesRajat Sanker Roy Biswas, Chattagram Maa-O-Shishu Hospital Medical College, Bangladesh
Copyright © 2025 Folino, Zent, Eason, Murugan, Billion, Abdul Jabbar, Mirza and Tauseef. This is an open-access article distributed under the terms of the Creative Commons Attribution License (CC BY). The use, distribution or reproduction in other forums is permitted, provided the original author(s) and the copyright owner(s) are credited and that the original publication in this journal is cited, in accordance with accepted academic practice. No use, distribution or reproduction is permitted which does not comply with these terms.
*Correspondence: Grace Folino, Z3JhY2Vmb2xpbm9AY3JlaWdodG9uLmVkdQ==
†These authors have contributed equally to this work